What is a Walkable Place? The Walkability Debate in Urban ...

1
Walkability Assessment for the Urban Environment
Lisbon Case Study
Luis Maria José de Mello
Extended Abstract
Thesis to obtain the Master of Science Degree in
Civil Engineering
Supervisor: Prof. Filipe Manuel Mercier Vilaça e Moura
Examination Committee
Chairperson: Prof. João Torres de Quinhones Levy
Supervisor: Prof. Filipe Manuel Mercier Vilaça e Moura
Member: Prof. Ana dos Santos Morais e Sá
September 2015
2
ABSTRACT
Whether you live in a city or a small town, and whether you drive a car, take the bus or ride a
train, at some point in the day, everyone is a pedestrian. Many factors are linked to what makes an
environment pedestrian friendly: built environment, weather and even crime rate, to mention a few
aspects. Walking also brings many benefits such as of health problems and the reduction of pollution.
Turning cities into more walkable spaces and more pedestrian orientated is of very high importance.
Walkability assessment is a way to measure if an urban environment is pedestrian friendly. Many
studies are addressing this concept, although it is not recent. A large number of experts consider that it is
possible to assess walkability by analyzing built environment. This dissertation follows this approach.
As part of the IAAPE project (Indicators of accessibility and attractiveness of pedestrian
environments), this dissertation aims to contribute to the GIS-based framework to assess walkability, by
proposing a set of indicators and value functions to quantify all the dimensions of walkability. To do so,
the main objective is to collect as much information regarding indicators related to walkability as possible,
normalize their values and couple them in the IAAPE framework.
The main conclusions were that different pedestrian groups (adult, children, elderly, impaired)
would choose different indicators for the several dimensions of walkability analyzed according to the 7
C’s (connectivity, convenience, comfort, conviviality, conspicuousness, coexistence and commitment) and
that these would be different depending on the type of trip motive, i.e., leisure or utilitarian. The choice
and transformation of indicators is critical in the procedure, due to different aspects: availability of
databases, possibility of street auditing, and possibility to calibrate the value functions for normalization.
The model was applied to a case study in Lisbon, Portugal. The chosen area was Arroios, where
urban design features are diversified. The results suggest that this methodology is transferable but further
research should be done to refine the model, for instance regarding the scales using for the indicators and
the value functions for normalization.
Keywords: Walkability, pedestrians, multicriteria assessment, Delphi, indicators
Introduction
3
As the U.S. Secretary of Transportation, Anthony Foxx, once said “Whether you live in a city or a
small town, and whether you drive a car, take the bus or ride a train, at some point in the day, everyone is
a pedestrian”. Pedestrian walking quality should therefore be a top priority for governments.
Walking is also associated with a very large number of benefits not only to the active person but
also to the community: it reduces pollution emissions, reduces obesity related health problems and
creates more “livable communities” (Cambra, 2012; Coffee, Howard, Paquet, Hugo, & Daniel, 2013; Frank
et al., 2006; Park, 2008).
Although Humans have started walking long before we started driving, there are currently more
studies on how to assess motorized vehicles quality of circulation than pedestrians’. However in more
recent years, a very large number of studies have been done on walkability. Walkability is simply how
pedestrian friendly is the environment (Abley, Turner, & Singh, 2011). Although this concept has a
relatively simple definition, measuring walkability is not short of a very complex problem. Most experts
use built environment to assess and measure how pedestrian friendly the environment is.
This dissertation is part of the IAAPE project – Indicators of Accessibility and Attractiveness of the
Pedestrian Environment (http://www.iaape.org). The concept behind the IAAPE project is to innovate the
methodology for walkability assessment in urban environments by using an analytical framework based
on GIS (Geographic Information Systems), making a further validation of the results obtained by analyzing
case studies. This tool targets local authorities (Municipalities) as principal users that can analyze the
impact of urban planning policies on the walkability performance of their cities. IAAPE builds upon the
work by Cambra (2012).
The main objective for this work is to contribute to IAAPE’s GIS-based framework to assess
walkability, by proposing a set of indicators and value functions to quantify all the dimensions of
walkability. Pedestrians are divided into groups of citizens (adult, children, elderly and impaired) and
travel motives (utilitarian and leisure). As such, the majority of users of the network are represented for
the major two types of travel motives. In order to measure walkability, built environment will be assessed.
To do so, the challenging endeavor was to collect as much information regarding indicators
related to walkability, as possible, normalize their values with value functions and couple them in the
IAAPE framework.
Theoretical Framework
Walkability has become one of the biggest concerns for town planners and is now the basis of a
sustainable city (Ariffin & Zahari, 2013). Walkability can be defined as “the extent to which characteristics
4
of the built environment and land use may or may not be conductive to residents in the area walking for
either leisure, exercise or recreation, to access services, or to travel to work” (Leslie et al., 2007). Although
in the more recent years there has been a surge in Walkability studies there is still no consensus on how
to measure it. There is a dispersion of concepts and measurement methodologies, the literature is not
consensual on the scale to measure walkability, authors suggest different criteria to analyze and there is
a lack of validation for the methodologies (Cambra, 2012).
Some authors consider different types of walking. Leslie (2007) considers that there are two
types: walking as a mean of transport and walking for recreation. The latter incorporates walking for
exercise, walking for tourism and walking as a leisure activity. The goal of walking as a mean of transport
is getting from an origin to a destination as quickly and as comfortably as possible. Walking as leisure is
an activity in itself. The pedestrian’s goal is not to reach a destination as quick as possible but to enjoy the
trip.
Owen et al. (2007) differentiate walking for transport from walking for leisure and in the scientific
literature some authors divide the population in sectors (S Abley & Consultants, 2010; Owen et al., 2007).
The population was consequently divided into groups (adults, children, elderly and impaired) and into
travel motives (utilitarian and leisure). In order to represent each group, each stakeholder was assigned a
role and was to defend the interests of the group (adults, children, elderly or disabled).
Throughout the modernization of transport technology, where cars became more affordable and
grew exponentially, pedestrian environment has been degraded. The built environment has been pointed
out by experts such as Abley, Turner, & Singh (2011) and Leslie et al. (2007), as the main dimension to
evaluate when looking to score walkability. Other authors, such as Owen et al., (2007) take into account
social and demographic attributes when measuring walkability. In the literature, some authors also
consider other types of indicators to measure walkability such as: weather conditions (Clark et al., 2014),
Doyle & Kelly-Schwartz (2006) suggest that crime rates are very repulsive to walking. However, this paper
will focus on the built environment.
There are two types of indicators to measure walkability: objective and subjective. The first is
based on “immediate reality” and the second on personal perception and opinion. Whenever possible,
objective criteria will be used as advised by several authors (Duncan, et al., 2013; Keast, et al., n.d.; Leslie
et al., 2005; Villanueva et al., 2014)
The works from Park (2008) and Krambeck (2006) are very similar to what is expected to achieve
with this dissertations. Both set out to create a way to measure walkability that could be applied to other
areas. Both succeeded to a certain level. The first created a method, and succeeded to validate it but
would be hard to transfer to other locations due to it characteristics. The second, created a conceptual
model but never applied it. This paper aims to go beyond both these authors.
5
To measure walkability the present research focuses on the 7Cs of walkability proposed by
Cambra (2012)
C1: Connectivity - Is the network accessible?
C2: Convenience - Does it suit its users? Is it functional?
C3: Comfort - How good is the experience?
C4: Conviviality - Is it attractive?
C5: Clarity - Is it easy to navigate?
C6: Coexistence - Is the presence of motorized vehicles disturbing?
C7: Commitment – Is there a concern to do better?
Regarding the 7Cs layout, there was a general agreement, with a clear consensus on the addition
of Coexistence and Commitment to the existing 5C layout (Moura, Cambra, & Gonçalves, 2014).
In order to score walkability, several methods can be found in the literature. Fruin (1971) was the
first to introduce the concept of Level of Service (LOS) to pedestrians. The author scored the environment
from LOS A (best) to LOS F (worst). This method is a qualitative one and has been widely used
(Transportation Research Board, 2000). Abley (2006) considers a weighted average of indicators to score
walkability. This methodology was used.
In order to weigh the criteria used i.e. the indicators, there a several methods that can be used,
some more complex than others. The Analytical Hierarchy Process and the Analytical Network Process are
very commonly used but are very complex (Mikaeil et al., 2013; Vidal et al., 2011; Wey & Chiu, 2013). The
software 1000minds can also be used to weigh the criteria (www.1000minds.com). The software asks the
user to choose between a series of alternatives and ranks the choices between each other, thus creating
a hierarchy for the criteria. The main advantage of PAPRIKA, 1000minds’ software, is its easiness of use.
By choosing between two alternatives the process is therefore much simpler to the user.
Based on the previous literature review, we conclude that there has been a significant effort by
the scientific community to study and develop walkability in order to foster the many advantages of a
more pedestrian friendly environment. As referred before, it brings communities not only health benefits
besides economical positive externalities (Litman, 2003).
Structuring
This work follows IAAPE’s framework. Therefore, whenever possible methods used in the
literature are applied. Otherwise some procedures are suggested based on available information. After
an extensive literature review, a very large number of indicators were found. To use all of these inputs
would be unfeasible as the resources used to measure all of the inputs would be considerable.
Additionally, according to Baker et al.,(2002) the criteria used to measure walkability should be few in
number. Therefore a structuring of the problem had to be made. In order to reduce the number of
indicators, they were first grouped into the 7C’s of walkability presented previously. A group of Experts
from different fields, such as Academia or practitioners, were chosen to give their inputs on which

6
indicators should be used to measure walkability. This group was purposely chosen with different
backgrounds so that all the population aggregates could be represented. A series of guided Delphi sessions
was conducted face to face. To each expert the Dimensions were presented as well as a series of suggested
indicators used to measure walkability. The expert would also be given the chance to propose other
indicators he/she would find relevant. The person chose the indicators they felt were most relevant to
score each dimension. At the end of the sessions, the number of indicators was significantly reduced from
a list of about 200 to 5 indicators per dimension (35 in total).
Subsequently the chosen criteria should be weighted. This is the second part of the Structuring
and was divided into two parts: i) selection of indicators and ii) weighting. To assist on this, a group of
stakeholders was invited. Each individual was attributed a role taking into account the stakeholder’s
background. This would enable each of the users group to have their interests represented.
The session took place in a room with seven posters (one for each dimension of the 7 Cs) with a
description of the dimension and the indicators (i.e., shortlist from the experts). Colored stickers were
given to each stakeholder according to the group they belong to.
In a first round, each participant was given 6 stickers to use on each poster. Stakeholders were
asked to rank the indicators in order of importance. This could be done by putting all of the stickers in just
one indicator, distribute them equally or how the participant choses. The stakeholders were asked to split
into random groups and face one of the posters. The decision not to divide people into the groups they
represent was meant to avoid a biased opinion or participants reaching a consensus before voting. The
stakeholders had limited time and had to rotate between all posters. At the end, the votes were counted
and posters changed to a second round.
In this second round stakeholders were given 28 markers to cast their votes chose without
restrictions, i.e. ultimately, they could allocate all 28 stickers in one indicator or distribute them evenly
along the 7 dimensions (if the stakeholder wished to do so). This round had the intention of verifying that
the dimensions of walkability were not all equally important.
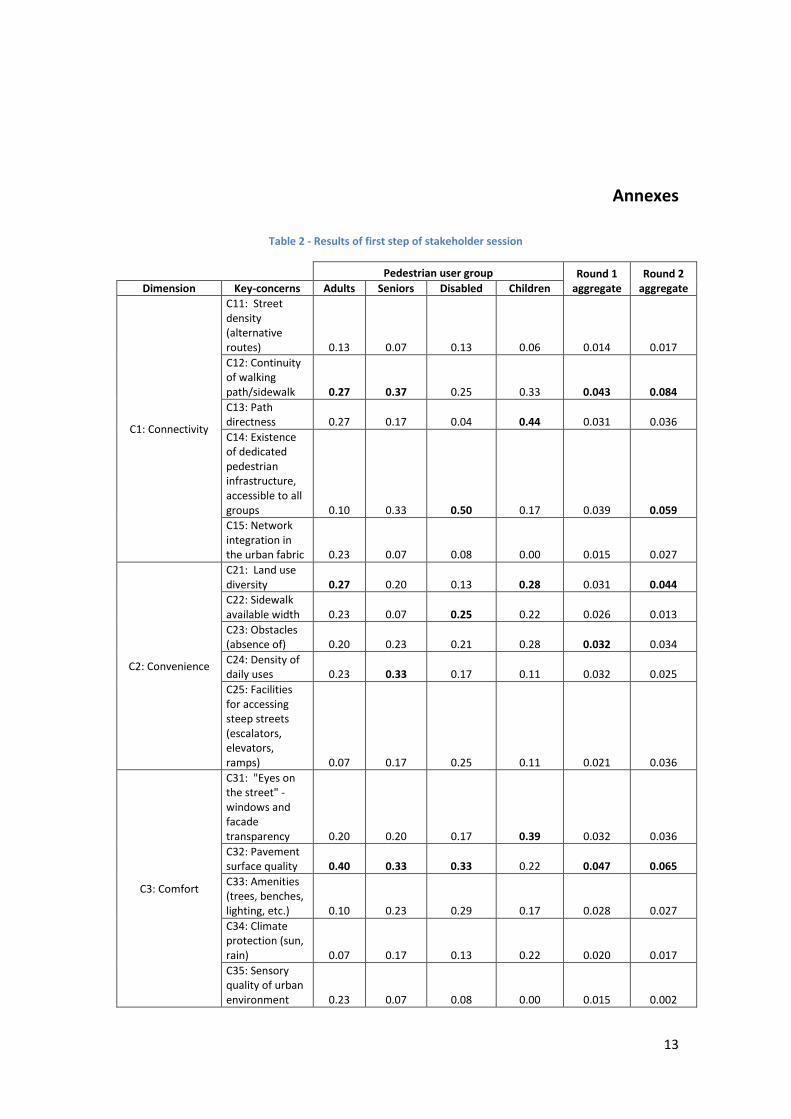
The results of the first round of voting by stakeholder were used for the second step of the
session. One indicator per dimension was chosen, which brought some concern as sometimes indicators
that have been eliminated by during the stakeholders session, were previously selected by experts as the
most important to evaluate the dimension. The results of both sessions can be found the Annex.
These results clearly show that indicators have different degrees of importance for each group.
It confirms the importance of weighting indicators when assessing walkability.
The results obtained on this first step allow us to take a number of observations. The first, as was
pointed out previously is the confirmation that in fact different groups of users have different perceptions
of what is more important to them regarding the built environment. There are some common concerns

7
but there is not a consensual decision on what should be considered more important. By analyzing the
results, it can be observed that the most agreed dimension was comfort and the least was convenience.
The second part of the Structuring, the weighing, took place after. Several methods can be found
in scientific literature to determine weights of indicators in Multi Criteria Decision
AnalysisXXXXXXXXXXXXXXXXXXXXXXXXXXXXXXXXXXXXXXXXXXXXXXXX. After carefully analyzing the pros
and cons of each other, 1000minds was chosen.
1000minds software is very user friendly and has been extensively tested. It presents the user
with two scenarios and asks to choose which he/she would prefer. By asking this question, the software
is able to rank the premises and weigh the criteria. But if the user puts in a high number of criteria, the
questionnaire’s time for completion increases significantly and users tend to get tired and lose focus after
30min. Therefore the decision was to use one indicator per dimension. The indicator chosen was the most
voted by each group for each dimension on phase 1. This can lead to bias results and should, in future
researches, be looked into.
The stakeholders were asked to group according to the pedestrians they were representing and
answer a series of question from 1000minds. Two different sessions were held: one where the
stakeholders were asked to judge their options while walking for utilitarian motives or leisure.
These two Delphi sessions produced different results as shown in the Annex. It can be observed
that there is a clear difference in the weights attributed by the different groups, again confirming that in
fact user groups should be separated. In addition, for each user group, the two types of journeys
(utilitarian and leisure) produced different results, and should be considered separately as this
dissertation proposes. When comparing results from different user groups, it can be observed that some
users consider connectivity the most important dimension as opposed to others that consider comfort.
In general, for utilitarian trips, connectivity played a bigger role than in leisure trips.
Despite believing that this was the most effective solution to assess the problem IAAPE proposes
to solve, the Delphi method has some limitations. If one of the group members becomes a leader, the
results of this analysis reflect his or her opinions rather than a consensus between the group. The
stakeholders were chosen to represent a certain group that they are used to work with or are a part of.
However, by only choosing representatives, scoring may not be representative of the group that is being
tested. The validation of the model therefore plays a very important role and should be done in the future
(not in the scope of this work).
17 different indicators have, to this point, been chosen by stakeholders to evaluate walkability
and assess the built environment, by the 4 population segments and for utilitarian and leisure trips. As
such, some indicators were selected for several combinations of trip motive vs. population group. The
next challenge was to determine how to score these dimensions.

8
Scoring of indicators
The scoring of indicators and determination of the value function was done by using as much of
the literature as possible. However, in some cases that was not possible. Indicators could be Macro or
Micro, depending if they apply to an area or to a single segment, respectively. C12: Continuity of Path,
C13: Condition to Take the Most Direct Path and C71: Enforcement of Legislation, are the only Macro
indicators. They are measured using GIS technology.
All other indicators are measured be on-site analysis. Some arcs are considered cut-offs as they
are not suitable for the use of pedestrians (e.g. an impaired user in a wheel chair requires a minum width).
These segments are scored as nil. The full scope of the scoring process will not be described in this paper.
The Value-function is used to transform the scores analyzed into values that can be used in the
weighted average to score walkability for the walking segment. In most of the literature consulted, author
do not disclose their value functions. This is one of the greatest contributions of this paper: the proposal
of value functions.
Application to the Case Study of Arroios, Lisbon
As this dissertation is integrated in the IAAPE project, the Municipality of Lisbon proposed a case
study location. A safety assessment for several schools in the city of Lisbon is currently being done. In the
Arroios area there are two schools being assessed. The study area is defined by two circumferences of
400m radius with centers in each school. This study area encompasses several different kinds of streets
and neighborhoods. On the West, Avenida Almirante Reis is one of the most important 4-lane avenues of
Lisbon. The Anjos neighborhood is a more traditional and residential one. Overall this case study provided
enough diversity so that differences in evaluations can be observed.
The first step was to vectorize the network (design it in a GIS software). This was one of the most
important steps of the process. Errors in the vectorization could potentially influence the analysis of some
indicators.
Secondly, the street auditing had to be performed. In order to ensure that street auditing would
not be affected by subjectivity of the evaluator, a street auditing guide was created. The 10-page
document was created so that it would be as easy and objective as possible for the auditor to score the
dimensions of walkability. After a brief introduction to what is being evaluated, the indicators are
presented and how to evaluate them. Pictures of examples were given in order to ensure easiness of
evaluation.
After the entire area was evaluated, the remaining indicators were scored using GIS analysis. This
was done by using ArcGIS and the data was compiled in Excel. The results are presented in Table 1 and as
a Map in Figure 1 in the Annex.

9
Table 1 - Measurements of Indicators in the study area
Code Average/result1 Median
25% quartile
75% quartile
Continuity of Path1 C12 33.21
Condition to Take the Most Direct Path C13 21.66 18.46 14.95 23.48
Existence of Infrastructure for Disabled Access
C14 12.78
Land Use Mix C21 43.04 33.33 33.33 66.67
Footway Width C22 27.42 0.00 0.00 40.50
Everyday Use Commercial Activities’ Density
C24 4.41 0.00 0.00 0.00
“Vigilance Effect”: To see and be Seen C31 51.70 50.00 25.00 75.00
Pavement Quality C32 69.35 75.00 62.50 87.50
Existence of Public Meeting Places C41 15.09 0.00 0.00 0.00
Existence of Attractor Destinations C42 1.23 0.00 0.00 0.00
Land Use Mix and Service C43 10.67 0.00 0.00 0.00
Sense of Place and Reference Elements C51 21.08 0.00 0.00 0.00
Availability of Signals Adapted to Pedestrians
C53 41.67 50.00 50.00 50.00
Safety on Road Crossings C61 40.58 0.00 0.00 100.00
Availability of Crossing in the Most desired Trajectory1
C62 36.38
Enforcement of Legislation1 C71 53.49
Standardization of Interventions and Solutions
C75 20.42 0.00 0.00 0.00
Some indicators are presented as a classification because they are assessed on a Macro scale
basis (C12, C62, and C71). C14 was evaluated as a binary: either the link has the maximum score or it is
awarded 0. The score therefore indicates the percentage of evaluated links that scored 1, i.e. it is possible
to conclude that only 12,78% of all segments evaluated have what was considered to be an existing
infrastructure for disabled access. This is a clear sign that the area that is being studied should be analyzed
by competent authorities to provide access to every pedestrian.
For the indicators C12, C62 and C7 it is difficult to provide any comments as there is no
benchmark and its analysis should come after other areas are evaluated.
The data for C24 and C42 is highly conditioned by the presence of an outlier. A market street on
the evaluated area has 10 commercial stores and therefore all the other streets have very low scores. This
is a concern and should be assessed in future analyses.
Except for Comfort (C3), all dimensions have low scores. This indicates that both quality of
pavement and vigilance effect are good in the Arroios area of Lisbon.
1 Due to the method used, these are Macro scale indicators and therefore, all links are awarded the same score

10
The dimension with the lowest scores is Conviviality (C4). Although these results are affected by
the presence of an outlier, it was expected as it is an area with few zones that provide a physical space
for citizens to interact.
When analyzing the results, it is evident that some users have a better perception of the
environment than other: impaired vs. adult show great difference. There is a very large amount of cut-
offs for the first group. This was expected as Lisbon is known for its narrow sidewalks. Although significant
efforts are being made by the Municipality, sidewalk width remains a major concern. This can explain
most of the cut-offs.
Elderly and Children groups generally scored average results (between 40 and 60). In order to
compare and further provide comments on these results, other case studies should be analyzed.
It is also possible to observe that Avenida Almirante Reis is one of the avenues with the best
score. This is located on the upper left corner of the study case area. This street has large sidewalks, a
very large amount of appealing locations (shops, commercial activities etc...) and the crossings are all
signalized. Also, the streets near Largo da Graça (southwest) have very high scores. This is a tourist
attraction and has also a significant amount of commerce. On more residential blocks, scores are lower
due to the lack of land use mix.
Conclusions
This dissertation had as main objective to contribute to the IAAPE evaluation procedure by
defining a method to select indicators for the 7 walkability dimensions, weigh the selected indicators for
different population groups and trip motives, and finally, transform these indicators into a single
walkscore for each link of the pedestrian network. This was done using as much as possible the existing
literature. It was achieved, but there are some points that still need work.
The model built was tested in the case study and in fact it was possible to measure walkability
for the area. The results for this assessment were satisfying but a cautious optimism is needed at this
point. In order to confirm these results, a validation should be done. This could potentially be achieved by
measuring pedestrian traffic or by doing questionnaires to users as Park (2008).
The methodology used in this paper can be easily applied to other locations and is a marketable
product for its target, the Municipalities. A walkable city brings a vast spectrum of advantages, from
economic to health related and therefore the assessment of walkability in cities is of very high importance.
The methodology presented is meant to be used as a tool to evaluate walkability and identify where
pedestrians have the worst conditions to walk. Therefore, the municipalities, or the competent
authorities, could use this product to act efficiently, in a cost efficient manner to make their cities more
walkable and benefit from the numerous advantages it brings. Modern walkable cities are extremely
important.
11
References
Abley, S. (2006). WALKABILITY TOOLS RESEARCH Variables Collection Methodology.
Abley, S., & Consultants, A. (2010). Measuring accessibility and providing transport choice. Australian Institute of Transportation …. Retrieved from http://www.livingstreets.org.nz/sites/livingstreets.org.nz/files/1555 Steve Abley - Accessibility - Abstract and Paper.pdf
Abley, S., Turner, S., & Singh, R. (2011). Predicting walkability. Retrieved from http://www.hardingconsultants.co.nz/ipenz2011/downloads/Abley__Steve.pdf
Ariffin, R. N. R., & Zahari, R. K. (2013). Perceptions of the Urban Walking Environments. Procedia - Social and Behavioral Sciences, 105, 589–597. doi:10.1016/j.sbspro.2013.11.062
Baker, D., Bridges, D., Hunter, R., & Johnson, G. (2002). Guidebook to decision-making methods. Department of Energy, USA. Retrieved from https://scholar.google.pt/scholar?hl=pt-PT&q=Guidebook+to+decision-making+methods+&btnG=&lr=#0
Cambra, P. (2012). Pedestrian Accessibility and Attractiveness Indicators for Walkability Assessment. Retrieved from https://fenix.tecnico.ulisboa.pt/downloadFile/395144992898/Dissertacao.pdf
Clark, A., Scott, D., & Yiannakoulias, N. (2014). Examining the relationship between active travel, weather, and the built environment: a multilevel approach using a GPS-enhanced dataset. Transportation. Retrieved from http://link.springer.com/article/10.1007/s11116-013-9476-3
Coffee, N. T., Howard, N., Paquet, C., Hugo, G., & Daniel, M. (2013). Is walkability associated with a lower cardiometabolic risk? Health & Place, 21, 163–9. doi:10.1016/j.healthplace.2013.01.009
Doyle, S., & Kelly-Schwartz, A. (2006). Active community environments and health: the relationship of walkable and safe communities to individual health. Journal of the …. Retrieved from http://www.tandfonline.com/doi/abs/10.1080/01944360608976721
Duncan, D., Aldstadt, J., Whalen, J., & Melly, S. (2013). Validation of Walk Scores and Transit Scores for estimating neighborhood walkability and transit availability: a small-area analysis. GeoJournal. Retrieved from http://link.springer.com/article/10.1007/s10708-011-9444-4
Frank, L. D., Sallis, J. F., Conway, T. L., Chapman, J. E., Saelens, B. E., & Bachman, W. (2006). Many Pathways from Land Use to Health: Associations between Neighborhood Walkability and Active Transportation, Body Mass Index, and Air Quality. Journal of the American Planning Association, 72(1), 75–87. doi:10.1080/01944360608976725
Fruin, J. (1971). Pedestrian planning and design. Retrieved from http://trid.trb.org/view.aspx?id=114653
Keast, E. M., Carlson, N. E., Chapman, N. J., & Michael, Y. L. (n.d.). Using built environmental observation tools: comparing two methods of creating a measure of the built environment. American Journal of Health Promotion : AJHP, 24(5), 354–61. doi:10.4278/ajhp.080603-QUAN-81
Krambeck, H. V. (2006). The global walkability index. Massachusetts Institute of Technology. Retrieved from http://dspace.mit.edu/handle/1721.1/34409
12
Leslie, E., Coffee, N., Frank, L., Owen, N., Bauman, A., & Hugo, G. (2007). Walkability of local communities: using geographic information systems to objectively assess relevant environmental attributes. Health & Place, 13(1), 111–22. doi:10.1016/j.healthplace.2005.11.001
Leslie, E., Saelens, B., Frank, L., Owen, N., Bauman, A., Coffee, N., & Hugo, G. (2005). Residents’ perceptions of walkability attributes in objectively different neighbourhoods: a pilot study. Health & Place, 11(3), 227–36. doi:10.1016/j.healthplace.2004.05.005
Litman, T. A. (2003). Economic Value of Walkability - Transportation Research Record: Journal of the Transportation Research Board. Transportation Research Record: Journal of the Transportation Research Board, Volume 182(2003 Pedestrians and Bicycles 2003), 3–11. Retrieved from http://trb.metapress.com/content/m1573875u76t4223/
Mikaeil, R., Ozcelik, Y., Yousefi, R., Ataei, M., & Mehdi Hosseini, S. (2013). Ranking the sawability of ornamental stone using Fuzzy Delphi and multi-criteria decision-making techniques. International Journal of Rock Mechanics and Mining Sciences, 58, 118–126. doi:10.1016/j.ijrmms.2012.09.002
Moura, F., Cambra, P., & Gonçalves, A. (2014). IAAPE - Pedestrian accessibility and attractiveness assessment tool when planning for walkability. CITTA 7th Annual Conference.
Owen, N., Cerin, E., Leslie, E., duToit, L., Coffee, N., Frank, L. D., … Sallis, J. F. (2007). Neighborhood walkability and the walking behavior of Australian adults. American Journal of Preventive Medicine, 33(5), 387–95. doi:10.1016/j.amepre.2007.07.025
Park, S. (2008). Defining, Measuring, and Evaluating Path Walkability, and Testing Its Impacts on Transit Users’ Mode Choice and Walking Distance to the Station. University of California.
Transportation Research Board. (2000). Highway Capacity Manual. National Research Council, Washington, DC. Retrieved from https://scholar.google.pt/scholar?q=highway+capacity+manual&btnG=&hl=pt-PT&as_sdt=0%2C5#1
Vidal, L.-A., Marle, F., & Bocquet, J.-C. (2011). Using a Delphi process and the Analytic Hierarchy Process (AHP) to evaluate the complexity of projects. Expert Systems with Applications, 38(5), 5388–5405. doi:10.1016/j.eswa.2010.10.016
Villanueva, K., Knuiman, M., Nathan, A., Giles-Corti, B., Christian, H., Foster, S., & Bull, F. (2014). The impact of neighborhood walkability on walking: does it differ across adult life stage and does neighborhood buffer size matter? Health & Place, 25, 43–6. doi:10.1016/j.healthplace.2013.10.005
Wey, W.-M., & Chiu, Y.-H. (2013). Assessing the walkability of pedestrian environment under the transit-oriented development. Habitat International, 38, 106–118. doi:10.1016/j.habitatint.2012.05.004
13
Annexes
Table 2 - Results of first step of stakeholder session
Pedestrian user group Round 1 aggregate
Round 2 aggregate Dimension Key-concerns Adults Seniors Disabled Children
C1: Connectivity
C11: Street density (alternative routes) 0.13 0.07 0.13 0.06 0.014 0.017
C12: Continuity of walking path/sidewalk 0.27 0.37 0.25 0.33 0.043 0.084
C13: Path directness 0.27 0.17 0.04 0.44 0.031 0.036
C14: Existence of dedicated pedestrian infrastructure, accessible to all groups 0.10 0.33 0.50 0.17 0.039 0.059
C15: Network integration in the urban fabric 0.23 0.07 0.08 0.00 0.015 0.027
C2: Convenience
C21: Land use diversity 0.27 0.20 0.13 0.28 0.031 0.044
C22: Sidewalk available width 0.23 0.07 0.25 0.22 0.026 0.013
C23: Obstacles (absence of) 0.20 0.23 0.21 0.28 0.032 0.034
C24: Density of daily uses 0.23 0.33 0.17 0.11 0.032 0.025
C25: Facilities for accessing steep streets (escalators, elevators, ramps) 0.07 0.17 0.25 0.11 0.021 0.036
C3: Comfort
C31: "Eyes on the street" - windows and facade transparency 0.20 0.20 0.17 0.39 0.032 0.036
C32: Pavement surface quality 0.40 0.33 0.33 0.22 0.047 0.065
C33: Amenities (trees, benches, lighting, etc.) 0.10 0.23 0.29 0.17 0.028 0.027
C34: Climate protection (sun, rain) 0.07 0.17 0.13 0.22 0.020 0.017
C35: Sensory quality of urban environment 0.23 0.07 0.08 0.00 0.015 0.002

14
C4: Conviviality
C41: Opportunities for meeting and sojourning (benches, tables, terraces) 0.27 0.33 0.21 0.22 0.038 0.055
C42: Existence of "anchor sites" - squares, open-air markets, parks, etc. 0.20 0.27 0.29 0.33 0.038 0.029
C43: Mixed uses and mixed working hours 0.33 0.13 0.21 0.22 0.032 0.013
C44: "Active edges" - absence of blank walls, empty lots, dull facades 0.03 0.17 0.17 0.22 0.020 0.023
C45: Population density 0.17 0.10 0.13 0.00 0.015 0.015
C5: Conspicousness
C51: Landmarks 0.43 0.37 0.21 0.50 0.053 0.011
C52: Clear sightlines 0.13 0.13 0.17 0.17 0.021 0.002
C53: Street names, signposting, way marking 0.10 0.17 0.46 0.17 0.031 0.019
C54: Architectural complexity 0.13 0.10 0.17 0.11 0.018 0.008
C55: "Sense of place" 0.20 0.23 0.00 0.06 0.020 0.006
C6: Coexistence
C61: Traffic safety (at pedestrian crossings) 0.37 0.43 0.33 0.28 0.052 0.076
C62: Pedestrian crossing location 0.17 0.07 0.33 0.39 0.031 0.042
C63: Appropriate spatial segregation of transport means 0.13 0.20 0.00 0.17 0.018 0.008
C64: Proportion of pedestrian friendly streets 0.10 0.03 0.00 0.00 0.006 0.017
C65: Pedestrian space "invasion" - parked cars, running bicycles 0.23 0.27 0.33 0.17 0.036 0.063
C7: Commitment
C71: Enforcement of pedestrian regulations (as the recent disabilities act) 0.30 0.33 0.33 0.22 0.043 0.021
C72: Street cleanliness 0.23 0.20 0.22 0.39 0.032 0.023
C73: Means for public participation 0.17 0.03 0.07 0.00 0.011 0.019

15
C74: Walking initiatives (walk to school, walk to work, senior walks, etc.) 0.03 0.13 0.04 0.17 0.013 0.008
C75: Existence of design standards and planned public space interventions 0.27 0.30 0.33 0.22 0.047 0.017
Table 3 - Results 1000minds
1000 Minds Weight results Utilitarian Trips Leisure Trips
Dimension Key-
concerns Adults Seniors Disabled Children Adults Seniors Disabled Children
C1: Connectivity
C12: Continuity of walking path/sidewalk 0.17 0.11 --- --- 0.04 0.07 --- ---
C13: Path directness --- --- --- 0.19 --- --- --- 0.09
C14: Existence of dedicated pedestrian infrastructure, accessible to all groups --- --- 0.17 --- --- --- 0.17 ---
C2: Convenience
C21: Land use diversity 0.06 --- --- 0.15 0.19 --- --- 0.23
C22: Sidewalk available width --- --- 0.17 --- --- --- 0.17 ---
C24: Density of daily uses --- 0.16 --- --- --- 0.27 --- ---
C3: Comfort
C31: "Eyes on the street" - windows and facade transparency --- --- --- 0.19 --- --- --- 0.18
C32: Pavement surface quality 0.17 0.21 0.17 --- 0.12 0.17 0.17 ---
C4: Conviviality
C41: Opportunities for meeting and sojourning (benches, tables, terraces) --- 0.11 --- --- --- 0.17 --- ---
C42: Existence of "anchor sites" - squares, open-air markets, parks, etc. --- --- 0.09 0.04 --- --- 0.09 0.18

16
C43: Mixed uses and mixed working hours 0.17 --- --- --- 0.23 --- --- ---
C5: Conspicousness
C51: Landmarks 0.11 0.05 --- 0.12 0.19 0.03 --- 0.14
C53: Street names, signposting, way marking --- --- 0.04 --- --- --- 0.04 ---
C6: Coexistence
C61: Traffic safety (at pedestrian crossings) 0.22 0.21 0.22 --- 0.15 0.17 0.22 ---
C62: Pedestrian crossing location --- --- --- 0.23 --- --- --- 0.14
C7: Commitment
C71: Enforcement of pedestrian regulations (as the recent disabilities act) 0.11 0.16 0.13 --- 0.08 0.13 0.13 ---
C72: Street cleanliness --- --- --- 0.08 --- --- --- 0.05

17

18
Figure 1 - Walkability evaluation for Utilitarian and Leisure trips and each population group