Wales Item Analysis National Foundation for Educational ...
35
Report PISA 2012 Wales Item Analysis National Foundation for Educational Research (NFER)
Transcript of Wales Item Analysis National Foundation for Educational ...

Report
PISA 2012 Wales Item Analysis
National Foundation for Educational Research (NFER)

PISA 2012 Wales Item Analysis
Published in April 2015 By the National Foundation for Educational Research, The Mere, Upton Park, Slough, Berkshire SL1 2DQ www.nfer.ac.uk © 2015 National Foundation for Educational Research Registered Charity No. 313392 ISBN 978-1-910008-54-6 How to cite this publication: National Foundation for Educational Research (2015). PISA 2012: Wales Item Analysis. Slough: NFER.

Contents
1 Background 1
2 Items analysed 2
2.1 Item analysis 3
3 Mathematics 4
3.1 ‘Skipped’ mathematics items 4
3.2 ‘No credit’ mathematics items 7
3.3 ‘Partial credit’ mathematics items 10
4 Science 14
4.1 ‘Skipped’ science items 14
4.2 ‘No credit’ science items 16
4.3 ‘Partial credit’ science items 19
5 Reading 22
5.1 ‘Skipped’ reading items 22
5.2 ‘No credit’ reading items 24
5.3 ‘Partial credit’ reading items 27
6 Conclusions 28
6.1 Assessment design 28
6.2 Subject knowledge and skills 28
6.3 Assessment skills 29
7 References 30


PISA 2012: Wales Item Analysis 1
1 Background
The Programme for International Student Assessment (PISA) is a survey of
educational achievement organised by the Organisation for Economic Co-operation
and Development (OECD). In Wales the PISA 2012 survey was carried out on behalf
of the Welsh Government by the National Foundation for Educational Research
(NFER).
PISA assesses the knowledge, skills and readiness for adult life of pupils aged 15.
Pupils are assessed on their competence to address real life challenges involving
reading, mathematics and science. Each cycle of PISA focuses on one of these three
areas. The main focus for PISA 2012 was mathematics, with science and reading as
minor domains.
PISA 2012 was a two-hour paper-based assessment. The assessment material
consisted of seven mathematics clusters1, three reading clusters and three science
clusters which were rotated across 13 test booklets. Each test booklet comprised
four clusters of test material (at least one cluster in each booklet was a mathematics
cluster). All learners were administered some mathematics questions and
approximately 70 per cent of the pupils who took part were assessed in science and
reading. Mathematics is therefore covered more fully than science and reading.
However, the result of this assessment design is that not all learners answer all the
questions. PISA also contains link items, items that have been used in the previous
round to allow linking of results between years. The results reported for each domain
are estimates for the whole population of 15-year-olds in Wales, based on the
performance of pupils who were presented with test items (in PISA ‘items’ refer to
questions or sub-parts of questions) in each domain. These estimates take into
account information about how pupils with specific characteristics performed. Further
details on the development of the survey, what PISA measures, PISA scales and
proficiency levels, how the survey was administered and the PISA sample are
included in the national report for Wales (Wheater et al, 2013) and the PISA 2012
Assessment and Analytical Framework (OECD, 2013).
1 A ‘cluster’ is a set of assessment items from a single domain, i.e. mathematics, that are
always presented together.

2 PISA 2012: Wales Item Analysis
2 Items analysed
A total of 182 assessment items were presented to learners in Wales. All 182 items
had at least one learner failing to receive credit for the item and almost all of the
items were omitted by at least one learner. The three items with no omissions all had
high percentages of learners failing to gain credit. Table 1 below shows the numbers
of items on which certain percentages of learners in Wales omitted and/or received
no credit.
Table 1: Numbers of items omitted or where learners received no credit
Learners omitting the item (%)
Number of items Learners gaining no credit (%)
Number of items
Over 5% 86 Over 20% 152
Over 10% 54 Over 30% 129
Over 15% 34 Over 40% 100
Over 20% 25 Over 50% 68
Over 25% 21 Over 55% 48
Over 30% 12 Over 60% 31
Over 35% 4 Over 70% 11
Over 80% 4
Note: bold italic indicates an agreed analysis threshold
The table shows that it was common for learners in Wales to receive no credit on
relatively high percentages of the PISA 2012 items: over half of the items had no-
credit rates of at least 40 per cent of learners, just over a quarter of the items had
more than 55 per cent of learners failing to gain credit, and there were 11 items on
which over 70 per cent of learners failed to receive credit. The figures for omitted
items were less stark but, even so, nearly a fifth of the items were omitted by more
than 15 per cent of learners.
Because of the high numbers of items in each category, and in order to render the
item analysis meaningful, thresholds were set for analysis. It was agreed to analyse
the 48 items on which over 55 per cent of learners who attempted the item failed to
receive credit, and the 34 items that were omitted by at least 15 per cent of those
presented with it. These thresholds are highlighted in bold italic in Table 1.
It was less common for learners in Wales to receive partial credit on a multi-mark
item, as there were only 12 multi-mark items in the assessment. Learners tended to
either receive full credit (two marks) or no credit at all on these items. As there were
so few multi-mark items, all 12 were analysed.

PISA 2012: Wales Item Analysis 3
Of the 75 items2 analysed, 58 were analysed on one count only (i.e. according to
their high omission rate, or their no-credit rate, or their partial-credit rate). However,
15 of the analysed items fell into two of these analysis categories and two items fell
into all three categories.
2.1 Item analysis
2.1.1 Item domains
As might be expected, given that mathematics was the major domain in PISA 2012,
the analysed items were drawn predominantly from that domain. Of the 75 analysed
items:
41 were mathematics items (24 new items and 17 link items)
19 were science items (all link items)
15 were reading items (all link items)
2.1.2 Clusters and booklets
There appeared to be few effects related to the clustering of items. The items that
were identified for analysis came from a number of different clusters in each domain.
In general, learners’ propensity to skip an item or not receive full credit for an item did
not seem to be related to the cluster it was part of or the position of the cluster within
the test booklet.
It should be noted that, since each cluster is in four assessment booklets in a
different position each time (from 4 possible positions), clustering is unlikely to be the
reason for high omission rates or high no credit rates. Similarly, the more heavily
affected clusters were distributed across the assessment booklets so it is unlikely
that any particular booklet proved more difficult than any other booklet for learners in
Wales.
2 The 75 items are from 51 different assessment questions, i.e. some of the items are
subparts of one assessment question.

4 PISA 2012: Wales Item Analysis
3 Mathematics
3.1 ‘Skipped’ mathematics items
There were 23 mathematics items3 not attempted by more than 15 per cent of
learners in Wales. Tables 2a to 2d shows how these items were classified by OECD
according to the PISA framework for mathematical literacy (OECD, 2013). The
framework classifies assessment questions according to each of three categories:
process, content and context. These are described in more detail in the framework
(pp 23-58). In addition to these categories the assessment items are also classified
by item type: constructed response (expert-coded4); constructed response (manual
or auto-coded); selected response (complex multiple-choice) and selected response
(simple multiple-choice).
There may be many reasons why a learner would decide to omit an item (e.g.
difficulty level, not noticing the item, lack of motivation, running out of time), and it is
not possible to say why so many learners may have failed to attempt answering
these 23 mathematics items. The analysis below may provide some clues, but
cannot give conclusive reasons.
Table 2a: Number of ‘skipped’ mathematics analysis items in each
process category
Process Number of skipped items
Analysed Total items of this type
Formulate 10 27
Employ 11 37
Interpret 2 21
Totals 23 85
Regarding the Process category, the highest proportion (Analysed total/Total items of
this type) of skipped items was of the Formulate variety, with over a third of those
items having an omission rate of more than 15 per cent. This category involves
Formulating situations mathematically, that is, recognising and identifying
opportunities to use mathematics in a problem and then providing the necessary
mathematical structure to analyse, set up, and solve the problem.
About a third of the items from the Employ category were also omitted by more than
15 per cent of learners in Wales. This category (Employ mathematical concepts,
facts, procedures and reasoning) requires learners to apply mathematical concepts,
facts, procedures, and reasoning to obtain mathematical conclusions.
3 A total of 85 mathematics items were presented to learners in Wales.
4 As PISA is a research assessment item responses are coded rather than marked.

PISA 2012: Wales Item Analysis 5
Some learners seemed to find items in these two categories less accessible than
those in the Interpret category (Interpreting, applying and evaluating mathematical
outcomes). The Interpret category involves reflecting on mathematical solutions and
interpreting them in the context of real-life problems, including translating solutions or
reasoning back into the context of a problem and determining whether the results are
reasonable and make sense in that context.
Table 2b: Number of ‘skipped’ mathematics analysis items in each
content category
Content Number of skipped items
Analysed Total items of this type
Change and Relationships 11 21
Space and Shape 7 21
Quantity 3 22
Uncertainty and Data 2 21
Totals 23 85
The content area that most commonly caused learners to omit an item was Change
and Relationships, with just over half of the items (11 of the 21 items) in that category
having omission rates of higher than 15 per cent. The other content areas were less
commonly omitted by learners, although a third of the items in the Space and Shape
category were also omitted by more than 15 per cent in Wales.
Table 2c: Number of ‘skipped’ mathematics analysis items in each
context category
Context Number of skipped items
Analysed Total items of this type
Personal 1 13
Occupational 6 15
Societal 4 29
Scientific 12 28
Totals 23 85
In the mathematics Context category, the Scientific context proved most problematic,
with 12 of these 28 items having an omission rate above 15 per cent. This context
relates to the application of mathematics to the natural world, along with issues and
topics related to science and technology.
The proportion of Occupational items omitted was also relatively high (two-fifths of
such items omitted). This context relates to mathematics in the world of work.

6 PISA 2012: Wales Item Analysis
The remaining two contexts (Personal and Societal) had fewer items with relatively
high omission rates. The first covers mathematics that relates to the individual’s own
activities or those of their family or peer group, while the second relates to
mathematics within the community, whether local, national or global (examples are
voting systems, public transport, government, demographics, advertising, national
statistics and economics).
Table 2d: Number of ‘skipped’ mathematics analysis items in each item
type category
Item type Number of skipped items
Analysed Total items of this type
Constructed response (expert-coded)
18 25
Constructed response (manual or auto-coded)
4 27
Selected response
(complex multiple choice)
0 21
Selected response
(simple multiple choice)
1 12
Totals 23 110
Item format can also affect omission rates, with learners potentially regarding
selected response (multiple choice) items as more easily attempted compared with
other item types, if they are short of time or unsure of an answer. Two types of
selected response item were in use: Simple multiple-choice items required learners
to select one answer from a number of options, while Complex multiple-choice items
required several selections to be made, such as selecting a response for each of a
number of statements or questions. As expected, it was rare for selected response
items to be omitted by more than 15 per cent of learners. The one exception was a
Change and Relationships item (PM943Q01) that required learners to select the
formula that accurately described a given situation. The correct response was
relatively straightforward once learners had understood the context, but the data in
Table 2b suggests that some learners find this area of mathematics difficult and/or
inaccessible, and that may have impacted on the decision of the 16 per cent who
omitted this simple multiple-choice item.
Aside from this one exception, the remainder of the analysed skipped items were of
the constructed response (expert-coded) variety, with almost three-quarters of the 25
items of this type being omitted by more than 15 per cent.
The highest omission rate for a mathematics item was 41 per cent (five percentage
points ahead of the next highest). This was a link item (PM406Q02), the second in a
Space and Shape question. The first item in this question had been skipped by 17
per cent and answered incorrectly by 70 per cent, with only 13 per cent in Wales
gaining credit. This poor performance on the first item might have impacted on

PISA 2012: Wales Item Analysis 7
learners’ confidence on the second item. In addition, the second item required
learners to Formulate the problem, a skill required in many of the items with higher
omission rates. The OECD facility5 for this item was low (although not quite as low as
in Wales), suggesting that this item was generally found to be difficult. In addition,
and given that it addressed two of the areas that learners in Wales seemed to find
more challenging, it is perhaps not surprising that so many omitted it.
Looking at the items omitted by more than 15 per cent of learners, it is noticeable
that many of them involve generating and manipulating formulae, and/or using
geometrical knowledge. This is consistent with the finding that learners most
commonly omitted items covering the content areas of Change and Relationships
and Space and Shape.
3.2 ‘No credit’ mathematics items
There were 27 mathematics items6 on which more than 55 per cent of learners in
Wales gained no credit. Tables 3a to 3d show how these items were classified by
OECD according to the PISA framework (OECD, 2013). As noted earlier, the
framework classifies assessment questions according to each of three categories
(process, content and context), as well as by item type, and these are described in
more detail in the framework.
Again, there might be many reasons why a learner would not achieve credit on an
item (e.g. the item might be too difficult, the learner might have misunderstood the
item or carried forward a misunderstanding from a previous item, the learner might
not be motivated by the item, or might be running out of time). As a result, it is not
possible to say why so many learners failed to achieve credit on these 27
mathematics items. The analysis below may provide some clues, but cannot give
conclusive reasons.
Table 3a: Number of ‘no credit’ mathematics analysis items in each
process category
Process Number of no credit items
Analysed Total items of this type
Formulate 16 27
Employ 9 37
Interpret 2 21
Totals 27 85
As was the case for the skipped items, the highest proportion of no credit items in the
Process category was of the Formulate variety. In this case, over half of the
formulate items had a ‘no credit’ rate of more than 55 per cent. A quarter of Employ
items also proved problematic.
5 The OECD facility is a measure of how easy a question is and is calculated from all the
participating OECD countries. 6 A total of 85 mathematics items were presented to learners in Wales.

8 PISA 2012: Wales Item Analysis
Six of the 10 mathematics items that fell into both the ‘skipped’ and ‘no credit’
categories were from the Formulate category, three from the Employ category, and
one from the Interpret category.
These findings suggest that learners in Wales may have experienced more difficulty
with formulating situations mathematically and employing mathematical concepts
than with reflecting on mathematical solutions and interpreting them in the context of
real-life problems.
Table 3b: Number of ‘no credit’ mathematics analysis items in each
content category
Content Number of no credit items
Analysed Total items of this type
Change and Relationships 7 21
Space and Shape 11 21
Quantity 3 22
Uncertainty and Data 6 21
Totals 27 85
The profile of analysed items for the Content category was slightly different for the
‘no credit’ items than that for ‘skipped’ items. In this case, more than 55 per cent of
learners failed to gain credit for 11 of the 21 Space and Shape items (just over half of
those items), while the same was true for a third of the Change and Relationships
items and almost a third of the Uncertainty and Data items. Although there were very
few Quantity items (less than 10 per cent) appearing on either the ‘skipped’ or ‘no
credit’ lists for analysis.
Ten items were in both the ‘no credit’ and ‘skipped’ categories: five were from the
Change and Relationships category, four from the Space and Shape category, and
one from the Uncertainty and Data category.
This different profile for the ‘no credit’ items might suggest that learners in Wales
found some of the items less approachable than others (i.e. were less likely to
attempt them, but likely to gain credit when they did attempt them), but were perhaps
overconfident - or guessing - on other items (being willing to attempt them but more
liable to answer incorrectly).

PISA 2012: Wales Item Analysis 9
Table 3c: Number of ‘no credit’ mathematics analysis items in each
context category
Context Number of no credit items
Analysed Total items of this type
Personal 4 13
Occupational 7 15
Societal 8 29
Scientific 8 28
Totals 27 85
Again, the profile for the Context category was different for the ‘no credit’ items than
for the skipped items. The Occupational category seemed to prove most problematic
for learners in Wales, with just over half of the Occupational items having a ‘no credit’
rate of more than 55 per cent. The remaining categories each had over a quarter of
their items showing similarly high omission rates.
Of the mathematics items in both the skipped and no credit analysis groups, three
were in the Occupational category, two were Societal, and the remaining five were
Scientific.
Table 3d: Number of ‘no credit’ mathematics analysis items in each item
type category
Item type Number of no credit items
Analysed Total items of this type
Constructed response (expert-coded)
12 25
Constructed response (manual or auto-coded)
8 27
Selected response
(complex multiple choice)
4 21
Selected response
(simple multiple choice)
3 12
Totals 27 85
As was the case for the ‘skipped’ items, most of the ‘no credit’ items on which high
numbers of learners failed to gain credit were of the constructed-response variety.
However, in this case, 12 of the constructed response items with high no credit rates
were of the expert-coded type and eight were manual or auto-coded (i.e. requiring a
more straightforward type of response). This was a much higher proportion of
manual or auto-coded items than was seen in the ‘skipped’ items. This might suggest

10 PISA 2012: Wales Item Analysis
that learners in Wales were perhaps overconfident on the manual or auto-coded and
therefore they were willing to attempt them but more liable to answer incorrectly.
While few of the multiple-choice items were omitted by more than 15 per cent of
learners, more items of these types were attempted but answered incorrectly by
more than 55 per cent. This underlines the fact that multiple-choice items can be
easier for learners to access, but are not necessarily easier to answer correctly
(whether through knowledge or through guessing).
Looking at the items on which 55 per cent of learners failed to gain credit, it is
noticeable that many of them involve applying geometrical knowledge and, to a
lesser extent, algebraic knowledge. This is consistent with the finding that Space and
shape is the content area where there are more items on which 55 per cent of
learners are not gaining credit.
3.3 ‘Partial credit’ mathematics items
Of the 12 multi-mark items, eight were mathematics items. All were constructed
response items, requiring expert coding. Table 4 gives the classifications for these
eight items.
Table 4: Number of ‘partial credit’ mathematics analysis items in each
classification category
Process Number of partial credit items
Analysed Total items of this type
Formulate 2 27
Employ 6 37
Interpret 0 21
Totals 8 85
Content Number of partial credit items
Analysed Total items of this type
Change and Relationships 3 21
Space and Shape 2 21
Quantity 1 22
Uncertainty and Data 2 21
Totals 8 85

PISA 2012: Wales Item Analysis 11
Context Number of partial credit items
Analysed Total items of this type
Personal 0 13
Occupational 2 15
Societal 1 29
Scientific 5 28
Totals 8 85
Item type Number of partial credit items
Analysed Total items of this type
Constructed response (expert-coded)
8 25
Constructed response (manual or auto-coded)
0 27
Selected response
(complex multiple choice)
0 21
Selected response
(simple multiple choice)
0 12
Totals 8 85
Overall, the items on which learners could gain partial credit had little in common in
terms of classification, although Scientific items stood out again. This lack of
commonality is perhaps not surprising, given the limited number of partial credit
items. As a result, it might be helpful to consider the wider data for these 12 items.
Table 5 shows the scoring pattern for each of the items.
Table 5 underlines that fact that most of these items were omitted by more than 15
per cent of learners in Wales (and have, therefore, been discussed earlier).
The percentages gaining partial credit on these mathematics items ranged from three
per cent to 23 per cent. One of these items fell into only this analysis category (i.e.
some learners gained partial credit, but the omission rate was below 15 per cent and
the no credit rate was below 55 per cent).
Two of the items fell into all three analysis categories (i.e. some learners gained
partial credit for each item, and each was also omitted by more than 15 per cent and
more than 55 per cent achieved no credit for the item). The remaining items fell into
two of the three analysis categories: they all had some learners achieving partial
credit and more than 15 per cent omitting the item.
The average facility for five of these multi-mark items in Wales was similar to the
OECD average facility (measured as percentages of those attempting the item). For
the remaining three items, the average item facility in Wales was noticeably lower
than the OECD average. There was no pattern in terms of the classification of these
items.

12 PISA 2012: Wales Item Analysis
The three items that performed noticeably differently from the OECD average, all
have around a third of learners skipping the item, they also have notably high
proportions of learners failing to gain credit, suggesting that these items simply
proved more difficult in Wales than internationally. The last item in Table 5 showed a
similar profile to the first three items, but performed similarly in Wales and
internationally, implying that it was difficult more generally.

PISA 2012: Wales Item Analysis 13
Table 5: Scoring pattern for the 12 multi-mark mathematics items
Item ID Full credit (%)
Partial credit (%)
No credit (%)
Skipped (%)
Not reached (%)
Facility similar to OECD average?
Classification
PM903Q01 8 9 53 29 1 Wales lower Change and Relationships, Occupational, Employ
PM462Q01 2 3 59 36 0 Wales lower Space and Shape, Scientific, Employ
PM949Q03 20 2 47 30 1 Wales lower Space and Shape, Occupational, Formulate
PM906Q02 30 10 30 29 1 Quantity, Scientific, Employ
PM953Q04 9 4 55 26 6 Uncertainty and Data, Scientific, Formulate
PM955Q03 5 3 77 13 1 Uncertainty and Data, Societal, Employ
PM155Q02 49 23 19 9 0 Change and Relationships, Scientific, Employ
PM155Q03 6 15 46 34 0 Change and Relationships, Scientific, Employ
Notes: percentages may not total 100 due to rounding Figures in bold italics indicate that the item fell into the analysis group for that category

14 PISA 2012: Wales Item Analysis
4 Science
4.1 ‘Skipped’ science items
There were five science items7 not attempted by more than 15 per cent of learners in
Wales. This is a smaller proportion than was the case for mathematics: just under a
tenth of the science items were omitted by more than 15 per cent of learners in
Wales, compared with over a quarter of the mathematics items.
Table 6 shows how these five items were classified by OECD according to the PISA
framework for scientific literacy (OECD, 2013), and also shows their breakdown by
item type. The framework for scientific literacy classifies assessment questions
according to each of four categories: context, competencies, knowledge, and
applications of science. These are described in more detail in the framework (pp 97-
118).
As noted for mathematics, there may be many reasons why learners would decide to
omit an item (e.g. difficulty level, not noticing the item, lack of motivation, running out
of time). As such, and particularly given the small proportion of items affected, it is
not possible to say conclusively why so many learners failed to attempt these five
science items but the analysis below may provide some clues.
Table 6: Number of ‘skipped’ science analysis items in each
classification category
Context Number of skipped items
Analysed Total items of this type
Health 3 9
Natural resources 1 11
Environment 1 10
Hazards 0 8
Frontiers of science and technology 0 12
Other 0 3
Totals 5 53
Competencies Number of skipped items
Analysed Total items of this type
Identify scientific issues 2 13
Explain phenomena scientifically 1 22
Use scientific evidence 2 18
Totals 5 53
7 A total of 53 science items were presented to learners in Wales.

PISA 2012: Wales Item Analysis 15
Knowledge Number of skipped items
Analysed Total items of this type
Knowledge of science: (1) (26)
Physical systems 0 6
Living systems 1 9
Earth and Space systems 0 7
Technology systems 0 4
Knowledge about science: (4) (27)
Scientific enquiry 2 14
Scientific explanations 2 13
Totals 5 53
Applications of science Number of skipped items
Analysed Total items of this type
Personal 1 12
Social 4 30
Global 0 11
Totals 5 53
Item type Number of skipped items
Analysed Total items of this type
Constructed response
(expert-coded)
5 17
Constructed response
(manual or auto-coded)
0 2
Selected response
(complex multiple choice)
0 16
Selected response
(simple multiple choice)
0 18
Totals 5 53
All of the science items omitted by more than 15 per cent of learners in Wales were
of the constructed response (expert-coded) type, although there was no clear pattern
in terms of the competencies they assessed.
Other apparent patterns in terms of the classification of these items should be treated
with caution, given the small number of items concerned. More items from the Social
application category were omitted than those from other application categories, but
there were more items of this type and the proportion was only a little higher for
Social items than for the other application categories. The most commonly ‘skipped’
items in the context category were Health items, with three of the nine Health items
having relatively high omission rates. Items assessing Knowledge about science

16 PISA 2012: Wales Item Analysis
were more commonly omitted than items assessing Knowledge of science, although
this was true of only four of the 27 items of this type, a relatively low proportion of the
item type overall.
When we look more broadly at the omission rates for science items (i.e. omission
rates lower than 15 per cent) we find that highest omission rates across the science
assessment (nine per cent upwards) were on constructed response items. In fact
there were only three constructed response items had omission rates lower than 9
per cent. All three of these items pointed learners towards the data or information
that would help them answer the question. Whereas the other constructed response
items (with omission rates of nine per cent upwards) required learners to identify the
relevant information themselves, and then apply it. The omission data suggests that
a sizeable proportion of learners in Wales were not confident in doing so. The five
science items omitted by more than 15 per cent of learners in Wales were of this
type: they required learners to identify the relevant information in the detailed text
and, in three cases, associated graphics, and then to assimilate and apply that
information in order to answer the question. These skills are, of course, key aspects
of scientific literacy, yet apparently proved challenging for some learners in Wales.
4.2 ‘No credit’ science items
Just over a fifth of the 53 science items were in the ‘no credit’ analysis category (with
more than 55 per cent of learners failing to gain credit). This was a lower proportion
than for mathematics (just under a third of mathematics items fell into this analysis
category). Table 7 shows how these 12 science items were classified under the PISA
framework (OECD, 2013). As noted earlier, the framework for scientific literacy
classifies assessment questions according to each of four categories (context,
competencies, knowledge, and applications of science) as well as item type and
these are described in more detail in the framework.
As was the case for mathematics, there might be many reasons why a learner would
not achieve credit for an item (e.g. the item might be too difficult, the learner might
have misunderstood the item or carried forward a misunderstanding from a previous
item, the learner might not be motivated by the item, or might be running out of time).
As a result, it is not possible to say why so many learners failed to achieve credit on
these 12 science items. The analysis below may provide some clues, but cannot give
conclusive reasons.

PISA 2012: Wales Item Analysis 17
Table 7: Number of ‘no credit’ science analysis items in each
classification category
Context Number of no credit items
Analysed Total items of this type
Health 2 9
Natural resources 2 11
Environment 3 10
Hazards 2 8
Frontiers of science and technology 2 12
Other 1 3
Totals 12 53
Competencies Number of no credit items
Analysed Total items of this type
Identify scientific issues 4 13
Explain phenomena scientifically 5 22
Use scientific evidence 3 18
Totals 12 53
Knowledge Number of no credit items
Analysed Total items of this type
Knowledge of science: (5) (26)
Physical systems 0 6
Living systems 3 9
Earth and Space systems 2 7
Technology systems 0 4
Knowledge about science: (7) (27)
Scientific enquiry 5 14
Scientific explanations 2 13
Totals 12 53
Applications of science Number of no credit items
Analysed Total items of this type
Personal 1 12
Social 9 30
Global 2 11
Totals 12 53

18 PISA 2012: Wales Item Analysis
Context Number of no credit items
Analysed Total items of this type
Constructed response
(expert-coded)
6 17
Constructed response
(manual or auto-coded)
0 2
Selected response
(complex multiple choice)
3 16
Selected response
(simple multiple choice)
3 18
Totals 12 53
The items in this analysis category were spread across the range of contexts, with no
single context standing out. As was the case for skipped items, there was no clear
pattern in terms of the competencies these items assessed.
In contrast to the ‘skipped’ item analysis, Knowledge about science and Knowledge
of science had similar numbers of items in the ‘no credit’ analysis (five and seven
respectively). In terms of the Knowledge about science category, Living systems and
Earth and Space systems seemed to cause more problems than other categories in
terms of achieving credit. Of the seven Knowledge of science items included in this
analysis, five were Scientific enquiry items (just over a third of the Scientific enquiry
items). However, when we look that the applications of science category the findings
from the ‘no credit’ analysis are very similar to those seen in the ‘skipped’ item
analysis. That is items focusing on situations relating to the community (i.e. Social)
seemed to cause more problems than items that focus on situations relating to the
self, family and peer groups (Personal) and to life across the world (Global) in terms
of achieving credit.
While all of the ‘skipped’ science analysis items were constructed response items,
there was more of a balance regarding item type for the ‘no credit’ analysis items.
This was similar to the case for mathematics, again highlighting the fact that selected
response items can be easier for learners to access, but are not necessarily easier to
answer correctly (whether through knowledge or through guessing). Six of the
science items with more than 55 per cent of learners gaining no credit were
constructed response (expert) items, while the remaining six were multiple choice
items (three simple and three complex).
Among the 12 items with no credit rates above 55 per cent, the highest rates were 78
and 73 per cent. These were both on items assessing Knowledge about science in a
Frontiers context, one of which was Social, and one Global. The first was a multiple
choice item, assessing learners’ ability to Use scientific evidence and required
learners to evaluate evidence against hypotheses. The other was a constructed
response item, assessing learners’ ability to Identify scientific issues. This item
required learners to identify a possible research question, based on given
information.

PISA 2012: Wales Item Analysis 19
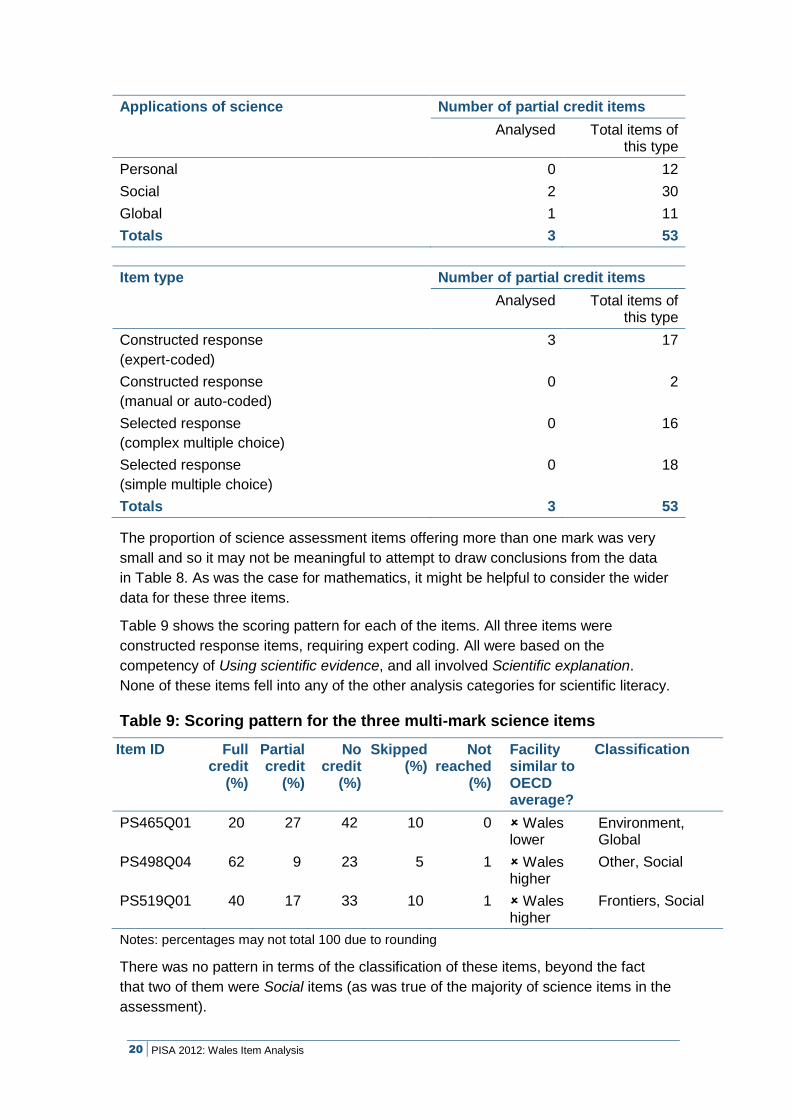
4.3 ‘Partial credit’ science items
Of the 12 multi-mark items on which learners could gain partial credit, three were
science items. Table 8 gives the classifications for these three items.
Table 8: Number of ‘partial credit’ science analysis items in each
classification category
Context Number of partial credit items
Analysed Total items of this type
Health 0 9
Natural resources 0 11
Environment 1 10
Hazards 0 8
Frontiers of science and technology 1 12
Other 1 3
Totals 3 53
Competencies Number of partial credit items
Analysed Total items of this type
Identify scientific issues 0 13
Explain phenomena scientifically 0 22
Use scientific evidence 3 18
Totals 3 53
Knowledge Number of partial credit items
Analysed Total items of this type
Knowledge of science: 0 (26)
Physical systems 0 6
Living systems 0 9
Earth and Space systems 0 7
Technology systems 0 4
Knowledge about science: 3 (27)
Scientific enquiry 0 14
Scientific explanations 3 13
Totals 3 53
20 PISA 2012: Wales Item Analysis
Applications of science Number of partial credit items
Analysed Total items of this type
Personal 0 12
Social 2 30
Global 1 11
Totals 3 53
Item type Number of partial credit items
Analysed Total items of this type
Constructed response
(expert-coded)
3 17
Constructed response
(manual or auto-coded)
0 2
Selected response
(complex multiple choice)
0 16
Selected response
(simple multiple choice)
0 18
Totals 3 53
The proportion of science assessment items offering more than one mark was very
small and so it may not be meaningful to attempt to draw conclusions from the data
in Table 8. As was the case for mathematics, it might be helpful to consider the wider
data for these three items.
Table 9 shows the scoring pattern for each of the items. All three items were
constructed response items, requiring expert coding. All were based on the
competency of Using scientific evidence, and all involved Scientific explanation.
None of these items fell into any of the other analysis categories for scientific literacy.
Table 9: Scoring pattern for the three multi-mark science items
Item ID Full credit
(%)
Partial credit
(%)
No credit
(%)
Skipped (%)
Not reached
(%)
Facility similar to OECD average?
Classification
PS465Q01 20 27 42 10 0 Wales lower
Environment, Global
PS498Q04 62 9 23 5 1 Wales higher
Other, Social
PS519Q01 40 17 33 10 1 Wales higher
Frontiers, Social
Notes: percentages may not total 100 due to rounding
There was no pattern in terms of the classification of these items, beyond the fact
that two of them were Social items (as was true of the majority of science items in the
assessment).

PISA 2012: Wales Item Analysis 21
Unlike mathematics, the average item facilities for the multi-mark items in Wales
(measured as percentages of those who attempted the items) were notably different
from the OECD average in each case. For mathematics, the Wales averages for
partial credit items were similar or lower than the OECD averages. In contrast, for
science, two of the averages in Wales were higher than the OECD averages,
meaning that learners in Wales did better than average on both of those items.
The percentages gaining partial credit on these science items ranged from nine to 27
per cent. The item with the lowest rate of partial credit was also the one with the
highest percentage of the three gaining full credit and the lowest percentages gaining
no credit or skipping the item. This indicates that this item was easier and/or more
accessible for learners in Wales than the other two items in this analysis category. It
assessed learners’ ability to draw conclusions from evidence, and had a slightly
higher facility than the OECD average. Learners gaining partial credit would have
given an incomplete description of the outcome, indicating that most learners
described the conclusion fully.
The other partial credit item with a higher facility in Wales assessed learners’ ability
to use given data to justify a conclusion. Again, those who gained partial credit would
have given an incomplete description of the outcome. In this case, that applied to 17
per cent, more than for the item above.
The item with the highest rate of partial credit in this group was harder than the
OECD average in Wales (27 per cent partial credit). The item asked learners to
describe the data for one of several graphs presented. The graphs contained multiple
data and it is possible that some of those who gained partial credit rather than full
credit addressed only some aspects of the data in their responses. Alternatively, they
might have given incomplete or inadequate descriptions.
Along with those in the skipped analysis category and those in the ‘no credit’
category, a total of 13 of the 17 constructed response science items fell into one or
more of the analysis categories. Clearly, many learners in Wales were much less
inclined generally to engage with and/or gain credit on constructed response science
items compared with selected response items.

22 PISA 2012: Wales Item Analysis
5 Reading
5.1 ‘Skipped’ reading items
There were six reading items (from a total of 44 reading items) not attempted by
more than 15 per cent of learners in Wales. This is slightly greater than the
proportion of science items in this analysis category but, again, notably lower than
the equivalent figure for mathematics.
Table 10 shows how these six items were classified by OECD according to the PISA
framework for reading literacy (OECD, 2013), and also shows their breakdown by
item type. The assessment items used in Wales were classified in relation to four
categories in the PISA framework for reading literacy: situation, text format, text type,
and aspect. These are described in more detail in the framework (pp 59-95).
As noted earlier, there may be many reasons why learners would decide to omit an
item in an assessment (e.g. difficulty level, not noticing the item, lack of motivation,
running out of time). As such, and particularly given the small proportion of items
affected, it is not possible to say conclusively why so many learners failed to attempt
these five reading items but the analysis below may provide some clues.
Table 10: Number of ‘skipped’ reading analysis items in each
classification category
Situation Number of skipped items
Analysed Total items of this type
Personal 2 16
Educational 2 14
Occupational 0 9
Public 2 5
Totals 6 44
Text format Number of skipped items
Analysed Total items of this type
Continuous 2 26
Non-continuous 2 13
Mixed 2 4
Multiple 0 1
Totals 6 44

PISA 2012: Wales Item Analysis 23
Text type Number of skipped items
Analysed Total items of this type
Description 0 6
Narration 2 9
Exposition 4 16
Argumentation 0 9
Instruction 0 4
Transaction 0 0
Totals 6 44
Aspect Number of skipped items
Analysed Total items of this type
Access and retrieve 1 10
Integrate and interpret 3 24
Reflect and evaluate 2 10
Totals 6 44
Item type Number of skipped items
Analysed Total items of this type
Constructed response
(expert-coded)
6 18
Constructed response
(manual or auto-coded)
0 6
Selected response
(complex multiple choice)
0 7
Selected response
(simple multiple choice)
0 13
Totals 6 44
As was the case for science, all six reading items omitted by more than 15 per cent
of learners in Wales were of the constructed response type. Two text types
predominated: Narration and Exposition.
As was the case with science, other apparent patterns in terms of the classification of
these items should be treated with caution, given the small number of items
concerned. The items covered three of the four situations, with a relatively high
proportion of Public items (two of only five items of this type). Similarly, they covered
three of the four text format types, with a relatively high proportion of Mixed format
items (two of only four items of this type). All aspect categories were covered, with
the highest proportion in the Reflect and evaluate category (two of 10 items), closely
followed by Integrate and interpret (3 of 24 items). Integrate and interpret items
involve processing what is read to make internal sense of a text, considering the text

24 PISA 2012: Wales Item Analysis
as a whole or in a broad perspective, while Reflect and evaluate items require
learners to draw primarily on knowledge, ideas or attitudes beyond the text, in order
to relate it to their own conceptual and experiential frames of reference.
Of the six reading items with omission rates above 15 per cent, the highest
percentage was 39 per cent, 10 percentage points more than the next highest. This
was the only one of the ten Access and retrieve items to have a relatively high
omission rate. Access and retrieve items focus the reader on information within the
text, requiring them to locate and retrieve one or more distinct pieces of information.
This item was based on an Exposition text type, with Mixed text format. It required
learners to use information in the text to annotate a diagram, and was the more
complex of the items of this type, requiring retrieval from the text as well as
interpretation of the diagram.
The remaining items with omission rates above 15 per cent all required learners to
extrapolate beyond the text, making interpretations and expressing understanding
based on the information given. It is important to remember, however, that not all
items requiring this skill had omission rates this high.
5.2 ‘No credit’ reading items
About a fifth of the 44 reading items were in the no credit analysis category (with
more than 55 per cent of learners in Wales failing to gain credit). This was a similar
proportion to science, and a lower proportion than for mathematics. Table 11 shows
how these nine reading items were classified under the PISA framework (OECD,
2013). As noted earlier, the framework for reading literacy classifies assessment
questions according to each of four categories (situation, text format, text type, and
aspect) as well as item type and these are described in more detail in the framework.
Again, there might be many reasons why a learner would not achieve credit for a
reading item (e.g. the item or its associated text might be perceived as too difficult,
the learner might have misunderstood the item or its associated text, or carried
forward a misunderstanding from a previous item or section of text, the learner might
not be motivated by the item or its text, or might be running out of time). As a result, it
is not possible to say why so many learners failed to achieve credit on these nine
reading items. The analysis below may provide some clues, but cannot give
conclusive reasons.

PISA 2012: Wales Item Analysis 25
Table 11: Number of ‘no credit’ reading analysis items in each
classification category
Situation Number of no credit items
Analysed Total items of this type
Personal 4 16
Educational 2 14
Occupational 2 9
Public 1 5
Totals 9 44
Text format Number of no credit items
Analysed Total items of this type
Continuous 6 26
Non-continuous 2 13
Mixed 1 4
Multiple 0 1
Totals 9 44
Text type Number of no credit items
Analysed Total items of this type
Description 1 6
Narration 2 9
Exposition 2 16
Argumentation 4 9
Instruction 0 4
Transaction 0 0
Totals 9 44
Aspect Number of no credit items
Analysed Total items of this type
Access and retrieve 1 10
Integrate and interpret 8 24
Reflect and evaluate 0 10
Totals 9 44

26 PISA 2012: Wales Item Analysis
Item type Number of no credit items
Analysed Total items of this type
Constructed response
(expert-coded)
2 18
Constructed response
(manual or auto-coded)
0 6
Selected response
(complex multiple choice)
6 7
Selected response
(simple multiple choice)
1 13
Totals 9 44
Several categories stand out in Table 11. More than 55 per cent of learners in Wales
failed to gain credit on almost half of the nine Argumentation items. The same was
true of just over a fifth of the Narration items, although this applied to only two of nine
items, so this finding should be treated with caution.
A third of the Integrate and interpret items had no credit rates of more than 55 per
cent, while around a quarter of the Continuous and Mixed text format types had
similarly high no credit rates. Again, this applied to only one of four Mixed text format
items, so should be treated with caution.
Proportions were somewhat more balanced across the situation categories, although
a quarter of the 16 Personal items had high proportions of learners in Wales failing to
gain credit. Personal items relate to texts that are intended to satisfy an individual’s
personal interests, both practical and intellectual.
Once again, while all the skipped analysis items were constructed response items,
there was a greater spread regarding item type for the ‘no credit’ analysis items.
Seven of the reading items with more than 55 per cent of learners gaining no credit
multiple choice items (one simple and six complex), while the remaining two were
constructed response (expert) items. Most notably, almost all of the complex multiple
choice reading items had high no credit rates: this applied to six of the seven items of
this type, reinforcing the earlier comment that, while selected response items can be
easier for learners to access, they are not necessarily easier to answer correctly
(whether through knowledge or through guessing). The items with the highest ‘no
credit’ rates were of this type.
The highest no credit rates were 85 and 80 per cent. These complex multiple choice
items required learners to Integrate and Interpret based on the Argumentation text
type. One used Continuous text in a Personal situation, while the other was based on
Mixed text in an Occupational situation. Both were difficult items in general, with
OECD averages similar to the facility in Wales.
All but one of the nine reading items in the ‘no credit’ analysis category fell into that
category only. The remaining item fell into two analysis categories, with more than 15
per cent omitting the item and more than 55 per cent gaining no credit for it. This item
was a constructed response item, requiring learners to Integrate and interpret.

PISA 2012: Wales Item Analysis 27
5.3 ‘Partial credit’ reading items
Of the 12 multi-mark items on which learners could gain partial credit, only one was a
reading item and it did not fall into any other reading analysis category. Table 12
shows the scoring pattern for this item.
Table 12: Scoring pattern for the multi-reading mark item
Item ID Full credit
(%)
Partial credit (%)
No credit
(%)
Skipped (%)
Not reached (%)
Facility similar to OECD average?
Classification
PR420Q10 72 5 11 11 1 Constructed response, Non-continuous, Exposition, Educational, Integrate and interpret
Notes: percentages may not total 100 due to rounding
Although only 5 per cent gained partial credit on this item, this is mainly because the
majority (almost three-quarters) gained full credit. The item facility in Wales was
similar to (marginally higher than) the OECD average and the partial credit
performance on this item is not, therefore, of particular concern. The item asked
learners to draw a conclusion from data given in the stimulus text, and gave a model
to follow. Those who achieved full credit followed the model, while those who gained
partial credit gave an incomplete response.

28 PISA 2012: Wales Item Analysis
6 Conclusions
While the commentary above outlines some subject-specific issues, it also raises
some common themes across the three subjects. These are summarised below. It is
important to bear in mind that the items discussed above require skills that were also
required in some of the assessment items that did not prove similarly problematic. It
may be that learners did not have the skills required by the items that proved
inaccessible for them, or it may be that they had the skills but could not yet apply
them consistently.
6.1 Assessment design
As a result of the matrix design used in compiling the PISA booklets, poor
performance on particular items was not likely to have been caused by the
content of any one booklet.
6.2 Subject knowledge and skills
There were some indications that lengthy introductions to assessment items
affected their accessibility for learners in Wales. It is possible that learners are
not familiar with handling problems contextualised in the type of real-world
situations used in PISA. This is not simply an assessment issue, since these real-
world literacy skills are useful in processing information in everyday life. As such,
it might be worth seeking more classroom emphasis on the skills of mathematical
literacy, scientific literacy and reading literacy (as opposed to purely
mathematics, science and reading), in order to support learners’ abilities to
engage successfully with these subjects in everyday contexts.
Related to this point, there was evidence across all three subjects that learners
may find it difficult to combine information from different sources in solving
problems. This includes information given in related text documents, and that in
related text and graphics. A particular issue seemed to relate to making specific
links between pieces of information, reading at the level of detail, not simply for
overall meaning.
While learners seemed able to gain credit on items for which it was obvious
where to derive the solution, or the information underpinning the solution, some
seemed to find it harder to answer correctly when they had to identify for
themselves the relevant information needed to answer a question. Across all
three subjects, it would appear that many learners need to learn to navigate
information, identify what is relevant and apply their knowledge to it.
Learners also seemed to find it difficult to assimilate given information with other
information in the question (or perhaps combine it with their own knowledge) and
then apply that knowledge. This was evident for all three subjects and, in the
reading assessment, extrapolation beyond the text seemed to be particularly
problematic.

PISA 2012: Wales Item Analysis 29
All of the mathematical contexts proved challenging in one way or another:
Scientific (mathematics applied to the natural world, and/or science and
technology); Occupational (mathematics applied to the world of work; Societal
(mathematics related to community matters); and Personal (mathematics related
to the individual’s own activities or those of their family or peer group).
Learners seemed to have particular difficulty with mathematics items requiring
them to generate and manipulate formulae, generalise from a given situation,
reduce algebraic expressions and apply geometrical knowledge.
Many also omitted a high proportion of items requiring them to apply their
mathematical skills. As such, it might be worth seeking more classroom
emphasis on the application of mathematical skills, particularly in a range of real-
life contexts.
6.3 Assessment skills
The items omitted by higher percentages of learners in Wales tended to be
constructed response items: many learners appeared more willing to attempt
selected response items. This could mean either that those learners did not have
the skills required to tackle constructed response questions, or it could be that
they had the skills but simply chose to prioritise selected response questions in a
timed-assessment situation. Of course, even if the latter were the case, this
would suggest that some learners perceived selected response items to require
less effort. That may not necessarily be the case, given that many of the multiple
choice items required learners to assimilate information from different sources,
and apply their own knowledge to it, which many clearly found challenging,
resulting in high no credit rates on some of those questions.
It may be that some learners need greater encouragement to think problems
through (or more experience of doing so), rather than making an intuitive
approximation or guess. This would benefit their performance on both
constructed and selected assessment items, and also on their literacy in these
subjects more generally. In terms of assessment, learners might overestimate
their chances of success when they attempt a selected response item they are
not sure about: complex multiple choice items, for example, may not give
separate credit for each true/false or yes/no statement, but may apply credit
across the item as a whole, making it harder to gain credit than learners might
anticipate.
Across the subjects, where partial credit was achieved, the scoring criteria
indicated that learners would typically have given an incomplete response,
perhaps omitting a key component of the question or giving a description that
was not sufficiently precise to gain credit. Some learners might find it useful to
learn to pay more attention to the detail of the problem and question. This is a
useful skill not only during assessments, of course, but also for life.

30 PISA 2012: Wales Item Analysis
7 References
OECD (2013). PISA 2012 Assessment and Analytical Framework: Mathematics, Reading, Science, Problem Solving and Financial Literacy. Paris: OECD Publishing [online]. Available: http://dx.doi.org/10.1787/9789264190511-en [31 July, 2014].
PISA 2012: Wales Item Analysis 31
NFER ref. PQUK ISBN. 978-1-910008-54-6