
Wages, productivity and “structural” inflationin emerging ... · Wages, productivity and...
23
BIS Papers No 49 53 Wages, productivity and “structural” inflation in emerging market economies Dubravko Mihaljek and Sweta Saxena 1 1. Introduction Wage and price setting in advanced economies is well documented in the literature, but little work has been done on this topic for the emerging market economies. The aim of this paper is to start filling this gap by discussing how central banks in emerging market economies (EMEs) take account of wage inflation, productivity and some structural characteristics of their economies in analysing inflation. Keeping the growth of real wages in line with labour productivity is widely viewed as a necessary condition for long-term macroeconomic stability – it helps preserve country competitiveness while limiting inflationary pressures and risk of a wage-price spiral. Yet increases in real wages in EMEs often exceed productivity gains. In recent years, many observers have highlighted skilled labour shortages, spillovers from terms-of-trade shocks and loose public sector wage policy as factors driving real wage growth above labour productivity. Other possible explanations are rapid urbanisation; gradual transformation of the “grey” economy into official economic activity; and rapid productivity growth of the tradable goods sector, in which the resulting fast growth of wages spreads to the rest of the economy, where prices are insulated from international competition and productivity grows more slowly. We proceed by providing a simple analytical framework for integrating wages, productivity and certain structural features of EMEs in the analysis of inflation (Section 2). We then discuss various data issues that central banks confront in empirical applications of such frameworks (Section 3). Finally, we illustrate some key developments in wages, productivity and consumer price inflation for a sample of EMEs participating in this meeting (Section 4). The appendix provides central bank responses to a questionnaire on the measurement of wage and productivity data and on the significance of various institutional and structural characteristics of labour and product markets in central bank assessments of inflation. 2. Analytical framework Consider a simple aggregate model of the economy with a Cobb-Douglas constant-returns- to-scale production function, 1 K AL Y (1) where Y is output, A is total factor productivity, L and K are labour and capital inputs, and γ is the labour elasticity of output (labour intensity). The profit function for this economy is given by: Π = PY – RK – WL (2) 1 The authors thank Jimmy Shek for excellent research assistance, and they thank Stephen Cecchetti, Alejandro Jara, Ramon Moreno, Camilo Tovar, Philip Turner and participants of the Deputy Governors’ Meeting for comments on an earlier draft of this paper.
-
Upload
nguyenthuy -
Category
Documents
-
view
219 -
download
2
Transcript of Wages, productivity and “structural” inflationin emerging ... · Wages, productivity and...
BIS Papers No 49 53
Wages, productivity and “structural” inflation in emerging market economies
Dubravko Mihaljek and Sweta Saxena1
1. Introduction
Wage and price setting in advanced economies is well documented in the literature, but little work has been done on this topic for the emerging market economies. The aim of this paper is to start filling this gap by discussing how central banks in emerging market economies (EMEs) take account of wage inflation, productivity and some structural characteristics of their economies in analysing inflation.
Keeping the growth of real wages in line with labour productivity is widely viewed as a necessary condition for long-term macroeconomic stability – it helps preserve country competitiveness while limiting inflationary pressures and risk of a wage-price spiral. Yet increases in real wages in EMEs often exceed productivity gains. In recent years, many observers have highlighted skilled labour shortages, spillovers from terms-of-trade shocks and loose public sector wage policy as factors driving real wage growth above labour productivity. Other possible explanations are rapid urbanisation; gradual transformation of the “grey” economy into official economic activity; and rapid productivity growth of the tradable goods sector, in which the resulting fast growth of wages spreads to the rest of the economy, where prices are insulated from international competition and productivity grows more slowly.
We proceed by providing a simple analytical framework for integrating wages, productivity and certain structural features of EMEs in the analysis of inflation (Section 2). We then discuss various data issues that central banks confront in empirical applications of such frameworks (Section 3). Finally, we illustrate some key developments in wages, productivity and consumer price inflation for a sample of EMEs participating in this meeting (Section 4). The appendix provides central bank responses to a questionnaire on the measurement of wage and productivity data and on the significance of various institutional and structural characteristics of labour and product markets in central bank assessments of inflation.
2. Analytical framework
Consider a simple aggregate model of the economy with a Cobb-Douglas constant-returns-to-scale production function,
1KALY (1)
where Y is output, A is total factor productivity, L and K are labour and capital inputs, and γ is the labour elasticity of output (labour intensity). The profit function for this economy is given by:
Π = PY – RK – WL (2)
1 The authors thank Jimmy Shek for excellent research assistance, and they thank Stephen Cecchetti,
Alejandro Jara, Ramon Moreno, Camilo Tovar, Philip Turner and participants of the Deputy Governors’ Meeting for comments on an earlier draft of this paper.

54 BIS Papers No 49
where Π, P, R and W are, respectively, the profit, the price of output, the interest rate (or the capital rental price) and the wage. If product and factor markets operate under conditions of perfect competition, profit maximisation implies that the marginal product of labour and capital are equal to the wage and the interest rate
1
LKAPW (3)
KLAPR )1( (4)
Solving equation (1) for (K/L) and substituting into (3) and (4) yields:
LYPW (3’)
KYPR )1( (4’)
A useful property of the Cobb-Douglas constant-returns-to-scale production function is that the labour share of output, or the real unit labour cost, is equivalent to the labour elasticity of output, γ – thus, from (3’), unit labour costs can be expressed as:
YPLW
(3’’)
Taking the logs, totally differentiating (3’’), and assuming that γ is constant gives the familiar condition that the growth of real wages should not exceed the growth of average labour productivity:
^
ˆˆ
LYpw or
^
ˆˆ
LYpw (5)
where the lower-case letters stand for variables expressed in logarithms and the hat symbol (^) denotes the growth rates of variables, dx/x. The simplest way to monitor the emergence of wage pressures is therefore to compare real wage growth with labour productivity growth.
One simple extension of this model is to assume that the output price is fixed in the world market, so that domestic inflation is given by the sum of changes in the world price measured
in foreign currency )ˆ( *p and changes in the exchange rate )ˆ(e , epp ˆˆˆ * :
^
* )ˆˆ(ˆ
LYepw (6)
Different versions of (6) were widely used in the 1970s and the 1980s in OECD countries. At that time, the coincidence of oil shocks and a sharp fall in the growth of labour productivity led to a search for the so-called “warranted” rate of wage growth – a measure of nominal wage change that, given productivity changes and terms-of-trade developments, would be associated with stability in the share of wages in national income.
Analysis based on economy-wide measures of wage and productivity growth is often usefully supplemented by more disaggregated measures derived from two-sector models. One of the most widely used two-sector models is that of differential productivity growth in tradable and non-tradable industries.2 Historically, productivity growth in the tradable goods sector has
2 Appendix Box A1 discusses other two-sector models potentially relevant for the analysis of inflation in EMEs.
BIS Papers No 49 55
been faster than in the non-tradable goods sector. By the law of one price, the prices of tradables tend to get equalised across countries. Higher productivity in the tradable goods sector will bid up wages in that sector and, with labour being mobile, wages in the entire economy will rise. In general, to pay the higher wages, producers of non-tradables will raise the relative price of their goods, which will lead to an increase in the overall price level in the economy.
Starting from the definition of consumer price inflation ( p ) as a weighted average of tradable
( Tp ) and non-tradable ( NTp ) goods price inflation: NTT ppp ˆ)1(ˆˆ (7)
where α is the share of tradable goods in the CPI basket, and using Cobb-Douglas production functions for tradables and non-tradables, the difference between inflation rates of non-tradables and tradables can be expressed as the difference between the growth rates of
average labour productivity in tradable ( Ta ) and non-tradable ( NTa ) industries:
NTTTNT
aapp ˆˆˆˆ
(8)
where γ and δ are labour intensities (ie factor income shares) in tradable and non-tradable industries.3 Assuming that γ = δ, and using the above decomposition of the growth rate of tradable prices into the growth rate of world prices of tradables, equations (3) and (4) can be combined to give the following expression for inflation in a two-sector open economy model:
)ˆˆ)(1()ˆˆ(ˆ * NTTT aaepp (9)
Equation (9) implies that the rate of inflation can be decomposed into “imported” inflation
( epT ˆˆ * ) and “structural” inflation )ˆˆ)(1( NTT aa , where the latter is determined by the
sectoral productivity trends (assuming that factor income shares are constant). This equation provides several valuable insights for the analysis of inflation in EMEs:
Changes in world market prices of tradables and exchange rates will be fully transmitted to domestic inflation at given rates of productivity growth and weights of tradables in the consumption basket.
If world market prices for tradables and the exchange rate are constant (or move at the same rate in the opposite direction), domestic inflation will increase by a fraction (1–) of the sectoral productivity growth differential.
Faster productivity growth of non-tradables will decrease the rate of inflation, while faster productivity growth of tradables will increase inflation. The intuition behind this conclusion is that faster productivity growth for tradables results in a faster rate of wage increase for both sectors, which speeds up the rate of price increase for non-tradables without affecting the price trend for tradables, the latter being determined by the path of world market prices and the exchange rate.
Countries with particularly large differences in productivity growth between the tradable and non-tradable sectors will, ceteris paribus, have higher inflation relative to countries with small differences in sectoral productivity growth.
3 Versions of this model of “structural” inflation were developed independently by Balassa (1964), Samuelson
(1964), Baumol and Bowen (1966) and several Scandinavian economists (see eg Aukrust (1977) and Lindbeck (1979)). For a derivation of the above equations, see eg Mihaljek and Klau (2004).
56 BIS Papers No 49
The inflation differential between two countries can be expressed as the sum of changes in the exchange rate and (weighted) productivity growth differentials between the two sectors at home and abroad (foreign country variables are denoted by the symbol *):
]ˆˆ)[1(]ˆˆ)[1(ˆˆˆ **** NTTNTT aaaaepp (10)
When used as a positive theory of inflation, the basic insight of this model is that the rate of wage increase tends to adjust for the “room” for wage increase in the tradable sector, as defined by the sum of the (exogenous) increase in world market prices for tradables and the (exogenous) rate of productivity increase in that sector.
A broader insight is that not all inflation in the catching-up economies is “pathological” – faster productivity growth in industries producing tradable goods and services is part of the “physiology” of economic development (Padoa-Schioppa (2003)). If labour and capital markets are unencumbered, there is not much that monetary policy could or should do to control this source of inflation. This insight seems particularly relevant for the economies moving rapidly towards higher living standards – for instance, as a result of economic and financial integration with a neighbouring advanced economy.
Over the years, such aggregate models have been extended by providing a much richer description of the micro foundations of labour and product markets. One widely used characterisation of the joint behaviour of wage and price inflation is a model including a “price equation” and a “wage equation” such as:
LYwp (11)
zepLYuw )( * (12)
where μ is the mark-up resulting from imperfect competition in the goods market; β measures the responsiveness of wages to unemployment, u; θ measures the pass-through from import prices to wages; and z includes a range of institutional factors such as unemployment benefits, minimum wages, restrictions on firing or hiring, the degree of unionisation, the tax wedge (in terms of earnings and payroll taxes), skills mismatches and information problems.4 Equation (11), which describes labour demand, states that firms set prices at a markup, μ, over unit labour costs. Equation (12), which describes labour supply, states that the workers’ desired wage level depends on the unemployment rate, labour productivity, the pass-through from terms-of-trade shocks to wages, and various institutional characteristics of the labour market, which may lead to nominal wage rigidities.
These models have been used to test a wide variety of hypotheses about wage and price formation, including whether wage-price dynamics are consistent with the view that prices are set after wages are known (the so-called “cost push” view of inflation – see eg Angeloni et al (2006)); the spillover effects of nominal adjustments across labour and product markets (the “wage spiral” – see eg Kandil (2003)); the extent to which changes in the degree of price flexibility modify the ranking of alternative monetary policy regimes in an open economy framework (see eg Devereux and Engel (2003)). To support the implementation of monetary policy, several central banks, including a few in EMEs, have developed more fully specified dynamic stochastic general equilibrium (DSGE) models founded on the new open economy macroeconomics paradigm advanced by Obstfeld and Rogoff (1996).5
4 For a more complete specification of this model, see eg Blanchard and Katz (1997) or Layard, Nickell and
Jackman (2005). For an empirical application to the emerging European economies, see Goretti (2008). 5 For an overview of the use of DSGE models in central banks, see Tovar (2008).
BIS Papers No 49 57
3. Data issues
The advanced economies have a long tradition of analysing the wage-price mechanism in assessing inflation coming from the labour market and in forecasts of inflation. For example, the OECD has published its annual Employment Outlook for several decades now.6 The European Commission started a similar annual exercise in the early 2000s.7
Countries in the euro area, for instance, focus on three main measures of the growth in nominal labour costs: negotiated wages, the labour cost index and compensation per employee.8 The assessment of inflationary pressures stemming from the labour market focuses on nominal unit labour costs by quantifying their contribution to the increase in the final demand deflator. In addition, to separate the influence of external and domestic cost components, the final demand deflator is decomposed into import deflator and income components of the GDP deflator, ie nominal unit labour costs, gross operating surplus and net indirect taxes. The requirement that wage developments contribute to price stability translates into the condition that nominal increases in compensation per employee should not exceed the sum of productivity and the ECB inflation target of close to, but below, 2%. The application of this rule distinguishes between actual and long-term productivity and between the cyclical and long-term situations of the labour market.
The lack of good labour market data has until recently limited this type of analysis in most EMEs. For instance, many EMEs use payroll statistics or narrower estimates of employment instead of the more comprehensive labour survey data. That choice can lead to underestimation of the number of employees in the economy; the resulting overestimation of productivity can lead policymakers to conclude that a higher-than-warranted growth rate of wages is acceptable at a given rate of inflation.
Another frequent data problem in EMEs is the lack of adequate price deflators, which makes it difficult to identify the sources of external and domestic cost pressures. However, widespread adoption of inflation targeting frameworks by central banks has provided an incentive to compile better labour market data and has enabled central banks to use productivity and unit labour costs more widely in their inflation forecasts.
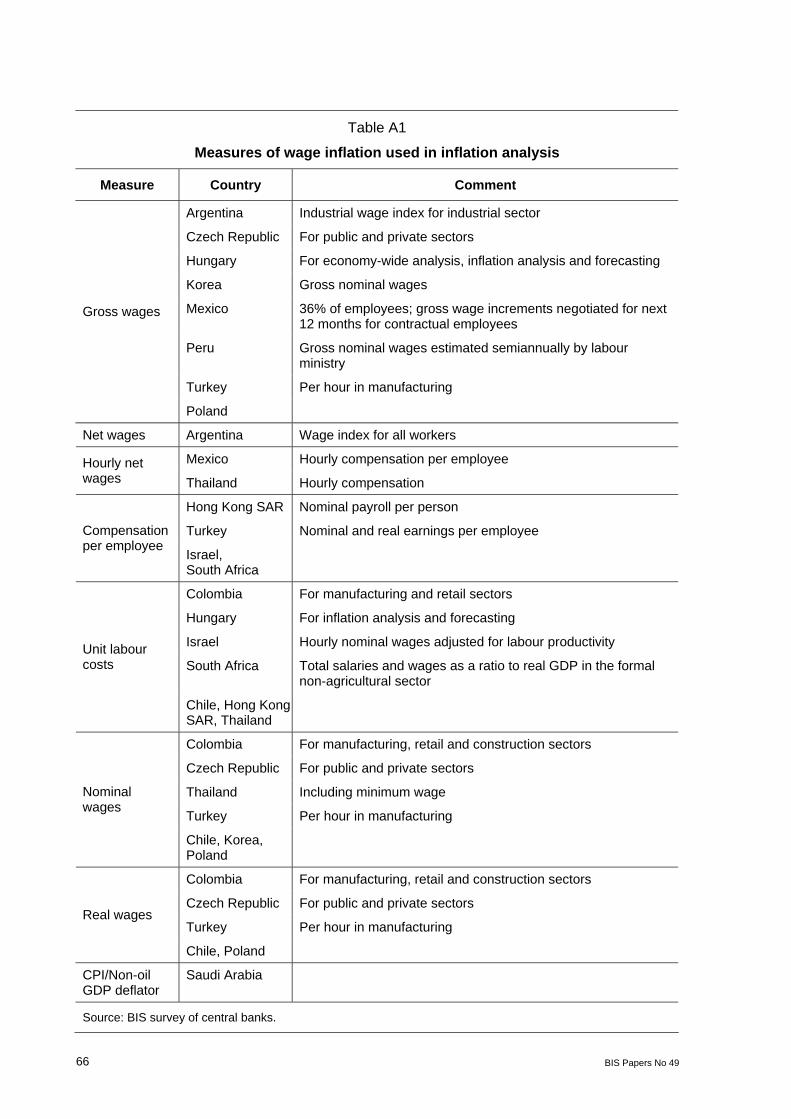
In the survey conducted among emerging market central banks participating at this meeting, central banks noted that they use a variety of measures of wage inflation for the gross wages whole economy (Hungary, Korea and Poland) and for individual sectors (eg industry for Argentina, public and private sectors for the Czech Republic) (see Appendix Table A1). Central banks also monitor hourly compensation (Israel, Mexico and Thailand), compensation per employee (Hong Kong SAR, Israel, South Africa and Turkey) and unit labour costs (Colombia, Hong Kong SAR, Hungary, South Africa and Thailand). They view an increase in any of these costs as a potential source of wage pressure that could spill over to higher prices. To gauge demand-side inflationary pressures, some central banks also track real wages (Colombia, the Czech Republic, Poland and Turkey).
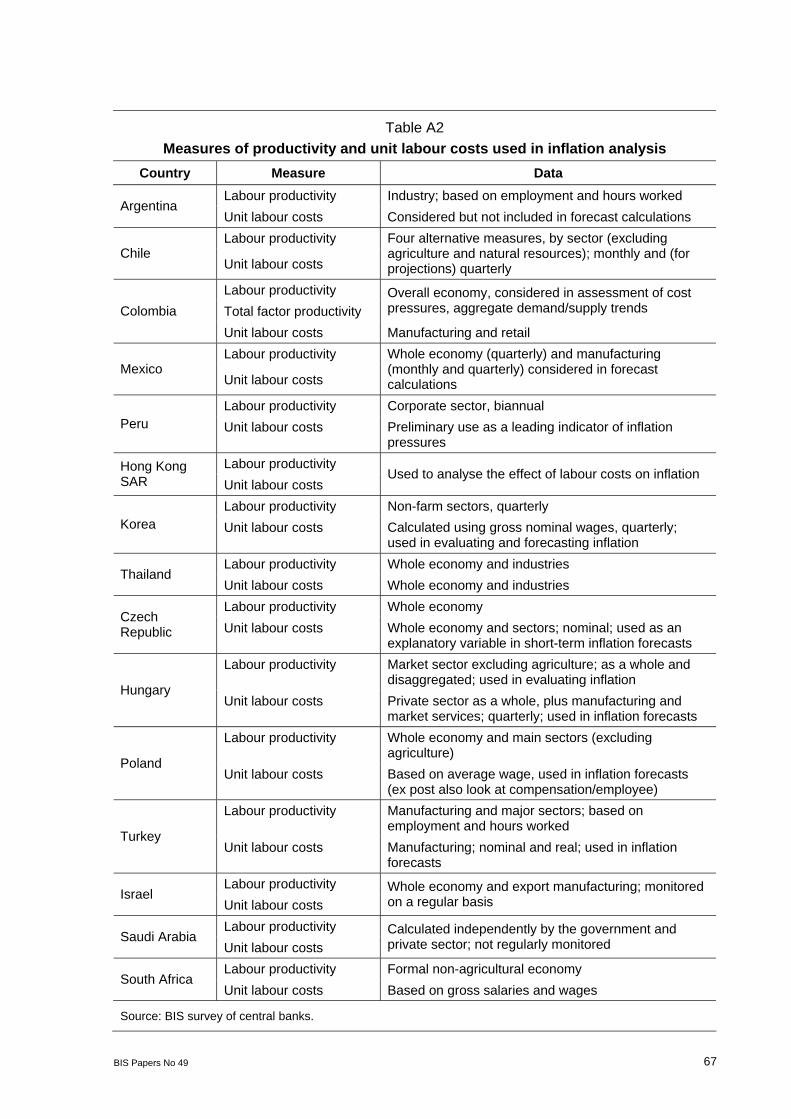
The majority of inflation targeting central banks in the sample (Chile, the Czech Republic, Hungary, Korea, Poland, Thailand and Turkey) follow labour productivity and unit labour
6 The reports for the past 20 years are available at
www.oecd.org/document/0/0,3343,en_2649_33927_40774656_1_1_1_37457,00.html. 7 See the annual series Labour market and wage developments at
http://ec.europa.eu/economy_finance/publications/specpub_list9266.htm. 8 Compensation per employee includes gross wages and salaries (ie wages plus employees’ social security
contributions) and employers’ social security contributions. When disaggregated, compensation per employee, together with negotiated wages, gives an indication of labour cost pressures coming from a particular sector (public/private, industry/services). The labour cost index (which does not cover government activities) captures the evolution of hourly labour costs, correcting for the changes in overtime hours and part-time employment.
58 BIS Papers No 49
cost measures very closely, using them in both short-term and medium-term forecasts of inflation (Appendix Table A2).9 Other inflation targeters (Colombia, Israel, Mexico, Peru and South Africa) use unit labour cost indicators mainly in the assessment of inflation trends rather than as an input for inflation forecasts. The central bank of Argentina (which is not an explicit inflation targeter) follows a similar approach. Inflation reports produced by central banks in all these countries analyse the labour market and wage developments.
Although many emerging market economies today face the combination of increased labour productivity (allowing higher nominal wages) and substantial terms-of-trade shocks, only a few EME central banks consider measures of “warranted” wage growth such as equation (6): in Colombia and Poland, warranted wage growth is considered in minimum wage negotiations; in Korea, it is calculated by the Korea Labour Institute; and in Israel, a measure of warranted wage growth is used to assess changes in business sector costs and competitiveness.10
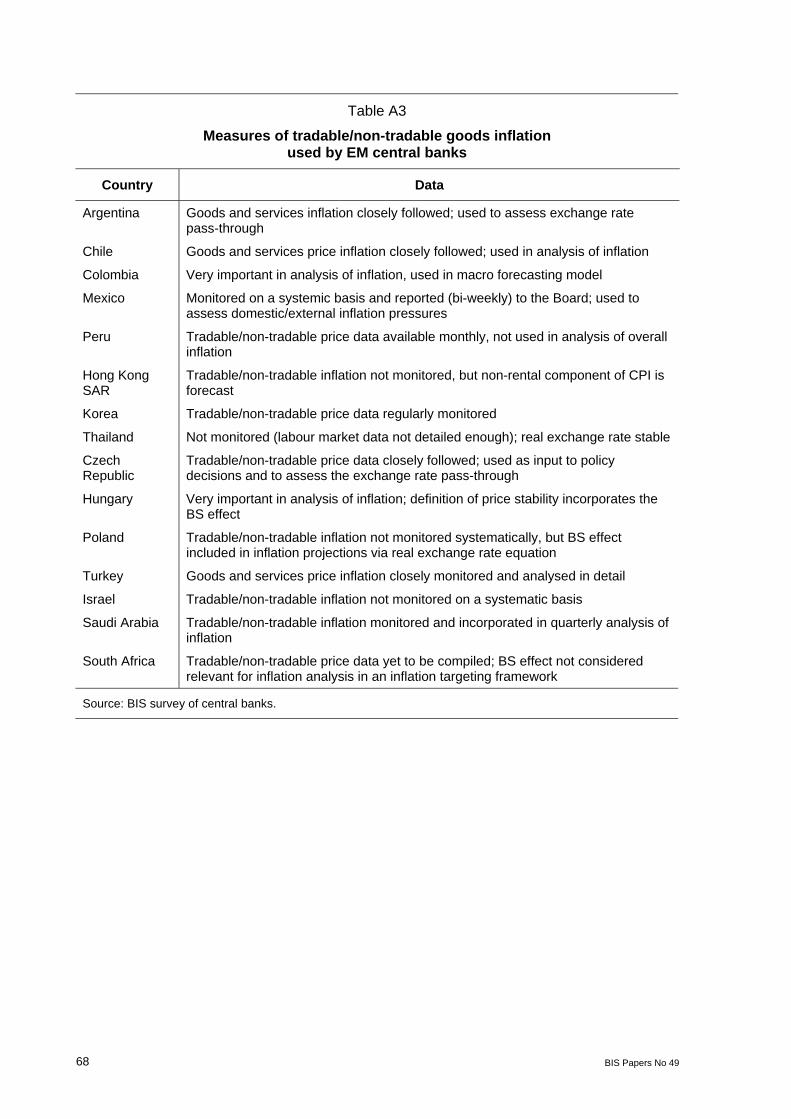
Measures of price inflation for tradables and non-tradables are widely used by central banks (Appendix Table A3), and they are monitored on a systematic basis except in Hong Kong SAR, Israel, Saudi Arabia, South Africa and Thailand. CPI aggregates of goods price inflation are often used to assess the extent of “imported” inflation and the pass-through of exchange rate changes into inflation; while the CPI aggregates of service price inflation are generally considered a good proxy for the domestic sources of inflation.
In Chile, Colombia, the Czech Republic, Hungary, Poland and Turkey, the split of inflation into tradable and non-tradable components is considered particularly important and is used in macro forecasting models, either directly or via the real exchange rate (as in Poland). Several central banks have also produced estimates of the Balassa-Samuelson effect (Chile, Colombia, the Czech Republic, Hungary, Israel). In Hungary, the definition of price stability incorporates the Balassa-Samuelson effect.
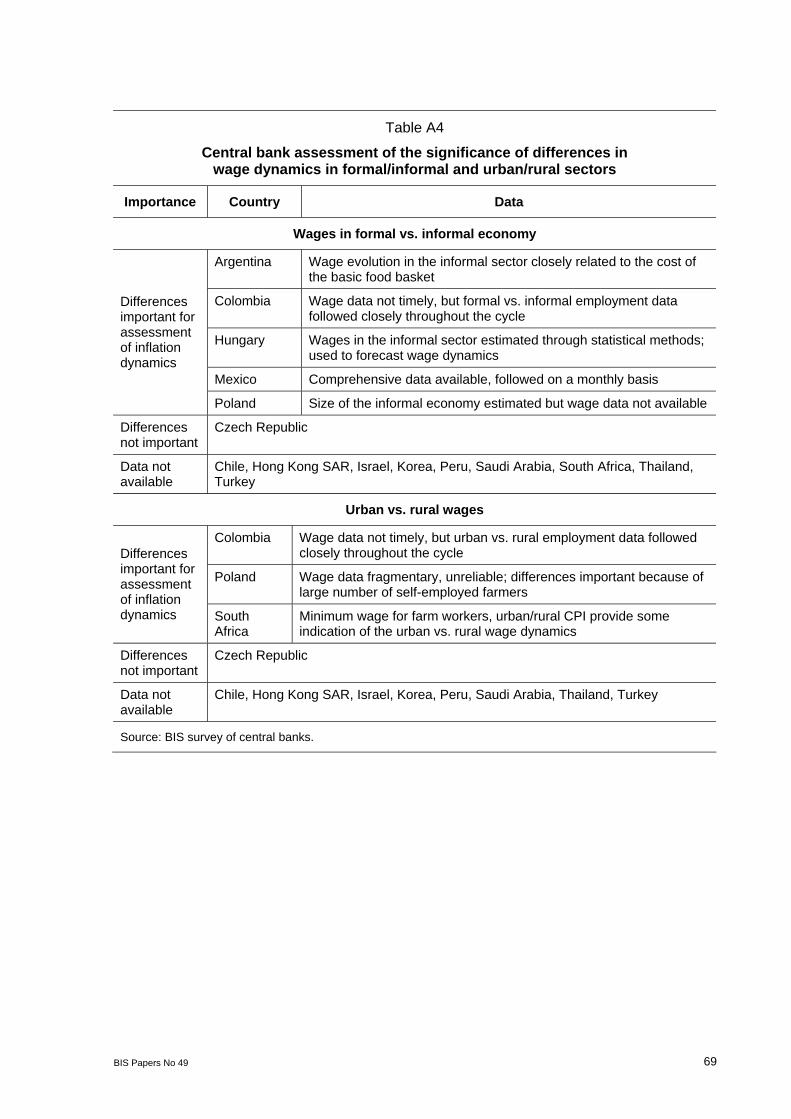
Only a few central banks seem to closely monitor the evolution of wage differences between formal and informal or urban and rural sectors (Appendix Table A4). One reason is the lack of data (eg in Chile, Hong Kong SAR, Israel, Korea, Peru, Saudi Arabia and Thailand); another is that these differences are not considered important (eg in the Czech Republic). In Hungary, wages in the informal sector are estimated by statistical methods and used to forecast wage dynamics in the entire economy (see Eppich and Lörincz (2007)). In Colombia, wage data for the informal and rural sectors are not timely, but employment trends for these two sectors are followed closely throughout the cycle (see Leibovich, Nigrinis and Ramos (2006)). In Poland, wage data for the rural sector are fragmentary and unreliable, but differences between urban and rural wages are considered to be important for overall wage dynamics because of the large number of self-employed farmers. In South Africa, minimum wages for farm workers and urban/rural CPI data provide some indication of the urban/rural wage gap and its impact on overall wages.
The relevance of institutional characteristics of the labour market for the assessment of inflation is generally smaller in the emerging markets than in advanced economies, and it is smaller today than it was a couple of decades ago. Wage indexation was quite common before the 1990s, when many emerging market countries experienced episodes of high inflation (see Box A2 in the Appendix for the experiences of Chile and Brazil). However, as a
9 Measures of labour productivity in manufacturing are available monthly and are widely used. For other sectors
as well as the whole economy, real output measures are generally available only quarterly and are used by inflation targeters for medium-term forecasts. Central banks also look closely at various time series for wages and employment (eg average wage vs compensation per employee, total employment vs hours worked). Information on the price deflators used to obtain estimates of real wages was not readily available.
10 See Barnea and Djivre (2004) and Lavi and Sussman (2001).
BIS Papers No 49 59
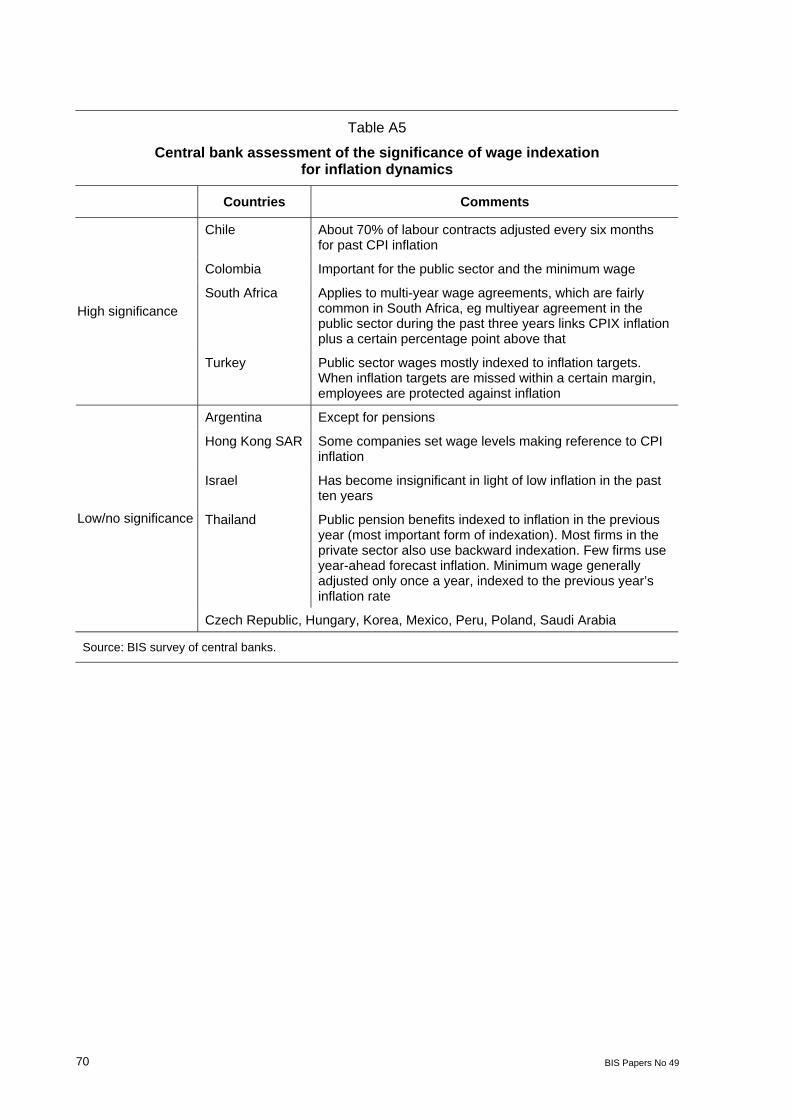
result of low and falling inflation in most EMEs, automatic wage indexation schemes are no longer significant (Appendix Table A5).
Certain exceptions nonetheless exist. Pensions (Argentina, Thailand) and public sector wages (Columbia, South Africa, Turkey) are still indexed to inflation. In Columbia, minimum wages are indexed because of the high percentage of workers earning the minimum wage and its use in the setting of other wages; in Thailand, minimum wages are generally adjusted once a year according to the previous year’s inflation rate. In Chile, 70% of labour contracts are adjusted every six months according to past CPI inflation. Israel abolished the cost of living adjustment for senior officials in the public sector in 1996, but it established a mechanism that links the allowances of other employees – and, since 2008, unfunded pension payments – to the CPI. In Hungary, past and expected inflation are taken into account in the wage setting process. In Poland, inflation is taken into account in public sector wage negotiations. In Thailand, most firms in the private sector also use backward indexation. Some firms even use year-ahead forecasts of inflation for wage indexation. Inflation also affects wage agreements made through collective bargaining in Korea and South Africa, although no explicit indexation schemes are used there.
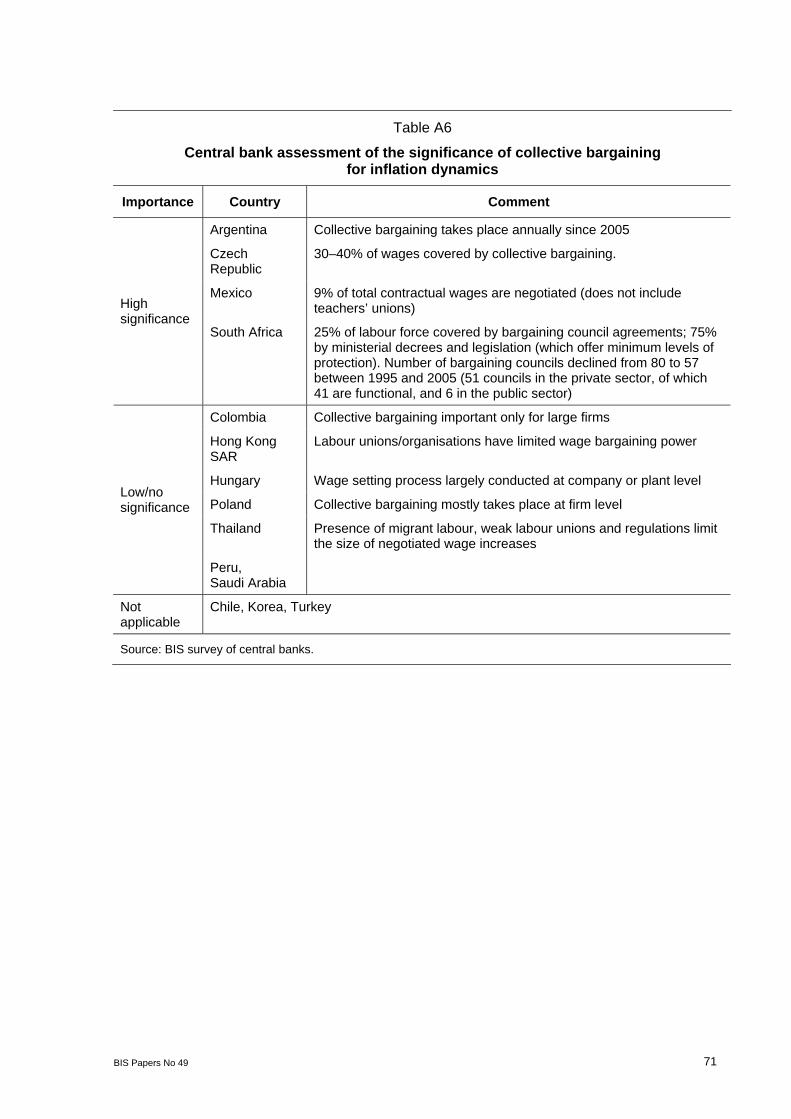
With the exception of Argentina, the Czech Republic, Mexico and South Africa, most central banks have concluded that collective bargaining and negotiated wages were no longer important for the dynamics of inflation (Appendix Table A6).11 In South Africa, the number of bargaining councils was in decline, and only 25% of the active labour force was covered by bargaining council agreements. Even where labour unions are more active, their bargaining powers have diminished. In Hungary, for instance, the tripartite National Interest Reconciliation Council only provides recommendations for wage increases and sets the legally guaranteed minimum wage. In Thailand, the presence of migrant labour, weak labour unions and government regulations considerably limit the impact of collective bargaining on economy-wide wages.
4. Empirical illustrations
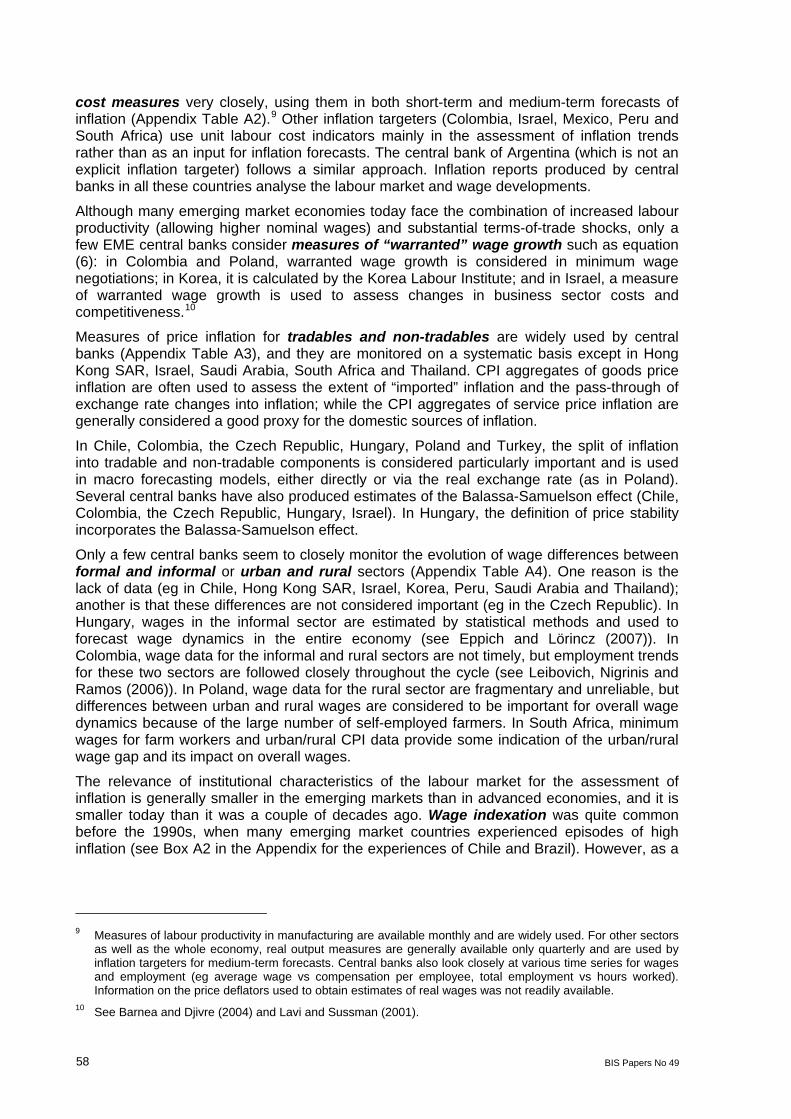
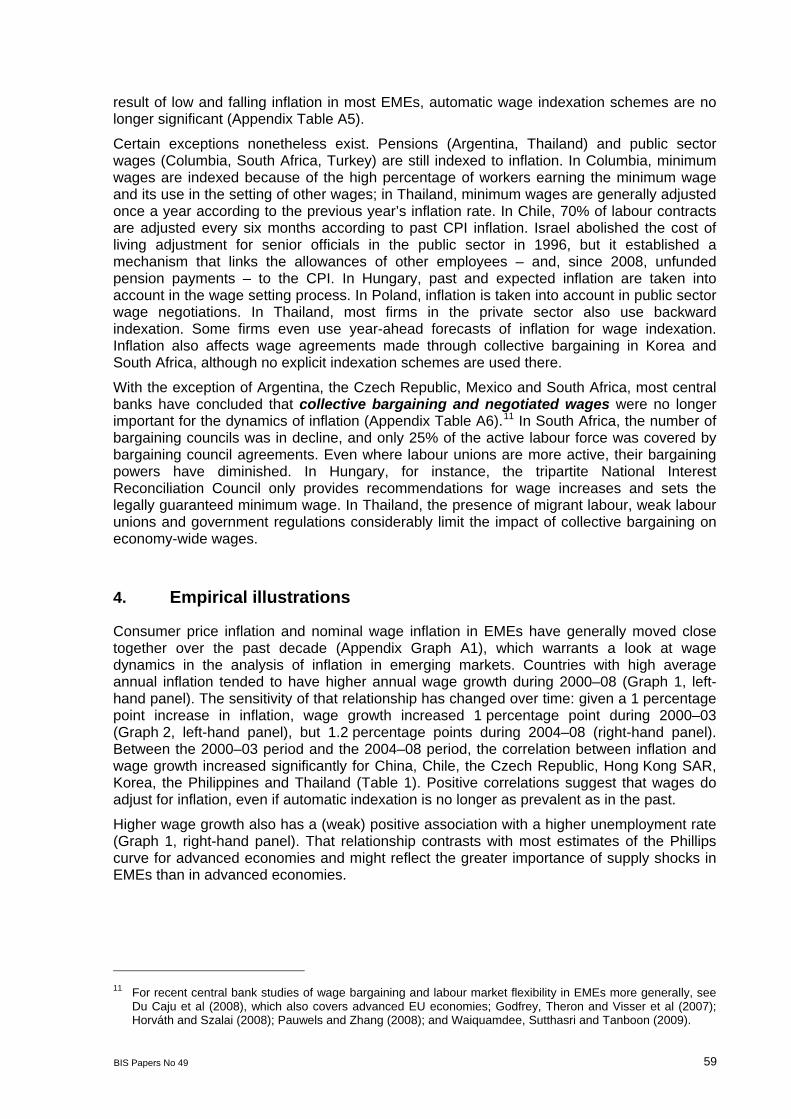
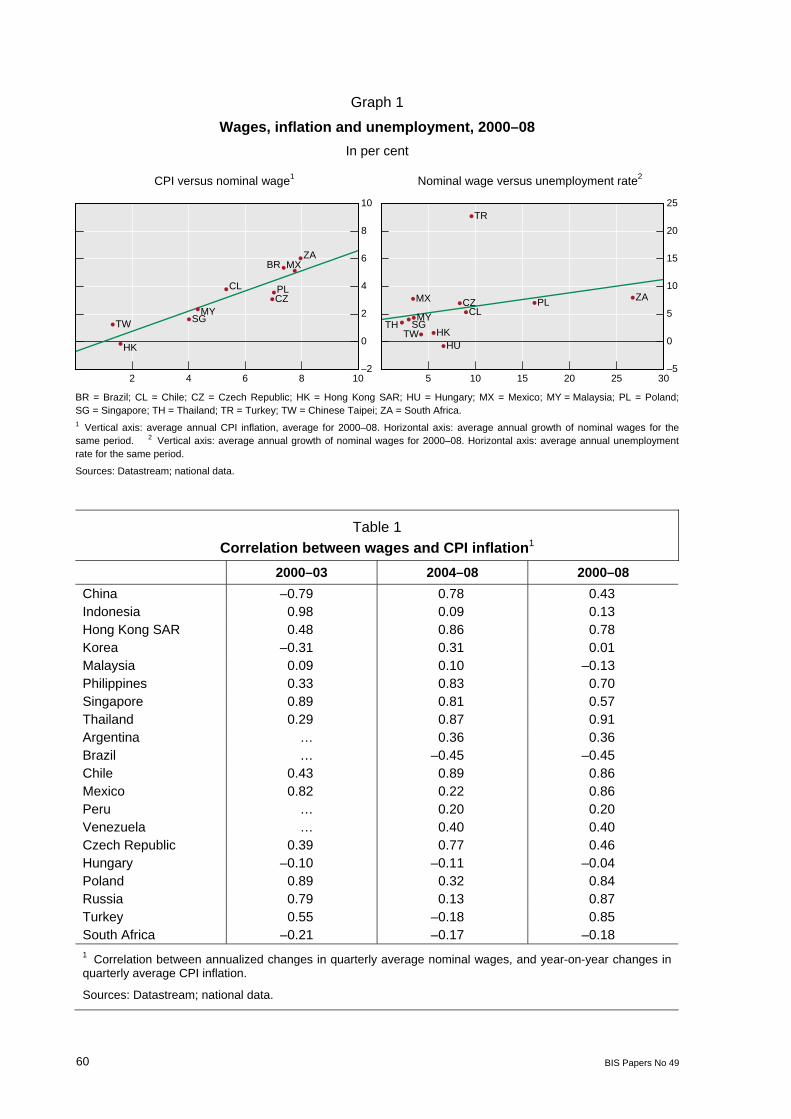
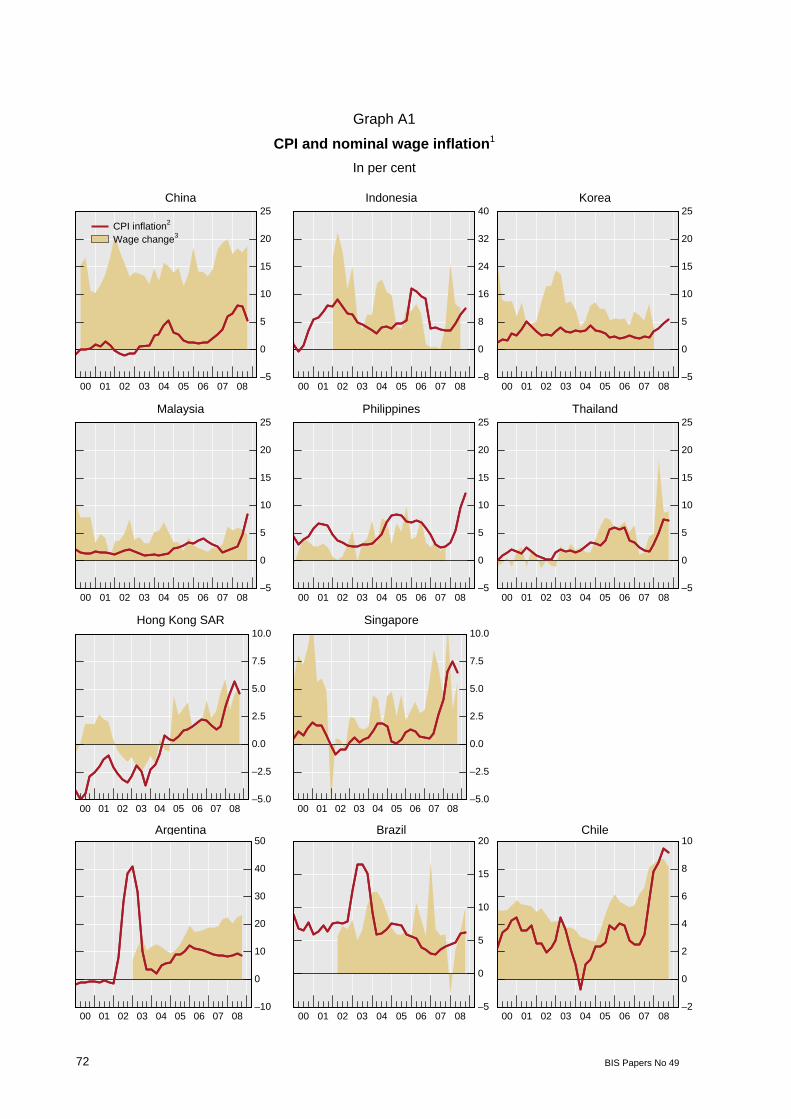
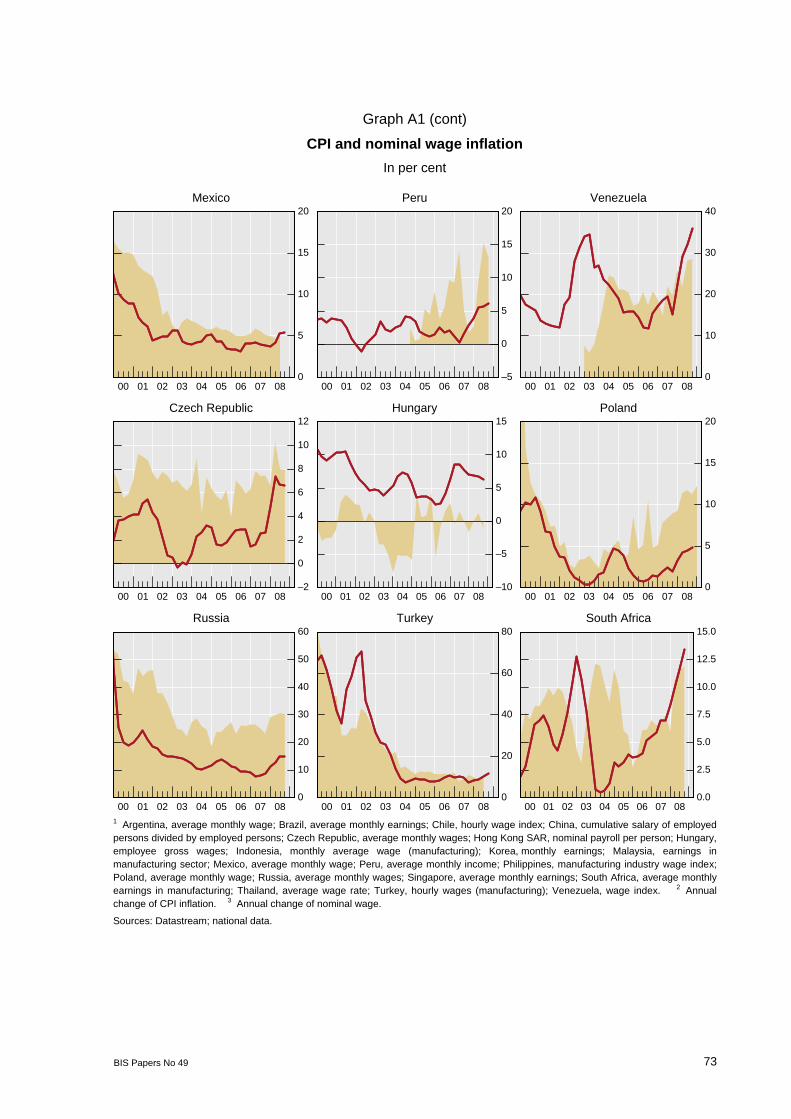
Consumer price inflation and nominal wage inflation in EMEs have generally moved close together over the past decade (Appendix Graph A1), which warrants a look at wage dynamics in the analysis of inflation in emerging markets. Countries with high average annual inflation tended to have higher annual wage growth during 2000–08 (Graph 1, left-hand panel). The sensitivity of that relationship has changed over time: given a 1 percentage point increase in inflation, wage growth increased 1 percentage point during 2000–03 (Graph 2, left-hand panel), but 1.2 percentage points during 2004–08 (right-hand panel). Between the 2000–03 period and the 2004–08 period, the correlation between inflation and wage growth increased significantly for China, Chile, the Czech Republic, Hong Kong SAR, Korea, the Philippines and Thailand (Table 1). Positive correlations suggest that wages do adjust for inflation, even if automatic indexation is no longer as prevalent as in the past.
Higher wage growth also has a (weak) positive association with a higher unemployment rate (Graph 1, right-hand panel). That relationship contrasts with most estimates of the Phillips curve for advanced economies and might reflect the greater importance of supply shocks in EMEs than in advanced economies.
11 For recent central bank studies of wage bargaining and labour market flexibility in EMEs more generally, see
Du Caju et al (2008), which also covers advanced EU economies; Godfrey, Theron and Visser et al (2007); Horváth and Szalai (2008); Pauwels and Zhang (2008); and Waiquamdee, Sutthasri and Tanboon (2009).
60 BIS Papers No 49
Graph 1
Wages, inflation and unemployment, 2000–08
In per cent
CPI versus nominal wage1 Nominal wage versus unemployment rate2
HK
MYSGTW
BR
CL
MX
CZPL
ZA
–2
0
2
4
6
8
10
2 4 6 8 10
HK
MYSGTH
TW
CLMX CZ
HU
PL
TR
ZA
–5
0
5
10
15
20
25
5 10 15 20 25 30
BR = Brazil; CL = Chile; CZ = Czech Republic; HK = Hong Kong SAR; HU = Hungary; MX = Mexico; MY = Malaysia; PL = Poland; SG = Singapore; TH = Thailand; TR = Turkey; TW = Chinese Taipei; ZA = South Africa. 1 Vertical axis: average annual CPI inflation, average for 2000–08. Horizontal axis: average annual growth of nominal wages for the same period. 2 Vertical axis: average annual growth of nominal wages for 2000–08. Horizontal axis: average annual unemployment rate for the same period.
Sources: Datastream; national data.
Table 1
Correlation between wages and CPI inflation1
2000–03 2004–08 2000–08
China –0.79 0.78 0.43 Indonesia 0.98 0.09 0.13 Hong Kong SAR 0.48 0.86 0.78 Korea –0.31 0.31 0.01 Malaysia 0.09 0.10 –0.13 Philippines 0.33 0.83 0.70 Singapore 0.89 0.81 0.57 Thailand 0.29 0.87 0.91 Argentina … 0.36 0.36 Brazil … –0.45 –0.45 Chile 0.43 0.89 0.86 Mexico 0.82 0.22 0.86 Peru … 0.20 0.20 Venezuela … 0.40 0.40 Czech Republic 0.39 0.77 0.46 Hungary –0.10 –0.11 –0.04 Poland 0.89 0.32 0.84 Russia 0.79 0.13 0.87 Turkey 0.55 –0.18 0.85 South Africa –0.21 –0.17 –0.18 1 Correlation between annualized changes in quarterly average nominal wages, and year-on-year changes in quarterly average CPI inflation.
Sources: Datastream; national data.
BIS Papers No 49 61
Graph 2
Changes in CPI inflation and nominal wages1
In per cent
2000–03 2004–08
HK
MYSG
TW
CL
MX
CZPL
ZA
0
2
4
6
8
10
12
–2 0 2 4 6 8
HK
MYSG
TW
BR
CLMX
CZPL ZA
0
2
4
6
8
10
12
–2 0 2 4 6 8
BR = Brazil; CL = Chile; CZ = Czech Republic; HK = Hong Kong SAR; HU = Hungary; MX = Mexico; MY = Malaysia; PL = Poland; SG = Singapore; TH = Thailand; TR = Turkey; TW = Chinese Taipei; ZA = South Africa. 1 Vertical axis: average annual growth of nominal wages; horizontal axis: average annual CPI inflation for the same period.
Sources: Datastream; national data.
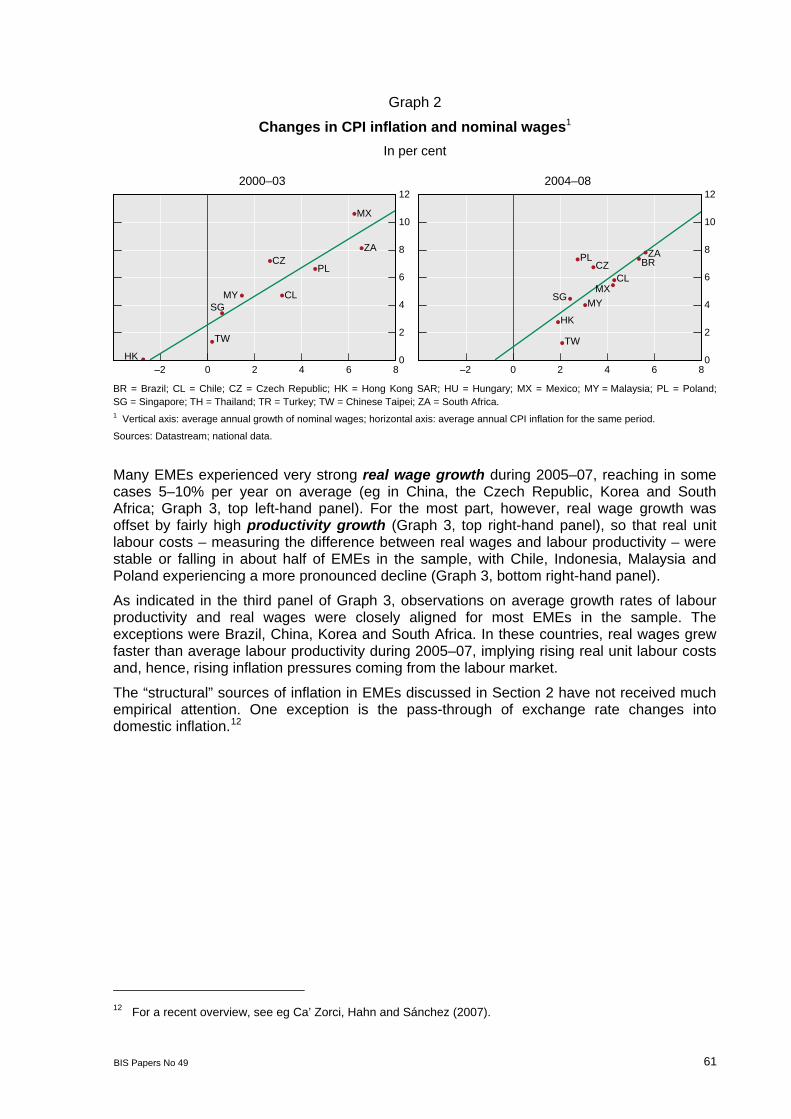
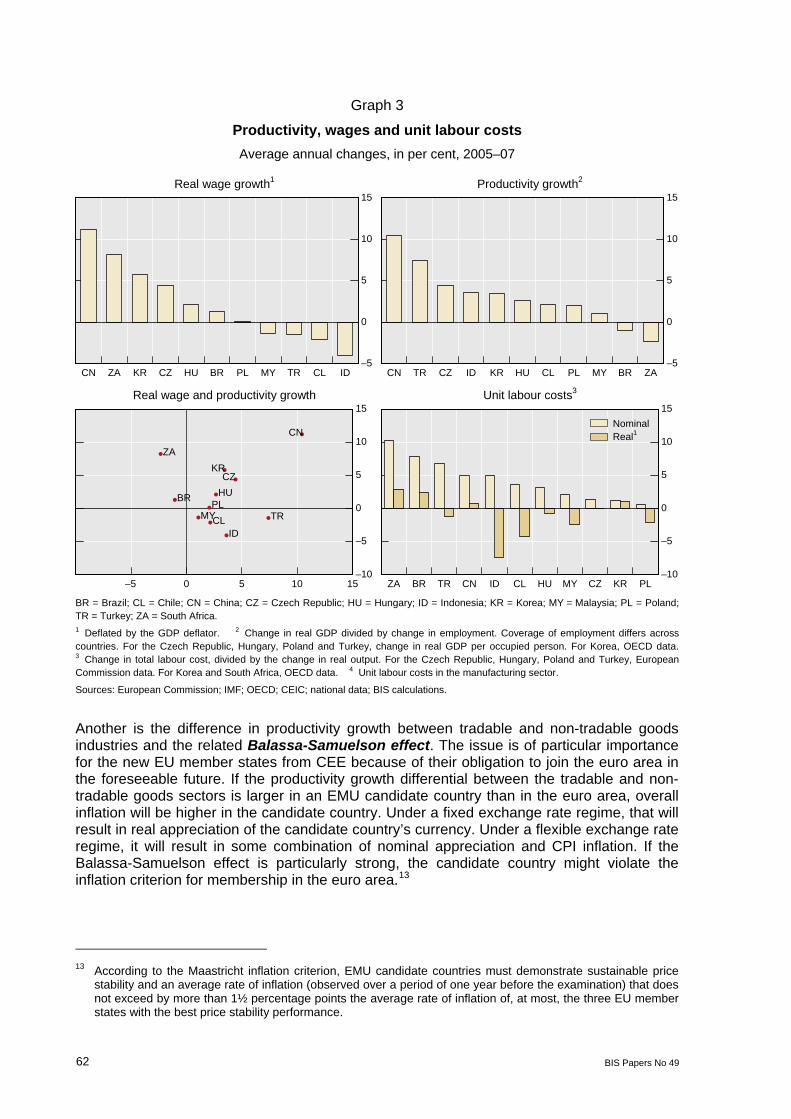
Many EMEs experienced very strong real wage growth during 2005–07, reaching in some cases 5–10% per year on average (eg in China, the Czech Republic, Korea and South Africa; Graph 3, top left-hand panel). For the most part, however, real wage growth was offset by fairly high productivity growth (Graph 3, top right-hand panel), so that real unit labour costs – measuring the difference between real wages and labour productivity – were stable or falling in about half of EMEs in the sample, with Chile, Indonesia, Malaysia and Poland experiencing a more pronounced decline (Graph 3, bottom right-hand panel).
As indicated in the third panel of Graph 3, observations on average growth rates of labour productivity and real wages were closely aligned for most EMEs in the sample. The exceptions were Brazil, China, Korea and South Africa. In these countries, real wages grew faster than average labour productivity during 2005–07, implying rising real unit labour costs and, hence, rising inflation pressures coming from the labour market.
The “structural” sources of inflation in EMEs discussed in Section 2 have not received much empirical attention. One exception is the pass-through of exchange rate changes into domestic inflation.12
12 For a recent overview, see eg Ca’ Zorci, Hahn and Sánchez (2007).
62 BIS Papers No 49
Graph 3
Productivity, wages and unit labour costs
Average annual changes, in per cent, 2005–07
Real wage growth1 Productivity growth2
–5
0
5
10
15
CN ZA KR CZ HU BR PL MY TR CL ID–5
0
5
10
15
CN TR CZ ID KR HU CL PL MY BR ZA
Real wage and productivity growth Unit labour costs3
CN
ID
KR
MY
BR
CL
HUPL
CZ
TR
ZA
–10
–5
0
5
10
15
–5 0 5 10 15–10
–5
0
5
10
15
ZA BR TR CN ID CL HU MY CZ KR PL
NominalReal1
BR = Brazil; CL = Chile; CN = China; CZ = Czech Republic; HU = Hungary; ID = Indonesia; KR = Korea; MY = Malaysia; PL = Poland; TR = Turkey; ZA = South Africa. 1 Deflated by the GDP deflator. 2 Change in real GDP divided by change in employment. Coverage of employment differs acrosscountries. For the Czech Republic, Hungary, Poland and Turkey, change in real GDP per occupied person. For Korea, OECD data. 3 Change in total labour cost, divided by the change in real output. For the Czech Republic, Hungary, Poland and Turkey, EuropeanCommission data. For Korea and South Africa, OECD data. 4 Unit labour costs in the manufacturing sector.
Sources: European Commission; IMF; OECD; CEIC; national data; BIS calculations.
Another is the difference in productivity growth between tradable and non-tradable goods industries and the related Balassa-Samuelson effect. The issue is of particular importance for the new EU member states from CEE because of their obligation to join the euro area in the foreseeable future. If the productivity growth differential between the tradable and non-tradable goods sectors is larger in an EMU candidate country than in the euro area, overall inflation will be higher in the candidate country. Under a fixed exchange rate regime, that will result in real appreciation of the candidate country’s currency. Under a flexible exchange rate regime, it will result in some combination of nominal appreciation and CPI inflation. If the Balassa-Samuelson effect is particularly strong, the candidate country might violate the inflation criterion for membership in the euro area.13
13 According to the Maastricht inflation criterion, EMU candidate countries must demonstrate sustainable price
stability and an average rate of inflation (observed over a period of one year before the examination) that does not exceed by more than 1½ percentage points the average rate of inflation of, at most, the three EU member states with the best price stability performance.
BIS Papers No 49 63
This is not likely to be the case according to most studies – the Balassa-Samuelson effect is usually estimated to add around 0.2–2.0 percentage points to the CPI inflation (see eg Mihaljek and Klau (2008), Égert (2005), and Égert, Halpern and MacDonald (2006)), but for some countries with a fixed exchange rate regime the effect could be much larger. The authorities in such countries might therefore feel compelled to maintain, at least temporarily, relatively restrictive monetary and fiscal policies in order to meet the inflation criteria, which might dampen economic growth and job creation.
The literature has also identified some puzzles related to the operation of the Balassa-Samuelson effect. On the one hand, the evidence suggests that this effect is not the main driving force of the observed relatively high inflation rates of 3–6% per year in most CEE countries. On the other hand, although productivity growth in the tradable sectors has indeed been high, it has not led to correspondingly high inflation rates. Explanations of these puzzles include a trend increase in tradable prices due to quality improvements (Cincibuch and Podpiera (2006)); the role of regulated price adjustments in overall inflation; a disconnect between productivity growth and real wages in the manufacturing sector (Égert (2007)); incomplete wage equalisation and substantial productivity gains in market non-tradables; and the low share of market non-tradables in consumer price indices of CEE countries (Égert, Halpern and MacDonald (2006)).14
14 Several central banks participating in the meeting conducted studies of the Balassa-Samuelson effect or,
more generally, appreciation of the “equilibrium” real exchange value of the currency in the past few years. See Caputo, Nuñez and Valdes (2007), Kiss and Krekó (2004), Kovács (2002), Oliveros and Huertas (2002), Romanov (2003) and Vilagi (2004).
64 BIS Papers No 49
Appendix
Box A1
Informal economy, public sector and urban vs rural sector in EMEs
Besides differential productivity growth, inflation in EMEs can be affected by other structural features, such as the relative size of the informal sector; wage formation in the public vs. private sectors; and differences between urban and rural wages. Better statistical coverage of the informal economy will boost the official figures for output, employment and wages without necessarily boosting inflation. Conversely, when the informal economy expands (eg in a recession), inflation could remain sticky despite the fall in the official employment and wage figures.
Shifts in public sector labour demand and a loose wage policy may have a demonstration effect on the private sector. In some countries, collective bargaining at the national level may set by law the minimum conditions for all of the economy, thereby generating a wage-push effect.
Another consideration is the difference between urban and rural wages. Higher urban wages, the typical case in EMEs, will attract rural workers to cities in search of jobs. The prediction of a standard model is that such rural-urban migration would apply downward pressure on wages and hence on inflation. However, congestion effects created by the growing number of city dwellers can be so large as to lead to higher prices of non-tradables such as transportation, utilities and rents, especially in those market segments that are not subject to price controls, and eventually result in higher overall inflation.
___________________ In the model of Harris and Todaro (1970), the expected income of an urban dweller is equal to that of a rural dweller: the rural worker earns a low wage without being laid off, while urban employees earn a high wage for some of the time and are laid-off on zero income for the rest of the time. This model has been used to explain the coincidence of high unemployment and high wages on the basis of macro data. However, on the basis of micro data, Blanchflower and Oswald (1994) discovered for a number of advanced economies a robust empirical relationship (the “wage curve”) between higher unemployment in a region or industry and lower wages.
BIS Papers No 49 65
Box A2
Experience with indexation in Chile and Brazil
High inflation in the 1960s provided a rationale for indexing all contracts in Chile, including wages, house rentals, tuition and health insurance; financial instruments (consumer loans, mortgages, corporate bonds, all fixed income securities with a maturity of one quarter or longer); and policy instruments (exchange rates, interest rates on public debt, income tax brackets and public sector wages) (see Lefort and Schmidt-Hebbel (2002)). The indexed unit of account, called Unidad de Fomento (UF) and introduced in January 1967, related the currency to the Chilean CPI. The UF was originally calculated three times a year; then, between 1975 and 1977, monthly; and after 1977 daily. In the financial sector, the UF was widely adopted in the early 1980s. By 1983, more than 60% of total bank loans in Chile were tied to the UF. The UF was a lagged daily interpolation of the monthly CPI. The formula for computing the UF on day t was given by:
dtt xUFUF /1
1 )1( where π was either the inflation rate for the t – 1st calendar month (for t between the 10th and the last day of the month), or the inflation rate for the t – 2nd calendar month (for t between the 1st and the 9th day of the month); d was the number of days in the t – 1st calendar month. For instance, the UFs for 1–9 April depended on the CPI for January and February; and the UFs for 10–30 April depended on the CPI for February and March. The UFs for a given month thus depended on the CPI for each of the preceding three months.
To reduce the prevalence of indexation, the Central Bank of Chile in September 1990 adopted a monetary framework based on public announcement of an explicit, forward looking annual inflation target. This helped reduce the annual rate of inflation from 27% in 1990 to 3% in 2001. Although the prevalence of indexed contracts has declined in recent years, the Chilean economy remains heavily indexed: about 70% of all labour contracts are adjusted every six months for past inflation.
Indexation in Brazil was institutionalised in 1964, when the government introduced correçãomonetária, a sophisticated indexation mechanism that adjusted taxes, tariffs and some financial contracts (see Goldfajn (2002)). The exchange rate, wages and bank deposits were initially not indexed, but over time they too became indexed in various ways. Indexation came to an end only with the Real Plan of 1994 (see Goldfajn and Valdes (1999)).
66 BIS Papers No 49
Table A1
Measures of wage inflation used in inflation analysis
Measure Country Comment
Argentina Industrial wage index for industrial sector
Czech Republic For public and private sectors
Hungary For economy-wide analysis, inflation analysis and forecasting
Korea Gross nominal wages
Mexico 36% of employees; gross wage increments negotiated for next 12 months for contractual employees
Peru Gross nominal wages estimated semiannually by labour ministry
Turkey Per hour in manufacturing
Gross wages
Poland
Net wages Argentina Wage index for all workers
Mexico Hourly compensation per employee Hourly net wages Thailand Hourly compensation
Hong Kong SAR Nominal payroll per person
Turkey Nominal and real earnings per employee Compensation per employee
Israel, South Africa
Colombia For manufacturing and retail sectors
Hungary For inflation analysis and forecasting
Israel Hourly nominal wages adjusted for labour productivity
South Africa Total salaries and wages as a ratio to real GDP in the formal non-agricultural sector
Unit labour costs
Chile, Hong Kong SAR, Thailand
Colombia For manufacturing, retail and construction sectors
Czech Republic For public and private sectors
Thailand Including minimum wage
Turkey Per hour in manufacturing
Nominal wages
Chile, Korea, Poland
Colombia For manufacturing, retail and construction sectors
Czech Republic For public and private sectors
Turkey Per hour in manufacturing Real wages
Chile, Poland
CPI/Non-oil GDP deflator
Saudi Arabia
Source: BIS survey of central banks.
BIS Papers No 49 67
Table A2
Measures of productivity and unit labour costs used in inflation analysis
Country Measure Data
Labour productivity Industry; based on employment and hours worked Argentina
Unit labour costs Considered but not included in forecast calculations
Labour productivity Chile
Unit labour costs
Four alternative measures, by sector (excluding agriculture and natural resources); monthly and (for projections) quarterly
Labour productivity
Total factor productivity
Overall economy, considered in assessment of cost pressures, aggregate demand/supply trends Colombia
Unit labour costs Manufacturing and retail
Labour productivity Mexico
Unit labour costs
Whole economy (quarterly) and manufacturing (monthly and quarterly) considered in forecast calculations
Labour productivity Corporate sector, biannual Peru Unit labour costs Preliminary use as a leading indicator of inflation
pressures
Labour productivity Hong Kong SAR Unit labour costs
Used to analyse the effect of labour costs on inflation
Labour productivity Non-farm sectors, quarterly Korea Unit labour costs Calculated using gross nominal wages, quarterly;
used in evaluating and forecasting inflation
Labour productivity Whole economy and industries Thailand
Unit labour costs Whole economy and industries
Labour productivity Whole economy Czech Republic Unit labour costs Whole economy and sectors; nominal; used as an
explanatory variable in short-term inflation forecasts
Labour productivity Market sector excluding agriculture; as a whole and disaggregated; used in evaluating inflation
Hungary Unit labour costs Private sector as a whole, plus manufacturing and
market services; quarterly; used in inflation forecasts
Labour productivity Whole economy and main sectors (excluding agriculture)
Poland Unit labour costs Based on average wage, used in inflation forecasts
(ex post also look at compensation/employee)
Labour productivity Manufacturing and major sectors; based on employment and hours worked
Turkey Unit labour costs Manufacturing; nominal and real; used in inflation
forecasts
Labour productivity Israel
Unit labour costs
Whole economy and export manufacturing; monitored on a regular basis
Labour productivity Saudi Arabia
Unit labour costs
Calculated independently by the government and private sector; not regularly monitored
Labour productivity Formal non-agricultural economy South Africa
Unit labour costs Based on gross salaries and wages
Source: BIS survey of central banks.
68 BIS Papers No 49
Table A3
Measures of tradable/non-tradable goods inflation used by EM central banks
Country Data
Argentina Goods and services inflation closely followed; used to assess exchange rate pass-through
Chile Goods and services price inflation closely followed; used in analysis of inflation
Colombia Very important in analysis of inflation, used in macro forecasting model
Mexico Monitored on a systemic basis and reported (bi-weekly) to the Board; used to assess domestic/external inflation pressures
Peru Tradable/non-tradable price data available monthly, not used in analysis of overall inflation
Hong Kong SAR
Tradable/non-tradable inflation not monitored, but non-rental component of CPI is forecast
Korea Tradable/non-tradable price data regularly monitored
Thailand Not monitored (labour market data not detailed enough); real exchange rate stable
Czech Republic
Tradable/non-tradable price data closely followed; used as input to policy decisions and to assess the exchange rate pass-through
Hungary Very important in analysis of inflation; definition of price stability incorporates the BS effect
Poland Tradable/non-tradable inflation not monitored systematically, but BS effect included in inflation projections via real exchange rate equation
Turkey Goods and services price inflation closely monitored and analysed in detail
Israel Tradable/non-tradable inflation not monitored on a systematic basis
Saudi Arabia Tradable/non-tradable inflation monitored and incorporated in quarterly analysis of inflation
South Africa Tradable/non-tradable price data yet to be compiled; BS effect not considered relevant for inflation analysis in an inflation targeting framework
Source: BIS survey of central banks.
BIS Papers No 49 69
Table A4
Central bank assessment of the significance of differences in wage dynamics in formal/informal and urban/rural sectors
Importance Country Data
Wages in formal vs. informal economy
Argentina Wage evolution in the informal sector closely related to the cost of the basic food basket
Colombia Wage data not timely, but formal vs. informal employment data followed closely throughout the cycle
Hungary Wages in the informal sector estimated through statistical methods; used to forecast wage dynamics
Mexico Comprehensive data available, followed on a monthly basis
Differences important for assessment of inflation dynamics
Poland Size of the informal economy estimated but wage data not available
Differences not important
Czech Republic
Data not available
Chile, Hong Kong SAR, Israel, Korea, Peru, Saudi Arabia, South Africa, Thailand, Turkey
Urban vs. rural wages
Colombia Wage data not timely, but urban vs. rural employment data followed closely throughout the cycle
Poland Wage data fragmentary, unreliable; differences important because of large number of self-employed farmers
Differences important for assessment of inflation dynamics South
Africa Minimum wage for farm workers, urban/rural CPI provide some indication of the urban vs. rural wage dynamics
Differences not important
Czech Republic
Data not available
Chile, Hong Kong SAR, Israel, Korea, Peru, Saudi Arabia, Thailand, Turkey
Source: BIS survey of central banks.
70 BIS Papers No 49
Table A5
Central bank assessment of the significance of wage indexation for inflation dynamics
Countries Comments
Chile About 70% of labour contracts adjusted every six months for past CPI inflation
Colombia Important for the public sector and the minimum wage
South Africa Applies to multi-year wage agreements, which are fairly common in South Africa, eg multiyear agreement in the public sector during the past three years links CPIX inflation plus a certain percentage point above that
High significance
Turkey Public sector wages mostly indexed to inflation targets. When inflation targets are missed within a certain margin, employees are protected against inflation
Argentina Except for pensions
Hong Kong SAR Some companies set wage levels making reference to CPI inflation
Israel Has become insignificant in light of low inflation in the past ten years
Thailand Public pension benefits indexed to inflation in the previous year (most important form of indexation). Most firms in the private sector also use backward indexation. Few firms use year-ahead forecast inflation. Minimum wage generally adjusted only once a year, indexed to the previous year’s inflation rate
Low/no significance
Czech Republic, Hungary, Korea, Mexico, Peru, Poland, Saudi Arabia
Source: BIS survey of central banks.
BIS Papers No 49 71
Table A6
Central bank assessment of the significance of collective bargaining for inflation dynamics
Importance Country Comment
Argentina Collective bargaining takes place annually since 2005
Czech Republic
30–40% of wages covered by collective bargaining.
Mexico 9% of total contractual wages are negotiated (does not include teachers’ unions) High
significance South Africa 25% of labour force covered by bargaining council agreements; 75%
by ministerial decrees and legislation (which offer minimum levels of protection). Number of bargaining councils declined from 80 to 57 between 1995 and 2005 (51 councils in the private sector, of which 41 are functional, and 6 in the public sector)
Colombia Collective bargaining important only for large firms
Hong Kong SAR
Labour unions/organisations have limited wage bargaining power
Hungary Wage setting process largely conducted at company or plant level
Poland Collective bargaining mostly takes place at firm level
Thailand Presence of migrant labour, weak labour unions and regulations limit the size of negotiated wage increases
Low/no significance
Peru, Saudi Arabia
Not applicable
Chile, Korea, Turkey
Source: BIS survey of central banks.
72 BIS Papers No 49
Graph A1
CPI and nominal wage inflation1
In per cent
China Indonesia Korea
–5
0
5
10
15
20
25
00 01 02 03 04 05 06 07 08
CPI inflation2
Wage change3
–8
0
8
16
24
32
40
00 01 02 03 04 05 06 07 08–5
0
5
10
15
20
25
00 01 02 03 04 05 06 07 08
Malaysia Philippines Thailand
–5
0
5
10
15
20
25
00 01 02 03 04 05 06 07 08
–5
0
5
10
15
20
25
00 01 02 03 04 05 06 07 08–5
0
5
10
15
20
25
00 01 02 03 04 05 06 07 08
Hong Kong SAR Singapore
–5.0
–2.5
0.0
2.5
5.0
7.5
10.0
00 01 02 03 04 05 06 07 08
–5.0
–2.5
0.0
2.5
5.0
7.5
10.0
00 01 02 03 04 05 06 07 08
Argentina Brazil Chile
–10
0
10
20
30
40
50
00 01 02 03 04 05 06 07 08
–5
0
5
10
15
20
00 01 02 03 04 05 06 07 08–2
0
2
4
6
8
10
00 01 02 03 04 05 06 07 08
BIS Papers No 49 73
Graph A1 (cont)
CPI and nominal wage inflation
In per cent
Mexico Peru Venezuela
0
5
10
15
20
00 01 02 03 04 05 06 07 08
–5
0
5
10
15
20
00 01 02 03 04 05 06 07 080
10
20
30
40
00 01 02 03 04 05 06 07 08
Czech Republic Hungary Poland
–2
0
2
4
6
8
10
12
00 01 02 03 04 05 06 07 08
–10
–5
0
5
10
15
00 01 02 03 04 05 06 07 080
5
10
15
20
00 01 02 03 04 05 06 07 08
Russia Turkey South Africa
0
10
20
30
40
50
60
00 01 02 03 04 05 06 07 08
0
20
40
60
80
00 01 02 03 04 05 06 07 080.0
2.5
5.0
7.5
10.0
12.5
15.0
00 01 02 03 04 05 06 07 081 Argentina, average monthly wage; Brazil, average monthly earnings; Chile, hourly wage index; China, cumulative salary of employed persons divided by employed persons; Czech Republic, average monthly wages; Hong Kong SAR, nominal payroll per person; Hungary,employee gross wages; Indonesia, monthly average wage (manufacturing); Korea, monthly earnings; Malaysia, earnings in manufacturing sector; Mexico, average monthly wage; Peru, average monthly income; Philippines, manufacturing industry wage index; Poland, average monthly wage; Russia, average monthly wages; Singapore, average monthly earnings; South Africa, average monthly earnings in manufacturing; Thailand, average wage rate; Turkey, hourly wages (manufacturing); Venezuela, wage index. 2 Annual change of CPI inflation. 3 Annual change of nominal wage.
Sources: Datastream; national data.
74 BIS Papers No 49
References
Angeloni, I, L Aucremanne, M Emrmann, J Gali, A Lewin and F Smets (2006): “New evidence on inflation persistence and price stickiness in the euro area: implications for macro modelling”, Journal of the European Economic Association, vol 4, pp 562–74.
Aukrust, O (1977): “Inflation in the open economy: a Norwegian model”, in L Krause and W Salant (eds), Worldwide inflation, Brookings Institution.
Balassa, B (1964): “The purchasing power parity doctrine: a reappraisal”, Journal of Political Economy, vol 72, pp 584–96.
Barnea, E and J Djivre (2004): “Changes in monetary and exchange rate policies and the transmission mechanism in Israel, 1989.IV– 2002.I”, Bank of Israel Discussion Paper, no 13.
Baumol, W and W Bowen (1966): Performing arts: the economic dilemma, 20th Century Fund.
Blanchard, O and L Katz (1997): “What we know and do not know about the natural rate of unemployment”, Journal of Economic Perspectives, vol 11, pp 51–72.
Blanchflower, D and A Oswald (1994): The wage curve, MIT Press.
Caputo, R, M Nuñez and R Valdes (2007): Análisis del tipo de cambio en la práctica, Central Bank of Chile, Documento de Trabajo, no 434, November.
Ca’ Zorzi, M, E Hahn and M Sánchez (2007): Exchange rate pass-through in emerging markets, ECB Working Paper, no 739.
Cincibuch, M and J Podpiera (2006): “Beyond Balassa-Samuelson: real appreciation in tradables and transition countries”, Economics of Transition, vol 14, no 3, 547–73.
Devereux, M and C Engel, (2003): “Monetary policy in open economy revisited: price setting and exchange rate flexibility”, Review of Economic Studies, vol 70, 765–83.
Du Caju P, E Gautier, D Momferatou and M Ward-Warmedinger (2008): “Institutional features of wage bargaining in 22 EU countries, the US and Japan”, Paper presented on the Wage Dynamic Network Conference, www.ecb.europa.eu/events/conferences/html/wage _dynamics_network.en.html
Égert, B (2005): “Balassa-Samuelson meets south-eastern Europe, the CIS and Turkey: a close encounter of the third kind?”, European Journal of Comparative Economics, vol 2, December, pp 221–43.
———— (2007): “Real convergence, price convergence and inflation differentials in Europe”, CESifo Working Paper, no 2127, October.
Égert, B, L Halpern and R MacDonald (2006): “Equilibrium exchange rates in transition economies: taking stock of the issues”, Journal of Economic Surveys, vol 20, no 2, pp 257-324.
Eppich, G and S Lörincz (2007): “Three methods to estimate the whitening-related distortion of the wage statistics”, Hungarian National Bank Occasional Papers, no 66.
Goldfajn, I (2002): “Indexation of public debt: analytical considerations and an application to the case of Brazil,” in F Lefort and K Schmidt-Hebbel (eds), Indexation, inflation and monetary policy, Central Bank of Chile.
Goldfajn, I and R Valdes (1999): “The aftermath of appreciations,” Quarterly Journal of Economics, vol 110, pp 127–59.
Godfrey, S, J Theron, and M Visser (2007): “The state of collective bargaining in South Africa”, DPRU Working Paper, no 07-130, November.
Goretti, M (2008): “Wage-price setting in new EU members”, IMF Working Paper, no 08/243.
BIS Papers No 49 75
Harris, J and M Todaro (1970): “Migration, unemployment and constant: a two-sector analysis”, American Economic Review, vol 60, pp 126–42.
Horváth, H and Z Szalai (2008): “Labour market institutions in Hungary with a focus on wage and employment flexibility”, Hungarian National Bank, Occasional Paper.
Kandil, M (2003): “The wage-price spiral: industrial country evidence and implications”, IMF Working Paper, no 03/164.
Kovács, M (ed) (2002): “On the estimated size of the Balassa-Samuelson effect in CEC5 countries”, MNB Working Paper, no 2002/5.
Kiss, G and Judit Krekó (2004): “Optimal rate of inflation in Hungary”, MNB Background Study, no 2004/1.
Lavi, Y and N Sussman (2001): “The determination of real wages in the long run and its changes in the short run: evidence from Israel, 1968-1998”, Bank of Israel Discussion Paper, no 2001.04.
Layard, R, S Nickell and R Jackman (2005): Unemployment: macroeconomic performance and the labour market, Oxford University Press.
Lefort, F and K Schmidt-Hebbel (2002): “Indexation, inflation and monetary policy: an overview,” in F Lefort and K Schmidt-Hebbel (eds), Indexation, inflation and monetary policy, Central Bank of Chile.
Leibovich, J Nigrinis and M Ramos (2006): “Caracterización del mercado laboral rural en Colombia”, Banco de la República Working Paper, no 408, October.
Lindbeck, A (1979): “Imported and structural inflation and aggregate demand: the Scandinavian model reconstructed”, in A Lindbeck (ed), Inflation and employment in open economies, North Holland, pp 13–40.
Mihaljek, D and M Klau (2004): “The Balassa-Samuelson effect in central Europe: a disaggregated analysis”, Comparative Economic Studies, vol 46, March, pp 63–94.
———— (2008): “Catching-up and inflation in transition economies: the Balassa-Samuelson effect revisited”, BIS Working Papers, no 270.
Obstfeld, M and K Rogoff (1996): Foundations of international macroeconomics, MIT Press.
Oliveros, H and C Huertas (2002): “Desequilibrios nominales y reales del tipo de cambio en Colombia”, Banco de la República Working Paper, no 220, September.
Padoa-Schioppa, T (2003): “Trajectories towards the euro and the role of ERM II”, in Gertrude Tumpel-Gugerell and Peter Mooslechner (eds), Structural Challenges for Europe, Edward Elgar, pp 405–12.
Pauwels, L and Z Zhang (2008): “How flexible is the labour market in Hong Kong? Some statistical observations”, HKMA Research Note, no 04/2008, September.
Romanov, D (2003): “The real exchange rate and the Balassa-Samuelson hypothesis: an appraisal of Israel's case since 1986”, Bank of Israel Discussion Paper, no 2003.09.
Samuelson, P (1964): “Theoretical notes on trade problems”, Review of Economics and Statistics, vol 46.
Tovar, C (2008): “DSGE models and central banks”, BIS Working Papers, no 258.
Világi, B (2004): “Dual inflation and real exchange rate in new open economy macroeconomics”, MNB Working Paper, no 2004/5.
Waiquamdee, A, P Sutthasri and S Tanboon (2009): “Monetary policy and underlying inflation pressures: the essence of monetary policy design”, Bank of Thailand Discussion Paper, no 01/2009, February.


