
WAGES AND INCOMES Statistical Bulletin : 5- 1983aei.pitt.edu/79591/1/1983.5.pdfeurostat WAGES ANO...
20
eurostat WAGES ANO INCOMES Statistical Bulletin 15.11.1983 EARNINGS IM INDUSTRY AND SERVICES Principal results October 1982 The aim of this bulletin is to make quickly available to users of the EUROSTAT halfyearly publication "Hourly earnings Hours of work" the principal results of these statistics relating to October 1982. Detailed results will be published at a later date in volume 21983 of this publication. A. EARNINGS IN INDUSTRY Table A/1 Trends of average gross (nominal) hourly earnings of manual workers F I NL Β L UK IRL 1) DK GR a) Indices (October 1975 = 100) October 1982 1. All industries 2. Mining and quarrying 3. Manufacturing industries 4. Building and civil engineering ^. All industries ¿. Mining and quarrying 3. Manufacturing industries 4. Building and civil engineering 156,1 150,5 150,0 +4,2 +4,4 +4,4 +3,5 248,4 265,9 248,1 252,1 367,7 377,3 366,3 394,8 158,7 168,7 157,1 162,4 176,4 166,5 177,0 175,5 166,7 140,4 169,5 161,9 231,0 : 232,1 226,5 304,1 285,9 310,1' 195,5 192,2 195,4 487,5 b) Annual changes October 1981 to October 1982 +13,1 +21,1 +13,8 +11,1 +17,0 +16,4 +17,1 +14,2 +6,9 +7,6 +7,6 +6,0 +3,6 +4,4 + 5,6 +4,8 +8,2 4,4 +8,6 +6,1 +8,9 (14,4 : t12,1 +9,0 (13,8 +8,5 +17,3 +10,2 +7,9 +10,2 +36,5 3) 1) Data relating to September 2) Quarterly averages; data relating to 4th quarter 3) Provisional estimates EUROSTAT BP. 1907 Luxembourg Tel.: 4301 2028/2032 5- 1983
Transcript of WAGES AND INCOMES Statistical Bulletin : 5- 1983aei.pitt.edu/79591/1/1983.5.pdfeurostat WAGES ANO...

eurostat WAGES ANO INCOMES
Statistical Bulletin
15.11.1983
EARNINGS IM INDUSTRY AND SERVICES
Principal results October 1982
The aim of this bulletin is to make quickly available to users of the EUROSTAT
halfyearly publication "Hourly earnings Hours of work" the principal results
of these statistics relating to October 1982. Detailed results will be published
at a later date in volume 21983 of this publication.
A. EARNINGS IN INDUSTRY
Table A/1 Trends of average gross (nominal) hourly earnings of manual workers
F I NL Β L UK IRL 1)
DK GR
a) Indices (October 1975 = 100) October 1982
1. All industries
2. Mining and
quarrying
3. Manufacturing
industries
4. Building and
civil engineering
^. All industries
¿. Mining and
quarrying
3. Manufacturing
industries
4. Building and
civil engineering
156,1
150,5
150,0
+ 4 , 2
+4 ,4
+4 ,4
+3 ,5
248 ,4
2 6 5 , 9
2 4 8 , 1
2 5 2 , 1
3 6 7 , 7
3 7 7 , 3
3 6 6 , 3
3 9 4 , 8
1 5 8 , 7
1 6 8 , 7
1 5 7 , 1
162 ,4
1 7 6 , 4
1 6 6 , 5
1 7 7 , 0
1 7 5 , 5
1 6 6 , 7
140 ,4
1 6 9 , 5
161 ,9
2 3 1 , 0
:
2 3 2 , 1
2 2 6 , 5
304,1
285,9
310,1 '
195,5
192,2
195,4 4 8 7 , 5
b) Annual changes October 1981 to October 1982
+13,1
+21,1
+13,8
+11,1
+17,0
+16,4
+17,1
+14,2
+6,9
+7,6
+7,6
+6,0
+3,6
+4,4
+ 5,6
+4,8
+8,2
4,4
+8,6
+6,1
+8,9 (14,4
: t12,1
+9,0 (13,8
+8,5 +17,3
+10,2
+7,9
+10,2 +36,5
3)
1) Data relating to September
2) Quarterly averages; data relating to 4th quarter
3) Provisional estimates
EUROSTAT
B P . 1907
Luxembourg
Tel.: 4301 2028/2032
5 - 1983

- 2
Over the latest available 12 months period (October 1981 to October 1982), nominal earnings for manual workers in industry (Table A/1) increased at rates varying, according to country, between 4% (Germany) and 37% (Greece). Only five countries show increases of less than 10% (D, UK and Benelux). A comparison with the previous twelve month period indicates that all countries (except Luxembourg) experienced a decelerating rate of increase of nominal earnings.
Table A/1 also shows trends of nominal earnings between October 1975 and October 1982, with increases ranging from 51% (Germany) to 388% (Greece) representing for this seven years period mean annual rates of increase as follows: D: 6,0%, NL: 6,8%, L: 7,6%, B: 8,5%, DK: 10,0%, UK: 12,7%, F: 14,0%, I: 15%, IRL: 16,5%, GR: 25,5%.
Table A/2 - Trends of average gross real (1) hourly earnings of manual workers
1. 2.
3.
4.
1. 2.
3.
4.
All industries Mining and quarrying Manufacturing industries Building and civil engineering
All industries Mining and quarrying Manufacturing industries Building and civil engineering
a) 110,7
114,8
110,7
110,3 b)
-0,7
-0,5
-0,5
-1,4
F I
Indices (Oct 119,8
128,3
119,7
121,6
119,9
123,0
119,4
128,7 Annual chang +3,4
+10,8
+4,1
+1,6
-0,1
-0,6
0,0
-2,5
NL
ober 1! 105,4
112,1
104,4
107,9 es - 0< +2,0
+2,6
+2,6
+1,1
Β L 4 ) UK 2) IRL
r/5 = 100) October 1982 110,6
104,4
111,0
110,0 ;tober -3,9
-5,0
-3,9
-4,6
105,2
-88,6
107,0
102,2 1981 tc -2,0
-13,4
-1,6
-3,9
101,5
101,9
99,5
105,5
109,8
103,3
4) 112,0
October 1982 +1,9
:
+2,0
+1,5
-2,2
-4,2
-2,7
π Q 4 ) +0,3
DK
93,5
91,9
93,4
-0,3
-2,4
-0,3
•
GR3)
149,1
:
(|
+14,1
•
1) Data obtained by deflation of nominal data by means of consumer price indices 2) Data referring to September 3) Quarterly averages; data referring to 4th quarter 4) Provisional estimates
Average gross hourly earnings, expressed in real terms (table A/2), decreased in six Member States from October 1981 to October 1982, with reductions between 0,1% (I) and 3,9% (B). In the other countries, there was an increase in real earnings ranging between 2% (UK and NL) to 14% (GR).

/
- 3
In the seven years period from October 1975 to October 1982 there were real terms increases in earnings in all countries except Denmark (-6,5%). However, these increases varied considerably between 1,5% (UK), 5% (NL, L, IRL), about 10% (D, B), 20% (F) and 49% (GR).
Table A/3 shows the average hourly earnings of manual workers, expressed in purchasing power standards (PPS) , for October 1975 and October 1982 respectively. These data are comparable between countries for the same period but not over time.
The table shows that quite considerable differences exist between the countries although the gap between the two countries at opposite extremes continued to decrease markedly (GR/L: 1975: 194%; 1978: 158%; 1982: 88%).
Looking at the positions of countries in descending order, Luxembourg and Denmark occupied the two leading places in October 1982, while France and Greece were at the end of the scale.
Table A/3 - Average gross nominal hourly earnings of manual workers converted into current PPS
1. All industry 2. Mining and
quarrying 3. Manufacturing
industries 4. Building and
civil engineering
^. All industry w 2. Mining and quarrying 3. Manufacturing
industries 4. Building and
civil engineering
D
2,77
3,02
2,72
2,89
6,00
6,80
5,92
6,27
F
2,02
2,24
2,02
1,96
4,72
5,60
4,72
4,65
I
a) 2,48
2,68
2,48
2,50 b)
5,64
6,24
5,60
6,09
NL
Octobei 2,95
3,34
2,89
3,12 Octobei 5,99
7,19
5,79
6,49
Β
- 1975 2,88
3,56
2,87
2,92 - 1982 6,61
7,53
6,56
6,66
L
3,51
3,78
3,62
3,07
7,0^
6,3D2
7,3D2
δ,θδ2
UK
2,80
2,77
2,80
2,86
5,13
:
5,13
5,13
3) IRL
2,48
2,66
2,48
*
5,15
5,85
5,12
DK
3,49
3,33
3,49
*
6,97
6,55
6,98
:
GR4)
:
:
1,23
*
:
'-
3,92
1) These data should be interpreted with caution in view of: - the difference between the concepts and the fields of reference of the aggregates used (hourly earnings of manual workers in industry on the one hand, PPS established for gross domestic product on the other hand);
- the importance, varying from country to country, of certain elements of remuneration (bonuses, gratuities, etc.) not taken into consideration in the harmonized earnings statistics ;
- the fact that the earnings data converted to PPS are on a gross basis, i.e. before deducation of social security contributions and taxes, which vary from countrz to country.
(Footnotes continued on page 4)

- 4 -
The rates used for the conversion into PPS are given below (1 PPS national currency units):
1975 2) 1982 ;
DM
3,59 2,49
FF
5,92 6,30
100 LIT
6,25 10,13
HFL
3,47 2,72
BFR
51,56 40,10
LFR
45,27 37,80
UKL
0,450 0,569
IRL
0,442 0,619
DKR
8,94 8,76
DR
31,47 48,30
2) Provisional estimates 3) Data referring to September 4) Quarterly averages; data referring to 4th quarter
Table A/4 shows average gross hourly earnings of male and female manual workers all manufacturing industries of Member States. In analysing these figures, it should be kept in mind that these are averages which should primarily be used as indicators of short term trends in these earnings. It is essential to exercise great caution in any use of these figures to make general comparisons of the levels of these earnings, and in particular, for studies in connection with the principle of equal pay for men and women, or other structural analyses.
Table A/5 gives the average gross hourly earnings of workers in industry in October 1982 and previous periods, broken down by branch of activity (two-digit NACE categories). This table not only permits an assessment of salary trends in the different industrial sectors, but also provides some structural information to clarify differences between countries in the development of average hourly earnings of workers in total industry.
Table A/6 shows the trends of average (nominal) gross monthly earnings of non-manual workers in industry, with a breakdown by branche of activity. For all industries such earnings increased between October 1981 and October 1982 by 4% and 5% in Germany and Belgium, between 7 and 10% in France, the Netherlands, Luxembourg and the United Kingdom, by 12% in Denmark and 14% in Italy. Data for Ireland are not available.
Part B of this Bulletin gives the principal results of the harmonized statistics of average gross monthly earnings of non-manual workers in wholesale and retail distribution, banking and insurance for the five countries for which data are at present available.
For the bi-annual period under review (October 1980 to October 1982), nominal earnings (table B/l) in these services branches increased between 9 and 11% in Germany, 10 and 16% in the Netherlands, 15 and 17% in Belgium, 16 and 21% in Luxembourg and 22 and 30% in France.
Considering the changes during the last annual period (October 1981 to October 1982) four countries experienced a general slowdown in the rate of increase if compared to the previous annual period while an acceleration in all branches of activity was recorded in the Netherlands.
Trends of real earnings in these services branches are shown in table B/2. These trends are in most branches negativ for the two years period since October 1980, with decreases becoming even more marked during the last year. However, banking in the Netherlands and France recorded in October 1982 annual increases in real earnings of 3% and 4%.

5
Table A/4
Gross hourly earnings of male and female manual workers in
manufacturing industry Averages in national currencies,
indices (October 1975 = 100) and percentage differences*
A.
•
•
B.
Average earnings
a) in national
currencies
Men
Women
Oct.
Oct.
April
Oct.
April
Oct.
Oct.
Oct.
April
Oct.
April
Oct.
b) indices(0c
Men
Women
Oct.
April
Oct.
April
Oct.
Oct.
April
Oct.
April
Oct.
Differences b
average
men and
(in %)
earni
women
(3)
Oct.
Oct.
April
Oct.
April
Oct.
1975
1980
1981
1981
1982
1982
1975
1980
1981
1981
1982
1982
b. 1975
= 100)
1980
1981
1981
1982
1982
1980
1981
1981
1982
1982
îtween
igs of
1975
1980
1981
1981
1982
1982
D
DM
10,49
14,23
14,60
15,03
15,53
15,65
7,61
10,40
10,65
10,99
11,31
11,45
135,6
139,2
143,3
148,1
149,2
136,6
139,9
144,4
148,6
150,5
27,5
26,9
27,1
26,9
27,2
26,8
F
FF
12,88
24,40
26,21
28,00
30,84
31,83
9,84
18,78
20,29
21,88
24,16
24 ,73
189,4
203,5
217,4
239,4
247,1
190,8
206,2
222,4
245,5
251,3
23,6
23,0
22,6
21,9
21,7
22,3
I
LIT
1642
4067
4636
5031
5453
5874
1300
3439
3966
4296
4697
5091
247,6
282,3
306,4
332,1
357,7
264,5
305,1
330,5
361,3
391,6
20,8
15,4
14,5
14,6
13,9
13,3
NL
HFL
10,35
14,23
14,59
15,07
15,77
16,19
7,58
10,73
10,98
11,26
11,86
12,17
137,5
141,0
145,6
152,4
156,4
141,6
144,8
148,5
156,5
160,6
26,8
24,6
24,7
25,3
24,8
24,8
Β
BFR
159
242
255
266
2/4
281
113
1/0
182
189
197
204
151,6
161,0
167,6
172,3
176,7
148,2
160,6
167,4
174,3
180,5
28,7
29,7
28,6
29,0
28,1
27,4
L
LFR
169
252
263
265
281
287
103
154
159
159
167
173
149,1
155,6
156,8
166,3
169,8
149,5
154,4
154,4
162,1
168,0
39,1
38,9
39,5
40,0
40,6
39,7
UK
UKL
1,36
2,59
2,69
2,87
3,02
3,14
0,91
1,79
1,86
1,96
2,08
2,16
190,6
198,5
211,3
222,1
230,9
197,6
204,6
216,6
228,6
237,4
33,1
30,9
30,9
31,7
31,1
31,2
IRL1*
IRL
1,28
2,62
2,88
3,12
3,29
3,56
0,78
1,80
1,98
2,11
2,25
2,44
204,7
225,0
243,8
257,0
278,1
231,1
254,2
270,9
288,5
312,8
39,1
31,3
31,3
32,4
31,6
31,5
DK
DKR
32,66
52,33
54,92
57,74
61,39
63,71
27,54
45,04
47,10
49,52
52,23
54,22
160,2
168,2
176,8
188,0
195,1
163,5
171,0
179,8
189,7
196,9
15,7
13,9
14,2
14,2
14,9
14,9
GR2)
DR
43,8
125,7
147,2
160,4
194,6
212,0
30,6
84,7
98,1
106,9
142,5
156,6
287,0
336,1
366,2
444,3
484,0
276,8
320,6
349,4
465,7
511,8
30,1
32,6
33,4
33,3
26,8
26,1
* Trends of average monthly earnings of male and female nonmanual workers in services
(indices, October 1980 = 100) are shown in table B/l
1) Data referring to March and September; adults only
2) Quarterly averages: April = 2nd quarter; October = 4th quarter
3) ., nn /earnings of women\
earnings of men J 100 0 χ 100


- 7 -TABLE A/5
Average gross hourly earnings of manual workers (October 1975 - October 1982)
Total (men + women) in national currency
NACE
1 to 5 (except 16 + 17)
11, 13 21, 23
12, 14, 15 22, 24 to 26, 3, 4
^^ w 11
12
13
14
A w 15
16
17
21
All industries (except electricity, gas, steam and water)
». Mining and quarrying
Total manufacturing industries
Extraction and briquetting of solid fuels
Coke ovens
Extraction of petroleum and natural gas
Mineral oil refining
Nuclear fuels industry
Production and distribution of electricity, gas, steam and hot water
Water supply: collection, purification and distribution of water
Extraction and preparation of metalliferous ores
X.1975 IV.1980 X.1980 IV.1981 X.1931 IV.1932 X.1982 X.1975 IV.1980 X.1980 IV.1981 X.1981 IV.1932 X.1982 X.1975 IV.1980 X.1980 IV.1981 X.1981 IV.1982 X.1982 X.1975 IV.1980 X.1980 IV.1981 X.1931 IV.1982 X.1982 X.1975 IV.1980 X.1980 IV.1981 X.1981 IV.1982 X.1982 X.1975 IV.1980 X.1980 IV.1981 X.1981 IV.1982 X.1982 X.1975 IV.1980 X.1980 IV.1981 X.1981 IV.1932 X.1982 X.1975 IV.1980 X.1980 IV.1981 X.1931 IV.1982 X.1982 X.1975 IV.1980 X.1980 IV.1981 X.1931 IV.1982 X.1982 X.1975 IV.1980 X.1980 IV.1981 X.1981 IV.1932 X.1982 X.1975 IV.1980 X.1980 IV.1981 X.1931 IV.1932 X.1982
D
DM
9,94 13,26 13,58 13,93 14,35 14,77 14,96 10,85 14,06 15,37 15,58 16,23 16,26 16,94 9,80 13,18 13,35 13,71 14,13 14,61 14,75,, II.09J 14.31J 15,87 16,00 ' 16,70ji 16,68 17,43 '
1) 1) 1) 1) 1) 1) 1)
11,39 15,45 16,11 16,95 16,99 17,31 1 7,93 12,85 17,36 18,02 18,77 18,85 19,33 19,85
11,90 15,67 16,11 16,36 17,10 17,31 17,93 11,31 14,40 14,90 15,28 15,69 15,92 16,64 10,71 13,68 13,79 14,10 14,76 15,32 15,18
F
FF
11,96 21,48 22,84 24,52 26,28 23,98 29,71 13,28 24,25 25,90 27,22 29,15 31,97 35,31 11,99 21,45 22,72 24,46 26,14 29,06 29,75 12,74 23,75 25,37 26,35 29,38 30,87 31,84
19. 32 2 )
30,73'; 32 45 34,32 ' 37,38 J 40,51 44,19 '
2) 2) 2) 2) 2) 2) 2)
15 26 28 29 31
J
,53 ,76 ,25 ,09 77
I
LIT
1553 3674 3934 4506 4833 5302 5/11 1676 4275 4365 5112 5432 5921 6323 1550 3650 3907 4466 4846 5262 5677 2277
2268 4754 5143 5829 6357 6649 6812 2795 4752 5182 5951 6453 6938 7501 2430 4834 4991 5944 6106 6340 7493
2226 4756 5076 5679 6173 6600 7201 2087 4932 4989 6110 6343 6729 72 73 1798 4056 4309 5046 5452 6025 6140
NL
HFL
10,26 14,38 14,46 14,76 15,23 15,36 16,28 11,60 16,57 16,78 17,64 18,19 19,22 19,57 10,03 13,75 13,84 14,19 14,65 15,35 15,76
-------
12,78 17,32 17,05 17,63 18,20 13,83 19,49
------"
Β
BFR
149 220 229 241 251 253 265 184 258 266 278 237 295 302 148 217 226 238 243 256 263 194 269 278 290 300 303 316 178 256 271 288 297 311 319 -------225 347 354 383 396 413 410
-
-170 266 275 290 296 309 316 ------"
LS)
LFR
159 236 233 244 245 260 265 171 245 234 252 251 242 240 164 '250 245 256 256 272 278 ----_ ------------------------------168 247 248 266 274 277 293
179 276 264 283 233
UK
UKL
1,26 2,34 2,39 2/19 2,65 2,33 2,92 1,25 2,47 2,42
1,26 2,31 2,37 2,49 2,68 2,31 2,92
1,43
1,70 3,20 3,24 3,61 3,78 4,11 4,22
1,42 2,95 3,00 3,29 3,60 3,60 4,02 1,26 2,50 2,55 2,70 2,35 2,94 3,25 1,63
IRL4)
IRL
1,10 2,21 2,33 2,58 2,79 2,94 3,19 1,18 2,38 2,54 2,80 3,20 3,24 3,62 1,10 2,20 2,32 2,56 2,77 2,92 3,17
1,48 2,70 3,18 3,69 3,75 4,07 4,60
DK
DKR
31,26 48,95 50,27 52,69 55,44 53,34 61,10 29,85 47,16 48,35 51,17 53,18 53,97 57,37 31,27 48,96 50,28 52,69 55,45 58,35 61,11
-------
30 47 49 51 54, 56,
16 30 52 24 91 62
58,37 -------
GR
DRA
38,8 101,0 108,7 127,0 138,6 173,7 189,2
1) NACE 12 included in NACE 11
2) NACE 14 included in NACE 13
3) October 1982: provisional figures 4) Ireland: March and September

8
TABLE A/5 (continued)
Average gross hourly earnings of manual workers (October 1975 October 198?)
Total (men +
NACE
22
23
24
25
26
3
31
32
33
34
35
women)
Production and preliminary
processing of metals
Extraction of minerals
other than metalliferous
and energyproducing
minerals; peat extraction
Manufacture of nonmetallic
mineral products
Chemical industry
Production of manmade
fibres
Metal manufacture; mechani
cal, electrical and instru
ment engineering
Manufacture of metal
articles
Mechanical engineering
Manufacture of office
machinery and data
Drocessing machinery
Electrical engineering
Manufacture of motor
vehicles and of motor
vehicles parts and
accessories
X.1975
IV.1980
X.1980
IV.1981
X.1931
IV.1932
X.1982
X.1975
IV.1980
X.1980
IV.1981
X.1931
IV.1932
X.1982
X.1975
IV.1980
X.1980
IV.1981
X.1981
IV.1982
X.1982
X.1975
IV.1980
X.1980
IV.1981
X.1981
IV.1932
X.1982
X.1975
IV.1980
X.1980
IV.1981
X.1931
IV.1932
X.1982
X.1975
IV.1980
X.1980
IV.1981
X.1981
IV.1932
X.1982
X.1975
IV.1980
X.1980
IV.1981
X.1931
IV.1932
X.1982
X.1975
IV.1980
X.1980
IV.1981
X.1981
IV.1932
X.1982
X.1975
IV.1980
X.1980
IV.1981
X.1931
IV.1932
X.1982
X.1975
IV.1980
X.1980
IV.1981
X.1981
IV.1932
X.1982
X.1975
IV.1980
X.1980
IV.1981
X.1981
[V.1932
X.1982
D
DM
10,46
14,21
14,08
14,39
14,36
15,61
15,38
9,94
12,99
13,56
13,87
14,34
14,36
14,84
9,89
12,83
13,32
13,57
14,01
14,13
14,50
10,59
13,86
14,35
14,85
15,24
15,62 16,04
10,98
14,88
15,14
16,17
16,02
16,75
16,76
13,70
13,75
14,08
14,57
15,10
15,18
9,79
13,12
13,21
13,47
13,93
14,33
14,49
10,46
14,04
14,14
14,41
14,36
15,35
15,45
9,28
12,67
12,70
13,01
13,53
14,22
14,43
9,14
12,38
12,48
12,77
13,23
13,74
1 3,84
11,39
15,42
15,36
15,81
16,30
16,91
16,98
F
FF
14,03
23,12
24,50
26,69
27,59
31,62
32,28
11,69
22,12
23,86
25,86
23,01
12,60
22,69
24,10
25,62
27,49
30,41
31,23
13,65
24,71
26,51
28,14
29,93
33,65 34,40
14,21
12,33
22,42
23,80
25,63
27,36
30,33
31,30
11,95
21,38
22,80
24,55
26,22
29,47
30,02
12,75
22,92
24,17
26,32
27,97
30,79
32,05
11,38
22,85
24,46
28,82
30,00
33,22
11,69
21,37
22,72
24,30
26,20
23,34
29,67
12,43
23,39
24,84
26,50
23,43
31,09
32,66
I
LIT
1887
3986
4249
4868
5340
5800
6138
1563
4273
4295
5081
5362
5733
6220
1477 .
3647
3857
4505
4825
5382 5692
1752
4202
4411
4930
5362
5712 6160
1860
4297
4510
4929
5355
5956
6379
1561
3675
3986
4531
4858
5211
5610
1635
3732
4076
4593
4980
5346
5731
1802
3592
3760
4171
4534
4690
5386
1553
3534
3859
4379
4831
5145
5489
1624
3624
3944
4379
4719
5245
5642
NL
HFL
11,73
16,84
16,20
17,42
17,33
13,84
18,60
10,12
13,76
13,87
14,08
14,58
15,15 15,61
11,10
15,10
15,16
15,50
16,03
16,76
17,26
10,97
13,50
13,56
13,89
14,35
15,11
15,47
10,03
13,42
13,53
13,81
14,22
14,97
15,40
10,09
13,96
13,92
14,19
14,66
15,54
15,86
10,00
13,73
9,48
13,07
13,11
13,48
13,97
L4,65
.4,94
9,80
13,32
13,58
13,94
14,44
.5,13
.5,56
Β
BFR
178
268
279
295
309
316
326
149
224
231
244
250
256
261
152
231
237
250
260
270
278
167
250
261
267
274
235
294
164
234
247
256
268
277
281
155
226
235
249
260
267
2 74
149
218
228
240
251
259
267
155
223
232
244
255
260
270
131
147
218
225
239
252
257
263
173
246
255
272
232
291
296
LI)
LFR
177
280
264
278
280
301
305
150
210
206
229
217
242
240
■ 139
200
202
210
210
231
233
134
186
187
203
231
227 252
167
208
214
223
222
232
240
143
205
216
225
230
240
250
151
221
225
237
235
244
258
144
216
212
215
240
243
245
131
162
168
177
198
222
215
ΘΚ
UKL
1,46
2,56
2,76
2,87
3,06
3,22
3,29
1,19
1,30
2,44
2,51
2,61
2,81
in nat
IRL 2)
IRL
1,21
2,43
2,42
2,81
2,97
Lonal currency
DK
DKR
35,57
52,73
52,05
58,02
59,29
3,27 62,77
3,58 63,40
: 29,85
: 47,16
: 48,35
: 51,17
53,18
53,97
57,37
1,28 31,42
2,52 49,75
2,62 50,20
2,96 54,12
3,20 55,57
2,98 3,40 50,33 3,06 3,64 51,80
1,37
2,61
2,67
2,74
2,99
1.25*; 31,28
2,74^j 49,71
2.84;* 50,81
3,14^ 55,32
3,40d' 57,10
3,05 3,663) 52,13 3,22 3,86 63.24
1,52
2,40
2,62
2,76
3,03
3,06
3,35
1,30
2,33
2,41
2,48
2,60
2,84
2,97
1,26
2,27
2,3β
2,41
2,45
2,83
2,92
1,30
2,37
2,44
2,55
2,75
2,34
2,98
1,22
2,43
2,40
2,54
2,80
2,34
2,82
1,18
2,26
2,29
2,39
2,56
2,67
2,76
1,48
2,51
2,59
2,69
2,75
3,00
3,22
3)
3)
3)
3)
3)
3)
3)
1,03
2,19
2,26
2,45
2,68
2,35
3,05
1,02
2,13
2,23
2,36
2,55
2,77
3,01
1,03
2,06
2,19
2,33
2,52
2,75
3,01
0,96
2,01
2,11
2,34
2,48
2,61
2,83
1,36
2,64
2,83
3,00
3,17
3,45
3,57
29,74
46,71
47,78
50,54
52,73
56,05
58,21
30.93T'
46,75
48,834
51,88*
53,54 !
56,68?,
59.114'
4)
4)
4) 4) 4)
4)
") 29,17
45,82
47,76
50,58
52,44
55,33
53,71
29,45
44,72
46,20
49,71
50,50
54,40
55,38
GR
DRA
42,3
111,3
122,2
139,6 155 . d ^
137, ^ P 217,0
39,7JJ 3)
107,5:?
116,9,
137,5:?
151,3 '
198,3,3? 207,3
3)
3)
3)
3)
3)
3)
3)
3)
φ
38,5
99,7
108,1
121,4
L3C.3
.66,2
183,8
50,0
L35,9,
L40,5¡ L70,6^
L34.4ÌH
210,6 '
225,85'
1) October 1982: provisional figures
2) Ireland: March and September
3) NACE 26 included in NACE 25
4) NACE 33 included in NACE 32
5) N A C E 36 included in NACE 35

TABLE A/5 (end)
Average g r o s s h o u r l y e a r n i n g s of manual worke r s (Oc tobe r 1975 - Oc tobe r 1982)
Total (men
NACE
36
37
41/42
%
44
45
46
< ■ W 47
48
49
50
+ women)
Manufacture of other means
of transport
Instrument engineering
Food, drink and tobacco
industry
Textile industry
Manufacture of leather
and of leather goods
Manufacture of clothing
and footwear
Timber and wooden
furniture industries
Manufacture of paper and
paper products; printing
Processing of rubber and
plastics
Other manufacturing
industries
Building and civil
engineering
X.1975
IV.1980
X.1980
IV.1981
X.1981
IV.1932
X.1982
X.1975
IV.1980
X.1980
IV.1981
X.1931
IV.1932
X.1982
X.1975
IV.1980
X.1980
IV.1981
X.1981
IV.1982
X.1982
X.1975
IV.1980
X.198C
IV.1981
X.1981
IV.1982
X.1982
X.1975
IV.1980
X.1980
IV.1981
X.1981
IV.1932
X.1982
X.1975
IV.1980
X.198C
IV.1981
X.1981
IV.1982
X.1982
X.1975
IV.1980
X.1980
IV.1981
X.1981
IV.1982
X.1982
X.1975
IV.1980
X.1980
IV.1981
X.1981
IV.193?
X.1982
X.1975
IV.1980
X.1980
IV.1981
X.1981
IV.1932
X.1982
X.1975
IV.1980
X.1980
IV.1981
X.1981
IV.1982
X.1982
X.1975
IV.1980
X.1980
IV.1981
X.1931
IV.1932
X.1982
D
DM
10,46
14,31
14,38
14,56
15,23
15,74
15,91
8 , 9'.)
12,10
12,26
12,63
12,94
13,42
13,53
9,04
11,89
12,25
12,66
12,98
13,34
13,66
8,39
10,55
11,13
11,21
11,72
11,77
12,21
7 , 57
10,29
10,46
11,01
11,09
11,56
11,58
7,49
9,70
10,08
10,33
10,62
10,79
11,01
9,45
12,87
13,03
13,65
13,79
14,16
14,28
10,07
13,59
13,68
14,12
14,35
14,86
15,06
9, Î5
12,16
12,69
12,90
13,36
13,59
13,97
8,44
11,22
11,50
11,77
12,11
12,44
12,'
10,41
13,54
14,44
14,76
15,03
15,36
15,61
F
FF
14,22
25,45
26,98
29,41
30,63
34,37
35,31
11,49
20,79
21,87
23,46
25,10
28,23
28,98
11,52
21,44
22,70
24,53
¿6,05
29,00
29,53
10,26
17,92
18,72
20,15 21,99
24,29
24,55
9,67
17,27
18,38
19,75
21,15
23,91
24,54
9,50
16,98
17,88
19,41
20,79
22,96
23,41
10,26
18,97
20,19
21,79
23,41
25,98
26,3 7
13,73
24,44
25,54
27,68 29,79
32,56
33,37
M ,74
20,52
22,15
23,36
25,36
28,08
28,53
11,52
19,76
21,16
23,23
24,57
26,67
27,12
11,63
21,22
22,86
24,37
26,40
23 , 69
29 , 32
ι
Ι
LIT
1689
3643
4062
4545
5091
5418
5797
1473
3494
3847
4350
4629
5108
5495
1615
3693
3954
4590
4989
5507
5935
1290
3260
3403
3950 4292
4697
5152
1283
3454
3555
4096 4407
4872
5182
1166
3022
3153
3688
3973
4379
4 748
1246
3275
3411
3955
4363
4311
5183
1917
4207
4343
5061
5334
5764
6451
1651
3867
4116
4810
5174
5615
6092
1326
3186
3462
3999
4354
4700
5194
1564
4012
4321
5076
54C5
5877
61 '4
NL
HFL
10,75
14,00
14,14
14,59
15,01
15,81
16,21
9,58
13,40
13,46
13,56
13,83
14,66
14,64
9,92
13,59
13,86
14,14
14,68
15,24
15,73
9,47
12,80
12,97
13,27
13,72
14,12 14,46
8,44
11,39
11,70
11,88
12,28
12,33
7,60
10,71
10,86
11,06
11,00
11,63
12,00
9,24
12,72
12,85
13,02
13,51
13,93
14,32
10,87
14,58
14,62
14,92
15,43
16,13
16,64
10,06
13,88
13,81
14,16
14,60
15,22
15,57
9,28
10,86
15,81
15,89
16,13
16,65
17,22
17,64
Β
BFR
166
230
238
252
264
263
274
140
195
205
210
228
227
239
137
205
214
224
235
240 247
125
175
183
193 206
213 221
114
172
177
186
192
197
202
105
148
155
166
173
181
190
138
200
208
221
228
234
241
159
233
242
256
264
277
289
145
212
218
230
242
251
259
111
177
137
204
205
206
212
151
228
236
248
255
262
267
LD
LFR
130
182
183
200
200
206
213
83
117
123
132
133
135
136
130
176
183
193
192
200
215
159
232
242
249
265
268
283
171
244
255
263
269
279
290
139
188
198
208 212
224
225
UK
UKL
1,43
2,49
2,61
2,67
2,90
3,03
3,19
1,12
2,16
2,18
2,22
2,46
2,63 2,65
1,20
2,32
2,34
2,47
2,63
2,76 2,87
1,07
1,94
1,98
2,00
2,10
2,25 2,30
0,97
1,96
1,95
2,02 2,07
2,17
2,25
0,87
1,67
1,68
1,76
1,35
2,13
1,98
1,21
2,23
2,29
2,36
2,51
2,60
2,74
1,39
2,86
2,93
2,43
3,38
3,54
3,65
1,31
2,37
2,47
2,45 2,62
2,75 2,87
1,04
2,09
2,09
2,25
2,32
2,36 2,44
1,29
2,46
2,49
2,57
2,69
2,35
2,92
in national currency
IRL 2)
IRL
1,42
2,78
2,85
3,06
3,24
3,41
3,59
1,05
2,13
2,25
2,54
2,68
3,06 3,18
2,23
2,39
2,63
2,83
3,01 3,33
0,97
1,88
2,00
2,22 2,41
2,54 2,76
0,99
2,07
2,27
2,45
2,95
2,98 3,22
1,46
1,59
1,75
1,36
1,96
2,17
0,97
1,71
1,87
2,12
2,25
2,35
2,53
1,24
2,70
2,78
3,16
3,38
3,51 3,71
2,36
2,48
2,67
2,96
3,14
3,46
0,82
1,68
1,92
2,13
2,29
2,53 2,63
I
DK
DKR
34,93
52,27
53,18
56,31
57,63
61,19
65,25
28,72
45,42
47,30
50,49
52,92
56,79
59,14
33,69
51,59
52,48
54,90
59,37
62,01 64,59
26,69
42,85
44,13
46,56 48,90
52,08 54,03
26,07
44,02
45,19
46,16 47,97
50,43 52,08
25,62
40,30
41,17
44,53
45,82
43,30
4 9,28
27,47
43,84
44,81
47,82
48,99
51,80
53,65
36,27
62,44
63,70
63,45
68,89
73,78
75,51
29,18
47,79
49,49
52,18 54,84
53,51
60, 74
28,03
44,94
46,28
50,92
51,83
54,73 66,59
GR
DRA
3)
3)
3)
3)
3)
3)
3)
36 ^Λ) ¡
93,2
99.3 ! 116,84 ; 125,8 ' ,
4! 167,0.* ! 181,8
4> Ι
36,6
ε .0 103,6
118,1 132,3
154,0 184,5
4)
4)
4)
4)
4)
4)
4)
37,1
93,1
105,4
116,5
129,8
173,7
181,4
35,2
91,8
100,7
117,0
129,5
171,3
186,9
1) Oc .ober 1 9 8 2 : p r o v i s i o n a l f i g u r e s 2) I r e l a n d : March and Sep tember
3) NACE 36 i n c l u d e d i n NACE 35
4) NACE 45 i n c l u d e d i n NACE 43


- 11 -TABLE A/6
Indices of average gross monthly earnings of non-manual workers (October 1975 = 100)
Total (men + women)
NACE
1 to 5 (except 16 + 17)
11, 13, 21, 23
12, 14, 15, 22, 24 to 26, 3, 4
. 11 Φ
^
12
13
14
. 15 w
16
17
21
All industries (except electricity, gas, steam and water)
Mining and quarrying
Total manufacturing industries
Extraction and briquetting of solid fuels
Coke ovens
Extraction of petroleum and natural gas
Mineral oil refining
Nuclear fuels industry
Production and distribution of electricity, gas, steam and hot water
t'ater supply: collection, purification and distribution of water
Extraction and preparation of metalliferous ores
IV.1980 X.1980 IV.1981 X.1931 IV.1932 X.1982
IV.1980 X.1980 IV.1981 X.1981
IV.1982 X.1982
IV.1980 X.1980 IV.1981 X.1981
IV.1932 X.1982
IV.1980 X.1980 IV.1981 X.1931 IV.1982 X.1982
IV.1980 X.1980 IV.1981 X.1981 IV.1932 X.1982
IV.1980 X.1980 IV.1981 X.1981 IV.1982 X.1982
IV.1980 X.1980 IV.1981 X.1931 IV.1982 X.1982
IV.1980 X.1980 IV.1981 X.1981 IV.1932 X.1982
IV.1980 X.1980 IV.1981 X.1931 IV.1932 X.1982
IV.1980 X.1980 IV.1981 X.1981 IV.1932 X.1982
IV.1980 X.1980 IV.1981 X.1981 IV.1932 X.1982
D
136,9 140,2 142,4 147,3 152,5 154,0
128,8 135,9 137,7 144,3 145,1 149,4
138,1 140,9 143,1 148,6 153,7 155,0
127.0jj 134,41 135,8 ; 142.7» 143,4 147,4X'
1) 1) 1) 1) 1) 1)
128,9 134,2 138,9 146,4 149,9 155,2
138,7 145,3 149,3 153,3 159,2 161,5
129,2 134,9 136,2 141,9 143,4 148,3
120,6 126,4 128,3 133,8 L33.7 138,7
125,3 126,2 128,2 133,7 L38,2 141,9
F
164,8 175,9 186,5 196,3 209,6 212,3
167,5 178,2 189,0 198,4
165,6 176,6 187,3 197,6 211,0 213,6
166,8*' 176,8 187,0 192,4] 200,0 ' 205,O2'
2) 2) 2) 2) 2) 2)
154,1 166,0 170,5 183,5
I
213,4 227,3 258,4 275,8 302,6 314,0
207,5 222,6 259,4 267,8 293,1 311,0
214,3 228,2 259,2 276,6 303,4 315,0
197,3 208,2 232,9 241,4 273,3 271,7
173,4 191,0 195,6 225,1 235,3 247,8
187,9 198,3 237,0 242,4 279,5 287,0
208,6 223,3 246,0 274,8 284,8 299,5
235,7 244,2 290,7 296,6 314,3 319,1
177,7 194,3 229,0 236,9 271,3 279,8
NL
141,7 142,0 146,2 150,7 158,4 161,9
130,1 128,9 132,8 140,3 144,4 149,6
141,2 141,6 146,2 150,5 158,4 161,9
134,6 132,9 134,5 142,7 145,9 150,5
135,3 137,0 139,8 145,3 151,3 156,8
Β
143,7 148,6 157,0 161,8 167,2 169,8
142,9 146,2 154,0 143,3 154,6 150,3
142,3 149,5 157,1 162,6 168,1 171,3
140,9 145,8 152,5 144,7 151,1 144,9
145,6 144,3 147,3 153,4 160,9 159,6
_ --_ --
157,5 165,4 180,7 181,7 195,6 187,9
124,6 130,3 140,8 144,9 152,3 154,4
135,9 141,8 149,4 152,1 158,1 160,8
_ ----
LS)
148,3 151,4 157,8 159,5 167,6 174,6
132,0 134,0 136,2 142,3 119,4 94,4
150,3 153,6 159,7 161,9 170,5 177,9
_ --_ _ -
-
_ --_ --_ --_ --_ --_ --
146,5 148,9 158,9 154,7 163,7 168,0
144,3 145,7 150,1 151,0
UK
183,9 196,8 208,0 222 7 233,5 240,5
207,4 217,3 251,7 266,5 296,0 276,3
184,4 196,2 207,5 223,3 233,0 241,7
_ --_ --
200,0 212,8 226,9 252,3 252,1 272,5
153,5 169,2 186,1 198,5 206,3 235,7
DK
146,2 149,6 160,5 165,2 179,9 184,8
151,0 148,9 143,9 164,2 176,4 170,8
146,2 149,6 160,5 165,1 180,0 184,8
_ ---_ —
-
_ --_ --
146,5 148,0 157,4 162,4 195,2 184,0
_ --_ --
_ --_ -
1) NACE 12 included in NACE 11 2) NACE 14 included in NACE 13 3) October 1982: provisional figures
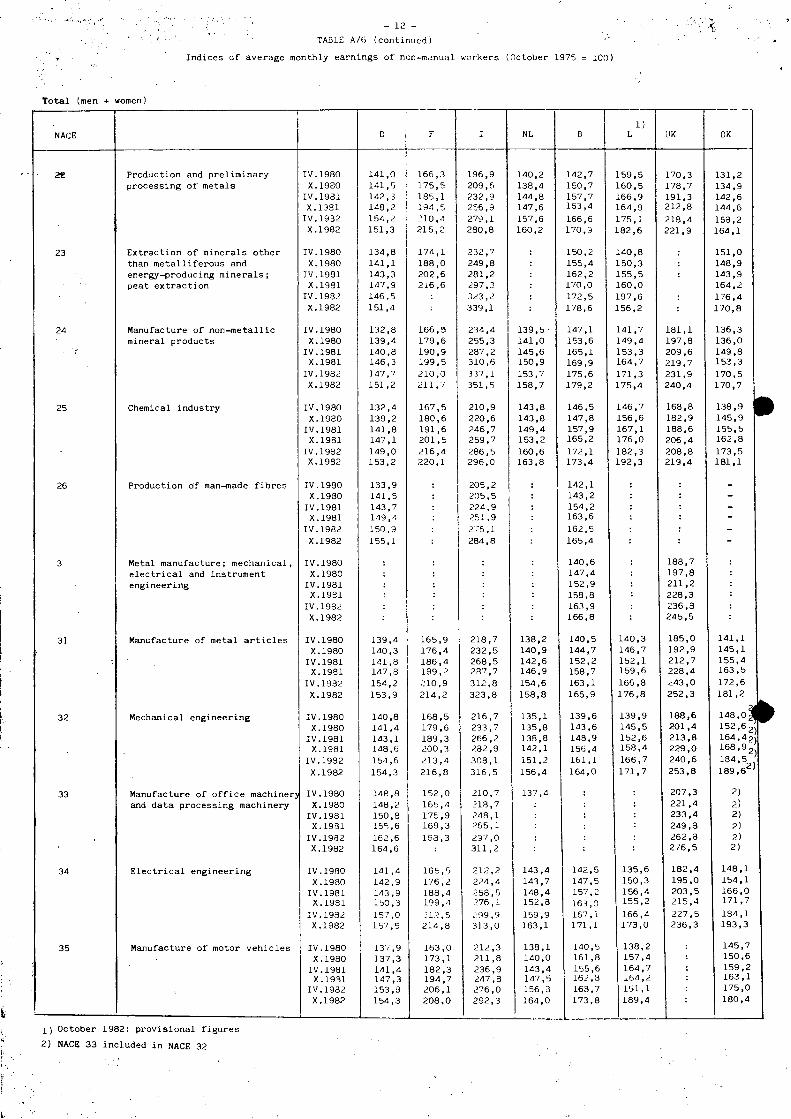
- 12 -TABLE A/6 (continued)
Indices of average monthly earnings of ncn-manual workers (October 1975 = ICO)
Total (men +
— NACE
28
23
24
25
26
3
31
32
33
34
35
»lomen ) ι
Production and preliminary processing of metals
Extraction of minerals other than metalliferous and energy-producing minerals; peat extraction
Manufacture of non-metallic mineral products
Chemical industry
Production of man-made fibres
Metal manufacture; mechanical, electrical and instrument engineering
Manufacture of metal articles
Mechanical engineering
Manufacture of office machinery and data processing machinery
Electrical engineering
Manufacture of motor vehicles
IV.1980 X.1980
IV.1931 X.1981 IV.1932 X.1982
IV.1980 X.1980
IV.1981 X.19S1
IV.1982 X.1982
IV.1980 X.1980
IV.1981 X.1981
IV.1982 X.1982
IV.1980 X.1980
IV.1981 X.1981
IV.1982 X.1982
IV.1980 X.1980
IV.1981 X.1981
IV.1982 X.1982
IV.1980 X.1980
IV.1981 X.1931
IV.1982 X.1982
IV.1980 X.1980
IV.1981 X.1981
IV.1932 X.1982
IV.1980 X.1980
IV.1981 X.1981
IV.1932 X.1982
IV.1980 X.1980
IV.1981 X.1931
IV.1932 X.1982
IV.1980 X.1980 IV.1981 X.1981
IV.1932 X.1982
IV.1980 X.1980
IV.1981 X.1931
IV.1932 X.1982
D
141,0 141,5 142,3 148,2 154,2 151,3
134,8 141,1 143,3 147,9 146,5 151,4
132,8 139,4 140,8 146,3 147,7 151,2
132,4 139,2 141,8 147,1 149,0 153,2
133,9 141,5 143,7 149,4 150,9 155,1
139,4 140,3 141,8 147,8 154,2 153,9
140,8 141,4 143,1 148,6 154,6 154,3
148,8 148,2 150,8 155,6 162,6 164,6
141,4 142,9 143,9 150,3 157,0 157,5
137,9 137,3 141,4 147,3 153,9 154,3
F
166,3 175,5 185,1 194,5 210,4 215,2
174,1 188,0 202,6 216,6
166,5 179,6 190,9 199,5 210,0 211,7
167,5 180,6 191,6 201,5 216,4 220,1
165,9 176,4 186,4 199,2 210,9 214,2
168,5 179,6 189,3 200,3 213,4 216,8
152,0 165,4 175,9 169,3 163,3
165,5 176,2 188,4 199,4 :12,5 214,8
163,0 173,1 182,3 194,7 206,1 208,0
I
196,9 209,6 232,9 256,9 279,1 280,8
232,7 249,8 281,2 297,3 323,2 339,1
234,4 255,3 287,2 310,6 337,1 351,5
210,9 220,6 246,7 259,7 286,5 296,0
205,2 205,5 224,9 251,9 276,1 284,8
218,7 232,5 268,5 287,7 312,8 323,8
216,7 233,7 266,2 232,9 303,1 316,5
210,7 218,7 248,1 265,1 237,0 311,2
212,2 224,4 258,5 276, i 299,9 313,0
212,3 211,8 236,9 247,3 276,0 292,3
NL
140,2 138,4 144,8 147,6 157,6 160,2
139,5· 141,0 145,6 150,9 153,7 158,7
143,8 143,8 149,4 153,2 160,6 163,8
138,2 140,9 142,6 146,9 154,6 158,8
135,1 135,8 138,8 142,1 151,2 156,4
137,4
143,4 143,7 148,4 152,3 159,9 163,1
138,1 140,0 143,4 147,5 156,3 164,0
Β
142,7 150,7 157,7 163,4 166,6 170,9
150,2 155,4 162,2 170,0 172,5 178,6
147,1 153,6 165,1 169,9 175,6 179,2
146,5 147,8 157,9 165,2 172,1 173,4
142,1 143,2 154,2 163,6 162,5 165,4
140,6 147,4 152,9 158,8 163,9 166,8
140,5 144,7 152,2 158,7 163,1 165,9
139,6 143,6 148,9 156,4 161,1 164,0
142,5 147,5 157,2 163,0 167,1 171,1
140,5 161,8 155,6 162,3 163,7 173,8
1) L
159,5 160,5 166,9 164,9 175,1 182,6
140,8 150,3 155,5 160,0 197,6 156,2
141,7 149,4 153,3 164,7 171,3 175,4
146,7 156,6 167,1 176,0 182,3 192,3
140,3 146,7 152,1 159,6 166,8 176,8
139,9 145,5 152,6 158,4 166,7 171,7
135,6 150,3 156,4 155,2 166,4 173,0
138,2 157,4 164,7 164,2 151,1 189,4
UK
170,3 178,7 191,3 212,8 218,4 221,9
181,1 197,8 209,6 219,7 231,9 240,4
168,8 182,9 188,6 206,4 208,8 219,4
188,7 197,8 211,2 228,3 236,3 245,5
185,0 192,9 212,7 228,4 243,0 252,3
188,6 201,4 213,8 229,0 240,6 253,8
207,3 221,4 233,4 249,3 262,8 2/6,5
182,4 195,0 203,5 215,4 227,5 236,3
DK
131,2 134,9 142,6 144,6 153,2 164,1
151,0 148,9 143,9 164,2 176,4 170,8
136,3 136,0 149,8 153,3 170,5 170,7
138,9 1 145,9 155,5 162,8 173,5 181,1
-
141,1 145,1 155,4 163,5 172,6 181,2
148,θ| 152,62' 164,4 2{ 168,92
134,5 189,6 '
2) 2) 2) 2) 2) 2)
148,1 154,1 166,0 171,7 134,1 193,3
145,7 150,6 159,2 163,1 175,0 180,4
1 ) October 1982: provisional figures 2) NACE 33 included in NACE 32

- 13 -TABLE A/6 (end)
Indices of average monthly earnings of non-manual workers (October 1975 = 100)
Total (men +
NACE
36
37
41/42
åk w
43
44
45
46
A ^
47
48
49
50
women)
Manufacture of other means of transport
Instrument engineering
Food, drink and tobacco industry
Textile industry
Manufacture of leather and of leather goods
Manufacture of clothing and footwear
Timber and wooden furniture industries
Manufacture of paper and paper products; printing and publishing
Processing of rubber and plastics
Other manufacturing industries
Building and civil engineering
IV.1980 X.1980 IV.1981 X.1931 IV.1932 X.1982
IV.1980 X.1980 IV.1981 X.1931
IV.1932 X.1982
IV.1980 X.1980 IV.1981 X.1981
IV.1932 X.1982
IV.1980 X.1980 IV.1981 X.1931
IV.1932 X.1982
IV.1980 X.1980 IV.1981 X.1981
IV.1932 X.1982
IV.1980 X.1980 IV.1981 X.1931
IV.1932 X.1982
IV.1980 X.1980 IV.1981 X.1981
IV.1982 X.1982
IV.1980 X.1980 IV.1981 X.1981 IV.1982 X.1982
IV.1980 X.1980 IV.1981 X.1981
IV.1982 X.1982
IV.1980 X.1980 IV.1981 X.1981 IV.1932 X.1982
IV.1980 X.1980 IV.1981 X.1981 IV.1982 X.1982
D
139,9 141,4 143,7 149,9 156,5 155,5
139,8 141,3 143,8 149,3 156,3 156,2
131,3 136,8 139,5 144,0 146,4 150,9
129,0 136,4 136,8 142,5 143,6 147,4
136,9 137,8 146,1 147,0 152,5 151,4
131,7 138,0 140,3 145,2 148,1 150,3
138,6 139,8 146,0 146,9 151,6 152,1
136,6 139,4 142,3 146,3 149,3 151,9
133,2 138,4 141,1 146,6 149,7 153,3
135,5 139,3 141,5 146,6 150,2 152,2
126,7 135,3 136,5 140,3 141,2 145,4
F
168,4 179,7 193,1 205,3 217,6 220,5
164,0 177,2 180,3 139,9 205,6 212,7
166,5 176,5 186,6 199,1 210,7 214,2
165,3 175,7 186,5 201,3 214,6 215,4
163,3 175,5 187,9 197,2 210,2 209,6
166,3 176,1 190,3 199,4 215,5 216,8
162,9 174,9 184,9 196,5 203,3 211,3
163,3 172,0 183,1 194,3 205,4 206,9
165,1 178,8 188,4 201,9 217,3 219,0
172,0 183,4 199,7 211,0 221,9 222,8
159,2 171,6 181,3 193,9 203,9 206,3
I
198,3 214,3 244,5 265,3 285,4 293,6
216,0 231,9 260,5 275,4 312,3 328,0
203,4 227,0 253,2 274,6 305,0 321,3
228,0 244,1 278,4 294,8 323,7 332,8
242,2 264,7 292,8 316,3 352,8 360,0
235,6 255,2 293,8 312,2 348,0 357,4
243,3 266,1 301,7 324,3 356,0 367,6
199,4 214,2 239,8 253,3 276,3 303,1
216,3 230,7 271,0 284,5 312,8 323,9
220,6 244,6 273,3 296,5 326,7 337,7
236,0 251,5 291,1 312,6 343,2 354,4
NL
131,2 128,6 135,1 137,8 145,7 147,2
142,8 139,0 141,2 146,0 155,6 158,3
144,6' 144,6 149,3 154,9 161,5 164,7
134,9 137,5 144,2 143,3 157,6 160,2
148,8 147,0 152,9 155,7 169,5 169,5
138,8 138,3 141,3 146,4 153,9 157,7
139,2 142,2 145,2 148,8 155,9 160,2
145,7 145,7 148,4 152,6 160,1 162,4
B
135,0 143,1 148,2 155,0 161,8 163,8
142,8 149,9 159,3 161,6 166,9 166,3
144,5 151,1 156,3 164,1 168,4 172,9
144,0 146,6 153,3 159,6 163,9 170,2
153,6 174,1 168,5 170,1 175,3 176,9
138,9 146,9 154,1 159,5 164,9 172,6
144,4 150,6 155,6 159,5 163,9 166,5
142,8 147,1 154,8 160,4 166,9 169,3
143,2 148,7 155,2 162,5 168,4 172,5
142,2 177,1 155,4 162,4 163,7 179,4
149,8 153,4 158,8 165,1 170,3 172,0
1) L
152,4 158,0 162,0 170,9 178,6 182,2
154,5 169,6 165,7 174,5 198,6 194,5
156,5 169,6 165,9 173,7 179,6 179,3
141,0 148,0 156,7 161,3 164,6 173,1
137,3 145,3 155,5 152,7 168,0 175,8
136,4 142,1 143,2 155,7 160,9 162,1
UK
191,0 201,6 212,7 233,7 236,8 241,2
180,6 190,6 196,9 248,2 223,1 227,3
182,9 197,9 210,5 226,2 239,0 248,0
179,2 191,2 195,4 211,0 219,2 224,9
188,6 200,6 215,0 219,6 224,2 216,9
178,0 198,0 209,4 220,4 226,6 241,2
180,1 193,9 201,0 218,2 226,4 233,2
173,5 197,4 194,9 215,7 225,1 232,5
220,8 210,7 233,5 264,3 235,4 295,4
173,8 192,0 198,7 207,2 218,5 224,4
DK
146,8 153,4 161,5 170,0 179,5 189,6
152,9 156,7 168,1 169,3 188,9 197,4
142,0 145,3 155,0 161,3 173,1 178,4
144,0 148,7 156,9 162,6 178,3 179,0
154,9 141,5 140,9 147,7 168,4 176,1
138,4 141,1 145,5 148,4 163,9 169,0
145,6 150,3 157,7 165,0 178,3 185,0
164,0 162,1 181,8 176,6 202,3 198,5
152,1 159,0. 165,2 173,3 137,3 188,3
135,1 141,4 144,4 143,3 166,4 181,4
1) October 1982: provisional figures


15
Β. EARNINGS IN SERVICES *)
Table B/l Trends of average gross monthly nominal earnings
of nonmanual workers (indices October 1980 = 100)
1 . Who le sa l e t r a d e
•
2 . R e t a i l t r a d e
3 . Banking
Φ
4 . I n s u r a n c e
IV. 81
X.81
IV. 82
X.82
IV.81
X.81
IV. 82
X.82
IV. 81
X.81
IV. 82
X.82
IV. 81
X.81
IV. 82
X.82
Τ
M
F
Τ
M
F
Τ
M
F
Τ
M
F
Τ
M
F
Τ
M
F
Τ
M
F
Τ
M
F
Τ
M
F
Τ
M
F
Τ
M
F
Τ
M
F
Τ
M
F
Τ
M
F
Τ
M
F
Τ
M
F
D
1 0 2 , 1
1 0 1
1 0 3
1 0 4
1 0 4
1 0 5
1 0 7
1 0 7
1 0 8
1 0 9
1 0 8
109,
1 0 2
102,
102 ,
1 0 5
104,
105 ,
1 0 8
1 0 8
1 0 8
1 0 9
1 0 8
1 0 9
1 0 1
1 0 1
1 0 1
1 0 5
1 0 5
1 0 5
1 0 8
1 0 8
1 0 9
1 1 0
1 0 9
1 1 0
1 0 1
1 0 1
1 0 1
1 0 6
1 0 5
1 0 6
1 1 0
1 0 9
1 1 0
1 1 1
1 1 0
1 1 1
7
0
3
1
3
5
0
4
1
7
8
7
4
5
8
4
5
5
2
2
9
6
3
2
3
1
0
¿
7
3
0
0
8
0
9
9
7
0
,9
, 0
,2
. 9
. 3
, 4
, 9
, 4
F
106 ,2
105,7
106 ,6
1 1 2 , 3
111 ,6
114 ,2
120 ,4
119 ,4
121 ,9
122 ,2
121 ,2
1 2 4 , 3
1 0 6 , 3
106 ,0
105 ,6
113 ,0
1 1 1 , 7
113 ,5 121 ,1
119 ,9
121 ,8
122 ,1
120 ,0 1 2 2 , 7
108 ,0
108 ,4
107 ,4
120 ,3
119 ,9
1 1 9 , 7
1 2 7 , 8
127 ,3 1 2 7 , 1
1 2 9 , 5
1 2 8 , 8
1 2 8 , 8
104 ,3
105 ,5
105 ,6
1 1 2 , 3 113 ,2
113 ,9
1 2 1 , 0
120 ,9
121 ,4
126 ,2
125 ,4
125 ,9
I N L 1 )
1 0 2 , 1
1 0 2 , 1
102 ,9
1 0 5 , 2
1 0 5 , 4
105 ,0 110 ,2
1 0 9 , 8
111 ,9
1 1 3 , 0
1 1 2 , 8
1 1 4 , 8
1 0 1 , 7
1 0 1 , 3
102 ,2
1 0 3 , 3
103 ,4
103 ,0
107 ,6
1 0 8 , 0
106 ,9
1 0 9 , 9
1 0 9 , 8
109 ,4
1 0 3 , 8
1 0 3 , 5
1 0 3 , 8
1 0 6 , 6
106 ,6 1 0 6 , 7
113 ,2
1 1 2 , 3
1 1 4 , 3
116 ,4
115 ,4
117 ,0
1 0 5 , 1
1 0 4 , 5
1 0 5 , 1
1 0 6 , 7
106 ,4
107 ,2
1 1 1 , 8 1 1 0 , 7
114 ,4
1 1 3 , 7
1 1 2 , 1
1 1 6 , 5
B
1 0 4 , 5
1 0 4 , 5
104 ,9
1 0 8 , 8
1 0 8 , 5
109 ,6
1 1 3 , 0
112 ,6 1 1 4 , 1
1 1 5 , 4
1 1 5 , 1
1 1 6 , 1
1 0 3 , 8
1 0 3 , 1
104 ,4
109 ,6
108 ,9
1 1 0 , 0
1 1 2 , 8
112 ,0
113 ,6
1 1 6 , 7
1 1 7 , 8
1 1 4 , 1
1 0 7 , 0
107 ,6
105 ,2
1 1 0 , 8
1 1 1 , 1 110 ,2
1 1 6 , 1 1 1 6 , 7
1 1 4 , 8
117 ,4
1 1 7 , 5 1 1 7 , 1
1 0 5 , 7
1 0 6 , 0
1 0 5 , 3
109 ,9
109 ,9
110 ,0
1 1 4 , 8
1 1 4 , 8
1 1 4 , 8
1 1 7 , 0
116 ,9
1 1 7 , 1
L 2 )
1 0 4 , 9
105 ,2
104 ,2
1 0 7 , 9
108 ,2
108 ,5
1 1 2 , 8
1 1 2 , 1
112 ,7
1 1 5 , 7
114 ,8
115 ,9
104 ,5
102 ,4
104 ,6
1 1 2 , 3
109 ,5
114 ,1
114 ,9
107 ,4
1 1 9 , 3
118 ,5
1 1 1 , 1
123 ,2
105 ,7
1 0 5 , 1
1 0 7 , 1
1 1 1 , 3
111 ,8 110 ,7
117 ,6
117 ,6
118 ,4
120 ,5 121 ,7
120 ,0
105 ,0
1 0 3 , 5
1 0 8 , 3
105 ,7
104 ,7
1 1 0 , 1
113,C
1 1 1 , 1
118 ,8
116 ,3
114 ,2
122 ,3
UK IRL DK GR
*) NACE references: see next page
1) Including manual workers
2) October 1982: provisional figures

16 -
Table B/2 - Trends of average gross monthly real earnings of non-manual workers (indices - October 1930 = 100)
1.
2.
3.
4.
Wholesale trade
Retail trade
Banking
Insurance
IV.81 X.31 IV.82 X.82 IV.31 X.31 IV.82 X.82 IV.81 X.31 IV. 82 X.82 IV.81 X.81 IV.82 X.82
D
93,1 97,3 93,3 97,5 93,6 98,6 99,2 97,6 97,3 93,5 99,4 98,3 97,9 99,4 100,3 99,5
F
100,1 98,5 99,5 98,0 100,2 99,1 100,1 98,0 101,3 105,5 105,6 103,9 98,3 98,5 100,0 101,2
I NL 2 )
93,6 97,9 99,3 100,2 93,2 96, i 97,4 97,4 100,2 99,2 102,5 103,2 101,5 99,3 101,2 100,8
Β
100,3 100,9 100,5 97,7
100,2 101,7 100,3 98,6 103,2 102,3 103,2 99,2 102,0 102,0 102,1 98,8
L 3)
100,0 99,1 99,6 96,3 99,7 103,1 101,4 98,6
100,3 102,2 103,3 100,3 100,1 97,1 99,8 96,8
UK IRL DK GR
1) Data obtained by deflation of nominal data by means of consumer prices indices 2) Including manual workers 3) October 1982: provisional figures
3t) NACE references:
Wholesale trade
Retail trade
Banking
Insurance
(3) NACE
61
64/65, excl. NACE 651 (retail distribution cf motor vehicles and cycles) and NACE 652 (retail distribution of motor fuels and lubricating oils
312/813
32
(3) General Industrial Classification of Economic Activities within the European Communities, EUROSTAT 1970.

- 17 -
AVERAG* WEEKLY HOURS OF WORK OFFERED TO gjjjjM. WORKERS - BY INDUSTRIAL GROUPS
Hours (and decimals)
N A C E NL UK IDI.
1-5 (except 16+17)
11,13 21,23
All industries (except electricity, gas, steam and water)
Mining and quarrying
12,14,15 22,24 to 26, 3 , 4
11
Total manufacturing Industries
Extraction and briquett ing of s o l i d fue ls
12 Coke ovens
r13 Extraction of petroleum and natural gas
14 Mineral o i l re f in ing
15 Nuclear fuels industry
X 1975 IV 1980 X 1980 IV 1981 X 1981 IV 1982 X 1982
X 1975 IV 1980 X 1980 IV 1981 X 1981 IV 1982 X 1982
X 1975 IV 1980 X 1980 IV 1981 X 1981 IV 1982 X 1982
X 1975 IV 1980 X 1980 IV 1981 X 1981 IV 1982 X 1982
X 1975 IV 1980 X 1980 IV 1981 X 1981 IV 1982 X 1982
X 1975 IV 1980 X 1980 IV 1981 X 1981 IV 1982 X 1982
X IV X
1975 1980 1980
IV 1981 X 1981 IV 1982 X 1982
X 1975 IV 1980 X 1980 IV 1981 X 1981 IV 1982 X 1982
40,9 41,8 41,6 41,1 41,3 40,8 40,0
41,5 41,8 41,5 41,6 41,7 41,2 41,0
40,6 41,8 41,5 41,1 41,3 40,9 39,8
40,9 41,1 40,6 41,0 41,2 40,8 40,6
44,1 43,3 43,9 43,0 43,7 43,3 43,5
41.1 41,2 41,0 40,8 41,0 40,7 40,9
42,4 40,9 40,9 40,6 40,6 39,5 39,4 40,8 40,0 39,9 39,9 39,8 38,3 38,8
41,5 40,6 40,6 40,3 40,3 39,3 39,2
39,2 39,2 39,2 39,5 39,2 38,3 38,3
40,3 40,1 40,2 39,9 40,0 39,1 39,0
41,5 39,2 38,4 37,9 38,6 38,1 37,5
41,5 38,2 39,4 38,3 39,4 39,0 39,0
41,5 39,2 38,4 37,9 38,5 38,0 37,4
42,0 40,0 40,0 40,0 40,0
41,3 39,3 39,3 39,3 39,3 38,4 37,9
40,6 40,0 40,0 40,0 40,0 40,0 40,0
42,0 39,8 38,9 39,3 39,0 39,6 38,8
40,8 41,0 40,8 40,6 40,7 40,6 40,6
43,5 42,4 43,0 43,1 42,8 41,7 41,7
40,7 41,1 40,9 40,7 40,7 40,6 40,6
41,3 40,9 40,9 40,9 40,6 40,2 40,3
37,1 36,9 35,7 34,7 35,9 35,6 34,9
40,5 38,5 38,7 39,0 39,0 38,6 37,9
36,3 36,8 35,4 34,3 36,0 35,6 35,1
40,0 37,8 38,1 37,8 38,1 37,9 38,2
40,1 41,1 31,8 40,6 41,4 40,7 36,4
39,9 38,4 38,4 38,8 38,8 38,4 39,6
40,9 40,7 40,2 40,5 40,6 38,9 39,0
40,0 42,2 39,8 40,6 39,1 39,8 39,3
40,8 40,4 40,0 40,6 40,3 38,7 38,8
41,8
40,7 '
t\,A
41,4
46,9
47,7
45,9
41,1
40,1
40.9
40,9
45,3
42,6
40,7
42,5
42,0
42,9
42,2 42,2 42,3 41,4 42,5 41,4 41,7
43,5 44,0 44,2 41,4 46,0 39,7 42,5
41,5 41,2 41,1 40;6 41,6 40,6 40,5
47,7 47,9 47,3 45,8 49,5 47,4 50,3
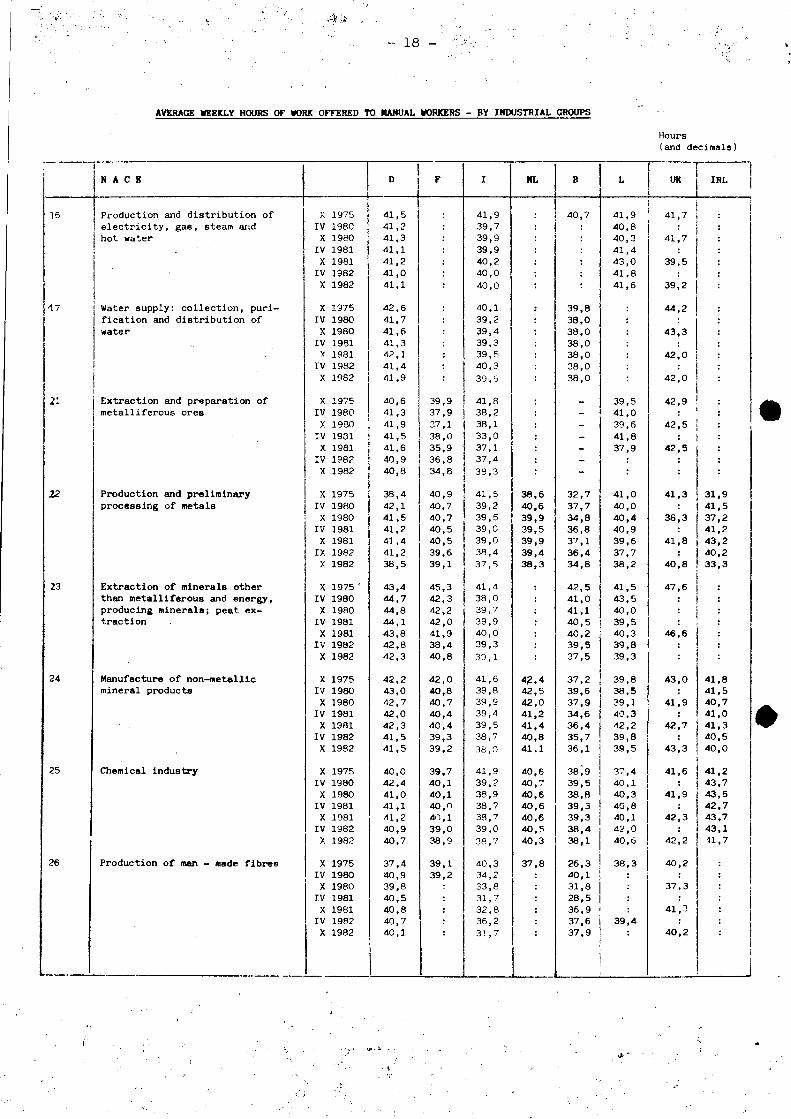
18
AVERAGE WEEKLY HOURS OF WORK OFFERED TO MANUAL WORKERS BY INDUSTRIAL GROUPS
Hours
(and decimals)
15
47
21
22
23
24
25
26
N A C E
Production and distribution of
electricity, gas, steam and
hot water
Water supply: collection, puri
fication and distribution of
water
Extraction and preparation of
metalliferous ores
Production and preliminary
processing of metals
Extraction of minerals other
than metalliferous and energy,
producing minerals; peat ex
traction
Manufacture of nonmetallic
mineral products
Chemical industry
Production of man made fibres
X 1975
IV 198C
X 1980
IV 1981
X 1981
IV 1982
X 1982
X 1975
IV 1980
X 1980
IV 1981
X 1981
IV 1982
X 1982
X 1975
IV 1980
X 1980
IV 1901
X 1981
IV 1982
X 1982
X 1975
IV 1980
X 1980
IV 1981
X 1981
IX 1982
X 1982
X 1975 '
IV 1980
X 1980
IV 1981
X 1981
IV 1982
X 1982
X 1975
IV 1980
X 1980
IV 1981
X 1981
IV 1982
X 1982
X 1975
IV 1980
X 1980
IV 1981
X 1981
IV 1982
X 1982
X 1975
IV 1980
X 1980
IV 1981
X 1981
IV 1982
X 1982
D
41,5
41,2
41,3
41,1
41,2
41,0
41,1
42,6
41,7
41,6
41,3
42,1
41,4
41,9
40,6
41,3
41,9
41,5
41,6
40,9
40,8
38,4
42,1
41,5
41,2 41,4
41,2
38,5
43,4
44,7
44,8
44,1
43,8
42,8
42,3
42,2
43,0
42,7
42,0
42,3
41,5
41,5
40,0
42,4
41,0
41.1 41,2
40,9
40,7
37,4
40,9
39,8
40,5
40,8
40,7
40,1
F
Γ
39,9
37,9
37,1
38,0
35,9
36,8
34,8
40,9
40,7
40,7
40,5
40,5
39,6
39,1
45,3
42,3
42,2
42,0
41,9
38,4
40,8
42,0
40,8
40,7
40,4
40,4
39,3
39,2
39,7
40,1
40,1
40,o
40,1
39,0
38,9
39,1
39,2
I
41,9
39,7
39,9
39,9
40,2
40,0
40,0
40,1
39,2
39,4
39,3
39,5
40,3
39,5
41,8
38,2
38,1
33,0
37,1
37,4
38,3
41,5
39,2
39,5
39,0
39,0
38,4
37,5
41,4
38,0
39,7
39,9
40,0
39,3
39,1
41,6
39,8
39,9
39,4
39,5
38,7
38,0
41,9
39,2
38,9
38,7
38,7
39,0
38,7
40,3
34,2
33,8
31,7
32,8
36,2
31,7
HL
.
38,6
40,6
39,9
39,5
39,9
39,4
38,3
:
42,4
42,5
42,0
41,2
41,4
40,8
41.1
40,6
40,7
40,6
40,6
40,6
40,5
40,3
37,8
Β
40,7
39,8
38,0
38,0
38,0
38,0
38,0
38,0
_
32,7
37,7
34,8
36,8
37,1
36,4
34,8
42,5
41,0
41,1
40,5
40,2
39,5
37,5
37,2
39,6
37,9
34,6
36,4
35,7
36,1
38Í9
39,5
38,8
39,3
39,3
38,4
38,1
26,3
40,1
31,8
28,5
36,9
37,6
37,9
L
41,9
40,8
40,3
41,4
43,0
41.8
41,6
39,5
41,0
39,6
41,8
37,9
41,0
40,0
40,4
40,9
39,6
37,7
38,2
41,5
43,5
40,0
39,5
40,3
39,8
39,3
39,8
38,5
39,1
40,3
42,2
39,8
39,5
37,4
40,1
40,3
40,8
40,1
42,0
40,6
38,3
: ;
39,4
:
UK
41,7
41,7
39,5
39,2
44,2
43,3
42,0
42,0
42,9
. 42,5
42,5
41,3
38,3
41,8
40,8
47,6
46,6
43,0
: 41,9
42,7
43,3
41,6
41,9
42,3
42,2
40,2
: 37,3
41,3
40,2
IRL
i
•
.
31,9
41,5
37,2
41,2 43,2
40,2
33,3
:
41,8
41,5
40,7
41,0
41,3
40,5
40,0
41.2
43,7
43,5
42,7
43,7
43,1
♦1,7
1
·· • •
I i
í

- 19 -
AVERAGE WEEKLY HOURS OF WORK OFFERED TO MANUAL WORKERS - BY INDUSTRIAL GROUPS
Hours (and decimals)
!
41 w
A ψ
3
31
32
33
34
35
36
37
N A C E
Metal manufacture; mechanical, electrical and instrument engineering
Manufacture of metal articles
Mechanical engineering
Manufacture of office machinery and data processing machinery
Electrical engineering
Manufacture of motor vehicles and of motor vehicles parts and accessories
Manufacture of other means of transport
Instrument engineering
1 [
X 1975 IV 1980 X 1980 IV 1981 X 1981 IV 1982 X 1982
X 1975 IV 1980 X 1980 IV 1981 X 1981 IV 1982 X 1982
X 1975 IV 1980 X 1980 IV 1981 X 1981 IV 1982 X 1982
X 1975 IV 1980 X 1980
IV 1981 X 1981 IV 1982 X 1982
X 1975 IV 1980 X 1980 IV 1981 X 1981 IV 1982 X 1982
X 1975 IV 1980 X 1980 IV 1981 X 1981 IV 1982 X 1982
X 1975 IV 1980 X 1980 IV 1981 X 1981 IV 1982 X 1982
X 1975 IV 1980 X 1980 IV 1981 X 1981 IV 1982 X 1982
D
41.7 41,4 40,9 41.2 40,8 39,3
41,6 42,7 42,1 41,7 41,9 41,5 40,6
40,5 42,6 42,4 41,6 41,5 40,8 40,0
40,1 39,7 40,6 38,8 40,1 39,8 40,5
39,0 41,0 40,9 40,1 40,2 40,3 39,4
41,7 40,7 40,2 40,1 40,9 40,7 37,1
43,6 43,3 43,2 43,0 43,1 42,1 40,6
38,8 40,7 40,5 39,6 39,8 39,7 39,0
F
40,8 40,7 40,4 40,3 39,2 39,2
42,3 41,2 41,1 40,7 40,5 39,5 39,4
41,4 40,8 40,7 40,5 40,2 38,9 39,0
41,1 40,2 40,2 40,1 40,1 39,1 39,1
41,1 40,3 40,3 40,1 40,1 39,1 39,1
41,6 40,8 40,5 40,3 40,2 39,2 39,3
42,0 40,7 40,6 40,4 40,1 39,1 39,0
41,5 40,6 40,4 40,3 40,0 39,2 39,0
I
41,5 39,3 38,3 38,0 38,8 37,9 37,7
41,7 39,7 39,7 39,3 39,2 39,0 38,1
41,8 39,3 39,8 38,3 39,6 36,7 35,1
41,5 39,1 37,6 37,0 37,6 37,2 37,0
40,9 40,1 34,0 32,8 36,8 34,9 32,8
41,6 39,2 39,9 39,6 39,6 39,8 39,2
41,6 38,9 38,9 36,2 39,3 38,4 38,4
NL
41,0 40,7 40,5 40,4 40,4 40,5
39,9 41,3 41,3 40,7 40,6 40,0 40,8
40,7 41,5 41.2 40,8 40,8 40,9 40,8
40,5 41,0 40,7
39,6 40,3 40,2 40,1 40,1 40,0 40,1
38,6 40,7 37,8 39,3 38,3 40,2 40,6
41,4 41,4 41,1 41,5 41,3 41,0 40,5
39,5 40,3 40,3 40,4 40,2 39,4 40,0
Β
36,9 35,7 35,3 36,1 36,1 35,7
36,6 38,0 37,5 35,4 37,0 36,0 36,7
36,7 38,5 36,6 36,9 35,7 36,2 34,7
41,8 :
: 36,0 33,6 34,2 30,6 32,2 32,6 31,6
39,5 38,1 32,1 35,5 36,7 38,3 36,7
38,6 38,6 39,0 38,1 37,2 37,8 37,0
38,2 38,2 38,1 36,9 37,1 36,2 37,5
L
41,2 39,9 40,2 40,4 39,7 39,4
40,8 40,8 30,2 41,1 40,5 39,8 38,9
42,5 41,5 40,8 39,3 40,3 39,5 40,0
:
42,2 40,9 40,8 40,1 42,6 39,4 38,0
40,3 41,8 38,7 41,1 40,1 40,0 40,4
:
UK
41.2
39,4
40,7
40,6
41,3
39,0
41,2
40,9
42,0
40,2
41,0 :
40,9
41,4
40,3
40,5
39,6
40,0
39,6
40,2
40,2
40,9
39,0
39,3
39,4
42,1
39,8
41,6
41,2
40,2
40,2
40,5
40,2
IRL
42,8 43,0 41,0 39,8 41,7 40,2 40,3
38,9 40,6 37,7 36,8 38,9 40,0 39,6
42,3 42,6 43,8 41,6 38,6 40,2 41,5
39,8 40,2 39,3 39,3 40,6 39,0 38,4
37,6 41,0 40,3 41,0 41,2 40,5
! 38,7
42,1 43,2 41,9 41,5 39.5
i 39,8 i 37,8
; 40,o ! 39,2 1 39,9 ! 38,7 1 39,5 i 39,2 l 4C I
,1

- 20 - UUAO83005ENC
AVERAGE WEEKLY HOURS OF WORK OFFERED TO MANUAL WORKERS - BY INDUSTRIAL GROUPS
Hours (and decimals)
41/42
43
44
45
46
47
48
49
50
N A C E
Food, drink and tobacco industry
Textile industry
Manufacture of leather and of leather goods
Manufacture of clothing and footwear
Timber and wooden furniture industries
Manufacture of paper and paper products; printing and publishing
Processing of rubber and plastics
Other manufacturing industries
Building and civil engineering
X 1975 IV 1980 X 1980 IV 1981 X 1981 IV 1982 X 1982
X 1975 IV 1980 X 1980 IV 1981 X 1981
IV 1982 X 1982
X 1975 IV 1980 X 1980 IV 1981 X 1981 IV 1982 X 1982
X 1975 IV 1980 X 1980 IV 1981 X 1981 IV 1982 X 1982
X 1975 IV 1980 X 1980 IV 1981 X 1981 IV 1982 X 1982
X 1975 IV 1980 X 1980
IV 1981 X 1981 IV 1982 X 1982
X 1975 IV 1980 X 1980 IV 1981 X 1981 IV 1982 X 1982
X 1975 IV 1980 X 1980 IV 1981 X 1981 IV 1982 X 1982
X 1975 IV 1980 X 1980 IV 1981 X 1981 IV 1982 X 1982
D
44,0 43,2 43,7 43,2 43,8 42,6 43,6
39,3 41,3 40,7 40,2 40,5 40,0 39,7
40,6 40,6 40,4 40,8 40,7 40,3 39,6
38,8 39,7 39,6 39,2 38,9 38,5 37,8
41.7 42,3 41,6 41,0 40,4 40,2 39,6
41 .,1 42,5 42,1 42,1 42,2 41,7 41,5
40,5 41,6 40,8 40,6 40,7 40,8 40,0
39,4 40,4 40,2 39,9 40,1 39,8 39,4
42,5 41,9 42,2 41,5 41,3 40,7 40,9
r
43,6 41,1 41.1 40,9 41,1 39,5 39,7
39,9 40,2 39,8 39,5 39,8 39,2 39,0
42,2 40,6 39,8 40,4 39,8 39,2 39,1
40,6 40,2 40,2 40,1 40,2 39,4 39,3
42,8 41,4 41,2 40,6 40,6 39,6 39,6
41,4 40,4 40,3 40,1 40,0 39,0 38,9
41,6 40,6 40,4 40,3 40,2 39,1 39,1
41,3 40,0 40,0 39,8 39,9 39,1 39,1
45,8 42,1 42.1 41,8 41,6 40,2 40,2
I
42,0 39,4 39,8 39,2 39,8 38,7 39,2
41,4 38,5 37,8 37,3 37,6 37,5 36,8
41,6 38,5 39,3 38,1 39,3 39,8 38,6
41,2 38,0 38,6 38,2 38,5 38,5 38,1
41,5 40,0 39,6 39,4 39,4 39,2 38,8
41,4 39,2 39,1 38,6 39,3 38,3 38,4
41,5 39,2 38,0 38,7 37,9 37,8 38,1
41,7 38,8 39,1 38,0 38,2 37,2 38,1
41,4 39,0 39,4 38,7 39,4 39,5 39,0
ML
42,2 41,6 41,7 41,3 41,4 41,3 41,3
39,7 40,9 39,9 39,9 40,3 40,6 40,5
40,8 40,9 40,7 : : :
40,5 40,3 40,2 40,1 39,9 39,4 40,1
41,0 40,9 40,9 40,4 40,9 40,3 40,7
40,6 41,1 40,9 40,8 40,7 40,7 40,6
40,8 41,3 40,9 40,6 40,7 40,5 40,8
40,6
41,2 40,8 40,7 40,6 40,7 40,6 40,6
Β
40,8 38,0 38,2 36,8 36,9 37,0 36,6
34,7 35,5 34,9 34,7 35,3 33,8 34,7
35,9 36,2 34,5 36,0 36,4 36,4 35,1
33,9 30,8 29,7 29,5 31,5 32,7 32,0
37,5 37,5 35,0 32,8 33,9 33,7 34,5
36,9 39,2 37,4 37,2 36,8 37,3 37,2
35,8 37,3 37,2 37,4 37,8 37,6 38,4
35,9 29,0 27,5 17,3 32,8 30,0 25,4
40,2 37,3 36,5 36,6 33,4 34,1 31,4
L
42,1 41,8 40,3 39,7 41,0 41,4 41,0
: : : : : :
:
: : :
40,5 39,6 38,6 38,5 39,6 39,1 37,2
41,8 41,9 39,5 40,2 40,2 39,9 37,9
41,9 41,6 39,7 43,1 42,8 39,0 40,3
38,6 41,0 39,1 40,0 41,0 39,9 39,4
: : :
41,6 41,4 40,7 39,9 41,5 39,2 39,5
UK
43,5
43,1
42,8
43,0
39,7
39,0
40,3
40,6
40,4
40,0
40,6
40,7
37,0
36,7
37,6
38,4
41,9
40,8
41,5
42,3
41,3
41,4
40,9
40,4
41,3
39,8
41,1
41,1
40,1
40,0
39,0
39,7
44,8
43,7
43,5 :
43,6
IRL
43,1 44,2 42,6 44,4 43,1 43,7
39,6 38,2 38,6 38,5 39,3 38,9 39,0
41,9 41,7 42,7 41,3 43,3 37,7 36,2
37,7 37,3 37,3 38,4 37,8 36,8
41,2 39,9 40,4 41,1 41,0 39,8 40,0
41,2 41,8 41,9 42,6 42,3 40,3 41,6
40,6 39,5 39,3 41,0 38,9 40,1
39,5 40,0 40,3 37,2 39,4 39,7 40,4 j
44,3 45,3 46,1 44,] 44,8 44,3 45,6