Wage Bill - Preparing a Baseline Forecast
44
Transcript of Wage Bill - Preparing a Baseline Forecast
Outline
• Simulation Modeling as a Tool of Fiscal Policy
Analysis
• Steps for Building a Simulation Model
• The Challenge of Managing Government Wage
Spending
• A Methodology for Building a Projection Model
• Data Requirements and Sources
• Wage Bill Modeling in Action: Practical
Demonstrations
2
Simulation Modeling as a Tool of Fiscal
Policy Analysis
3
Simulation Modeling as a Tool: Why Do We Model?
• Modeling separates the relevant from the
irrelevant
• In doing so, models identify the real issues
that require a policy response
• Qualitative and directional conclusions are
often more valuable than numerical output
• The end-goal is a nuanced understanding of:
– The nature of the problem; and
– The trade-offs inherent in resolving it
4

Simulation Modeling as a Tool: When Do We Model?
• Simulation modeling is time-consuming and
resource-intensive. When is it worth doing?
• Models are needed when there are interactions
between variables, feedback loops, or lagged
responses. In such cases, intuition is often wrong
• Other times when models are needed:
– When something changes
– When the stakes are high
– When the return-on-investment (ROI) is large
5
Simulation Modeling as a Tool: The Benefits of Modeling
• Baseline: by generating a baseline projection (i.e., in the absence
of reform), wage bill models illuminate the potential magnitude
and trajectory of spending over time
• What-If Analysis: by simulating the impact of changes in
macroeconomic and policy variables, wage bill models illuminate
how wage spending might evolve if the baseline’s assumptions
prove to be wrong
• Reform Costing: by estimating the fiscal impact of policy
measures against the baseline, wage bill models provide a means
to: (i) calibrate the potential savings from individual policy
measures and packages of policy measures and (ii) tailor
measures to attain a given fiscal target
6
Simulation Modeling as a Tool: Lessons Learned
• Models are powerful: use the power prudently
• Respect the policy process
• The hardest challenges are rarely technical
• Build the right tool for the problem
• Models are not an “end product” but a process
• Institutionalizing models requires:
– A champion
– Internal demand
– Organizational commitment
7
Steps for Building a Simulation Model
8
Steps for Building a Simulation Model: Modeling is a Process
• Models are organic:
– Good ones evolve and expand in usefulness
– Bad ones wither and die
• Planning is key:
– Understand the problem to be solved
– Build consensus around the tool to be built
• Stick to the sequence:
– Most modeling projects involve six basic steps
9
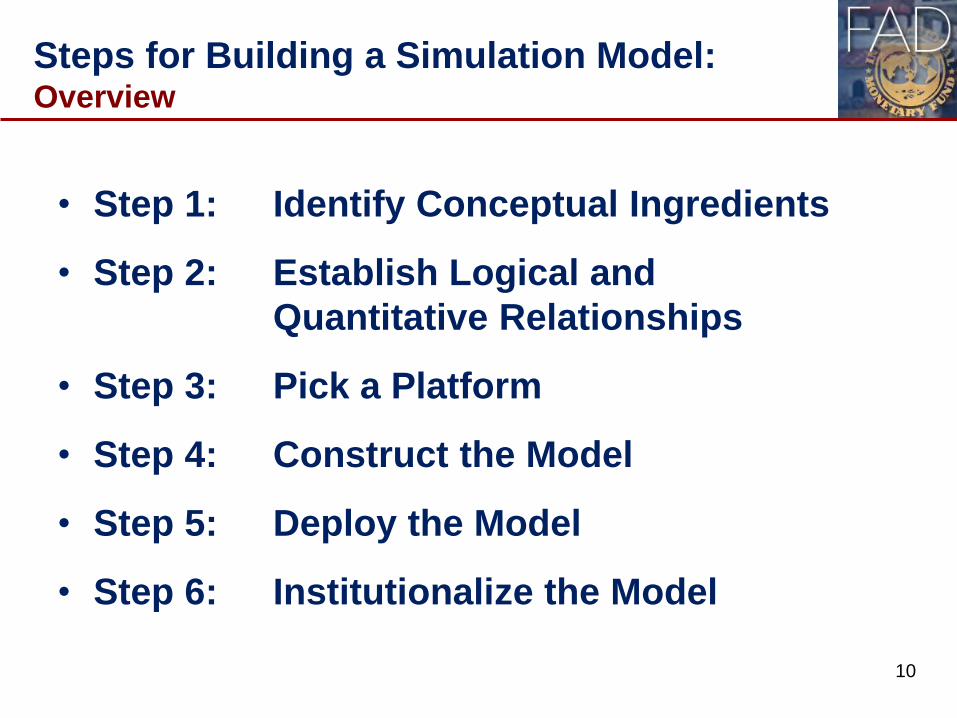
Steps for Building a Simulation Model: Overview
• Step 1: Identify Conceptual Ingredients
• Step 2: Establish Logical and
Quantitative Relationships
• Step 3: Pick a Platform
• Step 4: Construct the Model
• Step 5: Deploy the Model
• Step 6: Institutionalize the Model
10
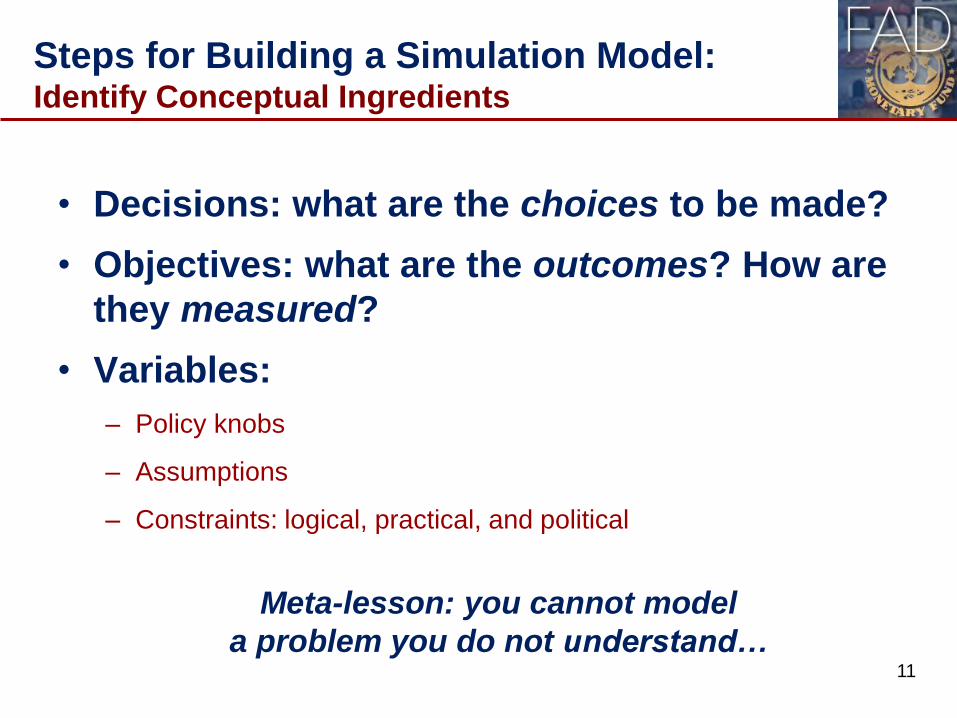
Steps for Building a Simulation Model: Identify Conceptual Ingredients
• Decisions: what are the choices to be made?
• Objectives: what are the outcomes? How are
they measured?
• Variables:
– Policy knobs
– Assumptions
– Constraints: logical, practical, and political
Meta-lesson: you cannot model
a problem you do not understand…
11

Steps for Building a Simulation Model: Establish Logical and Quantitative Relationships
• Define the variables
• Identify the time horizon
• Depict the relationships
– Flow charting
– Precedents
– Dependents
• Apply the “relevance” criteria
• Identify sources for data
12
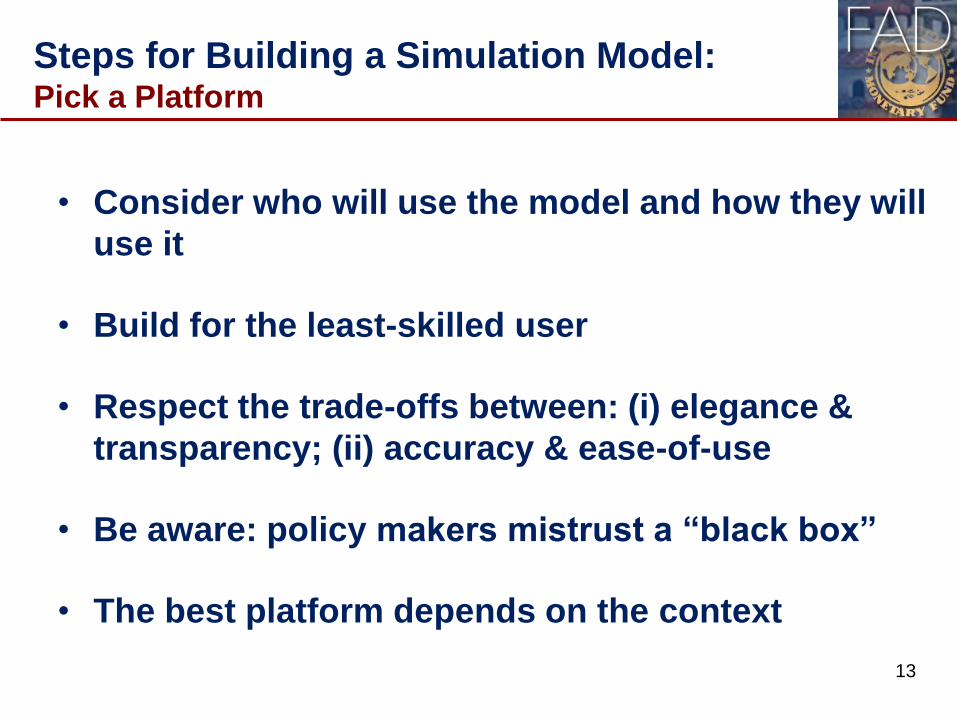
Steps for Building a Simulation Model: Pick a Platform
• Consider who will use the model and how they will
use it
• Build for the least-skilled user
• Respect the trade-offs between: (i) elegance &
transparency; (ii) accuracy & ease-of-use
• Be aware: policy makers mistrust a “black box”
• The best platform depends on the context
13

Steps for Building a Simulation Model: Construct the Model
• Build models with an eye to the future:
– Good tools often get redeployed beyond their initial mandate
– Never hardwire anything which can be treated as a variable
• Organize the model appropriately:
– Assumptions and policy knobs
– Output
– Computational engines
– Source data
• Use modules to facilitate reproducibility and
scaling
14
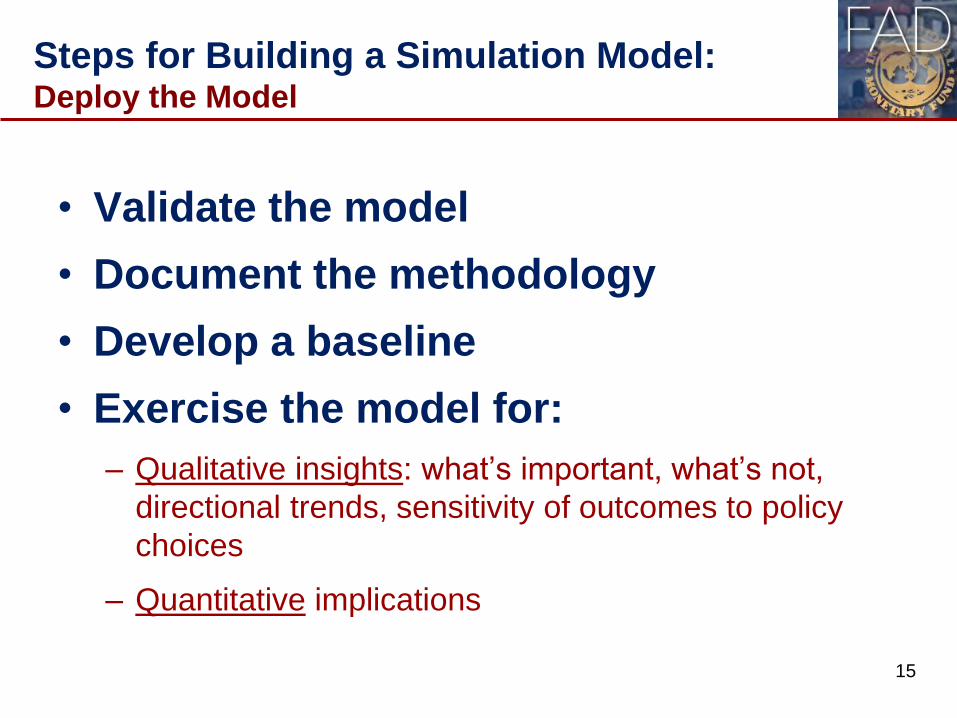
Steps for Building a Simulation Model: Deploy the Model
• Validate the model
• Document the methodology
• Develop a baseline
• Exercise the model for:
– Qualitative insights: what’s important, what’s not,
directional trends, sensitivity of outcomes to policy
choices
– Quantitative implications
15
Steps for Building a Simulation Model: Institutionalize the Model
• Institutionalizing a model is often
challenging and absolutely requires:
– Technical Expert: the person responsible for running the
model must be an expert in its construction
– Internal Champion: the ultimate “buyer” of the model
must champion its use and have the resource authority
and willingness to invest in its updating and development
16

Steps for Building a Simulation Model: Lessons for Managers
• Be involved in the model’s construction, particularly during the
initial phases
• Get your hands dirty: if you do not understand the methodology,
you may misinterpret the output
• Recognize that developers: (i) do not always understand the public
policy issues they are being asked to model and (ii) cannot build a
tool to meet your needs if you fail to delineate them
• Use the developer as your tutor; don’t be afraid of what you do not
understand; the technical elements are less important than the
concepts and methodology
• Champion the model’s use and support its institutionalization with
manpower, budget, and leadership
17

The Challenge of Managing Government
Wage Spending
18
Challenge of Managing Wage Spending: Wages Constitute a Large Share of Spending
• Government wages underpin the provision of key public services,
such as education, health, sanitation, and security
• Delivering services efficiently is crucial for social prosperity and
inclusive growth
• As a share of GDP, wage spending ranges from about 7 ½ percent
(low-income countries) to about 10 percent (advanced economies)
• In the future, many countries will face rising fiscal pressures:
– Increased demand for public services
– Binding revenue and financing constraints
– Baumol’s “cost disease”
– Population aging and its impact on healthcare and pension spending
19
Challenge of Managing Wage Spending: Policy Levers Are Few and Constrained
• Coping with long-term fiscal pressure will necessitate greater budget
efficiency from all spending, including wages. This will require:
– Appropriate employment: the level and composition of government employment must be aligned
to the public services being provided
– Competitive compensation: the level and composition of government compensation must be
competitive with the private sector
• Managing the wage bill is often made more difficult by:
– The statutory nature of government compensation
– The strong labor protections typically provided to government workers
– The influence of public sector unions over compensation and hiring policies, and other factors.
– Weaknesses in both public financial management and human resource management.
Consequently, it can be difficult to adjust wage spending to accommodate short- and
medium-term fluctuations in budgetary resources and to manage employment in
response to long-tem technological and demographic developments 20
A Methodology for Building a Projection
Model
21

Methodology: The Objectives and Data Are Determinate
• The appropriate methodology for projecting wage spending depends on
the objectives of the fiscal policy analysis and the data available to
support it
• Crude projections can be developed on the basis of just aggregate
headcounts and compensation data
• Beyond the problem of accuracy, simple methodologies cannot capture
the complexities of government compensation and employment policies
and, consequently, lack the functionality to estimate the fiscal impact of a
broad range of policy reforms
• In general, granular data yields the most accurate projections and enables
the costing of reforms that target specific elements of compensation or
specific groups of workers
22
Methodology: The Choice of Computational Platform
• Wage bill projection models can be constructed using a variety of
computational platforms
• The choice of platform is typically determined by the questions the
model is being built to answer and its audience of potential users
• While statistical software packages (e.g., STATA) are flexible,
efficient, and powerful, they may exceed the technical capacity of
some users and are less transparent and approachable than
spreadsheet programs, such as Microsoft Excel
• Excel is often the best choice for wage bill modeling, particularly if
multiple staff are expected to use and revise a model on an
ongoing basis
23

Methodology: Respect the Tradeoffs
• When models are built in Microsoft Excel, it is important to
recognize – and respect – a trade-off that often emerges between:
– Computation accuracy – whereby data are disaggregated and every feature
of compensation and employment policy is captured by the model – versus
– Ease-of-manipulation
• In this regard, decisions regarding a model’s structure and its
underlying computational algorithms should always be guided by
the policy-level questions the model is intended to answer
• Time invested up-front in model design is rarely wasted because
complex Excel models, once completed, can be tricky to
disassemble and modify
24
Methodology: Wage Spending Deconstructed: Compensation (1/2)
• The elements of compensation include not only wages and
salaries but also the cost of:
– Overtime pay, paid leave, bonuses, merit pay, and any supplements paid to workers
with special skills or qualifications, longevity, or who work in hazardous or difficult
conditions
– Allowances for housing, transportation, and other expenses
– Medical, dental, and vision care (or the government’s share of the premiums paid for
insurance programs that provide such coverage)
– Benefits for accidental death or dismemberment, mortality, and other forms of
insurance
– Pensions and other retirement benefits (including any contributions paid by the
government as an employer toward such programs)
– Other forms of deferred compensation 25
Methodology: Wage Spending Deconstructed: Compensation (2/2)
• Disaggregating the elements of compensation in forecasts is
recommended because it enables the estimation of savings from policies
that target allowances and other forms of compensation separately from
wages and salaries
• While the cost of old age pensions, disability pensions, and the benefits
paid to the survivors of deceased government workers are sometimes
considered separately from wages – particularly when paid on a pay-as-
you-go basis – they are elements of compensation and are logically part
of wage spending
• The objectives and scope of the fiscal policy analysis should ultimately
determine whether such costs merit inclusion
• Nonmonetary benefits, such as job security, may be of considerable value
to government workers but are generally not included in the calculation of
wage spending
26
Methodology: Wage Spending Deconstructed: Employment (1/2)
• The purpose/scope of fiscal policy analysis will determine the
population of government workers to include in the computation of
wage spending
• Most commonly, wage bill projections are intended to support fiscal
planning at the level of the central government and, therefore, include
only workers paid directly by the central government’s budget
• Conceptually, however, wage spending can also include remuneration
paid by subnational levels of government, such as states and
municipalities, and by public corporations
• In situations where public corporations have their own revenue
sources (i.e., are partly self-financing), it becomes conceptually
impossible to distinguish the government’s budgetary support for
wage spending from other forms of expenditure support
27
Methodology: Wage Spending Deconstructed: Employment (2/2)
• The population of government workers included in the
computation of wage spending includes not only regular fulltime
employees but also temporary and intermittent workers
• The compensation paid to contractual employees, while
conceptually part of the wage bill, is sometimes recorded as part
of goods and services and excluded from wage bill forecasts
• The compensation paid to local staff by donor partnerships is also
often excluded
• In some countries, sensitivities surrounding spending on security
and defense preclude their inclusion in wage bill forecasts
28
Methodology: Conceptual Overview
• The size of the wage bill is determined by the number of
government workers and the cost of their compensation
• Start by replicating the government’s wage bill in the current
year – or the most recent year for which data is available
• Use age-specific matrixes to track the evolution of:
– The number of workers
– Their mean compensation over time
29
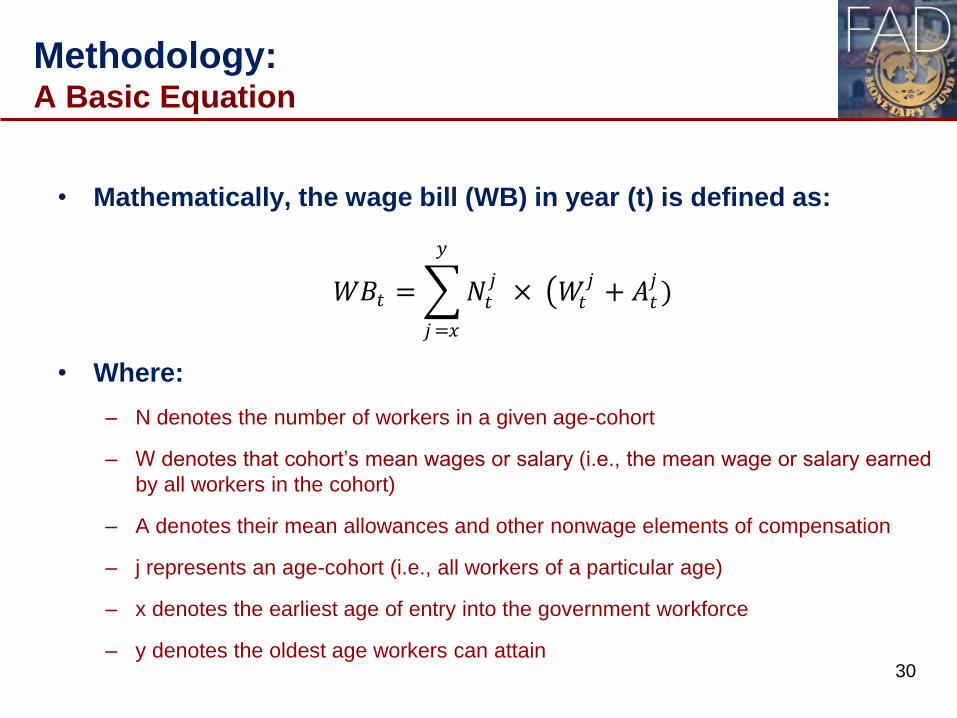
Methodology: A Basic Equation
• Mathematically, the wage bill (WB) in year (t) is defined as:
• Where:
– N denotes the number of workers in a given age-cohort
– W denotes that cohort’s mean wages or salary (i.e., the mean wage or salary earned
by all workers in the cohort)
– A denotes their mean allowances and other nonwage elements of compensation
– j represents an age-cohort (i.e., all workers of a particular age)
– x denotes the earliest age of entry into the government workforce
– y denotes the oldest age workers can attain
30
𝑊𝐵𝑡 = 𝑁𝑡𝑗
𝑦
𝑗=𝑥
× 𝑊𝑡 𝑗
+ 𝐴𝑡𝑗)
Methodology: The Case for Disaggregation
• Allowances and other nonwage compensation can be
disaggregated into individual elements of
compensation, depending upon the objectives of the
analysis
• It is often helpful to disaggregate the government
workforce into sectors (e.g., education, health,
security/defense, and other):
– Given heterogeneity in the age distribution of government
employees and their compensation
– Because doing so creates the capability for the model to simulate
sector-specific options for policy reform 31

Methodology:
Forecasting Changes in Compensation
32

Methodology: Forecasting Changes in Compensation (1/3)
• Mean wages (𝑾𝒕 𝒋) and mean allowances (𝑨𝒕
𝒋) evolve over time in
response to the statutory provisions governing government
compensation and ad hoc decisions made by the authorities
• Typically, three policy inputs are used:
– Input variable representing the annual rate of increase in wages and salaries
(typically specified as a vector so different values can be entered for each year of the
projection period)
– An input variable representing the rate of increase in allowances and other nonwage
compensation (also specified as a vector)
– Input variable intended to capture the impact of wage drift on mean wages and
salaries
33

Methodology: Forecasting Changes in Compensation (2/3)
• In countries where wages are formally indexed, the rate of
increase in wages and salaries can be set equal to projected
inflation
• In countries where wages are adjusted on an ad hoc basis,
historical data – in combination with representations from
the authorities – often provide a reasonable starting point
• Because the composition of individual age-cohorts changes
as some workers leave and others enter the workforce, a
weighted average is required to compute changes in mean
wages and mean allowances over time
34

Methodology: Forecasting Changes in Compensation (3/3)
• Wage drift refers to factors that drive wage growth
independently of broader decisions regarding the overall
size of the workforce or wage-levels
– Automatic increases in wages and salaries
– Patterns of promotion
– The reclassification of employment positions, and other
• Conceptually, the wage drift variable is intended to capture
all factors that collectively create upward pressure on wage
spending independent of policy decisions
• Can be estimated using microsimulation on the basis of
wage tables, the rules regarding advancement, and the
distribution of workers by grade and level
35

Methodology:
Forecasting Changes in Employment
36
Methodology: Forecasting Changes in Employment (1/3)
• The number of workers in a given age-cohort (𝑵𝒕𝒋) changes as a
function of the number of:
– New hires
– Workers who depart the workforce prior to reaching the age of eligibility for retirement
benefits
– Workers who retire
– Workers who die while still working.
• The number of hires is a policy choice and is one of the most
important policy inputs in a wage bill projection model
• Can be specified using a year-specific input variable for headcount
replacement (i.e., the ratio of new hires to departing workers)
• Such a specification is convenient because “100 percent” results
in the workforce remaining stable from one year to the next
37
Methodology: Forecasting Changes in Employment (2/3)
• The number of new hires can be estimated using:
– Formalized staff development plans
– Political representations regarding public sector employment
– Historical data
– Demographic trends
• Hiring patterns for the education sector, for example, typically track the
population of school-age children
• Hiring patterns for the health sector typically track the rate of growth in the
overall population or the old-age population
38
Methodology: Forecasting Changes in Employment (3/3)
• The age distribution of new hires – as well as age-
specific probabilities associated with departures and
retirements – are typically estimated using historical
data
• Age-specific death rates can be sourced from the
Population Division of the Department of Economics
and Social Affairs of the United Nations
• In cases where the modeling horizon extends only for
three to five years, the impact of preretirement
mortality is typically immaterial and can be ignored
39
Methodology: Practical Steps
• Ensure the model reproduces the wage bill in the first year. Employee-
level records may not account for all wage spending because of:
– Errors in human resource management/payroll databases
– Compensation paid to workers who are not covered by the payroll system
– Elements of compensation that are not captured by employee records.
– Typically handled by scaling headcounts, wages, or nonwage compensation,
depending upon the nature of the discrepancy
• Validate the model and ensure that it produces credible results when
assumptions and input variables are changed
• Generate a baseline that incorporates existing wage-setting and
employment policies, formalized plans, and historical trends
• Macroeconomic variables – e.g., real GDP growth, real wage growth, and
inflation – should be consistent with internal forecasts
• Wage spending should be expressed not only in units of local currency
but relative to GDP to facilitate fiscal policy discussions 40
Data Requirements and Sources
41
Data Requirements and Sources: Using Anonymized Employee Records
• Most human resource/payroll management IT systems can support the
extraction of the data required to generate and compile anonymized
records for wage bill forecasting. The following fields are typically used:
– The employee’s year of birth (used to aggregate workers into age-specific cohorts)
– The employee’s year of entry into the government workforce (used to create an age-
distribution for newly hired workers, for distributional analysis, and, in some
instances, for computing retirement benefits)
– Compensation disaggregated by wage or salary, overtime, bonus, allowances and
supplements, and other elements of remuneration
– The government’s share of contributions for social insurance and other retirement
savings schemes
– Basic employment data, such as the employee’s ministry, department, or agency
and, in some cases, job title or employment classification code
42
Wage Bill Modeling in Action:
Practical Demonstrations
43

Practical Demonstrations: From Prior IMF TA Missions
• Architecture of a wage bill model:
– Raw data
– Processed data
– Computation engines
– Inputs and outputs
– Exhibits (tables and charts)
• Use of microdata to create distributions for
employment-by-age and compensation-by-age
• Estimating wage drift using wage tables 44