
Wadeye remote towns jobs profile · Web viewpersons, an increase of 27 jobs from 2014 and an...
71
Remote Towns Jobs Profile WADEYE JOBS PROFILE WADEYE 1
Transcript of Wadeye remote towns jobs profile · Web viewpersons, an increase of 27 jobs from 2014 and an...

Remote Towns Jobs Profile
WADEYE
JOBS PROFILE WADEYE1
© Northern Territory of Australia 2018
Preferred Reference: Department of Trade, Business and Innovation, 2017 Remote Towns Jobs Profiles, Northern Territory Government, June 2018, Darwin.
Disclaimer
The data in this publication were predominantly collected by conducting a face-to-face survey of businesses within town boundaries during mid-2017. The collection methodology was created in accordance with Australian Bureau of Statistics data quality framework principles. Data in this publication are only reflective of those businesses reported on as operating in the town at the time of data collection (see table at the end of publication for list of businesses reported on).
To comply with privacy legislation or where appropriate, some data in this publication may have been adjusted and will not reflect the actual data reported by businesses. As a result of this, combined with certain data not being reported by some businesses, some components may not add to totals. Changes over time may also reflect business' change in propensity to report on certain data items rather than actual changes over time. Total figures have generally not been adjusted.
Caution is advised when interpreting the comparisons made to the earlier 2011 and 2014 publications as the businesses identified and reported on and the corresponding jobs may differ between publications.
Notes for each table and chart are alphabetically ordered and listed at the end of the publication.
Any use of this report for commercial purposes is not endorsed by the Department of Trade, Business and Innovation.
JOBS PROFILE WADEYE2

Contents
Wadeye.......................................................................................................................... 4Introduction.................................................................................................................... 5Summary........................................................................................................................ 6Jobs Overview................................................................................................................. 7Jobs by Aboriginal Status................................................................................................8Jobs by Sector: Private and Public................................................................................10Job status: Permanent and Temporary.........................................................................15Job Vacancies............................................................................................................... 18Jobs by Industry............................................................................................................20Jobs by Occupation.......................................................................................................26Jobs by Industry by Occupation....................................................................................29Jobs by Gender.............................................................................................................31Jobs by Age...................................................................................................................36Vocational Education and Training...............................................................................42Population..................................................................................................................... 46Community Development Programme.........................................................................48Businesses....................................................................................................................49Notes............................................................................................................................ 50Abbreviations and Acronyms........................................................................................51
.
JOBS PROFILE WADEYE3

WadeyeWadeye (also known as Port Keats) is located 420 kilometres south-west of Darwin, with a population of 2631 residents.
Source: Department of Trade, Business and Innovation
JOBS PROFILE WADEYE4

IntroductionThis jobs profile provides a snapshot of jobs and the characteristics of job holders in Wadeye as at July 2017. It also outlines trends from the 2014 and 2011 surveys.This job profile is one of 28 profiles developed for remote towns in the Northern Territory. It is anticipated these and subsequent profiles will contribute to a robust evidence base to inform decision making in and relating to these remote Territory towns. This profile contains information collected by the Northern Territory Department of Trade, Business and Innovation from businesses operating within the town and is supplemented by other administrative data sets and information.Each profile provides up-to-date information that is intended to inform the planning and design of current and future government programs and as an evidence base to inform decision making relating to workforce development, enterprise and job opportunities.The data collection methodology and corresponding questionnaire were created in partnership with the Australian Bureau of Statistics (ABS) and in accordance with ABS data quality framework and survey principles.The surveys were predominantly conducted by the Department’s Small Business Champions and Workforce Training Coordinators, on a face-to-face basis with business representatives.The information collected and reported on represents a significant goodwill investment by those businesses and organisations that participated. Each business is listed at the end of this publication.
JOBS PROFILE WADEYE5

SummaryThe 2017 jobs profile was developed based on responses from 21 businesses operating within the Wadeye town boundary, 1 less than in the 2014 survey. Of these, there were: 14 businesses from the private sector, accounting for 410 filled jobs or 82% of
total filled jobs 7 businesses from the public sector, accounting for 90 filled jobs or 18% of total
filled jobs 13 businesses participated in all three surveys (completed in 2011, 2014 and
2017)A total of 540 filled and vacant jobs in Wadeye were reported, an increase of 83 jobs from 2014.1 The 2017 profile highlights: there were 500 filled jobs of which:
o 291 jobs (58%) were filled by Aboriginal persons, an increase of 62 jobs from 2014
o 209 jobs (42%) were filled by non-Aboriginal persons, an increase of 12 jobs from 2014
o 48% of employed Aboriginal people are working in the private sectoro Aboriginal persons accounted for 58% of job holders in the town compared to
54% in 2014o Aboriginal females made up 60% of total Aboriginal filled jobs in the town
compared to 45% in 2014 there were 40 vacant jobs, of which:
o job vacancies as a percentage of jobs is unchanged at 7% in 2017 from 2014o job vacancies equate to 1 in 14 jobso 25 of the vacancies were in Community and Personal Service Workers and
Professional areas Public Administration and Safety was the largest industry employer in 2017,
having the highest increase of 58 jobs filled between 2017 and 2014 Retail Trade had the 2nd highest increase in jobs filled between 2017 and 2014 Training increased in student numbers between 2016 and 2013 Community Services, Health and Education had the highest student numbers in
2016 as well as the highest increase in student numbers between 2016 and 2013 the Automotive and Primary Industry training sectors had the highest decreases in
student numbers between 2016 and 2013 of 22 and 23 respectively.The overall population in Wadeye increased by 770 persons (41%) between 2006 and 2016 to 2631 persons.
1 The number of filled jobs does not represent numbers of persons as a person may have several jobs or one job may be shared by more than one person.
JOBS PROFILE WADEYE6

In comparison, the overall Northern Territory population increased by 16.5% between 2006 and 2016.In 2016, the working age population (15 years and over) in Wadeye was an estimated 1,796 persons compared to 1,115 in 2006 an increase of 55%.There were 0.3 jobs in Wadeye per working age person compared to 0.4 jobs per working age person across the 28 remote towns in the Northern Territory.
Jobs OverviewTable 1: Count of filled jobs and vacancies, 2011, 2014 and 2017 (a)(b)
2011 2014 2017 Change2011-2014
Change2014-2017
Total All Jobs 452 457 540 5 83Vacancies 28 31 40 3 9Vacancies as % of Total All Jobs 6.2% 6.8% 7.4% 0.6 ppt 0.6 pptFilled Jobs 424 426 500 2 74Full-time 338 297 295 -41 -2Part-time 86 129 205 43 76
Source: Department of Trade, Business and Innovation
Chart 1: Count of vacant jobs and filled jobs by full-time/part-time status, 2011, 2014 and 2017 (a)(b)
Source: Department of Trade, Business and Innovation
In 2017 in Wadeye: there were a total of 500 filled jobs, an increase of 74 jobs from 2014 and an
increase of 76 jobs from 2011 of the 500 filled jobs in 2017:
o 295 were full-time jobs, a decrease of 2 jobs from 2014 and a decrease of 43 jobs from 2011
JOBS PROFILE WADEYE7

o 205 were part-time jobs, an increase of 76 jobs from 2014 and an increase of 119 jobs from 2011
there were 40 total job vacancies in 2017, an increase of 9 vacancies from 2014 and an increase of 12 vacancies from 2011.
JOBS PROFILE WADEYE8

Jobs by Aboriginal StatusChart 2: Count of filled jobs by Aboriginal status, 2011, 2014 and 2017 (a)(c)
Source: Department of Trade, Business and Innovation
In 2017 in Wadeye: of the 500 filled jobs:
o 291 jobs were filled by Aboriginal persons, an increase of 62 jobs from 2014 and an increase of 35 jobs from 2011
o 209 jobs were filled by non-Aboriginal persons, an increase of 12 jobs from 2014 and an increase of 41 jobs from 2011
Aboriginal persons accounted for 58% of job holders compared to 54% in 2014 and 60% in 2011.
Table 2: Count of filled jobs by full-time/part-time status and Aboriginal status of person in job, 2011, 2014 and 2017 (a)(b)(c)
Indicator
2011 2014 2017Change
2011-2014Change
2014-2017
Ab
orig
inal
Non
-Ab
orig
inal
Tot
al
Ab
orig
inal
Non
-Ab
orig
inal
Tot
al
Ab
orig
inal
Non
-Ab
orig
inal
Tot
al
Ab
orig
inal
Non
-Ab
orig
inal
Tot
al
Ab
orig
inal
Non
-Ab
orig
inal
Tot
al
Full-time 177
161
338
122
175
297 99 19
629
5 -55 14 -41
-23
21 -2
Part-time 79 7 86 107 22 12
919
2 13 205 28 15 43 85 -9 76
Total 256
168
424
229
197
426
291
209
500
-27 29 2 62 1
2 74
JOBS PROFILE WADEYE9

Source: Department of Trade, Business and Innovation
Chart 3: Count of filled jobs by full-time/part-time status and Aboriginal status of person in job, 2011, 2014 and 2017 (a)(b)(c)
Source: Department of Trade, Business and Innovation
In 2017 in Wadeye: of the 500 filled jobs:
o 99 were full-time jobs filled by Aboriginal persons, a decrease of 23 jobs from 2014 and a decrease of 78 jobs from 2011
o 192 were part-time jobs filled by Aboriginal persons, an increase of 85 jobs from 2014 and an increase of 113 jobs from 2011
o 196 were full-time jobs filled by non-Aboriginal persons, an increase of 21 jobs from 2014 and an increase of 35 jobs from 2011
o 13 were part-time jobs filled by non-Aboriginal persons, a decrease of 9 jobs from 2014 and an increase of 6 jobs from 2011.
JOBS PROFILE WADEYE10

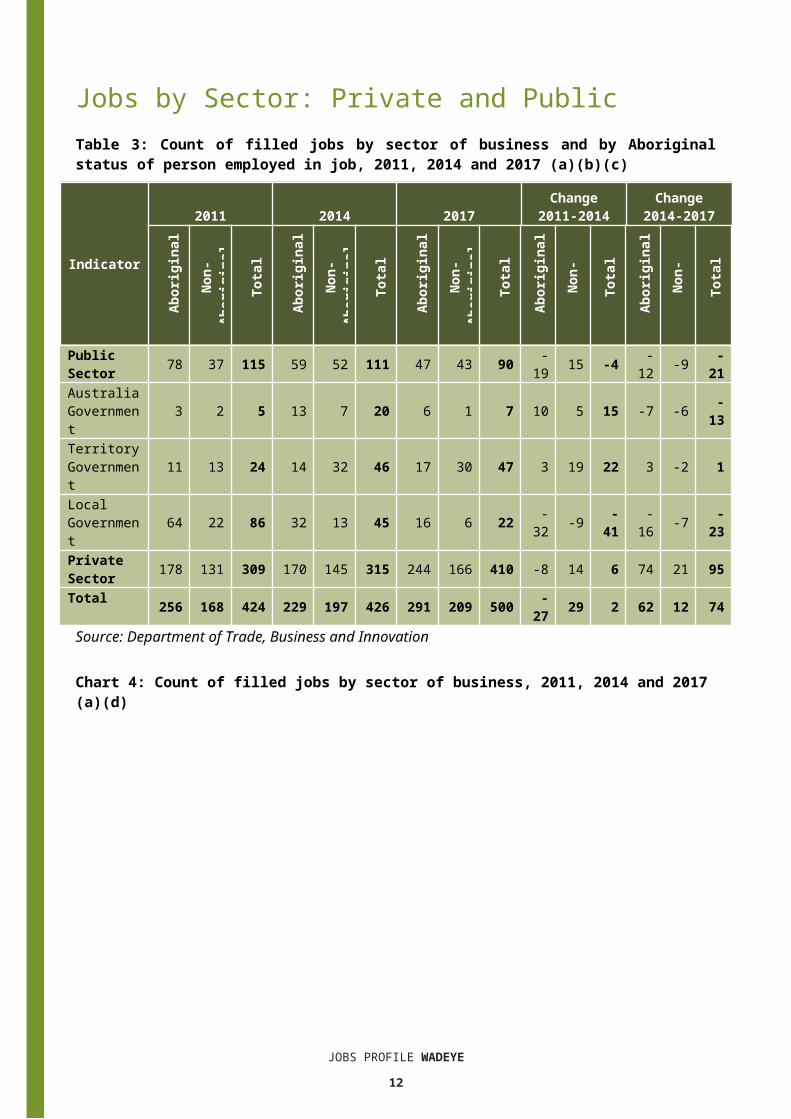
Jobs by Sector: Private and PublicTable 3: Count of filled jobs by sector of business and by Aboriginal status of person employed in job, 2011, 2014 and 2017 (a)(b)(c)
Indicator
2011 2014 2017Change
2011-2014Change
2014-2017
Ab
orig
inal
Non
-Ab
orig
inal
Tot
al
Ab
orig
inal
Non
-Ab
orig
inal
Tot
al
Ab
orig
inal
Non
-Ab
orig
inal
Tot
al
Ab
orig
inal
Non
-Ab
orig
inal
Tot
al
Ab
orig
inal
Non
-Ab
orig
inal
Tot
al
Public Sector 78 37 11
5 59 52 111 47 43 90 -
19 15 -4 -12 -9 -
21Australia Government
3 2 5 13 7 20 6 1 7 10 5 15 -7 -6 -13
Territory Government
11 13 24 14 32 46 17 30 47 3 19 22 3 -2 1
Local Government
64 22 86 32 13 45 16 6 22 -32 -9 -
41-
16 -7 -23
Private Sector 178 131 30
9 170 145 315 244 166 41
0 -8 14 6 74 21 95Total 25
616
8424
229
197
426
291
209
500
-27 29 2 62 12 74
Source: Department of Trade, Business and Innovation
Chart 4: Count of filled jobs by sector of business, 2011, 2014 and 2017 (a)(d)
JOBS PROFILE WADEYE11
Source: Department of Trade, Business and Innovation
JOBS PROFILE WADEYE12
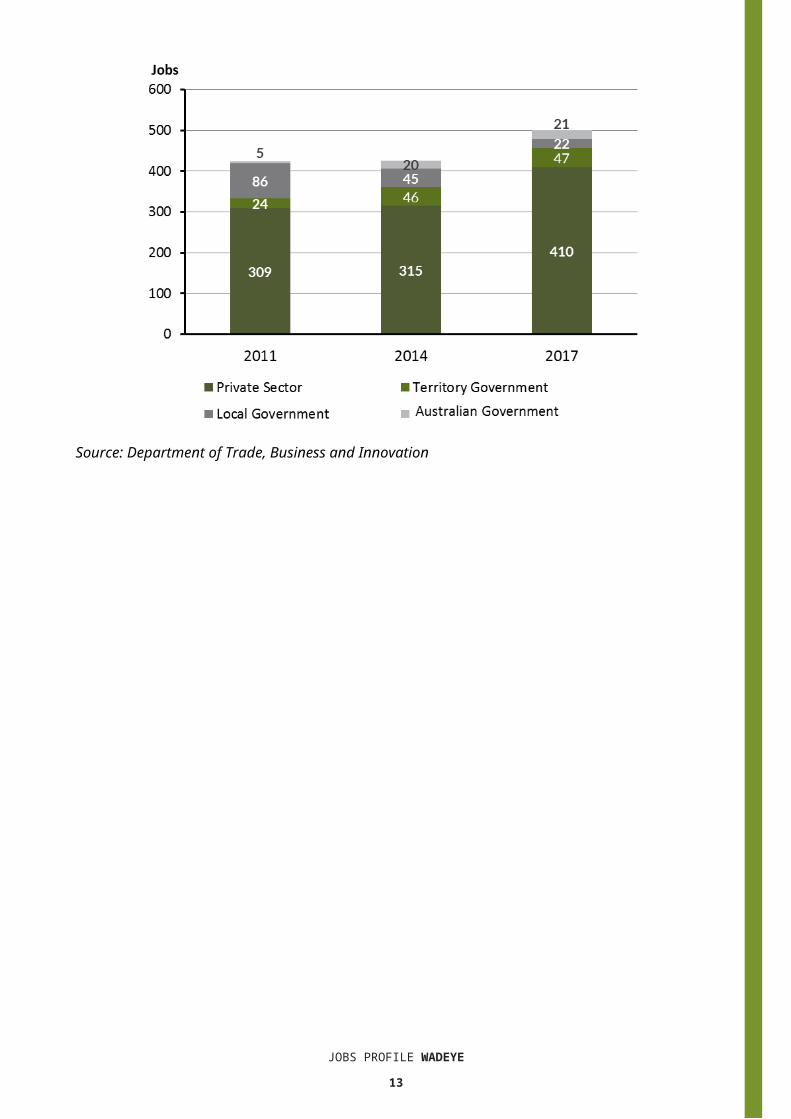
Chart 5: Percentage of filled jobs by sector of business in 2017 (a)(d)
Source: Department of Trade, Business and Innovation
In 2017 in Wadeye: there were 90 jobs in the public sector, a decrease of 21 jobs from 2014 and a
decrease of 25 jobs from 2011 of the 90 jobs in the public sector in 2017:
o 7 jobs were in the Australian Government, a decrease of 13 jobs from 2014 and an increase of 2 jobs from 2011
o 47 jobs were in the Territory Government, an increase of 1 job from 2014 and an increase of 23 jobs from 2011
o 22 jobs were in the Local Government, a decrease of 23 jobs from 2014 and a decrease of 64 jobs from 2011
there were 410 jobs in the private sector in 2017, an increase of 95 jobs from 2014 and an increase of 101 jobs from 2011.
JOBS PROFILE WADEYE13

Chart 6: Count of filled jobs by sector and Aboriginal status of person in job, 2011, 2014 and 2017 (a)(c)(d)
Source: Department of Trade, Business and Innovation
In 2017 in Wadeye: of the 90 jobs in the public sector:
o 47 jobs were filled by Aboriginal persons, a decrease of 12 jobs from 2014 and a decrease of 31 jobs from 2011
o 43 jobs were filled by non-Aboriginal persons, a decrease of 9 jobs from 2014 and an increase of 6 jobs from 2011
of the 410 jobs in the private sector:o 244 jobs were filled by Aboriginal persons, an increase of 74 jobs from 2014
and an increase of 66 jobs from 2011o 166 jobs were filled by non-Aboriginal persons, an increase of 21 jobs from
2014 and an increase of 35 jobs from 2011.
JOBS PROFILE WADEYE14

Chart 7: Count of filled jobs by sector and full-time/part-time status of person in job, 2011, 2014 and 2017 (a)(b)(d)
Source: Department of Trade, Business and Innovation
In 2017 in Wadeye there were: of the 90 jobs in the public sector:
o 63 were full-time jobs, a decrease of 28 jobs from 2014 and a decrease of 22 jobs from 2011
o 13 were part-time jobs, a decrease of 7 jobs from 2014 and a decrease of 17 jobs from 2011
of the 410 jobs in the private sector:o 232 were full-time jobs, an increase of 26 jobs from 2014 and a decrease of
21 jobs from 2011o 192 were part-time jobs, an increase of 83 jobs from 2014 and an increase of
136 jobs from 2011.
JOBS PROFILE WADEYE15

Table 4: Count of filled jobs by full-time/part-time status and Aboriginal status of person in job by sector, 2011, 2014, and 2017 (a)(b)(c)(d)
Indicator
2011Aboriginal Non-Aboriginal Total
Full-time
Part-time Total Full-
timePart-time Total Full-
timePart-time Total
Public Sector 53 25 78 32 5 37 85 30 115Private Sector 124 54 178 129 2 131 253 56 309Total 177 79 256 161 7 168 338 86 424
Indicator2014
Aboriginal Non-Aboriginal TotalFull-time
Part-time Total Full-
timePart-time Total Full-
timePart-time Total
Public Sector 46 13 59 45 7 52 91 20 111Private Sector 76 94 170 130 15 145 206 109 315Total 122 107 229 175 22 197 297 129 426
Indicator2017
Aboriginal Non-Aboriginal TotalFull-time
Part-time Total Full-
timePart-time Total Full-
timePart-time Total
Public Sector 30 9 39 33 4 37 63 13 76Private Sector 69 183 252 163 9 172 232 192 424Total 122 107 291 196 13 209 295 205 500
Source: Department of Trade, Business and Innovation
In 2017 in Wadeye there were: 39 jobs in the public sector filled by Aboriginal persons, a decrease of 20 jobs
from 2014 and a decrease of 39 jobs from 2011, of which:o 30 were full-time jobs, a decrease of 16 jobs from 2014 and a decrease of 23
jobs from 2011o 9 were part-time jobs, a decrease of 4 jobs from 2014 and a decrease of 16
jobs from 2011 252 jobs in the private sector filled by Aboriginal persons, an increase of 82
jobs from 2014 and an increase of 74 jobs from 2011, of which:o 69 were full-time jobs, a decrease of 7 jobs from 2014 and a decrease of 55
jobs from 2011o 183 were part-time jobs, an increase of 89 jobs from 2014 and an increase of
129 jobs from 2011 37 jobs in the public sector filled by non-Aboriginal persons, a decrease of 15
jobs from 2014 and unchanged from 2011, of which:o 33 were full-time jobs, a decrease of 12 jobs from 2014 and an increase of 1
job from 2011o 4 were part-time jobs, a decrease of 3 jobs from 2014 and a decrease of 1 job
from 2011JOBS PROFILE WADEYE
16

172 jobs in the private sector filled by non-Aboriginal persons, an increase of 27 jobs from 2014 and an increase of 41 jobs from 2011, of which:o 163 were full-time jobs, an increase of 33 jobs from 2014 and an increase of
34 jobs from 2011o 9 were part-time jobs, a decrease of 6 jobs from 2014 and an increase of 7
jobs from 2011.
JOBS PROFILE WADEYE17

Job status: Permanent and TemporaryTable 5: Count of filled jobs by employment status and Aboriginal status of person in job, 2011, 2014, and 2017 (a)(c)(e)
Indicator
2011 2014 2017Change
2011-2014Change
2014-2017
Ab
orig
inal
Non
-Ab
orig
inal
Tot
al
Ab
orig
inal
Non
-Ab
orig
inal
Tot
al
Ab
orig
inal
Non
-Ab
orig
inal
Tot
al
Ab
orig
inal
Non
-Ab
orig
inal
Tot
al
Ab
orig
inal
Non
-Ab
orig
inal
Tot
al
Permanent
198
145
343 97 81 17
810
2104
206 -101 -64 -
165 5 23 28Temporary 58 23 81 13
211
624
818
9105
294 74 93 167 57 -11 46
Total 256
168
424
229
197
426
291
209
500 -27 29 2 62 12 74
Source: Department of Trade, Business and Innovation
Chart 8: Count of filled jobs by employment status and Aboriginal status of person in job, 2011, 2014 and 2017 (a)(c)(e))
Source: Department of Trade, Business and Innovation
In 2017 in Wadeye: there were 206 permanent jobs, an increase of 28 jobs from 2014, and a
decrease of 137 jobs from 2011, of which:o 102 jobs were filled by Aboriginal persons, an increase of 5 jobs from 2014
and a decrease of 96 jobs from 2011
JOBS PROFILE WADEYE18

o 104 jobs were filled by non-Aboriginal persons, an increase of 23 jobs from 2014 and a decrease of 41 jobs from 2011
there were 294 temporary jobs, an increase of 46 jobs from 2014 and an increase of 213 jobs from 2011, of which:o 189 jobs were filled by Aboriginal persons, an increase of 57 jobs from 2014
and an increase of 131 jobs from 2011o 105 jobs were filled by non-Aboriginal persons, a decrease of 11 jobs from
2014 and an increase of 82 jobs from 2011.
Table 6: Count of filled jobs by sector, Aboriginal status and employment status of person in job, 2011, 2014 and 2017 (a)(c)(d)(e)
Indicator2011
Aboriginal Non-Aboriginal TotalPerm Temp Total Perm Temp Total Perm Temp Total
Public Sector 71 7 78 31 6 37 102 13 115Private Sector 127 51 178 114 17 131 241 68 309Total 198 58 256 145 23 168 343 81 424
Indicator2014
Aboriginal Non-Aboriginal TotalPerm Temp Total Perm Temp Total Perm Temp Total
Public Sector 18 41 59 24 28 52 42 69 111Private Sector 79 91 170 57 88 145 136 179 315Total 97 132 229 81 116 197 178 248 426
Indicator2017
Aboriginal Non-Aboriginal TotalPerm Tem
p Total Perm Temp Total Perm Tem
p TotalPublic Sector 8 39 47 14 29 43 22 68 90Private Sector 94 150 24
4 90 76 166 184 226 41
0Total 102 18
929
110
4105
209
206
294
500
Source: Department of Trade, Business and Innovation
In 2017 in Wadeye there were: 90 jobs in the public sector, a decrease of 21 jobs from 2014 and a decrease of
25 jobs from 2011, of which:o 22 jobs were permanent, a decrease of 20 jobs from 2014 and a decrease of
80 jobs from 2011, of which: 8 jobs were filled by Aboriginal persons, a decrease of 10 jobs from 2014
and a decrease of 63 jobs from 2011 14 jobs were filled by non-Aboriginal persons, a decrease of 10 jobs from
2014 and a decrease of 17 jobs from 2011o 68 jobs were temporary, a decrease of 1 job from 2014 and an increase of 55
jobs from 2011, of which: 39 jobs were filled by Aboriginal persons, a decrease of 2 jobs from 2014
JOBS PROFILE WADEYE19

and an increase of 32 jobs from 2011
JOBS PROFILE WADEYE20

29 jobs were filled by non-Aboriginal persons, an increase of 1 job from 2014 and an increase of 23 jobs from 2011
410 jobs in the private sector, an increase of 95 jobs from 2014 and an increase of 101 jobs from 2011, of which:o 184 jobs were permanent, an increase of 48 jobs from 2014 and a decrease
of 57 jobs from 2011, of which: 94 jobs were filled by Aboriginal persons, an increase of 15 jobs from
2014 and a decrease of 33 jobs from 2011 90 jobs were filled by non-Aboriginal persons, an increase of 33 jobs from
2014 and a decrease of 24 jobs from 2011o 226 jobs were temporary, an increase of 47 jobs from 2014 and an increase
of 158 jobs from 2011, of which: 150 jobs were filled by Aboriginal persons, an increase of 59 jobs from
2014 and an increase of 99 jobs from 2011 76 jobs were filled by non-Aboriginal persons, a decrease of 12 jobs from
2014 and an increase of 59 jobs from 2011.
JOBS PROFILE WADEYE21

Job VacanciesTable 7: Job vacancies, 2011, 2014, and 2017
Indicator 2011 2014 2017Change2011-2014
Change2014-2017
Job vacancies 28 31 40 3 9Source: Department of Trade, Business and Innovation
Table 8: Job vacancies by occupation, 2011, 2014, and 2017 (f)(g)
Occupation (ANZSCO major group) 2011 2014 2017Chang
e2011-2014
Change2014-2017
Clerical and Administrative Workers 2 5 8 3 3Community and Personal Service Workers 5 9 14 4 5Labourers 6 1 5 -5 4Machinery Operators and Drivers 0 0 1 0 1Managers 0 2 0 2 -2Professionals 9 11 11 2 0Sales Workers 4 3 1 -1 -2Other occupations 2 0 0 -2 0Total 28 31 40 3 9
Source: Department of Trade, Business and Innovation
Table 9: Job vacancies by job title, July 2017 (f)Job Vacancy No.
Aboriginal and Torres Strait Islander Health Worker 6Bank Worker 1Bus Driver 1Commercial Cleaner 4Community Arts Worker 1Community Worker 4Drug and Alcohol Counsellor 3General Clerk 3Handyperson 1Nutritionist 1Police Officer 4Program or Project Administrator 2Receptionist (General) 2Recreation Officer 1Registered Nurses nec 4Sales Assistant (General) 1Training and Development Professional 1Total 40
Source: Department of Trade, Business and Innovation
JOBS PROFILE WADEYE22

In 2017 in Wadeye: there were 40 vacancies reported, an increase of 9 vacancies from 2014 and an
increase of 12 vacancies from 2011 of the 40 reported vacancies, the largest requirements were for:
o 14 Community and Personal Service Workers in the following jobs: Aboriginal and Torres Strait Islander health Worker Community Worker Police Officer
o 11 Professionals, the majority of which are in the following jobs: Registered Nurse nec Drug and Alcohol Counsellor
o 8 Clerical and Administrative Workers, the majority of which are in the following jobs: General Clerk Program or Project Administrator Receptionist (General).
JOBS PROFILE WADEYE23

Jobs by IndustryTable 10: Count of filled jobs by industry of business, 2011, 2014 and 2017 (a)(h)
Industry (ANZSIC Division)
2011 2014 2017
Chan
ge20
11-
2014
Chan
ge20
14-
2017
Total % of Total
Total
% of Total
Total
% of Total Total Total
Accommodation and Food Services 0 0.0% 14 3.3% 14 2.8% 14 0Administrative and Support Services 8 1.9% 0 0.0% 0 0.0% -8 0Construction 1 0.2% 2 0.5% 0 0.0% 1 -2Education and Training 133 31.4% 170 39.9% 158 31.6% 37 -12Electricity, Gas, Water and Waste Services 0 0.0% 0 0.0% 1 0.2% 0 1Financial and Insurance Services 3 0.7% 2 0.5% 3 0.6% -1 1Health Care and Social Assistance 41 9.7% 68 16.0% 64 12.8% 27 -4Other Services 2 0.5% 0 0.0% 0 0.0% -2 0Public Administration and Safety 184 43.4% 132 31.0% 190 38.0% -52 58Rental, Hiring and Real Estate Services 3 0.7% 2 0.5% 0 0.0% -1 -2Retail Trade 42 9.9% 33 7.7% 70 14.0% -9 37Transport, Postal and Warehousing 3 0.7% 3 0.7% 0 0.0% 0 -3
Total 424 100.0% 426 100.0
% 500 100.0% 2 74
Source: Department of Trade, Business and Innovation
In 2017 in Wadeye: the Public Administration and Safety industry was the largest industry
employer, with 190 filled jobs or 38% of filled jobs, an increase of 58 jobs from 2014 and an increase of 6 jobs from 2011
other significant industry employers were:o Education and Training with 158 jobs (or 31.6% of filled jobs), a decrease of 12
jobs from 2014 and an increase of 25 jobs from 2011o Retail Trade with 70 jobs (or 14% of filled jobs), an increase of 37 jobs from
2014 and an increase of 28 jobs from 2011o Health Care and Social Assistance with 64 jobs (or 12.8% of filled jobs), a
decrease of 4 jobs from 2014 and an increase of 23 jobs from 2011.
JOBS PROFILE WADEYE24

Table 11: Count of filled jobs by industry of business and Aboriginal status of person in job, 2011, 2014, and 2017 (a)(c)(h)
Industry (ANZSIC division)
2011 2014 2017 Change2011-2014
Change 2014-2017
Ab
orig
inal
Non
-Ab
orig
inal
Tot
al
Ab
orig
inal
Non
-Ab
orig
inal
Tot
al
Ab
orig
inal
Non
-Ab
orig
inal
Tot
al
Ab
orig
inal
Non
-Ab
orig
inal
Tot
al
Ab
orig
inal
Non
-Ab
orig
inal
Tot
al
Accommodation and Food Services 0 0 0 9 5 14 8 6 14 9 5 14 -1 1 0Administrative and Support Services 2 6 8 0 0 0 0 0 0 -2 -6 -8 0 0 0
Construction 1 0 1 0 2 2 0 0 0 -1 2 1 0 -2 -2Education and Training 88 45 133 96 74 170 92 66 158 8 29 37 -4 -8 -12Electricity, Gas, Water and Waste Services 0 0 0 0 0 0 0 1 1 0 0 0 0 1 1Financial and Insurance Services 3 0 3 2 0 2 3 0 3 -1 0 -1 1 0 1Health Care and Social Assistance 28 13 41 34 34 68 31 33 64 6 21 27 -3 -1 -4
Other Services 0 2 2 0 0 0 0 0 0 0 -2 -2 0 0 0Public Administration and Safety 114 70 184 78 54 132 125 65 190 -36 -16 -52 47 11 58Rental, Hiring and Real Estate Services 0 3 3 0 2 2 0 0 0 0 -1 -1 0 -2 -2
Retail Trade 16 26 42 7 26 33 32 38 70 -9 0 -9 25 12 37Transport, Postal and Warehousing 3 0 3 3 0 3 0 0 0 0 0 0 -3 0 -3
Total 256 168 424 229 197 426 291 209 500 -27 29 2 62 12 74
Source: Department of Trade, Business and Innovation
JOBS PROFILE WADEYE25

Chart 9: Count of filled jobs by top 5 industries of business and Aboriginal status of person in job, 2017 (a)(c)(h)
Source: Department of Trade, Business and Innovation
In 2017 in Wadeye: of the 291 jobs filled by Aboriginal persons, there were:
o 125 jobs in Public Administration and Safety, an increase of 47 jobs from 2014 and an increase of 11 jobs from 2011
o 92 jobs in Education and Training, a decrease of 4 jobs from 2014 and an increase of 4 jobs from 2011
o 32 jobs in Retail Trade, an increase of 25 jobs from 2014 and an increase of 16 jobs from 2011
of the 209 jobs filled by non-Aboriginal persons, there were:o 65 jobs in Public Administration and Safety, an increase of 11 jobs from 2014
and a decrease of 5 jobs from 2011o 66 jobs in Education and Training, a decrease of 8 jobs from 2014 and an
increase of 21 jobs from 2011o 38 jobs in Retail Trade, an increase of 12 jobs from 2014 and an increase of 12
jobs from 2011.JOBS PROFILE WADEYE
26

Table 12: Count of filled jobs by industry, employment status and Aboriginal status of person in job, 2011 (a)(c)(e)(h)
Industry (ANZSIC division)2011
Aboriginal Non-Aboriginal TotalPerm
Temp
Total
Perm
Temp
Total
Perm
Temp
Total
Administrative and Support Services 0 2 2 1 5 6 1 7 8Construction 1 0 1 0 0 0 1 0 1Education and Training 62 26 88 41 4 45 103 30 133Financial and Insurance Services 3 0 3 0 0 0 3 0 3Health Care and Social Assistance 7 21 28 8 5 13 15 26 41Other Services 0 0 0 1 1 2 1 1 2Public Administration and Safety 112 2 114 68 2 70 180 4 184Rental, Hiring and Real Estate Services 0 0 0 1 2 3 1 2 3Retail Trade 11 5 16 22 4 26 33 9 42Transport, Postal and Warehousing 1 2 3 0 0 0 1 2 3Total 198 58 256 145 23 168 343 81 424
Source: Department of Trade, Business and Innovation
Table 13: Count of filled jobs by industry, employment status and Aboriginal status of person in job, 2014 (a)(c)(e)(h)
Industry (ANZSIC division)
2014Aboriginal Non-Aboriginal Total
Perm
Temp
Total
Perm
Temp
Total
Perm
Temp
Total
Accommodation and Food Services 0 9 9 0 5 5 0 14 14
Construction 0 0 0 2 0 2 2 0 2Education and Training 31 65 96 6 68 74 37 133 170Financial and Insurance Services 2 0 2 0 0 0 2 0 2Health Care and Social Assistance 25 9 34 27 7 34 52 16 68Public Administration and Safety 32 46 78 22 32 54 54 78 132Rental, Hiring and Real Estate Services 0 0 0 2 0 2 2 0 2
Retail Trade 6 1 7 22 4 26 28 5 33Transport, Postal and Warehousing 1 2 3 0 0 0 1 2 3
Total 97 132 229 81 116 197 178 248 426Source: Department of Trade, Business and Innovation
JOBS PROFILE WADEYE27

Table 14: Count of filled jobs by industry, employment status and Aboriginal status of person in job, 2017 (a)(c)(e)(h)
Industry (ANZSIC division)
2017Aboriginal Non-Aboriginal Total
Perm
Temp
Total
Perm
Temp
Total
Perm
Temp
Total
Accommodation and Food Services 0 8 8 0 6 6 0 14 14
Education and Training 0 92 92 0 66 66 0 158 158Electricity, Gas, Water and Waste Services 0 0 0 1 0 1 1 0 1Financial and Insurance Services 3 0 3 0 0 0 3 0 3Health Care and Social Assistance 6 25 31 16 17 33 22 42 64Public Administration and Safety 77 48 125 57 8 65 134 56 190
Retail Trade 16 16 32 30 8 38 46 24 70Total 102 189 291 104 105 209 206 294 500Source: Department of Trade, Business and Innovation
In 2017 in Wadeye: of the 206 permanent jobs, there were:
o 134 jobs in Public Administration and Safety, an increase of 80 jobs from 2014 and a decrease of 46 jobs from 2011, including: 77 jobs filled by Aboriginal persons, an increase of 45 jobs from 2014 and
a decrease of 35 jobs from 2011 57 jobs filled by non-Aboriginal persons, an increase of 35 jobs from
2014 and a decrease of 11 jobs from 2011o 46 jobs in Retail Trade, an increase of 18 jobs from 2014 and an increase of 13
jobs from 2011, including: 16 jobs filled by Aboriginal persons, an increase of 10 jobs from 2014 and
an increase of 5 jobs from 2011 30 jobs filled by non-Aboriginal persons, an increase of 8 jobs from 2014
and an increase of 8 jobs from 2011o 22 jobs in Health Care and Social Assistance, a decrease of 30 jobs from 2014
and an increase of 7 jobs from 2011, including: 6 jobs filled by Aboriginal persons, a decrease of 19 jobs from 2014 and a
decrease of 1 job from 2011 16 jobs filled by non-Aboriginal persons, a decrease of 11 jobs from 2014
and an increase of 8 jobs from 2011 of the 294 temporary jobs, there were:
o 158 jobs in Education and Training, an increase of 25 jobs from 2014 and an increase of 128 jobs from 2011, including:
JOBS PROFILE WADEYE28

92 jobs filled by Aboriginal persons, an increase of 27 jobs from 2014 and an increase of 66 jobs from 2011
66 jobs filled by non-Aboriginal persons, a decrease of 2 jobs from 2014 and an increase of 62 jobs from 2011
o 56 jobs in Public Administration and Safety, a decrease of 22 jobs from 2014 and an increase of 52 jobs from 2011, including: 48 jobs filled by Aboriginal persons, an increase of 2 jobs from 2014 and
an increase of 46 jobs from 2011 8 jobs filled by non-Aboriginal persons, a decrease of 24 jobs from 2014
and an increase of 6 jobs from 2011o 42 jobs in Health Care and Social Assistance, an increase of 26 jobs from 2014
and an increase of 16 jobs from 2011, including 25 jobs filled by Aboriginal persons, an increase of 16 jobs from 2014 and
an increase of 4 jobs from 2011 17 jobs filled by non-Aboriginal persons, an increase of 10 jobs from
2014 and an increase of 12 jobs from 2011.
JOBS PROFILE WADEYE29

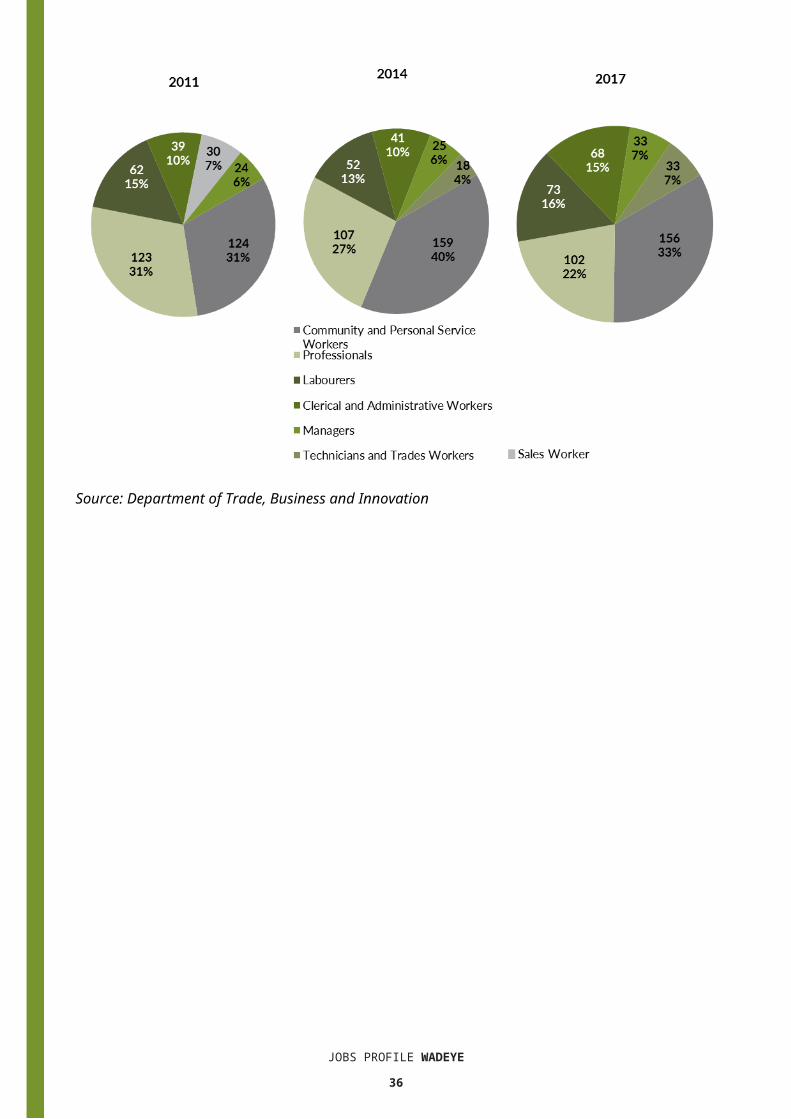
Jobs by OccupationTable 15: Count of filled jobs by occupation, 2011, 2014 and 2017 (a)(f)(g)
Occupation (ANZSCO major group)
2011 2014 2017
Chan
ge20
11-2
014
Chan
ge20
14-2
017
Total
% of Total
Total
% of Total
Total
% of Total
Total
Total
Clerical and Administrative Workers 39 9.2% 41 9.6% 68 13.6% 2 27Community and Personal Service Workers 124 29.2% 159 37.3% 156 31.2% 35 -3Labourers 62 14.6% 52 12.2% 73 14.6% -10 21Machinery Operators and Drivers 2 0.5% 7 1.6% 8 1.6% 5 1Managers 24 5.7% 25 5.9% 33 6.6% 1 8Professionals 123 29.0% 107 25.1% 102 20.4% -16 -5Sales Workers 30 7.1% 17 4.0% 27 5.4% -13 10Technicians and Trades Workers 16 3.8% 18 4.2% 33 6.6% 2 15Other occupations 4 0.9% 0 0.0% 0 0.0% -4 0Total 424 100.0
% 426 100.0% 500 100.0
% 2 74Source: Department of Trade, Business and Innovation
Chart 10: Percentage and count of top 6 filled jobs by occupation, 2011, 2014 and 2017 (a)(f)(g)
JOBS PROFILE WADEYE30

Source: Department of Trade, Business and Innovation
JOBS PROFILE WADEYE31

In 2017 in Wadeye: Community and Personal Service Workers was the largest occupation
classification in terms of filled jobs, accounting for 156 jobs (31.2% of total filled jobs), a decrease of 3 jobs from 2014 and an increase of 32 jobs from 2011
other significant occupation classifications were:o Professionals accounting for 102 jobs or 20.4% of total jobs a decrease of 5
jobs from 2014 and a decrease of 21 jobs from 2011o Labourers accounting for 73 jobs or 14.6% of total jobs an increase of 21 jobs
from 2014 and an increase of 11 jobs from 2011o Clerical and Administrative Workers accounting for 68 jobs or 13.6% of total
jobs an increase of 27 jobs from 2014 and an increase of 29 jobs from 2011.
Table 16 Count of filled jobs by ANZSCO occupation by Aboriginal status of person employed in job, 2011, 2014 and 2017 (a)(c)(f)(g)
Occupation (ANZSCO
major group)
2011 2014 2017
Chan
ge20
11-2
014
Chan
ge20
14-2
017
Ab
orig
inal
Non
-Ab
orig
inal
Tot
al
Ab
orig
inal
Non
-Ab
orig
inal
Tot
al
Ab
orig
inal
Non
-Ab
orig
inal
Tot
al
Ab
orig
inal
Non
-
Tot
al
Ab
orig
inal
Non
-Ab
orig
inal
Tot
al
Clerical and Administrative Workers
21 18 39 21 20 41 48 20 68 0 2 2 27 0 27
Community and Personal Service Workers
102 22 124 115 44 159 115 41 156 13 22 35 0 -3 -3
Labourers 43 19 62 36 16 52 59 14 73 -7 -3 -10 23 -2 21Machinery Operators and Drivers
2 0 2 3 4 7 2 6 8 1 4 5 -1 2 1
Managers 2 22 24 1 24 25 5 28 33 -1 2 1 4 4 8Professionals 66 57 123 42 65 107 40 62 102 -24 8 -16 -2 -3 -5Sales Workers 15 15 30 4 13 17 9 18 27 -11 -2 -13 5 5 10Technicians and Trades Workers 2 14 16 7 11 18 13 20 33 5 -3 2 6 9 15
Other occupations 3 1 4 0 0 0 0 0 0 -3 -1 -4 0 0 0
Total 256 168 424 229 197 426 291 209 500 -27 29 2 6
2 12 74
Source: Department of Trade, Business and Innovation
In 2017 in Wadeye: of the 291 jobs filled by Aboriginal persons, there were:
o 115 Community and Personal Service Workers, unchanged from 2014 and an increase of 13 jobs from 2011
JOBS PROFILE WADEYE32

o 59 Labourers, an increase of 23 jobs from 2014 and an increase of 16 jobs from 2011
o 48 Clerical and Administrative Workers, an increase of 27 jobs from 2014 and an increase of 27 jobs from 2011
of the 209 jobs filled by non-Aboriginal persons, there were:o 62 Professionals, a decrease of 3 jobs from 2014 and an increase of 5 jobs
from 2011o 41 Community and Personal Service Workers, a decrease of 3 jobs from 2014
and an increase of 19 jobs from 2011o 28 Managers, an increase of 4 jobs from 2014 and an increase of 6 jobs from
2011.
JOBS PROFILE WADEYE33

Jobs by Industry by OccupationTable 17: Count of filled jobs by industry by occupation, 2011 (a)(f)(g)(h)
2011
Industry (ANZSIC Division)
Occupation (ANZSCO major group)
Cl
eric
al a
nd
Adm
inis
trat
ive
Wor
kers
Co
mm
unit
y an
d Pe
rson
al S
ervi
ce
Wor
kers
La
bour
ers
M
achi
nery
O
pera
tors
and
D
rive
rs
Man
ager
s
Pr
ofes
sion
als
Sa
les
Wor
kers
Te
chni
cian
s an
d Tr
ades
Wor
kers
O
ther
occ
upat
ions
To
tal
Administrative and Support Services 2 1 0 0 0 5 0 0 0 8Construction 0 0 0 0 0 1 0 0 0 1Education and Training 2 72 14 0 2 43 0 0 0 13
3Financial and Insurance Services 3 0 0 0 0 0 0 0 0 3Health Care and Social Assistance 1 20 3 0 2 8 0 3 4 41Other Services 0 0 0 0 0 2 0 0 0 2Public Administration and Safety 28 30 38 0 11 63 2 12 0 18
4Rental, Hiring and Real Estate Services 0 0 0 0 1 0 2 0 0 3Retail Trade 2 0 5 0 8 0 26 1 0 42Transport, Postal and Warehousing 1 0 0 2 0 0 0 0 0 3
Total 39 124 62 2 24 123 30 16 4 42
4Source: Department of Trade, Business and Innovation
Table 18: Count of filled jobs by industry by occupation, 2014 (a)(f)(g)(h)2014
Industry (ANZSIC Division)
Occupation (ANZSCO major group)
Cl
eric
al a
nd
Adm
inis
trat
ive
Wor
kers
Co
mm
unit
y an
d Pe
rson
al S
ervi
ce
Wor
kers
La
bour
ers
M
achi
nery
O
pera
tors
and
D
rive
rs
Man
ager
s
Pr
ofes
sion
als
Sa
les
Wor
kers
Te
chni
cian
s an
d Tr
ades
Wor
kers
O
ther
occ
upat
ions
To
tal
Accommodation and Food Services 0 8 3 0 2 0 0 1 0 14Construction 0 0 1 0 0 0 0 1 0 2Education and Training 14 82 19 0 2 53 0 0 0 170Financial and Insurance Services 2 0 0 0 0 0 0 0 0 2Health Care and Social Assistance 5 33 5 3 7 14 0 1 0 68Public Administration and Safety 16 36 18 2 7 40 1 12 0 132
JOBS PROFILE WADEYE34

Rental, Hiring and Real Estate Services 1 0 0 0 0 0 1 0 0 2Retail Trade 2 0 4 2 7 0 15 3 0 33Transport, Postal and Warehousing 1 0 2 0 0 0 0 0 0 3
Total 41 159 52 7 25 107 17 18 0 426
Source: Department of Trade, Business and Innovation
Table 19: Count of filled jobs by occupation and by industry, 2017 (a)(f)(g)(h)2017
Industry (ANZSIC Division)
Occupation (ANZSCO major group)
Cl
eric
al a
nd
Adm
inis
trat
ive
Co
mm
unit
y an
d Pe
rson
al S
ervi
ce
Wor
kers
La
bour
ers
M
achi
nery
O
pera
tors
and
D
rive
rs
Man
ager
s
Pr
ofes
sion
als
Sa
les
Wor
kers
Te
chni
cian
s an
d Tr
ades
Wor
kers
O
ther
O
ccup
atio
ns
Tota
l
Accommodation and Food Services 1 8 2 0 1 0 0 2 0 14Education and Training 16 69 13 0 5 50 0 5 0 158Electricity, Gas, Water and Waste Services 0 0 0 0 0 0 0 1 0 1Financial and Insurance Services 3 0 0 0 0 0 0 0 0 3Health Care and Social Assistance 5 30 11 0 3 15 0 0 0 64Public Administration and Safety 42 40 44 2 10 31 0 21 0 190Retail Trade 1 9 3 6 14 6 27 4 0 70Total 68 156 73 8 3
3102 27 33 0 500
Source: Department of Trade, Business and Innovation
In 2017 in Wadeye: the majority of Community and Personal Service Workers (102) jobs (the largest
occupation group) were shared across the Education and Training (50), Public Administration and Safety (31) and Health Care and Social Assistance (15) industries
the majority of Public Administration and Safety jobs (190) (the largest industry group) were shared across Labourers, Clerical and Administrative Workers and Community and Personal Service Workers occupation groups
Public Administration and Safety and Retail Trade both had increases in filled jobs of 58 and 37 respectively between 2017 and 2014.
JOBS PROFILE WADEYE35
Jobs by GenderTable 20: Counts of filled jobs by gender and Aboriginal status of person employed in job 2011, 2014 and 2017 (a)(c)(i)
Indi
cato
r
2011 2014 2017 2011-2014 Change
2014-2017 Change
Ab
orig
inal
Non
-Ab
orig
inal
Tot
al
Ab
orig
inal
Non
-Ab
orig
inal
Tot
al
Ab
orig
inal
Non
-Ab
orig
inal
Tot
al
Ab
orig
inal
Non
-Ab
orig
inal
Tot
al
Ab
orig
inal
Non
-Ab
orig
inal
Tot
al
Male 95 77 172 127 91 218 115 103 218 32 14 46 -12 12 0
Female 74 51 125 102 106 208 176 106 282 28 55 83 74 0 74
Total 256 168 424 229 197 426 291 209 500 -27 29 2 62 12 7
4Source: Department of Trade, Business and Innovation
Chart 11: Count of filled jobs by gender and Aboriginal status of person in job, 2011, 2014 and 2017 (a)(c)(i)
Source: Department of Trade, Business and Innovation
In 2017 in Wadeye: there were 218 jobs filled by males, unchanged from 2014 and unchanged from
2011 of the 218 jobs filled by males:
JOBS PROFILE WADEYE36

o 115 were Aboriginal, a decrease of 12 jobs from 2014 and an increase of 20 jobs from 2011
JOBS PROFILE WADEYE37

o 103 were non-Aboriginal, an increase of 12 jobs from 2014 and an increase of 26 jobs from 2011
there were 282 jobs filled by females, an increase of 74 jobs from 2014 and an increase of 157 jobs from 2011
of the 282 jobs filled by females:o 176 were Aboriginal, an increase of 74 jobs from 2014 and an increase of 102
jobs from 2011o 106 were non-Aboriginal, unchanged from 2014 and unchanged from 2011.
Table 21: Counts of filled jobs by gender, by Aboriginal status of person in the job, by full-time/part-time status, by job permanency and by sector 2011 (a)(b)(c)(d)(e)(i)
2011
Indicator
Male Female Total
Ab
orig
inal
Non
-Ab
orig
inal
Tot
al
Ab
orig
inal
Non
-Ab
orig
inal
Tot
al
Ab
orig
inal
Non
-Ab
orig
inal
Tot
al
Full-time 66 74 140 49 47 96 177 161 338Part-time 29 3 32 25 4 29 79 7 86Total 95 77 172 74 51 125 256 168 424
Permanent 81 65 146 55 40 95 198 145 343Temporary 14 12 26 19 11 30 58 23 81Total 95 77 172 74 51 125 256 168 424
Public Sector 55 25 80 23 12 35 78 37 115Private Sector 40 52 92 51 39 90 178 131 309Total 95 77 172 74 51 125 256 168 424
Source: Department of Trade, Business and Innovation
JOBS PROFILE WADEYE38

Table 22: Counts of filled jobs by gender, by Aboriginal status of person in the job, by full-time/part-time status, by job permanency and by sector 2014 (a)(b)(c)(d)(e)(i)
2014
Indicator
Male Female Total
Ab
orig
inal
Non
-Ab
orig
inal
Tot
al
Ab
orig
inal
Non
-Ab
orig
inal
Tot
al
Ab
orig
inal
Non
-Ab
orig
inal
Tot
al
Full-time 74 86 160 48 89 137 122 175 297Part-time 53 5 58 54 17 71 107 22 129Total 127 91 218 102 106 208 229 197 426
Permanent 52 33 85 45 48 93 97 81 178Temporary 75 58 133 57 58 115 132 116 248Total 127 91 218 102 106 208 229 197 426
Public Sector 31 27 58 28 25 53 59 52 111Private Sector 96 64 160 74 81 155 170 145 315Total 127 91 218 102 106 208 229 197 426
Source: Department of Trade, Business and Innovation
Table 23: Counts of filled jobs by gender, by Aboriginal status of person in the job, by full-time/part-time status, by job permanency and by sector 2017 (a)(b)(c)(d)(e)(i)
2017
Indi
cato
r
Male Female Total
Ab
orig
inal
Non
-Ab
orig
inal
Tot
al
Ab
orig
inal
Non
-Ab
orig
inal
Tot
al
Ab
orig
inal
Non
-Ab
orig
inal
Tot
al
Full-time 51 100 151 48 96 144 99 196 295Part-time 64 3 67 128 10 138 192 13 205Total 115 103 218 176 106 282 291 209 500
Permanent 60 50 110 42 54 96 102 104 206Temporary 55 53 108 134 52 186 189 105 294Total 115 103 218 176 106 282 291 209 500
Public Sector 18 22 40 29 21 50 47 43 90Private Sector 97 81 178 147 85 232 244 166 410Total 115 103 218 176 106 282 291 209 500
Source: Department of Trade, Business and Innovation
JOBS PROFILE WADEYE39

In 2017 in Wadeye: of the 218 jobs filled by males, there were:
o 115 jobs filled by Aboriginal males, a decrease of 12 jobs from 2014 and an increase of 20 jobs from 2011, including: 51 full-time jobs, a decrease of 23 jobs from 2014 and a decrease of 15
jobs from 2011 64 part-time jobs, an increase of 11 jobs from 2014 and an increase of 35
jobs from 2011 60 permanent jobs, an increase of 8 jobs from 2014 and a decrease of 21
jobs from 2011 55 temporary jobs, a decrease of 20 jobs from 2014 and an increase of 41
jobs from 2011 18 public sector jobs, a decrease of 13 jobs from 2014 and a decrease of
37 jobs from 2011 97 private sector jobs, an increase of 1 job from 2014 and an increase of
57 jobs from 2011o 103 jobs filled by non-Aboriginal males, an increase of 12 jobs from 2014
and an increase of 26 jobs from 2011, including: 100 full-time jobs, an increase of 14 jobs from 2014 and an increase of 26
jobs from 2011 3 part-time jobs, a decrease of 2 jobs from 2014 and unchanged from 2011 50 permanent jobs, an increase of 17 jobs from 2014 and a decrease of 15
jobs from 2011 53 temporary jobs, a decrease of 5 jobs from 2014 and an increase of 41
jobs from 2011 22 public sector jobs, a decrease of 5 jobs from 2014 and a decrease of 3
jobs from 2011 81 private sector jobs, an increase of 17 jobs from 2014 and an increase of
29 jobs from 2011 of the 282 jobs filled by females, there were:
o 176 jobs filled by Aboriginal females, an increase of 74 jobs from 2014 and an increase of 102 jobs from 2011, including: 48 full-time jobs, unchanged from 2014 and a decrease of 1 job from 2011 128 part-time jobs, an increase of 74 jobs from 2014 and an increase of
103 jobs from 2011 42 permanent jobs, a decrease of 3 jobs from 2014 and a decrease of 13
jobs from 2011 134 temporary jobs, an increase of 77 jobs from 2014 and an increase of
115 jobs from 2011 29 public sector jobs, an increase of 1 job from 2014 and an increase of 6
jobs from 2011JOBS PROFILE WADEYE
40

147 private sector jobs, an increase of 73 jobs from 2014 and an increase of 96 jobs from 2011
o 106 jobs filled by non-Aboriginal females, unchanged from 2014 and an increase of 55 jobs from 2011, including: 96 full-time jobs, an increase of 7 jobs from 2014 and an increase of 49
jobs from 2011 10 part-time jobs, a decrease of 7 jobs from 2014 and an increase of 6 jobs
from 2011 54 permanent jobs, an increase of 6 jobs from 2014 and an increase of 14
jobs from 2011 52 temporary jobs, a decrease of 6 jobs from 2014 and an increase of 41
jobs from 2011 21 public sector jobs, a decrease of 4 jobs from 2014 and an increase of 9
jobs from 2011 85 private sector jobs, an increase of 4 jobs from 2014 and an increase of
46 jobs from 2011.
JOBS PROFILE WADEYE41

Jobs by AgeTable 24: Counts of filled jobs by age and Aboriginal status of person employed in job, 2011, 2014 and 2017 (a)(c)(j)
Indicator
2011 2014 2017 Change2011-2014
Change2014-2017
Ab
orig
inal
Non
-Abo
rigi
nal
Tot
al
Ab
orig
inal
Non
-Abo
rigi
nal
Tot
al
Ab
orig
inal
Non
-Abo
rigi
nal
Tot
al
Ab
orig
inal
Non
-Abo
rigi
nal
Tot
al
Ab
orig
inal
Non
-Abo
rigi
nal
Tot
al
15-24 years 25 7 32 5 14 19 25 8 33 -20 7 -
13 20 -6 1425-44 years 84 64 14
8150 91 24
119
9135
334 66 27 93 49 44 93
45+ years 60 57 117 74 92 16
6 67 66 133 14 35 49 -7 -26 -33
Total 256
168
424
229
197
426
291
209
500
-27 29 2 62 12 74
Source: Department of Trade, Business and Innovation
Chart 12: Count of filled jobs by age and Aboriginal status of person in job, 2011, 2014 and 2017 (a)(c)(j)
Source: Department of Trade, Business and Innovation
In 2017 in Wadeye: there were 33 jobs filled by persons aged 15-24 years, an increase of 14 jobs
from 2014 and an increase of 1 job from 2011. Of these:JOBS PROFILE WADEYE
42

o 25 jobs were filled by Aboriginal persons, an increase of 20 jobs from 2014 and unchanged from 2011
o 8 jobs were filled by non-Aboriginal persons, a decrease of 6 jobs from 2014 and an increase of 1 job from 2011
there were 334 jobs filled by persons aged 25-44 years, an increase of 93 jobs from 2014 and an increase of 186 jobs from 2011. Of these:o 199 jobs were filled by Aboriginal persons, an increase of 49 jobs from 2014
and an increase of 115 jobs from 2011o 135 jobs were filled by non-Aboriginal persons, an increase of 44 jobs from
2014 and an increase of 71 jobs from 2011 there were 133 jobs filled by persons aged 45+ years, a decrease of 33 jobs
from 2011 and an increase of 16 jobs from 2011. Of these:o 67 jobs were filled by Aboriginal persons, a decrease of 7 jobs from 2014 and
an increase of 7 jobs from 2011o 66 jobs were filled by non-Aboriginal persons, a decrease of 26 jobs from
2014 and an increase of 9 jobs from 2011.
Table 25: Counts of filled jobs by age, by Aboriginal status of person in the job, by full-time/part-time status, by job permanency and by sector June-July 2011 (a)(b)(c)(d)(e)(i)
2011
Indicator
15-24 years 25-44 years 45+ years Total
Ab
orig
inal
Non
-Abo
rigi
nal
Tot
al
Ab
orig
inal
Non
-Abo
rigi
nal
Tot
al
Ab
orig
inal
Non
-Abo
rigi
nal
Tot
al
Ab
orig
inal
Non
-Abo
rigi
nal
Tot
alFull-time 20 6 26 55 60 11
5 40 55 95 177 161 338
Part-time 5 1 6 29 4 33 20 2 22 79 7 86
Total 25 7 32 84 64 148 60 57 117 256 16
8424
Permanent 23 5 28 62 5611
8 51 44 95 198 145343
Temporary 2 2 4 22 8 30 9 13 22 58 23 81
Total 25 7 32 84 64 148 60 57 117 256 16
8424
Public Sector 3 5 8 40 14 54 35 18 53 78 37115
Private Sector 22 2 24 44 50 94 25 39 64 178 131 309
Total 25 7 32 84 64 148 60 57 117 256 16
8424
Source: Department of Trade, Business and Innovation
JOBS PROFILE WADEYE43

Table 26: Counts of filled jobs by age, by Aboriginal status of person in the job, by full-time/part-time status, by job permanency and by sector June-July 2014 (a)(b)(c)(d)(e)(i)
2014
Indicator
15-24 years 25-44 years 45+ years Total
Ab
orig
inal
Non
-Ab
orig
inal
Tot
al
Ab
orig
inal
Non
-Ab
orig
inal
Tot
al
Ab
orig
inal
Non
-Ab
orig
inal
Tot
al
Ab
orig
inal
Non
-Ab
orig
inal
Tot
al
Full-time 2 12 14 79 84 163 41 79 12
0 122 175 297Part-time 3 2 5 71 7 78 33 13 46 107 22 129Total 5 14 19 150 91 24
1 74 92 166 229 19
7 426
Permanent 2 9 11 51 39 90 44 33 77 97 81 178Temporary 3 5 8 99 52 15
1 30 59 89 132 116 248
Total 5 14 19 150 91 241 74 92 16
6 229 197 426
Public Sector 1 1 2 34 26 60 24 25 49 59 52 111Private Sector 4 13 17 116 65 18
1 50 67 117 170 145 315
Total 5 14 19 150 91 241 74 92 16
6 229 197 426
Source: Department of Trade, Business and Innovation
Table 27: Counts of filled jobs by age, by Aboriginal status of person in the job, by full-time/part-time status, by job permanency and by sector June-July 2017 (a)(b)(c)(d)(e)(i)
2017
Indicator
15-24 years 25-44 years 45+ years Total
Ab
orig
inal
Non
-Ab
orig
inal
Tot
al
Ab
orig
inal
Non
-Ab
orig
inal
Tot
al
Ab
orig
inal
Non
-Ab
orig
inal
Tot
al
Ab
orig
inal
Non
-Ab
orig
inal
Tot
al
Full-time 6 8 14 62 126 188 31 62 93 99 196 295
Part-time 19 0 19 137 9 146 36 4 40 192 13 205
Total 25 8 33 199 135 33
4 67 66 133 291 209 500
Permanent 5 5 10 82 73155 15 26 41 102 104 206
Temporary 20 3 23 117 62 179 52 40 92 189 105 294
Total 25 8 33 199 135 33
4 67 66 133 291 209 500
JOBS PROFILE WADEYE44

Public Sector 3 0 3 28 20 48 16 23 39 47 43 90Private Sector 22 8 30 171 115 28
6 51 43 94 244 166 410
Total 25 8 33 199 135 33
4 67 66 133 291 209 500
Source: Department of Trade, Business and Innovation
JOBS PROFILE WADEYE45

In 2017 in Wadeye: of the 33 jobs filled by persons aged 15-24 years, there were:
o 25 jobs filled by Aboriginal persons, of which 6 were full-time jobs, an increase of 4 jobs from 2014 and a decrease of 14
jobs from 2011 19 were part-time jobs, an increase of 16 jobs from 2014 and an increase
of 14 jobs from 2011 5 were permanent jobs, an increase of 3 jobs from 2014 and a decrease of
18 jobs from 2011 20 were temporary jobs, an increase of 17 jobs from 2014 and an increase
of 18 jobs from 2011 3 were public sector jobs, an increase of 2 jobs from 2014 and unchanged
from 2011 22 were private sector jobs, an increase of 18 jobs from 2014 and
unchanged from 2011o 8 jobs filled by non-Aboriginal persons, of which:
8 were full-time jobs, a decrease of 4 jobs from 2014 and an increase of 2 jobs from 2011
none were part-time jobs, a decrease of 2 jobs from 2014 and a decrease of 1 job from 2011
5 were permanent jobs, a decrease of 4 jobs from 2014 and unchanged from 2011
3 were temporary jobs, a decrease of 2 jobs from 2014 and an increase of 1 job from 2011
none were public sector jobs, a decrease of 1 job from 2014 and a decrease of 5 jobs from 2011
8 were private sector jobs, a decrease of 5 jobs from 2014 and an increase of 6 jobs from 2011
of the 334 jobs filled by persons aged 25-44 years, there were:o 199 jobs filled by Aboriginal persons, of which:
62 were full-time jobs, a decrease of 17 jobs from 2014 and an increase of 7 jobs from 2011
137 were part-time jobs, an increase of 66 jobs from 2014 and an increase of 108 jobs from 2011
82 were permanent jobs, an increase of 31 jobs from 2014 and an increase of 20 jobs from 2011
117 were temporary jobs, an increase of 18 jobs from 2014 and an increase of 95 jobs from 2011
28 were public sector jobs, a decrease of 6 jobs from 2014 and a decrease of 12 jobs from 2011
JOBS PROFILE WADEYE46

JOBS PROFILE WADEYE47

171 were private sector jobs, an increase of 55 jobs from 2014 and an increase of 127 jobs from 2011
o 135 jobs filled by non-Aboriginal persons, of which: 126 were full-time jobs, an increase of 42 jobs from 2014 and an increase
of 66 jobs from 2011 9 were part-time jobs, an increase of 2 jobs from 2014 and an increase of 5
jobs from 2011 73 were permanent jobs, an increase of 34 jobs from 2014 and an increase
of 17 jobs from 2011 62 were temporary jobs, an increase of 10 jobs from 2014 and an increase
of 54 jobs from 2011 20 were public sector jobs, a decrease of 6 jobs from 2014 and an increase
of 6 jobs from 2011 115 were private sector jobs, an increase of 50 jobs from 2014 and an
increase of 65 jobs from 2011 of the 133 jobs filled by persons aged 45+ years, there were:
o 67 jobs filled by Aboriginal persons, of which: 31 were full-time jobs, a decrease of 10 jobs from 2014 and a decrease of
9 jobs from 2011 36 were part-time jobs, an increase of 3 jobs from 2014 and an increase of
16 jobs from 2011 15 were permanent jobs, a decrease of 29 jobs from 2014 and a decrease
of 36 jobs from 2011 52 were temporary jobs, an increase of 22 jobs from 2014 and an increase
of 43 jobs from 2011 16 were public sector jobs, a decrease of 8 jobs from 2014 and a decrease
of 19 jobs from 2011 51 were private sector jobs, an increase of 1 job from 2014 and an
increase of 26 jobs from 2011
JOBS PROFILE WADEYE48

o 66 jobs filled by non-Aboriginal persons, of which: 62 were full-time jobs, a decrease of 17 jobs from 2014 and an increase of
7 jobs from 2011 4 were part-time jobs, a decrease of 9 jobs from 2014 and an increase of 2
jobs from 2011 26 were permanent jobs, a decrease of 7 jobs from 2014 and a decrease of
18 jobs from 2011 40 were temporary jobs, a decrease of 19 jobs from 2014 and an increase
of 27 jobs from 2011 23 were public sector jobs, a decrease of 2 jobs from 2014 and an increase
of 5 jobs from 2011 43 were private sector jobs, a decrease of 24 jobs from 2014 and an
increase of 4 jobs from 2011.
JOBS PROFILE WADEYE49

Vocational Education and TrainingNote: Since previous publications, the 2010 data have fallen in line with the new standardised
reporting practices with an emphasis of all training activity undertaken in the remote town regardless of funding stream. As such, figures for 2010 VET data in this publication may differ from previous publications.
The impact of the Remote Jobs and Communities Program (RJCP) being established in 2013 has played a significant role in the downturn of accredited training in many remote towns across the Territory.
Table 28: Northern Territory Vocational Education and Training (VET) students, 2010, 2013 and 2016 (k)
VET Funding Group2010 2013 2016 Change
No. % of Total No. % of
Total No. % of Total
2010-2013
2013-
2016Arts, Entertainment, Sports and Recreation 24 4 4 1 30 9 - 20 26Automotive 11 2 36 12 14 4 25 - 22Building and Construction 141 25 37 12 34 10 - 104 - 3Business and Clerical 12 2 2 1 10 3 - 10 8Community Services, Health and Education 57 10 58 19 91 28 1 33Engineering and Mining 33 6 0 0 17 5 - 33 17Finance, Banking and Insurance 3 1 3 1 4 1 0 1General Education and Training 76 13 37 12 29 9 - 39 - 8Primary Industry 149 26 85 28 62 19 - 64 - 23Sales and Personal Service 43 8 20 7 12 4 - 23 - 8Textiles, Clothing, Footwear and Furnishings 0 0 2 1 0 0 2 - 2Tourism and Hospitality 11 2 4 1 3 1 - 7 - 1Transport and Storage 9 2 14 5 20 6 5 6Utilities 0 0 1 0 0 0 1 - 1Total 569 100 303 100 326 100 - 266 23
Source: Department of Trade, Business and Innovation
In 2016 in Wadeye: there were 326 VET students, an increase of 23 students from 2013 and a
decrease of 243 students from 2010 the areas of VET activity with the most students were Community Services, Health
and Education (91), Primary Industry (62), and Building and Construction (34) Community Services, Health and Education reported the largest increase in
students (33) compared to 2013 and Primary Industry reported the largest decrease in students (-23) over the same period.
JOBS PROFILE WADEYE50

Table 29: Northern Territory Vocational Education and Training (VET) unit enrolments, 2010, 2013 and 2016 (l)
VET Funding Group2010 2013 2016 Change
No. % of Total No.
% of Tota
lNo.
% of Tota
l
2010-
2013
2013-
2016Arts, Entertainment, Sports and Recreation 144 7 13 1 63 4 - 131 50Automotive 82 4 184 12 56 3 102 - 128Building and Construction 448 22 331 22 342 20 - 117 11Business and Clerical 27 1 6 0 10 1 - 21 4Community Services, Health and Education 238 12 232 16 445 26 - 6 213Engineering and Mining 33 2 0 0 80 5 - 33 80Finance, Banking and Insurance 11 1 8 1 28 2 - 3 20Food Processing 0 0 0 0 0 0 0 0General Education and Training 138 7 202 14 151 9 64 - 51Primary Industry 450 22 240 16 323 19 - 210 83Sales and Personal Service 265 13 118 8 52 3 - 147 - 66Textiles, Clothing, Footwear and Furnishings 0 0 6 0 0 0 6 - 6Tourism and Hospitality 110 5 8 1 3 0 - 102 - 5Transport and Storage 106 5 125 8 152 9 19 27Utilities 0 0 2 0 0 0 2 - 2Total 2 052 100 1 475 100 1 705 100 - 577 230
Source: Department of Trade, Business and Innovation
In 2016 in Wadeye: there were 1705 VET unit enrolments, an increase of 230 unit enrolments from
2013 and a decrease of 347 unit enrolments from 2010 the areas of VET activity with the most unit enrolments were Community Services,
Health and Education (445), Building and Construction (342), and Primary Industry (323)
Community Services, Health and Education reported the largest increase in unit enrolments (213) compared to 2013 and Automotive reported the largest decrease in unit enrolments (-128) over the same period.
JOBS PROFILE WADEYE51

Table 30: Northern Territory Vocational Education and Training (VET) nominal hours, 2010, 2013 and 2016 (m)
VET Funding Group
2010 2013 2016 Change
No.% of
Total
No.% of
Total
No.% of
Total
2010-2013
2013-2016
Arts, Entertainment, Sports and Recreation 5 760 10 180 0 1 330 4 -5 580 1 150Automotive 1 255 2 3 365 8 910 2 2 110 -2 455Building and Construction 15 172 25 9 420 23 9 928 27 -5 752 508Business and Clerical 615 1 295 1 200 1 - 320 - 95Community Services, Health and Education 5 085 9 7 689 19 9 017 24 2 604 1 328Engineering and Mining 660 1 0 0 2 212 6 - 660 2 212Finance, Banking and Insurance 330 1 195 0 800 2 - 135 605General Education and Training 9 370 16 5 490 13 1 470 4 -3 880 -4 020Primary Industry 10 080 17 7 800 19 7 730 21 -2 280 - 70Sales and Personal Service 6 411 11 3 345 8 316 1 -3 066 -3 029Textiles, Clothing, Footwear and Furnishings 0 0 180 0 0 0 180 - 180Tourism and Hospitality 2 068 3 116 0 0 0 -1 952 - 116Transport and Storage 2 825 5 2 795 7 3 275 9 - 30 480Utilities 0 0 140 0 0 0 140 - 140Total 59
631 10
041
010 10
037
188 10
0-18 621
-3 822
Source: Department of Trade, Business and Innovation
In 2016 in Wadeye: there were 37 188 VET nominal hours delivered, a decrease of 3822 nominal
hours delivered from 2013 and a decrease of 22443 nominal hours delivered from 2010
the areas of VET activity with the most nominal hours delivered were Building and Construction (9928), Community Services, Health and Education (9017), and Primary Industry (7730)
Engineering and Mining reported the largest increase in nominal hours delivered (2212) compared to 2013 and General Education and Training reported the largest decrease in nominal hours delivered (-4020) over the same period.
Caveat: Nominal hours are based on the hours funded through Department of Trade Business and Innovation contracts; students and units includes delivery that has been funded in a previous year, fee for service or training that did not meet the funding requirements. Because of this a direct match cannot be made between hours and student/units.
JOBS PROFILE WADEYE52

Table 31: Northern Territory Vocational Education and Training (VET) unit completions, 2010, 2013 and 2016 (n)
VET Funding Group2010 2013 2016 Change
No. % of Total No. % of
Total No. % of Total
2010-2013
2013-
2016Arts, Entertainment, Sports and Recreation 0 0 13 3 40 3 13 27Automotive 31 3 105 21 23 2 74 - 82Building and Construction 291 28 69 14 215 18 - 222 146Business and Clerical 6 1 4 1 0 0 - 2 - 4Community Services, Health and Education 195 19 63 13 269 23 - 132 206Computing 0 0 0 0 0 0 0 0Engineering and Mining 33 3 0 0 64 5 - 33 64Finance, Banking and Insurance 0 0 0 0 12 1 0 12General Education and Training 37 4 20 4 57 5 - 17 37Primary Industry 235 22 77 16 313 27 - 158 236Sales and Personal Service 108 10 10 2 25 2 - 98 15Tourism and Hospitality 11 1 8 2 3 0 - 3 - 5Transport and Storage 106 10 125 25 152 13 19 27Utilities 0 0 1 0 0 0 1 - 1Total 1 053 100 495 100 1 173 100 - 558 678Source: Department of Trade, Business and Innovation
In 2016 in Wadeye: there were 1173 VET unit completions, an increase of 678 unit completions
from 2013 and an increase of 120 unit completions from 2010 the areas of VET activity with the most unit completions were Primary Industry
(313), Community Services, Health and Education (269), and Building and Construction (215)
Primary Industry reported the largest increase in nominal hours delivered (236) compared to 2013 and Automotive reported the largest decrease in nominal hours delivered (-82) over the same period.
JOBS PROFILE WADEYE53

PopulationTable 32: Population distribution by gender and age (p)(r)
Indicator2006 2016 Change
Male Female Total Male Femal
e Total Male Female Total
0-4 years 157 134 291 141 140 281 -16 6 -105-14 years 208 207 415 304 250 554 96 43 13915-24 years 171 220 391 191 243 434 20 23 4325-44 years 235 260 495 448 501 949 213 241 45445-64 years 103 93 196 171 211 382 68 118 18665+ years 25 48 73 8 23 31 -17 -25 -42TOTAL 899 962 1861 1263 1368 2631 364 406 770Source: Department of Trade, Business and Innovation
In 2016 in Wadeye: there were an estimated 2631 persons, of which:
o 1263 (48%) were maleo 1368 (52%) were female
between 2006 and 2016, the overall population in Wadeye increased by 770 persons from 2006, or an average of 3.5% per year compared to 0.7% across the 28 remote towns and 1.5% Territory wide
the male population increased by 364 persons from 2006 the female population increased by 406 persons from 2006 in 2016, the working age population (15 years and over) in Wadeye was an
estimated 1796 persons (68.3% of the total population) compared with 1155 persons (62.1% of the total population) in 2006. Of these:o 434 (16.5%) were between 15 and 24 years of ageo 949 (36.1%) were between 25 and 44 years of ageo 382 (14.5%) were between 45 and 64 years of ageo 31 (1.2%) were over 65 years of age
of the 1796 persons of working age:o 818 (45.5%) were maleo 978 (54.5%) were female.
There were 0.3 jobs in Wadeye per working age person compared to 0.4 jobs per working age person across the 28 remote towns in the Northern Territory.
JOBS PROFILE WADEYE54

Chart 13: Population by Aboriginal status compared to the 28 remote towns and the NT (p)(q)
Source: Department of Trade, Business and Innovation
In 2016 in Wadeye: 92.4% of the population in Wadeye were Aboriginal, compared to 92.1% in 2006 89.4% of the population across all 28 remote towns were Aboriginal 28.3% of the Northern Territory population were Aboriginal.
Table 33: Unemployment and participation rates by Aboriginal status compared to the NT (q)
Wadeye Northern Territory
Aboriginal
Non-Aborigin
alTotal Aborigin
alNon-
Aboriginal
Total
Unemployment rate 58.3% 2.1% 44.5% 26.7% 3.8% 7.0%Participation rate 36.3% 94.0% 42.7% 41.0% 79.9% 70.6%Source: Department of Trade, Business and Innovation
In 2016 in Wadeye the: total unemployment rate was 44.5% compared to 7% for the total Northern
Territory Aboriginal unemployment rate was 58.3% compared to 26.7% for the total
Northern Territory non-Aboriginal unemployment rate was 2.1% compared to 3.8% for the total
Northern Territory total participation rate was 42.7% compared to 70.6% for the total Northern
Territory Aboriginal participation rate was 36.3% compared to 41% for the total
JOBS PROFILE WADEYE55

Northern Territory non-Aboriginal participation rate was 94% compared to 79.9% for the total
Northern Territory.
JOBS PROFILE WADEYE56

Community Development ProgrammeTable 34: Community Development Programme Aboriginal Job Seekers, 30 April 2018 (o)
Indicator AboriginalNo. %
Total Aboriginal Job Seekers 484 N/AAge (years)
15-24 116 24.025-44 276 57.045+ 92 19.0
Total 484 100.0Gender
Male 247 51.0Female 237 49.0
Total 484 100.0Employment Outcome - 1 July 2015 to 30 April 2018
13 Weeks 118 57.826 Weeks 86 42.2
Currently in Activities 374 Source: Department of Prime Minister and Cabinet
Chart 14: Community Development Programme Aboriginal Job Seekers by Gender and Age Group, 30 April 2018 (o)
24751.0%
23749.0%
Gender
Male Female
11624.0%
27657.0%
9219.0%
Age (years)
15-24 25-44 45+
Source: Department of Prime Minister and Cabinet
As at 30 April 2018, in Wadeye, there were 484 CDP Aboriginal job seekers, of these: 247 (51%) were male and 237 (49%) were female 116 (24%) were aged 15-24 years, 276 (57%) were aged 25-44 years, and 92
(19%) were aged 45+ years between 1 July 2015 and 30 April 2018, 118 had reached the 13 week reporting
milestone and 86 had reached the 26 week reporting milestone 374 were currently in activities.
JOBS PROFILE WADEYE57

JOBS PROFILE WADEYE58

BusinessesTable 35: Businesses by Sector (d)(s)
Business NameReported on in 2011?
Reported on in 2014?
Reported on in 2017?
PUBLIC SECTOR Aboriginal Hostels Limited No Yes YesDepartment of Corrections Yes Yes NoDepartment of Health Yes Yes YesDepartment of Housing Yes Yes NoDepartment of Human Services trading as Centrelink Yes Yes YesDepartment of the Prime Minister and Cabinet Yes Yes YesNorthern Territory Police, Fire Emergency Services Yes Yes YesTerritory Families No No YesVictoria Daly Shire Council Yes No NoWest Daly Regional Council No Yes YesPRIVATE SECTORAustralian Football League Northern Territory (AFLNT) Yes No NoBatchelor Institute of Indigenous Tertiary Education (BIITE) Yes Yes YesCatholic Care NT Yes Yes YesCatholic Church of the Diocese of Darwin Yes No NoDave Reddy Pty Ltd Yes No NoDJ Air & Electrical Services Pty Ltd No Yes YesJobfind Centres Australia Yes No NoManinh Projects Pty Ltd trading as Werrk Store No Yes YesMenzies School of Health Research Yes No NoMipatha Take Away Yes No NoMurin Association Incorporated Yes Yes NoMurrinhpatha Nimmipa Store Yes Yes YesOur Lady of the Sacred Heart Thamurrurr Catholic School Yes Yes YesPalngun Wurnangat Aboriginal Corporation Yes Yes YesPalumpa Station Pty Ltd Yes No NoSamjin Agriculture and Food Enterprise t/as Wadeye 24 Hour No No YesSave the Children Australia No Yes YesThamarrurr Development Corporation Yes Yes YesThamurrurr Aged Care - D & R Community Services Yes Yes NoThathangathay Foundation No No YesThe Arnhem Land Progress Aboriginal Corporation (ALPA) Yes No NoTraditional Credit Union (TCU) Yes Yes YesWadeye Creche - Childrens Services Support Unit Yes Yes YesWadeye Safe House - Children Services Support Unit Yes Yes Yes
Source: Department of Trade, Business and Innovation
Note: Business names captured across the three survey periods have been identified by the current 2017 Business ABN name listed as at 2017.
In 2017 in Wadeye: there were 21 businesses reported on, of which:
o 7 businesses were from the public sector (33%)o 14 businesses were from the private sector (67%)
there were 8 businesses operating that were not operating in 2011.JOBS PROFILE WADEYE
59

Notes(a) These counts represent numbers of filled jobs and not numbers of persons. As such the
totals represent the total number of filled jobs, not the total number of employees. This count is not directly comparable to the total number of employed persons as a person may have several jobs or one job may be shared by more than one person.
(b) Full-time is defined as a job usually requiring 35 hours or more per week or that required 35 hours or more work during the reference week. Part-time is defined as a job usually requiring less than 35 hours per week or that required less than 35 hours work during the reference week. The reference week refers to the period that respondents were asked to provide information about. In most instances it would be the week prior to the week the questionnaire was completed. Questionnaires were predominantly conducted in June and July.
(c) Care needs to be taken when analysing the counts of filled jobs by the Aboriginal status of persons in the jobs. The Aboriginal status of the person employed in a job was reported by the business representative completing the questionnaire.
(d) Sector was classified using the Standard Economic Sector of Classifications of Australia (SESCA), 2008.
(e) Job permanency is classified according to what the business believes the level of job permanency is based on guidelines provided by data collectors. Those guidelines state a permanent job has paid annual and/or sick leave entitlements while a temporary job includes casual and fixed-term contract jobs.
(f) Classified according to the Australian and New Zealand Standard Classification of Occupations (ANZSCO), 2006, major occupation level.
(g) Other occupations include jobs where occupation was not stated, not known or inadequately described.
(h) Classified using the Australian and New Zealand Standard Industrial Classification (ANZSIC), 2006, division level.
(i) Care needs to be taken when analysing the counts of filled jobs by the gender of persons in the jobs. The gender of the person employed in a job is reported by the business representative completing the questionnaire.
(j) Care needs to be taken when analysing the counts of filled jobs by the age of persons in the jobs. The age of the person employed in a job is reported by the business representative completing the questionnaire.
(k) Students represent the number of individual clients that enrolled in a Vocational Education and Training unit during the calendar year.
(l) Unit enrolments represent the count of individual units that students enrolled in during the calendar year.
(m)Nominal hours delivered is the sum of the nominal hours of the units commenced during the calendar year regardless of when the course enrolment commenced.
(n) Unit completions are the count of all successfully completed units reported in the calendar year regardless of the year of commencement of the units.
(o) The Community Development Programme (CDP) supports job seekers in remote Australia to build skills, address barriers and contribute to their communities through a range of flexible activities. Under the CDP, job seekers with activity requirements are expected to do up to 25 hours per week of work-like activities that benefit their community. It should be noted that some CDP participants may be reported on within the profile if they are attached to a filled position with an employer captured in the survey. Due to confidentiality issues, data below 20 people is not published.
(p) Population estimates for both 2006 and 2016 are taken from the estimated resident population (ERP) data produced by the Australian Bureau of Statistics (ABS) and based on Australian Statistical Geography Standard (ASGS) Statistical Area Level 1 (SA1) regions. ERP are official estimates of the Australian population, which link people to a place of usual residence with Australia. All ERP data sources, including the Census of Population and Housing (Census), are subject to error (including inaccuracies in collection, recording and processing data) and should be used with caution.
(q) Indigenous population proportions, unemployment and workforce participation rates are based on ABS Census counts at ASGS Indigenous Locations (ILOCs) for each remote town.
(r) Working-age population includes all residents aged 15 years and over (commonly referred to as the civilian population) and consists of persons that are employed, unemployed or not in the labour force.
JOBS PROFILE WADEYE60

(s) A ‘business’ has been defined as any organisation that has undertaken productive activities in the last year, including companies, non-profit organisations, government departments and enterprises operating within the designated remote geography (town), and has one or more employees in paid employment and an Australian Business Number (ABN).
JOBS PROFILE WADEYE61

Abbreviations and AcronymsABN Australian Business NumberABS Australian Bureau of StatisticsANZSCO Australian and New Zealand Standard Classification of OccupationsANZSIC Australian and New Zealand Standard Industrial ClassificationASGS Australian Statistical Geography StandardCDP Community Development ProgrammeERP Estimated Resident PopulationILOC Indigenous Locations nec Not Elsewhere ClassifiedNo. NumberPerm Permanentppt Percentage pointRJCP Remote Jobs and Communities ProgramTemp TemporarySA1 Statistical Area Level 1VET Vocational Education and Training
JOBS PROFILE WADEYE62


