W Wa B :Ca C ontrols - Elsevier · 2013-12-18 · eutrophic Waters withagoodsupply of...
21
9.08 Worldwide Eutrophication of Water Bodies: Causes, Concerns, Controls E. E. Prepas Lakehead University, Thunder Bay, ON, Canada and T. Charette University of Alberta, Edmonton, AB, Canada NOMENCLATURE 311 9.08.1 INTRODUCTION 312 9.08.1.1 Aspects of Worldwide Concern over Eutrophication 312 9.08.1.2 Indicators of Eutrophication and Sampling Methods 313 9.08.2 NATURAL EUTROPHICATION 314 9.08.3 CULTURAL EUTROPHICATION: CASE STUDIES 315 9.08.3.1 Lake Washington 318 9.08.3.2 Lake Erie 319 9.08.3.3 Lake Tahoe 321 9.08.3.4 Lago Maggiore 322 9.08.3.5 Lake Victoria 323 9.08.3.6 Chesapeake Bay 325 9.08.4 EUTROPHICATION CONTROL 327 9.08.4.1 Control of Concentrated (Point) Nutrient Sources 327 9.08.4.2 Control of Diffuse (Nonpoint) Nutrient Sources 327 9.08.4.3 Control of Internal Nutrient Sources 328 9.08.5 THE FUTURE—OPPORTUNITIES FOR EUTROPHICATION MANAGEMENT 329 ACKNOWLEDGMENTS 329 REFERENCES 329 NOMENCLATURE Glossary of Limnological Terms (from Ruttner, 1952; Crosby et al., 1990) biomass Weight of living matter. chlorophyll a Primary photosynthetic pig- ment. The concentration of chlorophyll a in water is an indicator of phytoplankton biomass. See biomass. cyanobacteria Prokaryotic organisms in the phytoplankton community. Cyanobacteria are typified by cells without a nucleus or orga- nelles and with photosensitive pigments dispersed throughout the cell. Some species are cap- able of obtaining nitrogen for metabolism from the atmos- phere. 311
Transcript of W Wa B :Ca C ontrols - Elsevier · 2013-12-18 · eutrophic Waters withagoodsupply of...
9.08Worldwide Eutrophication ofWater Bodies: Causes,Concerns, ControlsE. E. Prepas
Lakehead University, Thunder Bay, ON, Canada
and
T. Charette
University of Alberta, Edmonton, AB, Canada
NOMENCLATURE 311
9.08.1 INTRODUCTION 3129.08.1.1 Aspects of Worldwide Concern over Eutrophication 3129.08.1.2 Indicators of Eutrophication and Sampling Methods 313
9.08.2 NATURAL EUTROPHICATION 314
9.08.3 CULTURAL EUTROPHICATION: CASE STUDIES 3159.08.3.1 Lake Washington 3189.08.3.2 Lake Erie 3199.08.3.3 Lake Tahoe 3219.08.3.4 Lago Maggiore 3229.08.3.5 Lake Victoria 3239.08.3.6 Chesapeake Bay 325
9.08.4 EUTROPHICATION CONTROL 3279.08.4.1 Control of Concentrated (Point) Nutrient Sources 3279.08.4.2 Control of Diffuse (Nonpoint) Nutrient Sources 3279.08.4.3 Control of Internal Nutrient Sources 328
9.08.5 THE FUTURE—OPPORTUNITIES FOR EUTROPHICATION MANAGEMENT 329
ACKNOWLEDGMENTS 329
REFERENCES 329
NOMENCLATURE
Glossary of LimnologicalTerms (fromRuttner,1952; Crosby et al., 1990)
biomass Weight of living matter.chlorophyll a Primary photosynthetic pig-
ment. The concentration ofchlorophyll a in water is anindicator of phytoplanktonbiomass. See biomass.
cyanobacteria Prokaryotic organisms in thephytoplankton community.Cyanobacteria are typified bycells without a nucleus or orga-nelles and with photosensitivepigments dispersed throughoutthe cell. Some species are cap-able of obtaining nitrogen formetabolism from the atmos-phere.
311
drainage basin The land area that contributessurface runoff to a water body.See “runoff.”
epilimnion The warm uppermost layer in athermally stratified water bodythat is subject to mixing bywind.
eutrophic Waters with a good supply ofnutrients and hence a richorganic production.
freshwater Water with concentration oftotal dissolved solids below500 mg L21.
hypolimnion The cool bottom layer in athermally stratified water bodythat is separated from surfaceinfluences by a thermocline (seethermocline).
macrophytes Large aquatic plants.mesotrophic Waters with a moderate supply
of nutrients and organic pro-duction.
nutrientlimitation
Limitation of phytoplanktonbiomass by an insufficient nutri-ent supply compared to thedemand.
oligotrophic Waters with a poor supply ofnutrients and organic pro-duction.
phytoplankton The photosynthesizing portionof the plankton. See also plank-ton.
plankton The community of the freewater.
primaryproduction
The production of organic mat-ter from inorganic materialswithin a certain period of timeby autotrophic organisms.
runoff The water reaching a lake,stream, or ocean after flowover land or through the surfi-cial layers of the land.
Secchi diskdepth
The depth in water to which aSecchi disk (a 20 cm diameterdisk with alternating black andwhite quadrants) can be seenfrom the surface. Secchi diskdepth is an easy measurement ofwater transparency.
stratified Divided into layers. In stratifiedwater bodies, there may bemixing within a layer but littlemixing occurs between layers.Layers have different densities,which may be determined eitherby temperature and/or salinity.
thermocline The layer of water in a waterbody between the epilimnionand hypolimnion in which thetemperature gradient is greatestand exceeds a change of1 8C m21 of depth.
trophic state The degree of fertility of a lake.See also eutrophic, meso-trophic, and oligotrophic.
zooplankton The animal portion of theplankton.
9.08.1 INTRODUCTION
9.08.1.1 Aspects of Worldwide Concern overEutrophication
Eutrophication is the nutrient enrichment ofwaters that stimulates an array of symptomaticchanges, that can include increased phytoplanktonand rooted aquatic plant (macrophyte) production,fisheries and water quality deterioration, and otherundesirable changes that interfere with water uses(Bartsch, 1972). The trophic state, or degree offertility, of water bodies ranges from oligotrophicto mesotrophic to eutrophic with increasingsupply of nutrients and organic matter (Table 1).Eutrophication is most often the result of anelevated supply of nutrients, particularly nitrogenand phosphorus, to surface waters that resultsin enhanced production of primary producers,particularly phytoplankton and aquatic plants.Phytoplankton are unpleasant at high densities.
The sight and smell of clots or masses of decayingphytoplankton decreases the recreational value ofmost waters and usually generates concernsamong the public. Furthermore, blooms of toxin-producing phytoplankton can cause widespreadillness. A bloom is a conspicuous concentrationof phytoplankton, often concentrated at or near
Table 1 Mean annual values for the trophic classification system.
Total phosphorus(mg L21)
Chlorophyll a(mg L21)
Secchi disk depth(m)
Ultra-oligotrophic ,4 ,1 .12Oligotrophic ,10 ,2.5 .6Mesotrophic 10–35 2.5–8 6–3Eutrophic 35–100 8–25 3–1.5Hypertrophic .100 .25 ,1.5
Source: OECD (1982).
Worldwide Eutrophication of Water Bodies312
the surface. It is difficult to quantify whatconstitutes a “bloom,” but a rough estimateplaces it as a chlorophyll a concentration over30 mg L21. Toxins produced by dinoflagellatessuch as Pfiesteria in marine environments ofthe northeastern US and red tides in tropicalwaters have caused massive fish kills, millions ofdollars in losses to seafood-related industries,human memory loss, paralysis, and even death(Van den Hoeck et al., 1995; Silbergeld et al.,2000). Bloom-forming species of cyanobacteriacan produce potent hepato-(liver) toxins termedmicrocystins that have been implicated in poison-ings of domestic livestock, pets, wildlife, andsusceptible humans (Codd, 1995; Dunn, 1996). Inaddition, an accumulation of dead phytoplanktonin bottom waters of eutrophic systems can lead tohigh decomposition rates by bacteria. Dissolvedoxygen consumption by decomposers, combinedwith a barrier to gas exchange (thermocline orice cover), can reduce (hypoxia) or eliminate(anoxia) dissolved oxygen in bottom waters.(A thermocline is the junction between an upperlayer of warm, less dense water (the epilimnion)and a deeper layer of cold water (the hypo-limnion). When this stratification is in place, thetypically oxygen-rich waters of the epilimnion donot mix with the waters of the hypolimnion.)Oxygen depletion is one of the most harmful sideeffects of eutrophication because it can causecatastrophic fish kills, devastating local fisheries.The accumulation of plant biomass depends on
the addition of factors that stimulate plant growth.On average, the macronutrients nitrogen andphosphorus are present in marine phytoplanktonat an atomic ratio 16 : 1 (Redfield, 1958). The ratioof nitrogen to phosphorus in freshwaters tends tobe greater than the ratio in phytoplankton; there-fore, phosphorus most often limits the growth ofphytoplankton. As a result, phosphorus enrich-ment of freshwater often causes its eutrophication(Schindler, 1977). In lakes, nitrogen is usuallypresent in concentrations equal to or beyond whatis required for aquatic plant growth because,unlike phosphorus, it has an atmospheric source.In marine systems, nitrogen concentrations areoften limiting because bacterial nitrogen fixation,while a considerable source of nitrogen in lakes,not as important in marine waters. A wide varietyof prokaryotic organisms (i.e., certain cyano-bacteria, heterotrophic, and chemoautotrophicbacteria) can use nitrogen gas directly andincorporate it into organic compounds through aprocess called nitrogen fixation. Nitrogen fixationis an enzyme-catalyzed process that reducesnitrogen gas (N2) to ammonia (NH3). Nitrogen-fixing cyanobacteria make up less than 1% of thetotal biomass of phytoplankton in estuaries of theAtlantic coast of North America, whereas inlakes they often make up more than 50% of
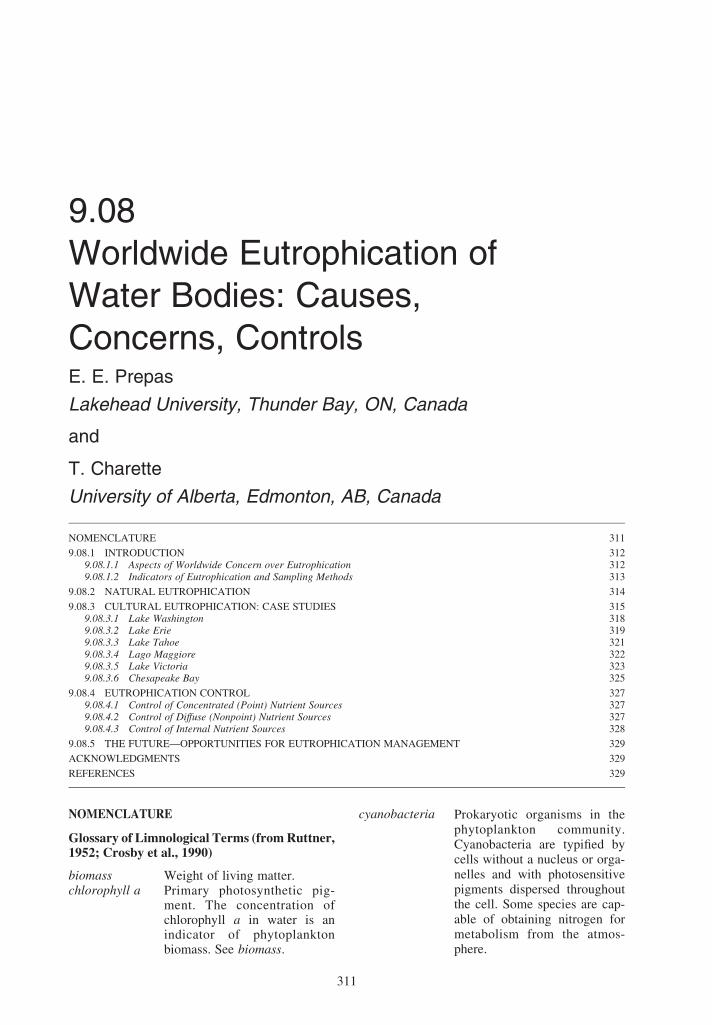
phytoplankton biomass (reviewed in Howarth,1988). An increase in water clarity can also spurthe growth of aquatic vegetation in systems wherethe clarity of water is poor from high concen-trations of suspended particles.The biodiversity of most aquatic systems
decreases with eutrophication (Figure 1). Phyto-plankton species diversity is reduced in highlyproductive systems. Cyanobacteria are usuallydominant in eutrophic systems because theseorganisms are better adapted to conditions ofhigh nutrients (Smith, 1986; Trimbee and Prepas,1987; Watson et al., 1997). In addition, fish andmacro-invertebrate species diversity can decreasewith eutrophication. Depletion of dissolvedoxygen in deep water is associated with eutro-phication and can lead to a loss or displacement ofspecies intolerant of such conditions (Ludsin et al.,2001). In eutrophic lakes of North America, chara-cteristic fish types are surface-dwelling, warmwater fishes such as pike, perch, and bass, ascompared to deep-dwelling, cold-water fishes likesalmon, trout, and cisco (Ryding and Rast, 1989).
9.08.1.2 Indicators of Eutrophication andSampling Methods
Trophic state can be measured directly viaindicators of phytoplankton biomass and nutrientconcentrations or indirectly by measuring watertransparency (Table 1).Water transparency can bean accurate indicator of phytoplankton pro-ductivity, even though it is affected by nonbio-logical particles suspended in the water column.Secchi disk depth is the oldest, simplest, andquickest quantitative measure of water clarity. ASecchi disk is a black and white disk that is
Figure 1 Suggested changes in various characteristicsof lakes with eutrophication (reproduced by permissionof Cambridge University Press from Ecological Effects
of Waste Water, 1980).
Introduction 313

lowered down through the water column until itcan no longer be seen. Secchi disk depth is themidpoint between the depth at which it disappearswhen lowered and reappears when it is pulled upagain. A more objective method of measuringtransparency is with a light meter, generally anupward-directed quantum sensor that determinesthe intensity of light (often measured inmE m22 s21). A light meter can be used tomeasure the euphotic zone, or the portion of thewater column receiving over 1% surface irradia-tion. In the euphotic zone, net photosynthesistakes place and phytoplankton and rooted aquaticplants (macrophytes) can grow. A third approachto determine water transparency involves measur-ing turbidity in water samples. Turbidity is ameasure of the scattering of light caused bysuspended particles (e.g., mud, silt, and phyto-plankton) in the water column and is recorded instandard international Nephelometric TurbidityUnits (NTU). Water transparency is a goodindicator of eutrophication and can easilybe measured by members of the general public.Because eutrophication is associated with high
phytoplankton numbers, the biomass of theseorganisms is a useful indicator of trophic state.A good descriptive measure of eutrophication andthe general state of water is the presence ofphytoplankton blooms. Phytoplankton blooms cancause visible coloration of surface waters or densemats and clumps, usually accompanied by anunpleasant rotting smell. Cyanobacteria are thedominant type of phytoplankton in most fresh-water blooms (Crosby et al., 1990). Many speciesof cyanobacteria contain gas vacuoles in theircells that make them buoyant. As such, in highlyeutrophic lakes, cyanobacterial mats and clumpscan form and be transported by wind into foulsmelling, decaying masses around the perimeterof a lake. In the sea, blooms are caused by speciesof nonbacterial forms of phytoplankton (e.g.,dinoflagellates, haptophytes). An effective indi-cator of changes in phytoplankton biomass, andthe most widely used, is the concentration ofchlorophyll a, the primary photosynthetic pigmentin all phytoplankton. Chlorophyll a is measuredby filtering water, extracting chlorophyll fromphytoplankton cells captured on a fine filter andmeasuring the color density of the extract withspectrophotometry.Because an increased supply of nitrogen in
marine waters and/or phosphorus in freshwatersis typically responsible for eutrophication,directly measuring the concentration of thesenutrients can indicate trophic state. Nutrients inwater are either dissolved or bound to particulatesproduced in situ and deposited into water bodiesfrom groundwater, atmospheric deposition, anddrainage basin runoff. To measure trophic state,nutrient concentrations are measured in samples
taken from a water body when surface waternutrient concentrations are at their maximumafter replenishment from bottom waters.Sampling is carried out during spring overturn(i.e., complete mixing of the water column)where nutrient concentrations in surface watersvary seasonally (i.e., systems with alternatingthermal stratification and overturn with theseasons). In systems with less routine thermaldynamics (i.e., those with multiple breakdown ofthermal stratification), additional sampling maybe required to take account of changes in nutrientconcentrations from multiple mixing events.Nutrient concentrations in surface water arerelatively low (i.e., often few ppb) and aremeasured in raw water samples. The principalmethod of determining the total concentration ofphosphorus and nitrogen in a water sample is bydigestion or oxidation of organic matter to releasebio-available inorganic nutrients (phosphate,nitrate, and ammonium). The addition ofa mixed reagent creates color and its densityis measured with spectrophotometry (Prepasand Rigler, 1982; Crumpton et al., 1992).
9.08.2 NATURAL EUTROPHICATION
Because of the high retention of nutrients inmost undisturbed land, very few aquatic systemsare naturally eutrophic.However, nutrient loading,and thus trophic state, is influenced first by naturalprocesses. Nutrient composition of soil and itsexposure to draining water are important determi-nants of the chemistry of water exported from thedrainage basin. Soil fertility is related to thechemistry of its parent rock material. Soils that lieon sedimentary rock tend to be more fertile thansoils on hard igneous rock. For example, theclassic prairie soils, famous for the production ofcorn, are of sedimentary origin (Jenny, 1980).Lakes on igneous geology can be naturally morenutrient-poor than lakes on sedimentary geology(Rawson, 1960). Further, there is more potentialfor leaching or biological decay of soils indrainage basins with longer exposure to water.Therefore, drainage basins that are relatively flat(i.e., low slopes), and those that are located inareas of low precipitation, are more likely toexport water with high nutrient concentrations(D’Arcy and Carignan, 1997). Water bodies areclosely linked to the characteristics of theirdrainage basins.The drainage ratio (“surface area of drainage
basin” to “water body”) can represent thecontribution of the drainage basin to the nutrientbudget of receiving waters, relative to theatmosphere. The nutrient budget of a water bodywith a relatively small drainage ratio will becontrolled primarily by atmospheric nutrient
Worldwide Eutrophication of Water Bodies314

inputs because drainage basin contributions arerelatively minor. The relative drainage basin size(“surface area of drainage basin” to “water bodyvolume”) can indicate how long it takes for theentire volume of water (and nutrients) in a waterbody to be flushed out of a system. Rapidlyflushed systems with large relative drainagebasins, such as streams, are more closely con-nected to their drainage basin than those that areflushed slowly, such as large lakes (Søballe andKimmel, 1987). A large relative drainage basin,all else being equal, is typically associated withhigher nutrient content in surface waters, becausenutrient inputs per unit of time are greater. Withinone geological setting, the relative drainage basinsize of water bodies can account for most of thevariability in phosphorus concentrations andphytoplankton biomass in aquatic systems(D’Arcy and Carignan, 1997; Prepas et al.,2001b). The quantity of water and nutrientsexported from a drainage basin also depends onevapotranspiration. Studies comparing drainagebasins that vary in forest composition indicate thatthe quantity of water exported is a function of theeffect of vegetation differences on transpirationrate (Bosch and Hewlett, 1982). Therefore, theamount (e.g., Hobbie and Likens, 1973) and type(e.g., Cronan and Aiken, 1985) of vegetation, inaddition to relative drainage basin size, caninfluence water and nutrient export to waterbodies.Summer phosphorus concentrations in nutrient-
rich water bodies can often depend on in siturather than external loading. Internal phosphorusloading, or the recycling of phosphorus frombottom sediments, usually occurs and/or isenhanced after a long history of eutrophicationand phosphorus enrichment of sediments due tohigh rates of organic sedimentation. In culturallyeutrophic systems with a long history of externalphosphorus enrichment, recovery can be delayeddue to the release of biologically availablephosphorus from bottom sediments. Sedimentphosphorus release is regulated by the intensityof oxidizing or reducing conditions within anaquatic system as measured by the reduction–oxidation, or redox, potential.A reducing environ-ment produced by the oxidation of sedimentorganic matter during bacterial decompositioncauses dissolution of FeOOHPO4 complexes andrelease of highly mobile and bio-available PO4
32.In productive systems, anoxic conditions candevelop at the sediment–water interface after anextended period of thermal stratification thatprevents atmospheric oxygen from reachingdeeper waters. Oxygen depletion, and thereforeinternal loading, is most likely in relativelyshallow lakes, because the hypolimnion (i.e.,deep layer of cold water), no matter how transient,has a reduced water volume and thus dissolved
oxygen pool. In shallow and fertile systems,external loading can be insignificant comparedto internal loading on an annual basis (Riley andPrepas, 1984). All else being equal, most lakesbecome shallower over a long timescale throughaccumulation of bottom sediments from particlesthat have settled from the water column. There-fore, lakes tend to evolve towards eutrophy(Hutchinson, 1973).
9.08.3 CULTURAL EUTROPHICATION:CASE STUDIES
Water pollution shadows human populationgrowth and development and is caused bydiffuse (nonpoint) and concentrated (point)nutrient enrichment. Some of the most severecases of anthropogenic eutrophication occurredsoon after the Second World War, when rapidpopulation growth and development followed.At that time, population growth and theconcentration of nutrient-rich sewage enhancedthe point-source nutrient loading. Deforestation,or clearing of native vegetation, is one of themost basic human alterations of the environmentand can be an early and important nonpointsource of eutrophication. With the removal ofactively transpiring vegetation, an excess ofwater in the ground is available for soil weath-ering (Roby and Azuma, 1995). Therefore,vegetation removal can increase the transfer ofnutrients from the drainage basin to receivingwaters. The largest improvements in waterquality have often been associated withreduction or elimination of point-source inputs.Not surprisingly, the most important challengesfor the future preservation of water quality lie incontrolling nonpoint nutrient sources fromintense activity such as agriculture and associa-ted use of fertilizer, concentration of animalwastes, and vehicle emissions. Drainage basinswith intensive agriculture can export five ormore times the phosphorus and nitrogen offorested drainage basins (Dillon and Kirchner,1975). Although eutrophication abatement hasfocused on enhanced nitrogen and phosphoruscontent of drainage basin runoff, concern overatmospheric nitrogen pollution has developedwith increasing industrialization. Our casestudies take us from the west coast of NorthAmerica (Lake Tahoe and Lake Washington)across to Lake Erie and then to Chesapeake Bayon the east coast. Two further examples comefrom southern Europe (Lago Maggiore) andAfrica (Lake Victoria; Figures 2 and 3). Thesesix case studies highlight varying degrees ofeutrophication and restoration of systemsimpacted by numerous sources of nitrogen andphosphorus pollution (Table 2).
Cultural Eutrophication: Case Studies 315

Figure 2 (a) Lake Erie, (b) Lake Washington, and (c) Chesapeake Bay ((a) reproduced by permission of NationalResearch Council Canada from J. Fish. Res. Board Can., 1976, 33, 355–370; (b) reproduced by permission of TheAmerican Society of Limnology and Oceanography, from Limnol. Oceanogr., 1991, 36, 1031–1044; and(c) reproduced by permission of Inter-Research Science Publishers fromMar. Ecol. Prog. Ser., 1994, 104, 267–291).
Worldwide Eutrophication of Water Bodies316

Figure 3 (a) Lago Maggiore, (b) Lake Tahoe, and (c) Lake Victoria and their drainage basins ((a) reproduced bypermission of Istituto Italiano di Idrobiologia from Mem. Ist. Ital. Idrobiol., 1995, 53, 53–73; (b) reproducedby permission of E. Schweizerbart Science Publishers from Arch.Hydrobiol., 1995, 135, 1–21; and (c) reproduced by
permission of Elsevier from J. Environ. Manage., 2000, 58, 235–248).
Cultural Eutrophication: Case Studies 317

9.08.3.1 Lake Washington
Lake Washington (87.6 km2; Figure 2) is arelatively deep lake (maximum depth 65.2 m) inWashington State, USA, with one of the finesthistories of limnological observations due to thelifelong dedication of the late W. T. Edmondson.Classified as mesotrophic (water with moderatesupply of nutrients and organic production) inrecent history (Scheffer and Robinson, 1939),Lake Washington was used as a source of drinkingwater for some small communities until 1965. Atthat time, total and bio-available (soluble reactive)phosphorus concentrations were relatively low(16 mg L21 and 8 mg L21 (ppb), respectively), andthere was no record of nuisance phytoplanktonblooms.Pollution was associated with water effluent
from the city of Seattle. By 1963, water quality inLake Washington was the poorest on record. Atthat point, sewage accounted for ,65% of allphosphorus inputs into Lake Washington(Edmondson, 1975). The average annual total
phosphorus and winter phosphate concentrationspeaked at 3 and 5 times, respectively, that in 1933(Figure 4). Summer phytoplankton biomass(estimated as chlorophyll a) was over 10 timeshigher in 1963 than only 13 years earlier andSecchidisk depth dropped from 3.7 m to less than 1 mover the same time span (Figure 4). At the peak ofwater quality decline, as much as 98% of thevolume of phytoplankton was made up of cyano-bacteria, largely Oscillatoria species such asO. rubescens andO. agardhii, that are often presentin eutrophic systems (Edmondson, 1969).Public pressure to halt the severe deterioration
of Lake Washington resulted in action. Between1963 and 1968, sewage effluent from thetreatment plants was progressively diverted toPuget Sound (Figure 4). The first diversionremoved 28%of the effluent, stopping the eutrophi-cation process. Recovery was quick with a sharp(65%) decrease in phytoplankton biomass twoyears after the beginning of diversion (Figure 4).By the end of the diversion process, waterquality had returned to mesotrophic conditions
Table 2 Characteristics of, and lessons from, case studies.
Water body Characteristics
Lake Washington Point-source (wastewater) nutrient stress.Mitigated via diversion of nutrient source downstream and chance biological control
of phytoplankton.Rapid recovery.
Lake Erie Point (wastewater) and nonpoint (agriculture) source stresses.Multiple basins illustrate effects of morphometry, stratification, and flushing rates
on trophic status.Mitigated via legislated wastewater and laundry detergent nutrient targets.Partially recovered—depends on future nonpoint-source mitigation.
Lake Tahoe Atmospheric pollution stress.Low drainage ratio ¼ atmosphere important nitrogen source.Tertiary sewage treatment limited success because sensitivity to nitrogen rather
than phosphorus.Mitigation via nonpoint-source controls but atmospheric sources difficult tocontrol ¼ further degradation likely.
Lago Maggiore Point (wastewater þ polluted upstream lakes) and nonpoint (agriculture) sourcestresses.
Mitigated via wastewater treatment and recovery of upstream lakes.Partially recovered system.
Lake Victoria Nonpoint-source stresses: atmospheric and land use þ internal nutrient loadingcontrolled by wet–dry seasons.
Low drainage ratio and high basin evapotranspiration ¼ atmosphere importantnutrient source.
Further degradation likely because little mitigation.Chesapeake Bay Mostly nonpoint (agriculture), some point (wastewater) source stress.
Estuarine example where nitrogen-limitation important.Mitigation efforts via wastewater treatment (point source) þ wetland restoration to
serve as nutrient traps (nonpoint source).Early restoration phase.
Lessons Point sources are easy to control.Nonpoint sources are difficult to control because of diffuse nature.Internal loading is important long-term feedback mechanism.P problems associated with land use changes.N problems associated with atmospheric pollution.
Worldwide Eutrophication of Water Bodies318

(chlorophyll a: 5–10 mg L21, Secchi disk depth:2–2.5 m, total phosphorus: 20–30 mg L21).Recovery continued. By 1975, transparencyincreased to 4 m and total phosphorus andchlorophyll a concentrations decreased to16 mg L21and 4 mg L21, respectively, similar toconditions in 1933.Thus, deterioration in thewaterquality of Lake Washington was reversible.Biological regulation of phytoplankton biomass
greatly improved water quality in LakeWashington. The appearance of the aggressivephytoplankton grazer, the microcrustaceanDaphnia spp., coincided with an increase in watertransparency to as much as 12.9 m by 1976.
Daphnia appeared after the decline of inediblecyanobacteria (Oscillatoria spp.), and thriveddue to a sustained 10% decrease in its voraciouspredator Neomysis mercedis in 1965. Thedecrease in Neomysis occurred at about the sametime as the introduction of longfin smelt, apredator known to specialize in eating Neomysis(Edmondson, 1994). Helped by a rapid flushingrate (2.3 yr) and stable dissolved phosphorusinputs since the end of sewage diversion(Edmondson, 1994), Lake Washington remainsmesotrophic.
9.08.3.2 Lake Erie
Lake Erie offers one of the best-publicizedexamples of the serious impacts of humans onwater quality as well as a model of ecosystemrehabilitation, thanks to international cooperation.Of the five North American Great Lakes, LakeErie was the most seriously impacted by culturalnutrient enrichment. Lake Erie is thought to benaturally more eutrophic than the other GreatLakes because of its shallower depth and thegreater erodibility of nutrient-rich soils in itsimmediate drainage basin (i.e., excludingupstream Great Lakes). Lake Erie can be dividedinto three basins (Figure 2), distinguished by meandepth, that have distinct morphometric and trophiccharacteristics. The western basin (3,080 km2)is the shallowest (mean depth 7.6 m), and mostnutrient- and plankton-rich of the Lake Eriebasins. The water column mixes completelythroughout most of the year with brief andunpredictable periods of thermal stratificationbetween May and September. The westernbasin is eutrophic, because it is shallower (seeSection 9.08.2: Natural Eutrophication), andreceives the largest external nutrient loads. Thecentral basin, largest of the three in area(16,425 km2) and volume has a mean depth of18.6 m. Here, thermal stratification is establishedyearly between June and September, causingbottom waters to become hypoxic by late summer.The eastern basin (area 6,159 km2) is by far thedeepest of the three (mean depth 26 m). Thermalstratification is strongest in this basin and persistsfrom June to late October or early November. Theeastern basin is considered oligotrophic, andtherefore the thick hypolimnion (bottom layer ofcold water) experiences only small reductions indissolved oxygen concentrations (Bartish, 1987).Thus, Lake Erie displays a longitudinal gradientin trophic status; from eutrophic waters in thewestern basin to progressively diluted and oligo-trophic waters in the outflowing eastern basin.Because most of the immediate drainage basin
is composed of highly erodible sedimentary soils,it is believed that the eutrophication of Lake Erie
Figure 4 Changes in Lake Washington water qualityin relation to sewage diversion. (a)Mean (July–August)lake surface (epilimnetic) chlorophyll a concentration.(b)Mean (July–August) Secchi disk depth. The verticallines show the range. (c) Bars ¼ annual mean of totalphosphorus in the epilimnion. Circles ¼ mean(January–March) bio-available phosphorus (phosphate)concentrations in the epilimnion. (d) Relative amount ofsewage as indicated by the capacity of the treatmentplants emptying into the lake, maximum taken as 100%(reproduced by permission of American Societyof Limnology and Oceanography from Nutrients and
Eutrophication, 1972, pp. 172–193).
Cultural Eutrophication: Case Studies 319

began with land clearing associatedwith Europeansettlement. Phosphorus loading increased slowlyafter forest removal in the drainage basin in the latenineteenth century, then increased exponentiallyover three decades up to the early 1970s (Snell,1987). At that time, the western basin was highlyeutrophic, the eastern basin was mesotrophic, andthe central basin was meso- to eutrophic(M. Munawar and I. F. Munawar, 1976). WhenLake Erie was in its worst state, total phosphorusload was estimated at 1.2 £ 104 t yr21, four timeshigher than precolonization values (Vallentyneand Thomas, 1978). Parallel to the increasing load,phosphorus concentrations increased fivefold inthe central basin, to ,25 mg L21. By the early
1960s, cyanobacterial blooms appeared in LakeErie and phytoplankton abundance tripled frommeasurements taken 40 years earlier (Figure 5;Davis, 1964). The western basin and parts of thecentral basin developed dense mats of the cyano-bacterium Aphanizomenon flos-aquae (Beeton,1965). Furthermore, dissolved oxygen depletionrates in bottom waters increased (Figure 5) andextensive hypoxia developed: dissolved oxygenconcentrations were low (3 mg L21 (ppm) or less)in ,70% of the bottom waters of the central basinduring late summer (Beeton, 1963).Major changesalso occurred in the bottom fauna of the westernbasin; the benthic community dominated by theburrowing mayfly (Hexagenia spp.) was replaced
3.8
3.0
2.2
1.0
(a)
25
20
15
10
5
01920 1930 1940 1950
Time (yr)
1960 1970
(b)
Oxy
gen
depl
etio
nra
te(m
gL
–1m
onth
–1)
Phyt
opla
nkto
nab
unda
nce
(102
cells
mL
–1)
Figure 5 (a) Mean depletion rates for dissolved oxygen during summer in the bottom-water (hypolimnion) ofcentral Lake Erie (reproduced by permission of National Research Council Canada from J. Fish. Res. Board Can.,1976, 33, 355–370). (b)Mean phytoplankton abundance in Lake Erie from 1920 to 1963 (reproduced by permission
of American Society of Limnology and Oceanography from Limnol. Oceanogr., 1964, 9, 275–283).
Worldwide Eutrophication of Water Bodies320

almost entirely by one dominated by midgelarvae (chironomids) and oligochaetes tolerant oflow-oxygen conditions. Hexagenia spp. disap-peared shortly after two periods of anoxia in theearly 1950s (Beeton, 1961). Furthermore, the fishfauna changed from natural cold-water fish popu-lations (whitefish, sauger, cisco, blue-pike, andlake trout) to domination by warm-water species(yellow perch, smelt, fresh-water drum,white bass,carp, catfish, and walleye) characteristic ofeutrophic lakes.Due to the severity of eutrophication and
extensive hypoxic conditions, programs weredeveloped in the early 1970s to reduce phosphorusloads into the Great Lakes as part of the GreatLakes Water Quality agreement between Canadaand the United States. The agreement required thatphosphorus concentration of sewage effluent fromall large municipal waste treatment plants belimited to 1 mg L21. A total of 7.5 billion dollarswas spent on municipal waste facility enhance-ment. Total phosphorus loads from direct munici-pal discharges were reduced by more than 80% bythemid-1980s.Much of this reduction was a resultof phosphorus restrictions in detergents; up to50% of phosphorus in sewage originated fromlaundry detergents. The Lake Erie ecosystemresponded quickly to these management efforts.Total phosphorus concentrations in the westernbasin had decreased by 50% only a decade afterthe Great Lakes Water Quality Agreement (Rosa,1987). Over two decades after the Agreement, therate of decline in total phosphorus concentrationswas ,0.44 mg L21 yr21 (Rosa, 1987; Bertram,1993). During the same time period, totalphytoplankton and cyanobacterial (i.e., Aphanizo-menon flos-aquae) biomass decreased by about65% and 89%, respectively (Makarewicz andBertram, 1991), and mesotrophic phyto-plankton species common before eutrophication(A. formosa) reappeared (Makarewicz, 1993).During that time, there was also a slight decreasein dissolved oxygen depletion rates in the deeperwater (Bertram, 1993). Six fish species tolerant ofhypoxic conditions declined in abundance andthree species intolerant of degraded water qualityrecovered (Ludsin et al., 2001).Despite the dramatic recovery of Lake Erie
through point-source reductions, the lake remainsenriched in phosphorus. Over half of the externalload of total phosphorus to Lake Erie is fromtributaries draining cultivated land. Therefore,attainment of the desired total phosphorus loadwill depend on further nonpoint-source controls(Dolan, 1993). Lake Erie must be monitoredregularly because of its dynamic nature due toheavy use as an international shipping route.Following its introduction to the Great Lakesabout 20 years ago and prolific expansion, thezebra mussel (Dreissena spp.) has been partly
responsible for tremendous improvements inwater clarity in recent years (Makarewicz et al.,1999). The Lake Erie restoration story continuesto unfold.
9.08.3.3 Lake Tahoe
With its enchanting emerald green waters, LakeTahoe lies on the border of the American states ofNevada and California, in the Sierra—Nevadamountain range (elevation 1,898 m; Figure 3).Because of its stunning mountainous setting andits naturally clear waters (Secchi disk depth 41 min 1972), this large (500 km2) and deep (maximumdepth 505 m) lake has long been revered as one ofthe most beautiful water bodies in theworld, thanks in part to its limnological guardian,C. R. Goldman. Naturally ultra-oligotrophic, LakeTahoe receives low nutrient loads from thedrainage basin. On an annual basis, phosphorusinputs to the lake are predominantly fromterrestrial sources, similar to Lake Washington.In contrast, atmospheric sources of nitrogen,mostly nitrate, are more significant than drainagebasin inputs because of Lake Tahoe’s smalldrainage ratio (1.6; Figure 3). Due to the relativepaucity of nitrogen, however, phytoplanktonbiomass in Lake Tahoe has been controlled,until recently, by the limited availability ofammonium and nitrate (Goldman et al., 1993).Because of human influences, nitrogen inputs to
Lake Tahoe have steadily increased and havefueled a noticeable growth in phytoplanktonbiomass. Limnological changes started to occurby the middle of the nineteenth century, when thebasin was logged to provide timber for miningoperations (Jassby et al., 2001). Lake Tahoe hasalso seen a tremendous population growth anddrainage basin development since the 1950s (as ofearly 2000s: a resident population of 52,000; onemillion visitors yearly). Shoreline developmentproceeded with little consideration for runoff anderosion control. To complicate matters, LakeTahoe’s drainage basin has steep slopes thatproduce high-energy runoff. Therefore, nutrientsleached from destabilized and eroding soil on thelakeshore have become a major source of nitrogento the lake. However, atmospheric depositionprovides most of the nitrogen load to Lake Tahoeand this has been increasing steadily due to localcombustion of fossil fuels for transportation andheat, and upwind human development (cities ofLos Angeles and San Francisco; Jassby et al.,1994; Goldman, 1993). Phytoplankton are quiteresponsive to atmospheric loads of nitrogen,because they are depositedmostly in bio-availableform (i.e., nitrate and ammonium). Conversely,total nitrogen from drainage basins contains agreater fraction of organic nitrogen, much ofwhich is resistant to rapid bacterial degradation to
Cultural Eutrophication: Case Studies 321

bio-available forms (Kalff, 2002). As a result ofincreased deposition of atmospheric nitrogen, therate of phytoplankton production (primary pro-ductivity) has more than quadrupled and Secchidisk depth has decreased ,30% since the late1960s (Figure 6). With the increase in nitrogenrelative to phosphorus loads, phytoplanktongrowth in Lake Tahoe has gone from limitationlargely by nitrogen to strong phosphorus-limitation (Jassby et al., 1995). Despite culturaleutrophication, Lake Tahoe remains ultra-oligotrophic (Secchi disk depth 25 m; Goldmanet al., 1993). However, because water and nutrientflushing times are long (650 yr), prevention ofadditional fertilization of Lake Tahoe is crucial.Reduction of within-basin nutrient sources(e.g., Best Management Practices (BMPs); seeSection 9.08.4.2) has been the focus of waterquality management. However, the fate of LakeTahoe appears dim at this moment becauseatmospheric nutrient sources are variable; theydepend on large-scale wind patterns and aredifficult to control.
9.08.3.4 Lago Maggiore
Lago Maggiore is located in the foothills of theAlps, just north of the most industrialized part of
Italy (Figure 3). With the CNR—Institute ofEcosystem Study (ISE) on its shore, LagoMaggiore has the privilege of being the mostthoroughly investigated lake in Italy, both in termsof the number of key biogeochemical parametersmeasured and the duration of their monitoring.Lago Maggiore is deep (maximum depth 370 m)and only the top 100–150 m of its water columncirculates once each year. However, the lakemixes completely over a varying number of years,the mixing being connected with very coldautumns and winters, and with windy periodsduring March and April, when thermal stratifica-tion is weaker (Ambrosetti and Barbanti, 1999).Before major eutrophication began, the lake wasoligotrophic (spring total phosphorus concen-trations below 10 mg L21, Secchi disk depth10.7 m), and the growth of phytoplankton waslimited by the availability of phosphorus (Moselloand Ruggiu, 1985).Like many lakes around the world, Lago
Maggiore was rapidly eutrophied during the1960s causing a shift in trophic state fromoligotrophic to mesotrophic a decade later. Duringthis period, bio-available (soluble reactive) phos-phorus concentrations tripled and nitrate concen-trations doubled in surfacewaters and stabilized insubsequent years (Figure 7; Ambrosetti et al.,1992; Ruggiu and Mosello, 1984). As agriculture
200
160
120
80
40
20
40
20
1958 1966 1974 1982 1990 1998
Time (yr)
Secc
hide
pth
(m)
Prim
ary
prod
uctiv
ity(g
cm–2
yr–1
)
Figure 6 Mean annual primary productivity and mean monthly Secchi disk depth over time in Lake Tahoe(reproduced by permission of Backhuys Publishers from The Great Lakes of the World (GLOW): Food-web, Health
and Integrity, 2001, pp. 431–454).
Worldwide Eutrophication of Water Bodies322

in Lago Maggiore’s drainage basin is limited,urban sewage from a heavy population base(6.34 £ 105 current inhabitants in the drainagebasin) provides most of the phosphorus inputs tothe lake. Lake nitrogen concentrations seem to beclosely related to atmospheric inputs; just under80% of the nitrogen reaching Lago Maggiorecomes from the atmosphere through deposition(Mosello et al., 2001), mostly from the highlyindustrialized Po Plain situated upwind. Further-more, three of the biggest lakes draining into LagoMaggiore are highly eutrophic and are importantnutrient sources (Mosello and Ruggiu, 1985).Total phytoplankton biomass in Lago Maggioreincreased 2.5 times during the two decades afterthe 1950s (de Bernardi et al., 1988). Over thistime, cyanobacteria bloomed for the first time andbecame the dominant phytoplankton in LagoMaggiore (Manca et al., 1992).LagoMaggiore has been on the path of recovery
since the early 1980s,mostly through the reductionof phosphorus loads.Construction offive treatment
plants with a tertiary stage halved the phosphorusload from the shoreline. There has been a furtherreduction of phosphorus inputs from tributariesalong which treatment plants were constructed.Restoration efforts of eutrophic upstream lakes,especially Lago di Lugano, also helped therecovery of Lago Maggiore. Phosphorus loadswere also reduced by gradual reductions of thephosphorus content in detergents, from 8% before1982 to 1% a decade later. (Provini et al., 1992).Asa result of these point-source reductions, phos-phorus loads from the drainage basin decreased byhalf from the late 1970s to the late 1980s. Between1979 and 2000, mean annual total phosphorusconcentrations decreased fivefold to,6.5 mg L21,while total- and nitrate-nitrogen concentrationshave not changed much (Figure 7), probablybecause of substantial inputs from the atmos-phere (Manca et al., 1992; Istituto Italiano diIdrobiologia—CNR, 2001). In response to reducedphosphorus concentrations and because phyto-plankton growth was limited by phosphorus,water quality improved and phytoplankton biodi-versity increased (Manca et al., 1992).Less than 10years after the first bloom, cyanobacterial bloomswere no longer seen and the dominance of thisgroup had decreased.
9.08.3.5 Lake Victoria
Lake Victoria is located in eastern Africa’s riftvalley, shared by the countries of Kenya, Uganda,and Tanzania (Figure 3). This ancient lake is animportant ecological resource because of its richdiversity of endemic fish species. Due to itsimpressive size (with a surface area of6.88 £ 104 km2, it is the second largest freshwaterlake in the world after Lake Superior), LakeVictoria is also an important source of cheapprotein for millions of people that reside on itsshore. Furthermore, the lake regulates the activi-ties of human populations that live downstream inwater-scarce locations. Outflow occurs solelynorth into the White Nile, near Jinja, Uganda.The White Nile crosses into Sudan and links withthe Blue Nile in the capital of Khartoum to formthe main Nile flow through Egypt to theMediterranean Sea. Lake Victoria supplies 14%of the water passing through the Nile and thusinfluencesNile baseflow. The 1964 floods in Cairowere caused by high lake levels due to recordrainfalls (Yin and Nicholson, 1998). The waterbudget of Lake Victoria is controlled largely byevaporation and direct precipitation due to itssmall drainage ratio and because inputs fromtributaries (20% of total water entering the lake)approximately equal outflow over the long term.The contribution of the atmosphere to the nutrientbudget of semi-arid lakes is greater, in general,
Figure 7 Bio-available (W) and total (†) phosphorusand nitrate concentrations in Lago Maggiore between1956 and 1991. Mean volume weighted concentrationsmeasured at overturn (reproduced by permissionof Istituto Italiano di Idrobiologia from Mem. Ist.Ital. Idrobiol., 1992, 50, 171–200; R. Mosello,CNR—Institute of Ecosystem Study, Pallanza, Italy,
unpublished data from 1990 to 2000).
Cultural Eutrophication: Case Studies 323

than in temperate systems because of therelatively high evapotranspiration rates in theformer.Nutrients and biota in Lake Victoria are highly
dependent on the physical structure of the watercolumn, which is in turn dependent on seasonality.Seasons in the African Great Lakes region aremediated by the annual cycle of Indian monsoonwinds. There are two wet seasons: a longer andwetter rainy season occurs between March andMay and the short rainy season falls betweenOctober and December. The dry or windy seasonextends from June to September and is character-ized by a cooler climate with strong and persistentsoutherly winds. The thermocline is strongestduring the wet seasons and weakens during thedrier, windy season. During the windy season,heat loss through evaporation and turbulencecaused by the wind enhances mixing in thewater column. Thermocline depth increases sub-stantially during the windy season and completevertical mixing occurs (Ochumba, 1996). Duringthe rainy season of September toApril, runoff,wetdeposition of nutrients, and thus, phytoplanktonbiomass are at their yearly maxima. During thewindy season, the open offshore areas aremixed tothe bottom and the phytoplankton is pushed tolow-light depths, limiting their growth (Mugidde,1993). Therefore, changes in the phytoplanktonbiomass of Lake Victoria are determined byseasonality.Nutrients enter Lake Victoria mainly through
two diffuse pathways, or nonpoint sources: landrunoff and atmospheric deposition, togetheraccounting for ,90% of phosphorus and ,94%of nitrogen input into the lake. About one-third ofthe nitrogen inputs to Lake Victoria are fromatmospheric deposition and over half of thephosphorus comes from particles associated withrunoff from agricultural lands (Scheren et al.,2000). Nitrogen loading is dominated by biologi-cal fixation in Lake Victoria; the latter providestwo-thirds of the total nitrogen supply (Mugidde,2001). Water bodies in semi-arid climates likeLake Victoria are relatively more dependent onnutrient supply from the atmosphere than temper-ate systems. High evapotranspiration rates resultin relatively less water and nutrients released fromthe drainage basin, given the relative size of thedrainage basin. In addition, undisturbed tropicalsoils are high in iron and aluminum oxideconcentrations that tightly bind phosphorus, mak-ing the latter unavailable for dissolution in runoff.Through a process called podzolization, solubleorganic acids play an important role in removingiron and aluminum by chelation (Schlesinger,1997). However, organic decomposition at thefloor of tropical forests is so complete that nearlyno soluble organic acids percolate through the soilprofile, inhibiting podzolization. The growth of
phytoplankton biomass in the East African lakeappears to be nitrogen limited. Phytoplanktonbiomass in Lake Victoria increased only whennitrogen additions were made to the lake, eitheralone or in combination with phosphorus. How-ever, phosphorus additions alone produced nodetectable change in phytoplankton biomass(Lehman and Branstrator, 1994). The total nitro-gen to total phosphorus ratio (average of 13 : 1 byweight for 1990 and 1992 to 1996) is slightlylower in Lake Victoria water than the rationeeded for optimum phytoplankton growth(around 16 : 1), providing more evidence fornitrogen limitation of the growth of phytoplanktonbiomass (Guildford and Hecky, 2000).Thirty million inhabitants live in Lake
Victoria’s relatively small drainage basin(1.94 £ 105 km2), making it one of the mostdensely populated areas of Africa (,240 individ-uals km22). Rapid population growth (3% yr21) isadding to already intense environmental press-ures. Approximately half of the drainage basin iscultivated and in some areas, cattle densities are ashigh as human densities.Most (71%) of the energyconsumed in sub-Saharan Africa is in the form offuel wood due to the high poverty level of thepopulace and because wood gathering imposes nopersonal financial burden (Davidson, 1992).Therefore, most of the drainage basin has beencleared for rangeland, cultivation, and wood forhousehold burning.Our knowledge of the response of Lake Victoria
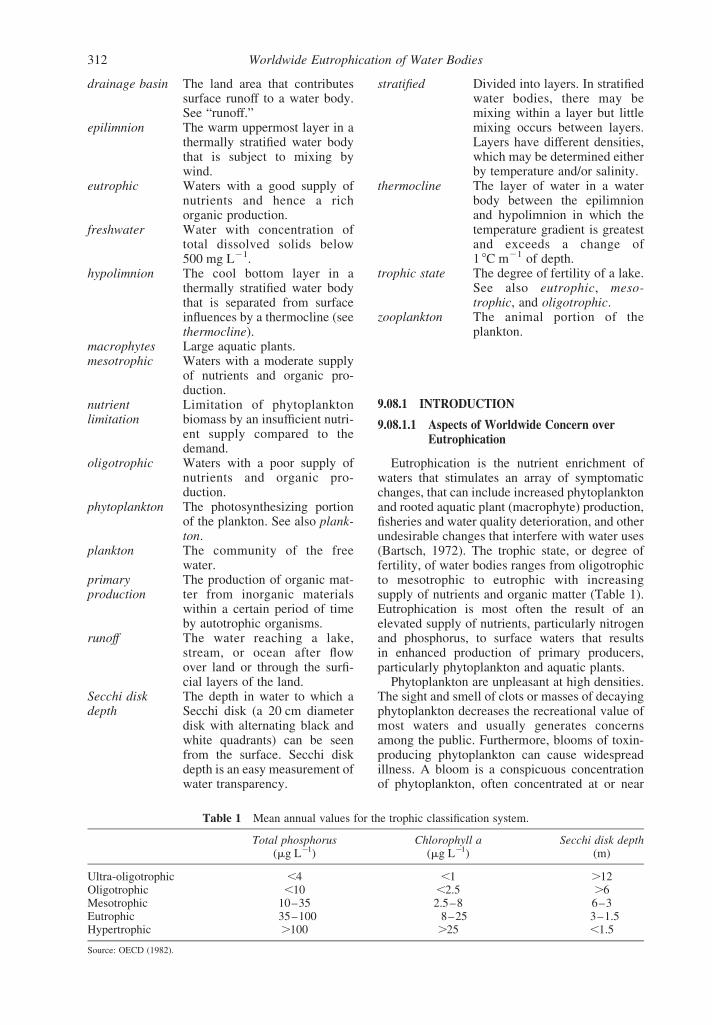
to local environmental degradation is based ondata from scattered sources: water qualitymeasurements from 1960 to 1961 (Talling andTalling, 1965) and the early 1990s (Mugidde,1993), and sedimentary studies of past aquaticconditions (Hecky, 1993). Due to a lack of long-term field measurements, knowledge of nutrientdynamics in tropical lakes is severely limited.However, Lake Victoria is one of a handful oftropical lakes with seasonal water quality data.Nitrogen and phosphorus deposition to LakeVictoria’s sediments increased at different times:nitrogen deposition increased early in the twen-tieth century until the 1960s when phosphorusdeposition began a rapid increase. Bio-availablephosphorus and the nitrogen concentrations of thelake water were consistently higher during therainy season in 1990–1991, compared to 1960–1961 (Figure 8). Recent increases in lake nutrientconcentrations may have been caused, in part, bygreater atmospheric loading as a result of woodburning and increased soil erosion. Soil disturb-ances from deforestation and agriculture are likelyto have reduced the soil retention capacity of thedrainage basin. In response to increased nutrientinputs to Lake Victoria, phytoplankton biomass(estimated as chlorophyll a) was over 10-foldhigher in 1990–1991, than in 1960–1961.
Worldwide Eutrophication of Water Bodies324
Furthermore, the phytoplankton community struc-ture has changed from a community dominated bydiatoms, to one dominated by eutrophic species ofcyanobacteria that produce substances toxic tohumans (Microcystis sp., Anabaena sp.).Due to anincrease in floating particles (e.g., phytoplankton)in the water column, water transparency and thesize of the zone in which photosynthesis mayoccur (photic zone) have decreased. Over a periodof 60 years, Secchi disk depth had dropped,70%by 1990–1991 (Mugidde, 1993) and the area ofthe lake floor within the photic zone has beenhalved (Hecky, 1993). Decomposition of organicmatter in the deep water has increased dissolvedoxygen consumption. As a result, dissolvedoxygen concentrations at lake depths of 40–60 m were consistently lower during the rainyseason in 1990–1991 than 30 years earlier(Figure 8). Lake hypoxia is now more frequent,more persistent, and affects a greater fraction ofLake Victoria’s bottom. Anoxia below a depth of45 m now affects up to 50% of the lake’s bottomarea for prolonged periods of time (Hecky, 1993).Tropical water bodies are especially susceptible todissolved oxygen depletion because of the inverserelationship between temperature and solubility ofoxygen in natural waters. As temperatureincreases, the saturation concentration of oxygenin water decreases and the metabolic rate ofdecomposers (i.e., oxygen-users) increases(Lewis, 1987). Massive fish kills have beenassociated with cyanobacterial blooms and the
mixing of anoxic waters from deep layers(Ochumba, 1987). Due to its large volume andrelatively small outflow, the water of LakeVictoria has a long flushing time (140 yr; Bootsmaand Hecky, 1993). Therefore, the recovery of thelake will be slow because pollutants are retainedfor a long time.
9.08.3.6 Chesapeake Bay
Chesapeake Bay (Figure 2) is the largest and,historically, the most productive estuary in thecontinental US, and it has been studied exten-sively for decades. Its drainage basin(165,760 km2) spans six states and is highlypopulated (15 million inhabitants). However,nutrient contributions from urban effluent arethought to be minor compared to the nonpointsource of heavy fertilization for agriculture.Agriculture accounts for about half of the totalnitrogen and phosphorus loads to the Bay(Magnien et al., 1995). Because of its shallowdepth (mean depth ,9 m), much of the estuary’sbottom historically received enough light tosupport submerged plant biomass. Yet, Chesa-peake Bay is deep enough to stratify strongly inthe summer.The growth of phytoplankton is typically
nitrogen-limited in the ocean due to enhancedsediment release of phosphorus relative to nitro-gen (Caraco et al., 1990), slow rates of nitrogenfixation (Howarth, 1988), and high rates of
Figure 8 Depth profile of O2, bio-available phosphorus (SRP), nitrate (NO3), and ammonium (NH4, 1990 only)concentrations in February 1961 and March 1990 during Lake Victoria stratification (reproduced by permission of
E. Schweizerbart Science Publishers from Verh. Int. Ver. Limnol., 1993, 25, 39–48).
Cultural Eutrophication: Case Studies 325

denitrification (bacterial conversion of nitrate tonitrogen gas; Seitzinger, 1988). In the ChesapeakeBay estuary, the growth of phytoplankton islimited by nitrogen or phosphorus, depending onthe season. Late winter/early spring is the periodof greatest flow in Chesapeake Bay and itstributaries. Runoff from the drainage basin, richin nitrate from fertilizer application, creates highnitrogen concentrations in Chesapeake Bay and itssub-estuaries. Therefore, the most severe phyto-plankton blooms occur in the late winter/earlyspring season. Owing to the wealth of nitrogen,the ratio of dissolved inorganic nitrogen tophosphorus concentrations in late winter can beas high as 90 : 1 by weight and phytoplanktonbecome phosphorus limited (D’Elia et al., 1986).During the summer, when drainage basin runoff isat its lowest, nitrate concentrations in ChesapeakeBay are low and sometimes undetectable (Maloneet al., 1988). However, phosphorus concentrationsincrease due to internal release from bottomsediments through bacterial decomposition andchemical diffusion to top layers. As a result,during the summer the nitrogen to phosphorusratio of Chesapeake Bay water can be as low as5 : 1 by weight, and nitrogen limits the growth ofphytoplankton (D’Elia et al., 1986).Eutrophication of Chesapeake Bay has been
occurring since Europeans began aggressivedeforestation of the drainage basin. By the endof the nineteenth century, 80% of the land wascleared, mostly for agriculture. Due to reducedtranspiration potential, water export from thedrainage basin increased during this time, result-ing in a gradual increase in nitrogen concen-trations in Chesapeake Bay. Total annual loadingof nitrogen and phosphorus, mostly from terres-trial sources, have increased 6- and 17-fold,respectively, since pre-European times (Boyntonet al., 1995). Consequently, the eutrophication ofChesapeake waters has been increasing; thecentric to pennate diatom ratio, a sedimentaryindicator of eutrophication, increased from 1.3before European settlement to 5.2 in recentsediments. Along with a doubling in humanpopulation and a tripling in inorganic fertilizeruse, phytoplankton biomass (estimated as chloro-phyll a) increased up to fivefold during the twodecades prior to the 1970s. Phytoplankton bio-mass has remained similar or slightly higher sincethen and phytoplankton blooms are now morefrequent and of longer duration (Harding, 1994).The neurotoxin-producing dinoflagellate Pfies-teria piscicida was first reported in the Bay inthe early 1990s (Lewitus et al., 1995) and wasresponsible for fish kills and impaired memorycapacity in fishermen and field workers thatsampled the estuary (Grattan et al., 1998). Also,diatom biodiversity decreased from 100 to 68species during the three decades before the early
1990s, a further indication of phytoplankton stressin the Bay (Cooper and Brush, 1991). ChesapeakeBay has a long history of eutrophication.Eutrophication in Chesapeake Bay has reduced
the habitats for fish, rooted aquatic plants, andbottom dwelling organisms. During blooms,phytoplankton not consumed by predators dieand settle to the bottom where they is decomposedby bacteria. In response to increased phyto-plankton production and sediment load from thedrainage basin, sedimentation rates in ChesapeakeBay have increased from 1.5- to sevenfold sincethe late eighteenth century (Cooper and Brush,1991). Anoxia associated with bacterial decompo-sition develops in the bottom layers of ChesapeakeBay, affecting many aquatic organisms (i.e., fishand bottom-dwellers such as oysters). The habitatof these organisms is reduced as they are forced tomove to oxic parts of the estuary bottom. Seasonalanoxia has intensified between 1950 and 1980time period and now occurs annually (Cooper andBrush, 1991; Malone et al., 1988).The distribution and abundance of submerged
aquatic vegetation in Chesapeake Bay hasdecreased since the 1960s. Severe changes beganwhen Tropical Storm Agnes (1972) caused adramatic increase in sediment loading from thedrainage basin to the estuary. Suspended sedimentparticles reduced water transparency and caused adrastic decrease in the distribution and abundanceof submerged plants. A decade later, the majortributaries of the Bay were barren. Sedimentaryanalysis of seeds and pollen from aquatic plants ofChesapeake Bay indicates that seeds were depos-ited to sediments from the eighteenth century to thetime of Tropical Storm Agnes; at that time theydisappeared abruptly from the record (Orth andMoore, 1983). Such a major decline in aquaticplants is unprecedented in the Chesapeake Bayestuary.Efforts to clean the Bay began when, in 1982,
1987, and 2000, the states covering most of thedrainage basin (Virginia, Maryland, and Pennsyl-vania), the District of Columbia, the ChesapeakeBay Commission, and the US EnvironmentalProtection Agency, signed agreements to protectand restore Chesapeake Bay’s ecosystem. Part ofthe 1987 agreement was a commitment to achievea 40% reduction in nitrogen and phosphorus loadsto the Bay by 2000, in comparison with 1985.Bio-available phosphorus concentrations haddecreased by at least half since the early 1970sdue to tertiary phosphorus treatment of sewageeffluent (Harding, 1994). The goals of the 2000Agreement will require even greater reductions inpoint-source nitrogen loading from wastewatertreatment facilities. Currently, 45% of the nitrogenflow from sewage treatment plants is treatedand by 2010, 79% is to be treated. In aneffort to reduce nonpoint-source nutrient loads,
Worldwide Eutrophication of Water Bodies326

2.5 £ 104 acres of tidal and nontidal wetlands areto be restored by 2010. Also, by 2012, the rate ofurban sprawl development of forest and agricul-tural land in the Chesapeake Bay drainage basin isto be reduced by 30% from the average over1992–1997. It is too early to determine the levelof success achieved by the efforts to clean upChesapeake Bay.
9.08.4 EUTROPHICATION CONTROL
Eutrophication control methods are time- andwatercourse-specific. To predict the success ofmethods under consideration, the predominantsources of nutrients must be identified and relatedto changes in water quality. Reduction of nutrientloads from point sources is often the simplestapproach when nutrient enhancement stems fromknown sources, such as sewage. Where drainagebasins were disturbed by forest harvesting, forestfires, road building, land development, agricul-ture, and urbanization, diffuse or nonpoint sourcesof nutrients may be the most important contribu-tors to aquatic eutrophication. In water bodies,where conditions are such that anoxic wateraccumulates over the bottom sediments, in situsources can provide most of the nutrients to theeuphotic zone, a process termed internal loading.In this case, the management of internal sourcesmay be necessary to complement external nutrientcontrol.
9.08.4.1 Control of Concentrated (Point)Nutrient Sources
Historically, the primary method to controleutrophication has involved reducing or elimina-ting point sources of nutrients, mostly sewagefrom urban areas. Diversion of point sources, suchas sewage effluent, downstream is a cost-effectivemethod of nutrient load reduction into lakes. Theoutstanding improvements in water quality inLake Washington encouraged other communitiesto consider this management solution. However,diversion is often not a practical managementsolution because it transfers the problem down-stream, rather than eliminating it. Advancedwastewater treatment is a more popular point-source management solution. The addition of atertiary stage of water treatment can precipitatephosphorus with aluminum sulfate (alum) orcalcium hydroxide (slaked lime). However, ter-tiary treatment entails high initial capital andoperational costs. It is therefore crucial to ensurethat the aquatic system considered for receipt oftertiary treated water will benefit significantlyfrom phosphorus removal. In Lake Tahoe, theinitial strategy to improve water quality was totreat sewage through tertiary phosphorus removal
and then to return the effluent to the lake.However, short-term bioassays indicated thatphytoplankton biomass was stimulated by nitro-gen, and not phosphorus. Thus, in Lake Tahoe, thenitrogen left in effluents after tertiary treatmentwould continue to enhance phytoplankton bio-mass (Goldman, 1993). In Shagawa Lake, Min-nesota, phosphorus was the primary factorcontrolling phytoplankton biomass and 80% ofthe phosphorus was derived from sewage. Anadvanced wastewater treatment plant was con-structed. This removed 99% of the phosphorusand within two years phytoplankton biomass(estimated as chlorophyll a) decreased and Secchidisk depth increased by 50% (Horne andGoldman, 1994). Another method of point-sourcenutrient removal that has proved effective is theconstruction of basins, or preimpoundments, thatretain nutrient-rich water for a short period oftime, allowing nitrogen- and phosphorus-bearingparticles to settle out of the water column prior toentering downstream waters.
9.08.4.2 Control of Diffuse (Nonpoint)Nutrient Sources
Diffuse or nonpoint nutrient sources are oftenmost important in drainage basins dominated byagricultural activity. In the USA, agriculture is themost important source of nutrients to lakes andrivers and the third largest source of nutrients afterurban runoff and municipal sewage to estuaries(Parry, 1998). Unfortunately, the control ofnutrients from nonpoint sources has proved mostdifficult. Control of runoff from nutrient-richsources often relies on a suite ofmethods, togethercalled “BMPs”. One or a combination of BMPsmay be needed for pollution reduction, theseinclude:
(i) Soil stabilization to minimize themovementof soils and attached nutrients. The addition ofchemical soil stabilizers such as high molecularweight anionic polyacrylamide can reduce soilloss ninefold and phosphorus loss five- to seven-fold (Lentz et al., 1998). Grassed outlets candecrease sediment suspension by running waterand reduce nutrient concentrations in solution.Revegetation can improve stabilization of soilsurfaces through root networks and increased soilcontent of heavy organics. Conservation tillagereduces the erosive energy of rainfall by leavingcrop residues at the land surface. Also, in somecases, buffer strips of vegetation left along theshoreline can absorb excess nutrients and waterbefore they escape from the drainage basin.Livestock exclusion from watercourses preventsbank erosion and direct nutrient inputs from feces.
(ii) Interruption of overland flow. Water treat-ment techniques such as the creation of artificial
Eutrophication Control 327

wetlands that collect water and remove nutrientsthrough aquatic plants. Basins can also be con-structed to collect runoffwater and allow settling ofsuspended sediment, often rich in phosphorus,before discharge downstream (Brown et al., 1981).Other examples include flow regulators such asenergy dissipators within culverts, reduced slopeangles, and soil roughening.
(iii) Changes in chemical application tech-niques to minimize excess nutrient availabilityand reduce export.A decrease in road salt usage ora change to calcium chloride usage can help topreserve roadside ditch vegetation (Goldman andLubnow, 1992). The use of pellet fertilizers, ratherthan granular and liquid fertilizers, can reduce theavailability of nutrients to weathering by releasingnutrients more slowly. Soil and manure testingshould be completed before application to deter-mine the need for fertilization. Ploughing manureinto the soil, and the proper timing of chemicalapplications, such as the application of fertilizerafter spring thaw instead of in the fall, can reducethe vulnerability of added nutrients to removal insurface runoff.Additions of slaked lime or alum tomanure can greatly reduce nitrate volatilizationand phosphorus solubility (Moore and Miller,1994).
(iv) Reduction of nutrients at their source.Genetic measures can be employed to increasephosphorus absorption capacity of livestock.Much of the phosphorus in corn grain is presentin the form of phytic acid, a phosphorus sourcethat is not digestible in monogastric animals andthus is often excreted in waste. Corn with reducedlevels of phytic acid can be isolated with chemicalmutant induction. Using this method, a 65%reduction in phytic acid has been recorded withno effect on total grain phosphorus content (Ertlet al., 1998). Also, intensive grazing by livestockcan reduce off-farm nutrient inputs because lessfeed is needed and imported. Nutrient inputs infeed and fertilizer exceed production outputs incrop and animal produce leaving the farm ordrainage basin.
9.08.4.3 Control of Internal Nutrient Sources
Reduction of the visible symptoms of eutrophi-cation (i.e., green scum) can be achieved byvarious methods. An indirect method that hasreceived considerable attention, although it is stillin the experimental phase, is biomanipulation orthe manipulation of aquatic food chains to reducephytoplankton biomass. The idea is to reducepredation on aquatic grazers such as largezooplankton, which feed on phytoplankton. Thismethod has proven successful in increasing watertransparency and dissolved oxygen concentrationsand reducing phytoplankton biomass (Shapiro and
Wright, 1984; Vighi et al., 1995). However,stabilization of nonequilibrium populations isdifficult and unpredictable over the long term(Kasprzak et al., 1993). Another method ofaquatic vegetation reduction involves mechanicalharvesting ofmacrophytes or surface blooms. Thismethod provides immediate relief from conditionsthat impair water recreation, but it requiresrepeated application, is costly, and often spreadsthe problem out over a larger area. Chemicalcontrol of phytoplankton blooms with algicides,such as copper sulfate, can also keep the biomassof phytoplankton at a minimum. However thismethod requires continuous applications; thesuppression effects are only temporary becausepreviously organic-bound phosphorus is released.Further, the use of herbicides such as coppersulfate raises concerns about their possibletoxicity to other biota. Complete mechanicalcirculation of the water column, achieved byvigorous mechanical aeration of deep waters, canreduce phytoplankton biomass by pushing thephytoplankton to greater depths, where light isinsufficient for their growth.Sediments can be an important source of
nutrients. The most popular method to preventphosphorus release from sediments is inactivation.Phosphorus inactivation involves chemical treat-ment of the water column with aluminumsulfate/sodium aluminate (alum) or lime toprecipitate phosphorus out of the water column.Once in the bottom sediments, the precipitate cancontinue to adsorb phosphorus and prevent itsrelease to the overlying water (Prepas et al.,2001a). Phosphorus inactivation can be highlyeffective: in a survey of treated American lakes,phosphorus loading from sediments was reducedby about two-thirds and treatments are expected tolast 10 years and 15 years for shallow (polymictic)and deep (dimictic) lakes, respectively, beforereapplication (Welch and Cooke, 1999).However,only relatively small lakes have potential forphosphorus inactivation because of the high costsof chemicals. Hypolimnetic oxygenation withoutdestratification can eliminate the reducingenvironment at the sediment–water interface anddiminish nutrient release from sediments. Hypo-limnetic oxygenation in Amisk Lake, Alberta,from 1988 to 1993 increased dissolved oxygenconcentrations in the hypolimnion fivefold to nearan average of 5 mg L21 in the treated basin. Thischange improved the habitat for fish and their foodbase. Also, surface water chlorophyll a and totalphosphorus concentrations were reduced such thata lake previously classified as eutrophic wasreclassified as mesotrophic (Prepas et al., 1997).Withdrawal of nutrient-rich, hypoxic, water fromthe hypolimnion can reduce the transfer ofnutrients from the deep water to surface waters,thereby reducing the potential for increased
Worldwide Eutrophication of Water Bodies328

phytoplankton biomass. In 10 lakes, hypolimneticwithdrawal decreased epilimnetic total phos-phorus concentration by 11% yr21 on average.Operational costs are very low, especially whenpassive siphoning is employed (Nurnberg, 1987).Finally, mechanical removal of sediments bydredging is a very effective but expensive methodto reduce nutrient inputs to systems with highinternal loads. For example, in lake Trummen, ashallow Swedish lake, cyanobacterial biomassdecreased after dredging only 0.5 m from the lakebottom (Cronberg et al., 1975). The challenge ofdredging, however, is to find a use, like cropfertilization, for waste sediment. Decreases inepilimnetic total phosphorus concentrations frominternal loading control can often be detectedwithin two to three years.
9.08.5 THE FUTURE—OPPORTUNITIES FOREUTROPHICATION MANAGEMENT
The primary focus of any drainage basinmanagement program should be to restrict exter-nal nutrient loads. With such action, lakes withsmall internal nutrient sources can be restoredquickly, as in the case of phosphorus and in LakeWashington. However, where internal loading is asignificant component of the annual nutrientload, restoration can be lengthy. For example,Shagawa Lake (Minnesota) is projected to take 80years to achieve a 90% reduction in sedimentphosphorus load (Chapra and Canale, 1991). Earlyaction to prevent eutrophication, as was donein Lake Tahoe, can minimize accumulation ofphosphorus-rich sediments. Otherwise, theremoval of stockpiled phosphorus in bottomsediments can require a long and costly cleanup.There are too few Lake Washingtons and LagoMaggiores, where resources were relativelyabundant to assess and to remedy the problem.Worldwide, the greatest unresolved water qua-
lity concerns are in countries with the fewestresources, where demand for water is growing andresearch and restoration funding sources arescarce. The fate of aquatic resources in theworld’spoorest countries should be of concern to allcountries. Because the toxicity of drinking wateroften increases with nutrient enrichment, excessnutrients should be treated as toxic substances andbanned. There is an urgent need for the universalregulation of nutrients to protect drinking watersupplies and aquatic biodiversity.
ACKNOWLEDGMENTS
We thank R. Mosello and L. Harding forsupplying unpublished data, and R. Hecky,A. Litt, S. Abella, C. Goldman, J. Mackarewicz,
J. Lehman, R. Mosello, D. Boesch, J. Burke,B. Sherwood-Lollar, and an anonymous reviewerfor reviewing the manuscript, or parts thereof.
REFERENCES
Ambrosetti W. and Barbanti L. (1999) Deep water warming inlakes: an indicator of climatic change. J. Limnol. 58, 1–9.
Ambrosetti W., Barbanti L., Mosello R., and Pugnetti A.(1992) Limnological studies on the deep southern Alpinelakes Maggiore, Lugano, Como, Iseo, and Garda. Mem. Ist.Ital. Idrobiol. 50, 117–146.
Bartish T. (1987) A review of exchange processes among thethree basins of Lake Erie. J. Great Lakes Res. 13, 607–618.
Bartsch A. F. (1972) Nutrients and eutrophication—prospectsand options for the future. In Nutrients and Eutrophication:The Limiting Nutrient Controversy (ed. G. E. Likens).The American Society of Limnology and Oceanography,Lawrence, Kansas, pp. 297–300.
Beeton A. M. (1961) Environmental changes in Lake Erie.Trans. Am. Fish. Soc. 90, 153–159.
Beeton A. M. (1963) Limnological Survey of Lake Erie 1959and 1960. Great Lakes Fisheries Commission, Ann Arbor,MI, Report no. 6.
Beeton A. M. (1965) Eutrophication of the St. Lawrence GreatLakes. Limnol. Oceanogr. 10, 240–254.
Bertram P. E. (1993) Total phosphorus and dissolved oxygentrends in the central basin of Lake Erie, 1970–1991. J.GreatLakes Res. 19, 224–236.
Bootsma H. A. and Hecky R. E. (1993) Conservation of theAfrican great lakes: a limnological perspective. Conserv.Biol. 7, 644–656.
Bosch J. M. and Hewlett J. D. (1982) A review of catchmentexperiments to determine the effect of vegetation changes onwater yield and evapo-transpiration. J. Hydrol. 55, 3–23.
Boynton W. R., Garber J. H., Summers R., and Kemp W. M.(1995) Inputs, transformations, and transport of nitrogen andphosphorus in Chesapeake Bay and selected tributaries.Estuaries 18, 285–314.
Brown M. J., Bondurant C. E., and Brockway C. E. (1981)Ponding surface drainagewater for sediment and phosphorusremoval. Trans. ASAE 24, 1478–1481.
Caraco N., Cole J., and Likens G. E. (1990) A comparison ofphosphorus immobilization in sediments of freshwater andcoastal marine systems. Biogeochemistry 9, 277–290.
Chapra S. C. and Canale R. P. (1991) Long-term phenomen-ological model of phosphorus and oxygen for stratified lakes.Water Res. 25, 707–715.
Codd G. A. (1995) Cyanobacterial toxins: occurrence, proper-ties and biological significance. Water Sci. Technol. 32,149–156.
Cooper S. R. and Brush G. S. (1991) Long-term history ofChesapeake Bay Anoxia. Science 254, 992–996.
Cronan C. S. and Aiken G. R. (1985) Chemistry and transportof soluble humic substances in forested watersheds of theAdirondack Park, New York, USA. Geochim. Cosmochim.Acta 49, 1697–1706.
Cronberg G., Gelin C., and Larsson K. (1975) Lake Trummenrestoration project: II. Bacteria, phytoplankton and phyto-plankton productivity. Verh. Int. Ver. Limnol. 19,1088–1096.
Crosby J. M., Bradford M. E., Mitchell P. A., Prepas E. E.,McIntyre L. G., Hart Buckland-Nicks L., and Hanson J. M.(1990) In Atlas of Alberta Lakes (eds. P. Mitchell and E.Prepas). University of Alberta Press, Edmonton, Alberta.
Crumpton W., Isehart G. M., and Mithell P. L. (1992) Nitrateand organic N analyses with second-derivative spectroscopy.Limnol. Oceanogr. 37, 907–913.
D’Arcy P. and Carignan R. (1997) Influence of catchmenttopography on water chemistry in southeastern QuebecShield lakes. Can. J. Fish. Aquat. Sci. 54, 2215–2227.
References 329

Davidson O. (1992) Energy issues in sub-Saharan Africa:future directions. Ann. Rev. Energy Environ. 17, 359–404.
Davis C. C. (1964) Evidence for the eutrophication of LakeErie from phytoplankton records. Limnol. Oceanogr. 9,275–283.
de Bernardi R., Giussani G., Manca M., and Ruggiu D. (1988)Long-term dynamics of plankton communities in LagoMaggiore (N. Italy). Verh. Int. Ver. Limnol. 23, 729–733.
D’Elia C. F., Sanders J. G., and BoyntonW. R. (1986) Nutrientenrichment studies in a coastal plain estuary: phytoplanktongrowth in large-scale, continuous cultures. Can. J. Fish.Aquat. Sci. 43, 397–406.
Dillon P. J. and Kirchner W. B. (1975) The effects of geologyand land use on the export of phosphorus from watersheds.Water Res. 9, 135–148.
Dolan D. M. (1993) Point-source loadings of phosphorus toLake Erie: 1986–1990. J. Great Lakes Res. 19, 212–223.
Dunn J. (1996) Algae kills dialysis patients in Brazil. Br. Med.J. 312, 1183–1184.
EdmondsonW. T. (1969) Eutrophication in North America. InEutrophication: Causes, Consequences, Correctives, Publ.1700. National Academy of Science/National ResearchCouncil, Washington, DC, pp. 129–149.
Edmondson W. T. (1975) Recovery of Lake Washington fromeutrophication. In Recovery and Restoration of DamagedEcosystems (eds. J. Cairns, Jr., K. L. Dickson, and E. E.Henricks). University Press of Virginia, Charlottesville, VA,pp. 102–109.
Edmondson W. T. (1994) Sixty years of Lake Washington: acurriculum vitae. Lake Reserv. Manage. 10, 75–84.
Ertl D. S., Young K. A., and Raboy V. (1998) Plant geneticapproaches to phosphorus management in agriculturalproduction. J. Environ. Qual. 27, 299–304.
Goldman C. R. (1993) Failures, successes and problems incontrolling eutrophication. Mem. Ist. Ital. Idrobiol. 52,79–87.
Goldman C. R. and Lubnow F. S. (1992) Seasonal influence ofcalcium magnesium acetate on microbioal processes in 10northern Californian lakes. Resour. Conserv. Recy. 7,51–67.
Goldman C. R., Jassby A. D., and Hackley S. H. (1993)Decadal, interannual, and seasonal variability in enrichmentbioassays at Lake Tahoe, California–Nevada, USA. Can.J. Fish. Aquat. Sci. 50, 1489–1496.
Grattan L. M., Oldach D., Perl T. M., Lowitt M. H., MatuszakD. L., Dickson C., Parrott C., Shoemaker R. C., KaufmanC. L., Wasserman M. P., Hebel J. R., Charache P., andMorris J. G., Jr. (1998) Learning and memory difficultiesafter environmental exposure to waterways containingtoxin-producing Pfiesteria or Pfiesteria-like dinoflagellates.Lancet 352, 532–539.
Guildford S. J. and Hecky R. E. (2000) Total nitrogen, totalphosphorus, and nutrient limitation in lakes and oceans: isthere a common relationship? Limnol. Oceanogr. 45,1213–1223.
HardingL.W., Jr. (1994)Long-term trends in the distribution ofphytoplankton in Chesapeake Bay: roles of light, nutrients,and streamflow. Mar. Ecol. Prog. Ser. 104, 267–291.
Hecky R. E. (1993) The eutrophication of Lake Victoria, EastAfrica. Verh. Int. Ver. Limnol. 25, 39–48.
Hobbie J. E. and Likens G. E. (1973) Output of phosphorus,dissolved organic carbon, and fine particulate carbon fromHubbard Brook watersheds. Limnol. Oceanogr. 18,734–742.
Horne A. J. and Goldman C. R. (1994) Limnology. McGraw-Hill, New York, NY.
Howarth R. W. (1988) Nutrient limitation of net primaryproduction in marine ecosystems. Ann. Rev. Ecol. Syst. 19,89–110.
Hutchinson G. E. (1973) Eutrophication. Am. Sci. 61,269–279.
Istituto Italiano di Idrobiologia—CNR (2001) Ricerchesull’evoluzione del Lago Maggiore. Aspetti limnologici.
Programma quinquennale 1998–2002. Campagna 2000.(ed. Commissione Internazionale per la protezione delleacque italo-svizzere). Ist. Ital. Idrobiol.—CNR, 77pp.
Jassby A. D., Reuter J. E., Axler R. P., Goldman C. R., andHackley S. H. (1994) Atmospheric deposition of nitrogenand phosphorus in the annual nutrient load of LakeTahoe (California–Nevada). Water Resour. Res. 30,2207–2216.
Jassby A. D., Goldman C. R., and Reuter J. E. (1995) Long-term change in Lake Tahoe (California–Nevada, USA) andits relation to atmospheric deposition of algal nutrients.Arch. Hydrobiol. 135, 1–21.
Jassby A. D., Goldman C. R., Reuter J. E., Richards R. C., andHeyvaert A. C. (2001) Lake Tahoe: diagnosis and rehabilita-tion of a large mountain lake. In The Great Lakes of theWorld (GLOW): Food-web, Health and Integrity (eds. M.Munawar and R. E. Hecky). Backhuys Publishers, Leiden,The Netherlands, pp. 431–454.
Jenny H. (1980) The Soil Resource. Springer, New York.Kalff J. (2002) Limnology. Prentice Hall, New Jersey.Kasprzak P., Krienitz L., and Koschel R. (1993) Biomanipula-
tion: a limnological in-lake ecotechnology of eutrophicationmanagement? Mem. Ist. Ital. Idrobiol. 52, 151–169.
Lehman J. T. and Branstrator D. K. (1994) Nutrient dynamicsand turnover rates of phosphate and sulfate in Lake Victoria,East Africa. Limnol. Oceanogr. 39, 227–233.
Lentz R. D., Sojka R. E., and Robins C. W. (1998) Reducingphosphorus losses from surface-irrigated fields: emergingpolyacrylamide technology. J. Environ. Qual. 27, 305–312.
Lewis W. M., Jr. (1987) Tropical limnology. Ann. Rev. Ecol.Syst. 18, 159–184.
Lewitus A. J., Hesian R. V., Kana T. M., Burkholder J. M.,Glasgow H. B., and May E. (1995) Discovery of the“phantom” dinoflagellate in the Chesapeake Bay. Estuaries18, 373–378.
Ludsin S. A., Kershner M. W., Blocksom K. A., Knight R. L.,and Stein R.A. (2001) Life after death in Lake Erie: Nutrientcontrols drive fish species richness, rehabilitation. Ecol.Appl. 11, 731–746.
Magnien R., Boward D., and Bieber S. (1995) The State of theChesapeake 1995. USEPA, Annapolis, MD.
Makarewicz J. C. (1993) Phytoplankton biomass and speciescomposition in Lake Erie, 1970 to 1987. J. Great Lakes Res.19, 258–274.
Makarewicz J. C. and Bertram P. (1991) Evidence for therestoration of the Lake Erie ecosystem. Bioscience 41,216–223.
Makarewicz J. C., Lewis T. W., and Bertram P. (1999)Phytoplankton composition and biomass in the offshorewaters of Lake Erie: pre- and post-Dreissena introduction(1983–1993). J. Great Lakes Res. 25, 135–148.
Malone R. C., Crocker L. H., Pike S. E., and Wendler B. W.(1988) Influences of river flow on the dynamics ofphytoplankton production in a partially stratified estuary.Mar. Ecol. Prog. Ser. 48, 235–249.
Manca M., Calderoni A., and Mosello R. (1992) Limnologicalresearch in Lago Maggiore: studies on hydrochemistry andplankton. Mem. Ist. Ital. Idrobiol. 50, 171–200.
Moore P.A., Jr. andMillerD.M. (1994)Decreasing phosphorussolubility in poultry litter with aluminum, calcium, and ironamendments. J. Environ. Qual. 23, 325–330.
Mosello R. and Ruggiu D. (1985) Nutrient load, trophicconditions and restoration prospects of Lake Maggiore. Int.Rev. ges. Hydrobiol. 70, 63–75.
Mosello R., Barbieri A., Brizzio M. C., Calderoni A.,Marchetto A., Passera S., Rogora M., and Tartari G.(2001) Nitrogen budget of Lago Maggiore: the relativeimportance of atmospheric deposition and catchmentsources. J. Limnol. 60, 27–40.
Mugidde R. (1993) Changes in phytoplankton primaryproductivity and biomass in Lake Victoria (Uganda). Int.Ver. Theor. Angew. Limnol. Verh. 25, 846–849.
Worldwide Eutrophication of Water Bodies330

Mugidde R. (2001) Nutrient status and planktonic nitrogenfixation in Lake Victoria, Africa. PhD Thesis, University ofWaterloo.
Munawar M. and Munawar I. F. (1976) A lakewide study ofphytoplankton biomass and its species composition in LakeErie, April–December 1970. J. Fish. Res. Board Can. 33,581–600.
Nurnberg G. K. (1987) Hypolimnetic withdrawal as lakerestoration technique. J. Environ. Eng. 113, 1006–1017.
Ochumba P. B. O. (1987) Periodic massive fish kills in theKenyan part of Lake Victoria. Water Qual. Bull. 12,119–122.
Ochumba P. B. O. (1996) Measurement of water currents,temperature, dissolvedoxygen andwinds on theKenyanLakeVictoria. In The Limnology, Climatology, and Paleoclimatol-ogy of the East African Lakes (eds. T. C. Johnson and E. O.Odata). Gordon and Breach, Australia, pp. 155–167.
OECD (Organization for Economic Cooperation and Devel-opment) (1982) Eutrophication of Waters: Monitoring,Assessment, and Control. OECD, Paris.
Orth R. J. and Moore K. A. (1983) Chesapeake Bay: anunprecedented decline in submerged aquatic vegetation.Science 222, 51–53.
Parry R. (1998) Agricultural phosphorus and water quality: aUS Environmental Protection Agency perspective.J. Environ. Qual. 27, 258–261.
Prepas E. E. and Rigler F. H. (1982) Improvements inquantifying the phosphorus concentration in lake water.Can. J. Fish. Aquat. Sci. 39, 822–829.
Prepas E. E., Field K. M., Murphy T. P., JohnsonW. L., BurkeJ. M., and Tonn W. M. (1997) Introduction to the AmiskLake Project: oxygenation of a deep, eutrophic lake. Can.J. Fish. Aquat. Sci. 54, 2105–2110.
Prepas E. E., Pinel-Alloul B., Chambers P. A., Murphy T. P.,Reedyk S., Sandland G., and Serediak M. (2001a) Limetreatment and its effects on the chemistry and biota ofhardwater eutrophic lakes. Freshwater Biol. 46, 1049–1060.
Prepas E. E., Planas D., Gibson J. J., Vitt D. H., Prowse T. D.,Dinsmore W. P., Halsey L. A., McEachern P. M., Paquet S.,Scrimgeour G. J., Tonn W. M., Paszkowski C. A., andWolfstein K. (2001b) Landscape variables influencingnutrients and phytoplankton communities in Boreal Plainlakes of northern Alberta: a comparison of wetland- andupland-dominated catchments. Can. J. Fish. Aquat. Sci. 58,1286–1299.
Provini A., Marchetti R., and Tartari G. (1992) The Italianlakes: trophic status and remedial measures. Mem. Ist. Ital.Idrobiol. 50, 147–169.
Rawson D. S. (1960) A limnological comparison of twelvelarge lakes in Northern Saskatchewan. Limnol. Oceanogr. 5,195–211.
Redfield A. C. (1958) The biological control of chemicalfactors in the environment. Am. Sci. 46, 205–221.
Riley E. T. and Prepas E. E. (1984) Role of internal phosphorusloading in two shallow, productive lakes in Alberta, Canada.Can. J. Fish. Aquat. Sci. 41, 845–855.
Roby K. B. and Azuma D. L. (1995) Changes in a reach of anorthern California stream following wildfire. Environ.Manage. 19, 591–600.
Rosa F. (1987) Lake Erie central basin total phosphorus trendanalysis from 1968 to 1982. J. Great Lakes Res. 13,684–696.
Ruggiu D. and Mosello R. (1984) Nutrient levels andphytoplankton characteristics in the deep southern alpinelakes. Verh. Int. Ver. Limnol. 22, 1106–1112.
Ruttner F. (1952) Fundamentals of Limnology, 3rd edn.(Translated in 1953 by D. G. Frey and F. E. S. Fry).University of Toronto Press, Toronto, ON.
Ryding S.-O. and Rast W. (1989) The Control of Eutrophica-tion of Lakes and Reservoirs. UNESCO, Paris.
Scheffer V. B. and Robinson R. J. (1939) A limnological studyof Lake Washington. Ecol. Monogr. 9, 95–143.
Scheren P. A. G. M., Zanting H. A., and Lemmens A. M. C.(2000) Estimation of water pollution sources in LakeVictoria, East Africa: application and elaboration of therapid assessment methodology. J. Environ. Manage. 58,235–248.
Schindler D. W. (1977) Evolution of phosphorus limitation inlakes. Science 195, 260–262.
Schlesinger W. H. (1997) Biogeochemistry: An Analysis ofGlobal Change. Academic Press, San Diego, CA.
Seitzinger S. P. (1988)Denitrification in freshwater and coastalmarine ecosystems: ecological and geochemical signifi-cance. Limnol. Oceanogr. 33, 702–724.
Shapiro J. and Wright D. I. (1984) Lake restoration bybiomanipulation. Freshwater Biol. 14, 371–384.
Silbergeld E.K., Grattan L., Oldach D., and Morris J.G. (2000)Pfiesteria: harmful algal blooms as indicators of human:ecosystem interactions. Environ. Res. 82, 97–105.
Smith V. H. (1986) Light and nutrient effects on the relativebiomass of blue-green algae in lake phytoplankton. Can.J. Fish. Aquat. Sci. 43, 148–153.
Snell E. A. (1987) Wetland distribution and conversionin southern Ontario. Working Paper No. 48. InlandWaters/Lands Directorate, Environment Canada.
Søballe D. M. and Kimmel S. T. (1987) Advection, phyto-plankton, biomass, and nutrient transformations in a rapidlyflushed impoundment. Arch. Hydrobiol. 105, 187–203.
Talling J. F. and Talling I. B. (1965) The chemical compositionof African lake waters. Int. Rev. ges. Hydrobiol. 50,421–463.
Trimbee A. M. and Prepas E. E. (1987) Evaluation of totalphosphorus as a predictor of the relative biomass of blue-green algae with emphasis on Alberta lakes. Can. J. Fish.Aquat. Sci. 44, 1337–1342.
Vallentyne J. E. and Thomas N. A. (1978) Fifth YearReview of Canada–United States Great Lakes WaterQuality Agreement. International Joint Commission,Windsor, ON.
Van den Hoeck C., MannD. G., and Jahns H.M. (1995) Algae:An Introduction to Phycology. Cambridge University Press,Cambridge, UK.
Vighi M., Sandroni D., and Ferri G. (1995) Biomanipulation oftrophic chain in two small eutrophic lakes. Mem. Ist. Ital.Idrobiol. 53, 157–175.
Watson S. B., McCauley E., and Downing J. A. (1997) Patternsin phytoplanktontaxonomic composition across temperatelakes of differing nutrient status. Limnol. Oceanogr. 42,487–495.
Welch E. B. and Cooke G. D. (1999) Effectiveness andlongevity of phosphorus inactivation with Alum. LakeReserv. Manage. 15, 5–27.
Yin X. and Nicholson S. R. (1998) The water balance of LakeVictoria. Hydrol. Sci. J. 43, 789–811.
q 2003, Elsevier Ltd. All rights reservedNo part of this publication may be reproduced, stored in a retrieval system ortransmitted in any form or by any means, electronic, mechanical, photocopying,recording or otherwise, without prior written permission of the Publisher.
Treatise On GeochemistryISBN (set): 0-08-043751-6
Volume 9; (ISBN: 0-08-044344-3); pp. 311–331
References 331