
W-01 Climate of Somaliafaoswalim.org/resources/site_files/W-01 Climate of Somalia_0.pdf · i...
82
i Climate of Somalia Technical Report No. W-01 Oct 2007 Somalia Water and Land Information Management Ngecha Road, Lake View. P.O Box 30470-00100, Nairobi, Kenya. Tel +254 020 4000300 - Fax +254 020 4000333, Email: [email protected] Website: http//www.faoswalim.org. Funded by the European Union and implemented by the Food and Agriculture Organization of the United Nations
Transcript of W-01 Climate of Somaliafaoswalim.org/resources/site_files/W-01 Climate of Somalia_0.pdf · i...
`
i
Climate of Somalia
Technical Report No. W-01
Oct 2007 Somalia Water and Land Information Management
Ngecha Road, Lake View. P.O Box 30470-00100, Nairobi, Kenya. Tel +254 020 4000300 - Fax +254 020 4000333,
Email: [email protected] Website: http//www.faoswalim.org.
Funded by the European Union and implemented by the Food and Agriculture Organization of the United Nations

`
ii
Disclaimer The designations employed and the presentation of material in this information product do not imply the expression of
any opinion whatsoever on the part of the Food and Agriculture Organization of the United Nations and the SWALIM
Project concerning the legal status of any country, territory, city or area of its authorities, or concerning the delimitation
of its frontiers or boundaries.
This document should be cited as follows:
Muchiri P.W. (2007), Climate of Somalia. Technical Report No W-01, FAO-SWALIM, Nairobi, Kenya.
Acknowledgement I am grateful to Hussein Gadain, SWALIM Water Coordinator for the help and guidance provided during the production of this report.
`
iii
Many thanks to Dr. Zoltan Balint, SWALIM Chief Technical Advisor and Flavian Muthusi, SWALIM Water Resources Officer for their technical input. Special thanks are due to the Somali people who made numerous contributions to this report, special thanks goes to Prof. Musse Shaie, SWALIM Land Coordinator and Sidow. Adow of FEWS NET Somalia. Thanks are due to Christian Omuto of the University of Nairobi who reviewed this document.
Table of Contents Disclaimer ................................................................................................................................... ii
Acknowledgement ....................................................................................................................... ii
Table of Contents ....................................................................................................................... iii

`
iv
List of Figures ............................................................................................................................ vi
List of Appendices .................................................................................................................... vii
List of Abbreviations ................................................................................................................ viii
List of Abbreviations ................................................................................................................ viii
Glossary of terms ..................................................................................................................... viii
A Note on Spellings and Units ................................................................................................... ix
1. BACKGROUND .................................................................................................................... 1
1.1 Significance of Climate .................................................................................................................. 1
1.2 Climate of Somalia at a Glance ...................................................................................................... 2
1.3 Factors Influencing the Climate of Somalia ................................................................................... 3 1.3.1 Inter Tropical Convergence Zone (ITCZ) .............................................................................................. 3 1.3.2 Southwest and northeast monsoon winds .............................................................................................. 3
1.4 History of Climate and Meteorological Observations in Somalia .................................................. 5
2. CLIMATE CHARACTERISTICS OF SOMALIA ................................................................ 8
2.1 Data Availability ............................................................................................................................ 8 2.2.1 Temporal rainfall distribution in Somalia ........................................................................................... 13 Figure 6: Deyr rainfall distribution in Somalia 2.2.2 Spatial rainfall distribution in Somalia ................... 16 2.2.2 Spatial rainfall distribution in Somalia................................................................................................ 17 2.2.3 Rainfall variability .............................................................................................................................. 17
2.3 Evapotranspiration ...................................................................................................................... 20
2.4 Water Balance ............................................................................................................................. 22
2.5 Length of Growing Period (LGP) ............................................................................................... 25
2.6 Air Temperature .......................................................................................................................... 28 2.6.1 Spatial and temporal variations of mean air temperature in Somalia ................................................ 28 2.6.2 Mean maxima and minima temperatures ............................................................................................ 31
2.7 Atmospheric Humidity ................................................................................................................. 31
2.8 Wind ............................................................................................................................................ 34 2.8.1 Wind speed.......................................................................................................................................... 34 2.8.2 Wind direction ..................................................................................................................................... 37
3. CLIMATE CLASSIFICATION ............................................................................................ 38
`
v
3.1 Introduction ........................................................................................................................................ 38
3.2 Koppen Classification Method ..................................................................................................... 38 3.2.1 Group A: Tropical/Mega-thermal climates ......................................................................................... 39 3.2.2 Group B: Dry (arid and semi-arid) climates ........................................................................................ 39 3.2.3 Group C: Temperate/meso-thermal climates ...................................................................................... 40 3.2.4 Group D: Continental/micro-thermal climate ..................................................................................... 40 3.2.5 Group E: Polar climates ...................................................................................................................... 40
3.3 Thornthwaite’s Climate Classification ........................................................................................ 42
3.4 FAO Eco-climate Classification .................................................................................................. 44
Bibliography .............................................................................................................................. 47

`
vi
List of Figures
Figure 1: Seasonal wind directions in Somalia .......................................................................... 4
Figure 2: Rainfall observation network in Somalia(April, 2007) .............................................. 7
Figure 3: Historical weather monitoring network in Somalia .................................................. 10
Figure 4: Mean annual rainfall distribution in Somalia ........................................................... 12
Figure 5: Gu rainfall distribution in Somalia ........................................................................... 14
Figure 6: Deyr rainfall distribution in Somalia ....................................................................... 16
Figure 7: Rainfall variability in Somalia .................................................................................. 19
Figure 8: Mean annual PET distribution in Somalia ................................................................ 21
Figure 9: PET distribution for some selected stations .............................................................. 22
Figure 10: Moisture index distribution in Somalia .................................................................. 24
Figure 11: Mean annual temperature distribution .................................................................... 29
Figure 12: Temperature distribution at some selected stations ................................................ 30
Figure 13: Map of relative humidity ....................................................................................... 33
Figure 14: Wind speed distribution .......................................................................................... 35
Figure 15: Wind speed at selected stations .............................................................................. 36
Figure 16: Koppen climate classification in Somalia ............................................................... 41
Figure 18: FAO Eco-climate classification for Somalia .......................................................... 46

`
vii
List of Appendices
Appendix 1: Temporal rainfall distribution in Somalia ........................................................... 48
Appendix 2: Seasonal distribution of rainfall........................................................................... 52
Appendix 3: Mean monthly PET in Somalia (1963-1990) ...................................................... 58
Appendix .4: Moisture deficit index for selected stations in Somalia ..................................... 58
Appendix .4: Moisture deficit index for selected stations in Somalia ..................................... 59
Appendix 5: LGP calculations per station ............................................................................... 60
Appendix 6: LGP characteristics .............................................................................................. 61
Appendix 7: Legend for LGP map of Somalia ...................................................................... 62
Appendix 8: Monthly temperature distribution ....................................................................... 63
Appendix 9: Daily mean temperatures ..................................................................................... 69
Appendix 10: Daily mean minimum temperature .................................................................... 70
Appendix 11: Daily mean maximum temperature ................................................................... 71
Appendix 12: Daily mean temperature range........................................................................... 72
Appendix 13: Table of relative humidity (%) .......................................................................... 73

`
viii
List of Abbreviations
ITCZ Inter tropical Convergence Zone ICAO International Civil Aviation Organisation FAO Food and Agriculture Organisation SWALIM Somalia Water and Land Information Management BMO British Meteorological Office PET Potential Evapotranspiration MDI Moisture Deficit Index LGP Length of Growing Period P Precipitation RH Relative Humidity ADRA Adventist Development and Relief Agency FSAU Food Security Analysis Unit- Somalia COOPI Cooperazione Internazionale SC UK Save the Children - UK CARE Cooperation Assistance Relief Everywhere ADRA Adventist Development Relief Agency ACF Action Internatinale Contre la Faim GAA German Agro-Action MDGs Millennium Development Goals PSAWEN Puntland State Agency for Water, Energy and Mineral Development WVI World Vision International Glossary of terms Deyr October to November, minor wet season

`
ix
Gu April to June, major wet season Hagaa July to September, minor dry season Jilal December to March major dry season in Somalia Kharif Strong winds experienced in July in most parts of northern Somalia. Monsoon Wind pattern that changes direction depending on the season. The term is applied to
seasonal winds in which the wind blows from e.g. southwest monsoon originates from southwest direction.
Tropics This is the geographic region of the earth centred on the Equator and limited in latitude by the Tropic of Cancer in the northern hemisphere, at approximately 23°30' (23.5°) N latitude, and the Tropic of Capricorn in the southern hemisphere at 23°30' (23.5°) S latitude. This region is also referred to as the tropical zone and the torrid zone.
A Note on Spellings and Units Spellings on place names and seasons in Somalia are very variable. Attempts have been made to use the same spellings throughout this document, but there may be discrepancies! Phonetics are usually similar even if the spelling differs, although it can sometimes take some thought. H and X may be used interchangeably, as in Haggai/Xaggai, and Huddur/Xuddur. H and J are also interchanged, for example Jilaal/Hilaal and Ganale/Janale. Baidoa is often spelled Baydhabo. Luuq is variously referred to as Luuq Ganane, Lug Ganana, or a similar combination. Balcad may be spelled without the ‘c’. Jowhar may be spelled Jawhar, Johar or Giohar. Kismayo can be spelt Chismayu. Hopefully most of the discrepancies have been removed. System of International Units (S.I.) applies throughout this document.

Background ____________________________________________________________________________
1
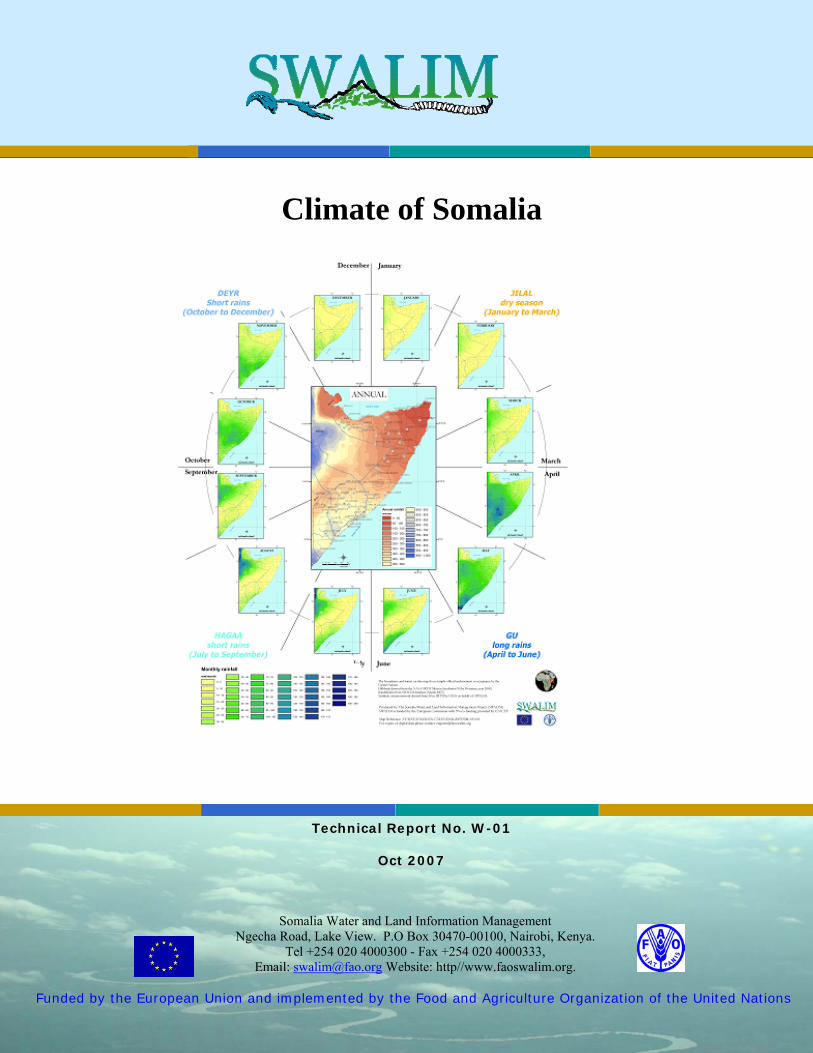
1. BACKGROUND 1.1 Significance of Climate Climate is a set of conditions resulting from the interaction of atmospheric air masses, oceans and continents as the earth rotates and receives solar radiation. Climate ultimately controls temperature cycles, humidity, wind direction and force, and frequency and types of precipitation. The driving force of climate is the different amounts of solar energy received by various locations and types of surfaces on the earth. Climate and, in the shorter term, weather, results from adjustments being made in an attempt to equalize and distribute the effects of solar radiation across the globe- an equilibrium that can never be achieved. Climate plays a very significant role in the planning and implementation of economic development programs of a country. For example, the economy of Somalia that is predominantly agricultural has to factor in vulnerability and variability of prevailing climatic patterns in planning their agricultural development. In this country, agriculture comprises livestock production and crop production and which are entirely rainfed. Somalia, like all African countries, is a major target of the Millennium Development Goals. Thus, information on the country’s climatic characteristics is vital in decision-making for planning the national development agenda. Development planning often takes limited, if any, account of climate, despite often frequent significant vulnerability to climate variations. As an example, the recent extreme of climate events that have recently taken place in Somalia mainly floods and droughts are well documented, even if no dollar values can be placed upon these, the events are not forgotten by the Somali people. There are numerous such examples although these tends to be ignored and forgotten due to conflict, globalisation, adjustments in political structures, and insecurity. The future will bring additional challenges, as predictions indicate that pressures of climate variability on development may become more severe over the coming century. Climate is therefore a factor, amongst many, that limits development and that requires full consideration in planning, a fact recognised, of course, many years ago. It is certainly true that climate structures are absent in Somalia, the available facilities are below international standards, and national expertise has leaked away from the country since the beginning of the civil war. Climate services in Somalia cannot currently contribute to development planning for many activities and there is a need for improvement. The prolonged civil war in Somalia saw the collapse of the climate monitoring network, hence, analysis in this report has been obliged to draw on pre-war data mainly data for the period 1963 to 1990. This clearly leaves a gap of sixteen years with no data. It has been difficult therefore to contribute meaningfully to discussions about climate change in Somalia. The report describes the Climate of Somalia and may be used for national planning purposes. It must however be kept in mind that, the data used may be insufficient to describe the climate but efforts have been made to confirm data from the local community and from existing scientific knowledge.

Background ____________________________________________________________________________
2
1.2 Climate of Somalia at a Glance Somalia generally has an arid to semi-arid climate. Rainfall is the defining characteristic of the climate and has a great spatial and temporal variability. The climate of Somalia is determined by the north and south movement of the inter-Tropical Convergence Zone (ITCZ). In most areas of Somalia this results in two rainfall seasons - the Gu as the zone passes northwards and the Deyr as it moves south. In both cases, rain is produced from the moist air derived from the Indian Ocean, in the southerly air stream. The north-easterly winds, emanating from Asia and Arabia, produce little significant rain. It is generally considered that rainfall is the most important meteorological element affecting life in Somalia. In particular, variation from season to season, and variations within the season are what determine the successes of agricultural activities. The movement of the ITCZ also causes distinct changes in the wind direction throughout the year. When the ITCZ is to the south, the winds are from the northeast and when it is to the north the winds are from the southwest. This 1800 shift to the southwest occurs gradually as the ITCZ passes over, spanning approximately between March-July, and then returning to the north-east winds by December. While there are some regional variations, this pattern is dominant across the whole country. Sea breeze can be significant and cause strong southwest winds off the north coast during June-August that are locally known as kharif. Wind speeds average between 0.5 - 10 m/s, with the highest wind speeds occurring in the Northern Plateau. While the strongest winds occur between June and August, the weakest winds generally occur as the ITCZ passes over the Equator in April to May in southern Somalia. Luuq; in Gedo region near the border with Ethiopia, has the highest mean temperature in the country, at over 30° C. Most inland areas of southern Somalia are only slightly cool with the north coast also almost having similar temperatures. Temperatures along the southern coast are lower than those of inland areas. In the north, temperatures are correlated with altitude, with a lapse rate of 6.5° C per 1000 m. Average monthly temperatures reach as high as 41° C in March mainly around Bardheere and Luuq. Greater contrasts between daily maximum and minimum temperatures occur in inland areas compared to those at the coast. However, these contrasts are generally small in comparison to those which might be expected for the desert environments. Hutchinson and Polishchouk (1989) attribute this to the relatively high humidity across the whole country. There are few records of evaporation and the values which have been reported in various studies to vary between about 1000-3000 mm/yr. In general, evaporation is greater than precipitation across the country but there are localised areas in southern Somalia, around Jilib and Baidoa, where for a few months of the year higher rainfall than evaporation may be experienced. This occurs at the beginning of both the Gu and Deyr seasons, thus allowing crop growth to commence. Total evaporation generally increases from south to north, with the highest annual evaporation occurring on the north coast. The time of greatest evaporation also varies across the country, being the middle of the year in the north, and the beginning of the
Background ____________________________________________________________________________
3
year in south and central regions. However, the contrast is great in the north with only minor changes in evaporation throughout the year in the south. 1.3 Factors Influencing the Climate of Somalia 1.3.1 Inter Tropical Convergence Zone (ITCZ) This is a zone over which two airstreams consisting of the north-easterly and south-easterly trade winds meet. The zone of convergence can cover a large area over which the air is rising and the clouds forming and when conditions are favourable precipitation always results. The ITCZ affects the climate of Somalia by intensifying daily weather activities. Thus, where rainfall is normally expected and the ITCZ is present, the weather phenomena are assured and intensified. The ITCZ passes the Equator twice in the year- first, when it is overhead on its way to the south and second when moving from the southern hemisphere to the north. The two passages of the ITCZ coincide with the two distinct rainy seasons experienced in the area and which are locally referred to as Gu and Deyr in Somalia. 1.3.2 Southwest and northeast monsoon winds The sun is approximately overhead in Somalia at the end of March and again at the end of September so that the ITCZ can be expected to be most effective about a month later i.e. April and October, which are actually the peaks of the two rainy seasons. At these times of the year, the pressure is high in the subtropical latitudes of the Sahara and southern Africa and there is often a general movement of air masses from the high pressure belts towards the trough of low pressure in the equatorial region. This usually results in organized south-easterly and north-easterly winds meeting in a zone of convergence or more often which are not well organized converging locally. Both types of convergence result in vertical upward motion of air, condensation, formation of clouds and precipitation. These conditions are experienced in April and October (Figure 1). In July the sun is over the Tropic of Cancer. With high pressure to the south and low pressure to the north the wind flow is ideally southerly or south-easterly direction. These winds cross a large part of the Indian Ocean and are therefore moist in the lower layers. The large area of low pressure over Arabia and India has a great controlling influence so that the south-easterly trade winds re-project across the equator to become the south-west monsoon over the Indian Ocean and the coast of Somalia, the latter receiving significant amounts of rainfall during this time of the year. This results from a narrow band of convergence in the southerly winds that are limited to the coastal belt. During the same period through to August, the south-westerly in upper levels brings tendency to instability and upward vertical motion with moisture that spreads to high level places especially the uplands of northern Somalia leading to precipitation. In January the sun is over the Tropic of Capricorn so that the pressure is high in the north of the Equator and low in the south. The wind flow at this time of the year over Somalia is north–easterly. Since the air usually originates over the deserts of Arabia, dry and almost cloudless conditions occur with high temperatures.

Background ____________________________________________________________________________
4
January April
October July
Figure 1: Seasonal wind directions in Somalia
Background ____________________________________________________________________________
5
1.4 History of Climate and Meteorological Observations in Somalia This section presents the history of climatic and meteorological observations in Somalia. It is unfortunate that limited documentation was traced by the time this technical report was published. Most of the sources of the information contained in this report were acquired through interviews with local meteorological experts. In Somalia, rainfall data has been collected since the end of the nineteenth century. For example, rainfall records for Kismayo have been in existence since 1894. It appears that this could be the earliest weather station in the country. Other stations were located in the coastal areas where Italian and British colonizers settled at the turn of the twentieth century. In the 1920s a more concerted collection of rainfall data began. Despite lack of data collection continuity at some stations, most of Somalia was covered with rainfall stations. After independence in 1960, many of the old stations were strengthened. The Ministry of Agriculture then took over responsibility for the national weather monitoring network. Substantial amounts of data have since been located, especially rainfall data. There is evidence that the documentation was not up to date because the data that had been traced so far was obtained from different, not always reliable sources. Organisations that were involved in weather data collection included: The International Civil Aviation Organisation (ICAO), British Meteorological Office (BMO), and other then existing development foreign-aided projects. In 1990, when the civil war in Somalia intensified, the whole weather recording system collapsed and this saw the loss of valuable data and destruction of weather stations and other monitoring networks. In 1997 the FAO Food Security Analysis Unit (FAO-FSAU) in collaboration with some NGOs and UN agencies re-established a few more rainfall stations in Somalia with the hope of reviving the network of weather observations. Unfortunately this network did not last long due to lack of maintenance and prevailing insecurity. Since the civil war and especially at the times when Somalia was particularly hard-hit by drought and famine early warning activities in Somalia relied heavily on satellite data for rainfall estimates. In 2002, FAO Somalia Water and Land Information - SWALIM project started efforts to re-establish an integrated rainfall network throughout Somalia. This has been a welcome initiative which will generate essential ground data to supplement satellite predictions. Currently, through the partnership of local and international NGOs in southern Somalia over thirty, 24 hour manual rain gauges have been re-established and more are in the offing. In northern Somalia, SWALIM is currently working in close collaboration with the ministries of Agriculture in Puntland and Somaliland to re-establish the rainfall network. So far over 20 rain-gauge stations have been set up. Figure 2 shows the existing network of rainfall observations in Somalia. The network is maintained by FAO SWALIM in collaboration with other partners. Data from these stations is transmitted on a weekly basis or as requested by SWALIM via e-mail or telephone to its Nairobi office where the Somalia Climate archive is maintained comprising of

Background ____________________________________________________________________________
6
the pre-war and post war climate data. These data are shared between FAO-SWALIM offices in Somaliland, in Puntland, and in South Somalia. Regular update is also maintained. The network will continue to expand subject to certain constraints and the willingness and presence of other partners in this field. Climate data will be handed over to the Somali Government at a later date when all aspects of data use and acquisition have become stabilized.

Background ____________________________________________________________________________
7
Figure 2: Rainfall observation network in Somalia(April, 2007)

Climate Characteristics ____________________________________________________________________________
8
2. CLIMATE CHARACTERISTICS OF SOMALIA This chapter concentrates on the different weather elements and discusses their average conditions in Somalia. Different analyses pertaining to the weather elements have also been included in this chapter. 2.1 Data Availability The density of climate monitoring network in Somalia have never been good enough to support a meaningful analysis of weather in the country. However, many researchers have attempted to do so, using different datasets to indicate average conditions of the climate of Somalia. Most available datasets are characterised by large gaps of missing data. The outbreak of civil war in the early nineties made the situation worse. Attempts to carry out analyses have become difficult since then, due to the loss of important datasets as well as the collapse of monitoring networks. It must be recognised that it is only recently that SWALIM and other partner NGOs have been trying to revive the climate monitoring network. No significant weather observation was carried out between 1990 and 2004. The Somalia climate archive held within SWALIM contains data as far back as 1894 (for Kismayo) and 1904 (in Mogadishu). However, the information is characterised by huge periods where data is missing. Figure 3 shows some of the pre-war monitoring stations whose data has been included in this technical report. Some stations have been deliberately omitted because they have very large gaps of missing data, while others have so little data that the information is almost useless for climate analysis. In this analysis, the most recent consistent available data has been used, most of which has been extracted from the FAO global climate database for the period between 1963 - 1990. However, the database is missing information for some periods from some stations. In such cases missing data was extrapolated to improve the analysis. Although there is ongoing rainfall data collection in Somalia, attempts have not been made to use the set of data in this report because it cannot support meaningful analysis at this point. As the monitoring network continues to expand, more analysis will have to be carried out. The Inverse Distance Weighted Averaging (IDWA) Interpolation Method has been applied throughout this report to generate all climate maps, based on the assumption that the interpolating surface should be influenced most by the nearby points and less by the more distant points. A grid size of 9.5 km x 9.5 km was used for interpolation. IDWA is an averaging procedure. It gives each neighbouring station a weight which is proportional to a power of the inverse of the station distance. Thus, closer stations have more weight in the averaging procedure than stations that are further away. If the power exponent is large, closer stations get much more weight than stations that are further away. Therefore, with an increasing power exponent, IDWA converges to nearest neighbour interpolation. On the other hand, the smaller the exponent is, the further reaches the influence of each station. For exponents close to zero, the interpolated field becomes the area average with small spikes at

Climate Characteristics ____________________________________________________________________________
9
station locations. Note that if a station is very close to the grid point it gets nearly all the weight. If a grid point and station are at exactly the same location IDWA is not defined because of division by zero. However, this is not a problem as in the very close vicinity of a station New LocClim just gives the station value as the interpolation result. There are two fundamental theoretical disadvantages with IDWA. The first is that the theoretical continuous climate surface has locations (the stations themselves) where it is not differentiable. However, from a practical point of view this should not be taken too seriously. The second disadvantage is that the distribution of weights to the neighbouring stations depends only on the ratios of distances. This means, that scales do not play a role. IDWA does not distinguish the case where one station is 10m and the other 30m away from the case where one station is 100km and the other is 300km away. However, from a climatic point of view there is a tremendous difference which should be taken into account. All efforts have been considered to produce the best maps possible in this report, however it was not possible to eliminate the weights given to the stations using this interpolation method. The distribution of the data stations is a limitation. However, the interpolation will be repeated as the network gets better and more data continue to be collected in Somalia.

Climate Characteristics ____________________________________________________________________________
10
Figure 3: Historical weather monitoring network in Somalia

Climate Characteristics ____________________________________________________________________________
11
2.2 Rainfall Rainfall in Somalia is low and generally of erratic incidence. The prime cause of this variability is the overall descending motion of the air and the consequent low humidity. The country is also located at the leeward side of the Kenyan and Ethiopian highlands that subjecting it to further low rains. Based on the average annual rainfall pattern, the country has a desert to dry sub-humid climate. The rainfall is The Inter Tropical Convergence Zone (ITCZ) and the Somali jet largely influence the rainfall. It must be noted that orographic and coastal influences are also significant and cause a high degree of variability in the entire country. The mean Annual rainfall distribution in the county is as shown in Figure 4.

Climate Characteristics ____________________________________________________________________________
12
Figure 4: Mean annual rainfall distribution in Somalia
Climate Characteristics ____________________________________________________________________________
13
2.2.1 Temporal rainfall distribution in Somalia Somalia has a bimodal rainfall distribution, with two rainy seasons (Gu and Deyr). From the graphs shown in Appendix 1.1, it will be seen that timing of the seasons varies across the country. However, the first main rainy season (Gu) occurs in the period between March and July and the second rainy season (Deyr) from August to November. The months of highest rainfall within these seasons are generally from April-June and October-November. Two distinctive seasons dry of periods are also portrayed in the graphs - the Jilaal and Haggai which occur in December - March and July - August, respectively. As a general statement the following comments pertain to these seasons:
i) Jilaal – December to March. The northeast monsoon is in dominance and conditions are dry and relatively hot.
ii) Gu – April to June. A transitional period of relatively wet and hot conditions.
iii) Haggai - July to September. The southwest monsoon dominates bringing relatively cool conditions, with showers along the coast but dry inland.
iv) Deyr – October to November. Similar to Gu but with less rainfall
The Gu season dominates over the Deyr in quantity and reliability of rainfall and as such it is treated as the primary cropping season. The season begins at different times through out the country. In the areas bordering Kenyan, Middle Juba, northern parts of Middle Shabelle and the northwest most corner of the country, the Gu rains start as early as the second half of March. The rains then intensify in April all over the country. The north eastern coastline receives the least amount of rainfall during this season (Figure 5). Rainfall starts to reduce in June in most parts of the country save for the southern coastline which continues to receive a little but significant rains in the months of July and August. The Gu rains in the northern west parts of the country especially around Borama, Gebilley and Hargeisa, also extends thus to combine with the short rains which generally starts in September thus exposing the area to an apparent long continuous season (Appendix 1). From the spatial monthly distribution maps in appendix 2, it is evident that two main areas of rainfall exist i.e. the small pocket centred in Ceerigabo and larger areas covering the very northwest parts of Somalia excluding its coastline. This is due to the topography of the area.

Climate Characteristics ____________________________________________________________________________
14
Figure 5: Gu rainfall distribution in Somalia
Climate Characteristics ____________________________________________________________________________
15
The Deyr rains are usually shorter and less in quantity than the Gu rains (Figure 6). Generally the season starts in September, picks up in October and ends in November. However, this varies from place to place across the country. The Deyr rains are much small on the coast, and particularly in the southern most part of the country around Kismayo where there is no reliable increase in rainfall at the time of the Deyr. The spatial distribution of Deyr rains is similar to that of Gu but with comparatively less amounts. The Deyr rains in the North around Sheikh, Burco and Borama receives up to 200 mm of accumulated rainfall amount per year. The same areas favoured by the Gu rains in the south are also apparently favoured during the Deyr rains especially around Baidoa, North of Lower Juba and surrounding areas of middle Juba, and the upper parts of Lower Shabelle. In comparison, the Deyr rains provide for less amounts that the Gu rains across the whole country. The pattern of rainfall is similar in northern Somalia but there is a shorter gap between the Gu and Deyr seasons. The timing of the start of the Gu season is also variable, albeit being earlier on the plateau due to topographic influences. The Deyr season starts much earlier in the whole of the northern Somalia in comparison to the south as due to the movement of the ITCZ from the north. Rainfall in northern and central Somalia is considerably lower than in the south, with the exception of being in the Northern Plateau. There is also a marked contrast in rainfall between the plateau (Borama , Gebilley and Hargeisa) and the north coast (Berbera and Bosasso). Rainfall is rare at Berbera and Bosasso, but occurs more commonly during the Deyr than the Gu. The timings of the two main dry seasons in Somalia also vary greatly across the country. The main dry season is the Jilaal, occurring between December-March, when the ITCZ is far to the south. The secondary dry season, the Haggai, occurs between the Gu and Deyr rainy seasons. It extends from approximately July-September, but once again this varies across the country and significant rainfall occurs during this period along the coast (Afgoi, Genale and Mogadishu). This makes the distinction between seasons less defined in the coast. There is much more distinction between inland seasons, particularly those close to the Ethiopian border (at Belet Weyne, Huddur, Baidoa, Bardheere and Luuq), where rain rarely falls in January, February or June-September. Rare but heavy rainfall events can however occur during these months thus resulting in a high coefficient of variation.

Climate Characteristics ____________________________________________________________________________
16
Figure 6: Deyr rainfall distribution in Somalia

Climate Characteristics ____________________________________________________________________________
17
2.2.2 Spatial rainfall distribution in Somalia Higher rainfall areas occur in the middle and lower Juba and along the coastal area of the middle Shabelle (700–800 mm/year). Rainfall lessens further inland in the south, with the upper Shabelle River valley (Hiran and surroundings) receiving up to 400 mm/year while the area between Shabelle and the Juba River valleys receive relatively higher rainfall of about 500–700 mm/year. Annual rainfall decreases further in the north with the exception of areas around Sheikh, Hargeisa and Borama that receive between 500-600 mm/year. The areas around Ceerigavo receive up to 400 mm annually. The northern coastline is characterized by low rainfall of less than 100 mm/year. The same low rainfall is experienced around the inland areas of the north-eastern coast (Lasanod, Qardo and Scuscuban), while the rest of the northern regions and central Somalia receive an annual mean of 200-300 mm. The seasonal spatial distribution of rainfall in Somalia is shown in Appendix 2. From a review of the maps, the driest months are January to February countrywide, with little or no rainfall. In March a few places receive rainfall, especially to the west of the Juba valley and areas around Awdal and Galbeed, with monthly averages between 10-20 mm. During the months of April and May the whole country receives significant amounts of rainfall during the Gu rainy season. However, a small area of Sool around Lasanod is dry during this season. The southern coast and north-western regions receive some rainfall during the months of June to September before the peak of the Deyr season in October and November that are characterized by rains throughout the country. During the month of December only a little rainfall is seen around the southernmost parts of the country. Rainfall is well-correlated with elevation in northern Somalia, but this is not the case in the southern parts of the country. There is limited variation in elevation across southern Somalia, although higher ground occurs in inter-riverine areas. Elevations increase towards the Ethiopian border, but do not correspond to increases in rainfall. 2.2.3 Rainfall variability Of all the standard climatic parameters, rainfall is the most variable in time and space in Somalia. The amount of rainfall received across the country can vary dramatically from year to year, from dry periods that can persist for years, to periods of intense downpours and flooding. Together with temperature, temporal and spatial rainfall variability across the region influences the distribution of flora and fauna. Rainfall is also a key determinant of growing seasons and the types of agriculture practised, directly influencing surface runoff, stream flow, and groundwater recharge. Rainfall in Somalia varies from year to year. For example, during the period under consideration in this report (1963-1990), Afgoi had an annual mean rainfall of 584 mm. In 1977 it received a total of 800 mm of rainfall. Belet Weyne has a mean annual rainfall of 330

Climate Characteristics ____________________________________________________________________________
18
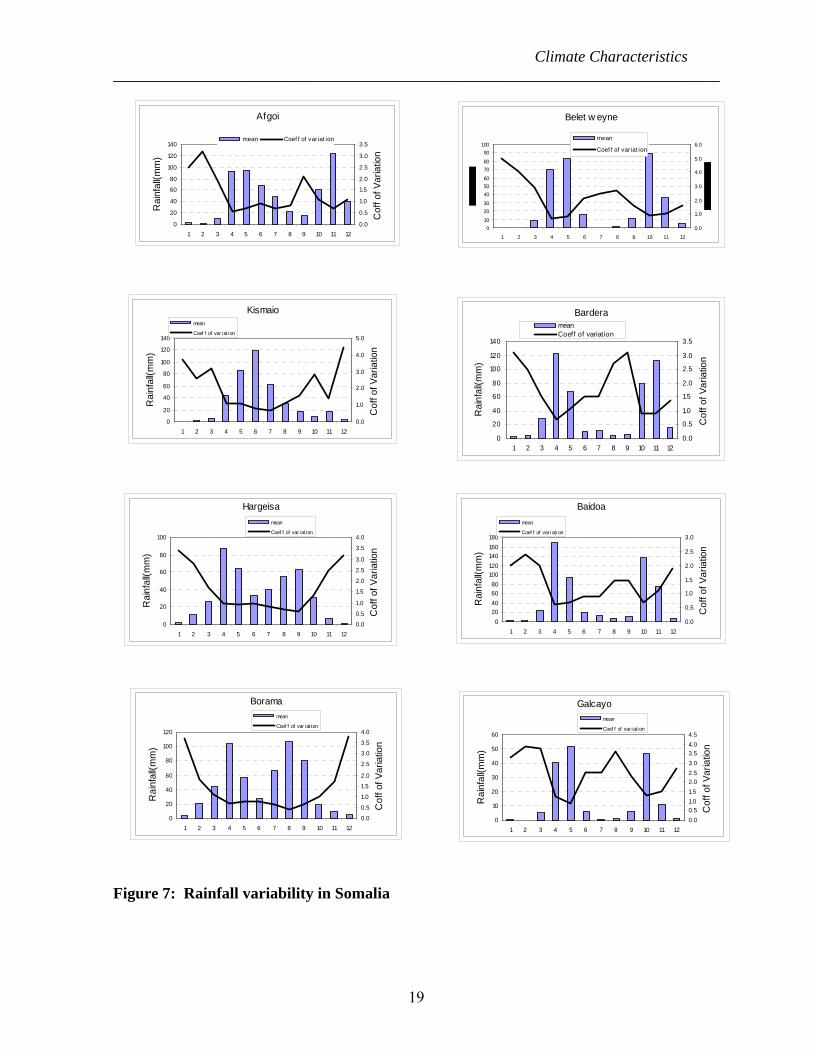
mm and the lowest recorded at this station within the period was 57 mm (1974) and the highest 660 mm (1981), i.e. twice the annual mean. Key weather stations used to show rainfall variability across the country were chosen from the south, central, and northern areas of the country. The coefficient of variation (Cv) was used to serve as a measure of rainfall variability. A high monthly Cv value indicates a high variability of rainfall and conversely for a low value of Cv. The higher the variability of rainfall in a month, the less dependable is the amount of rainfall given as the mean of that month. Therefore it should be noted Cv values could be used as a good guide in determining rainfall dependability at any given station in any given month. Generally, Somalia has very high values of Cv, implying low reliability of rainfall. However, the degree of variability varies across the country and from month to month as shown in figure 7. Borama and Hargeisa in the north as well as Mogadishu show less variability during April to September, while in the upper Shabelle valley the rainfall is less variable during the Deyr and Gu rainy seasons. At Kismayo and surroundings, rainfall is highly dependable during the Deyr season.
Climate Characteristics ____________________________________________________________________________
19
Figure 7: Rainfall variability in Somalia
Afgoi
0
20
40
60
80
100
120
140
1 2 3 4 5 6 7 8 9 10 11 12
Rai
nfal
l(mm
)
0.0
0.5
1.0
1.5
2.0
2.5
3.0
3.5
Cof
f of V
aria
tion
mean Coef f of variat ion
Belet w eyne
01020304050607080
90100
1 2 3 4 5 6 7 8 9 10 11 120.0
1.0
2.0
3.0
4.0
5.0
6.0mean
Coef f of var iat ion
Bardera
0
20
40
60
80
100
120
140
1 2 3 4 5 6 7 8 9 10 11 12
Rai
nfal
l(mm
)
0.0
0.5
1.0
1.5
2.0
2.5
3.0
3.5
Cof
f of V
aria
tion
meanCoeff of variat ion
Kismaio
0
20
40
60
80
100
120
140
1 2 3 4 5 6 7 8 9 10 11 12
Rai
nfal
l(mm
)
0.0
1.0
2.0
3.0
4.0
5.0
Cof
f of V
aria
tion
mean
Coef f of var iation
Baidoa
020406080
100120140160180
1 2 3 4 5 6 7 8 9 10 11 12
Rai
nfal
l(mm
)
0.0
0.5
1.0
1.5
2.0
2.5
3.0
Cof
f of V
aria
tion
mean
Coef f of var iation
Galcayo
0
10
20
30
40
50
60
1 2 3 4 5 6 7 8 9 10 11 12
Rai
nfal
l(mm
)
0.00.51.01.52.02.53.03.54.04.5
Cof
f of V
aria
tion
mean
Coef f of var iation
Borama
0
20
40
60
80
100
120
1 2 3 4 5 6 7 8 9 10 11 12
Rai
nfal
l(mm
)
0.0
0.5
1.0
1.5
2.0
2.5
3.0
3.5
4.0
Cof
f of V
aria
tion
mean
Coef f of var iation
Hargeisa
0
20
40
60
80
100
1 2 3 4 5 6 7 8 9 10 11 12
Rai
nfal
l(mm
)
0.0
0.5
1.0
1.5
2.0
2.5
3.0
3.5
4.0
Cof
f of V
aria
tion
mean
Coef f of var iation
Climate Characteristics ____________________________________________________________________________
20
2.3 Evapotranspiration Evapotranspiration data were obtained from the Global FAO Database. The data contains calculated mean monthly Potential Evapotranspiration (PET) values from 49 stations across the country for the same period under consideration as this report. Appendix 3 shows mean monthly PET values for the 49 stations that have been used. The spatial distribution of the stations is the same as in figure 2. The highest PET occurs around Berbera and Sheikh, with values ranging from 2 700 mm/yr to slightly over 3 000 mm/yr (Figure 8). The neighbouring regions of Berbera and Sheikh show relatively higher values both to the right and to the left, as is the case for the north-eastern coastline. Similar high values are noted in the most southern parts of the country south of Kismayo. The lowest PET occurs along the southern coastline of Middle Juba and Lower Shabelle. In central Somalia and further inland in southern Somalia, PET ranges from 1 500 mm/yr to 2 100 mm/yr. A band of higher PET values exist around Bardera and Luuq in Gedo region (2 100 to2 400 mm/yr). High temperatures throughout the country contribute to the high annual PET values, which are also influenced by winds. .
Climate Characteristics ____________________________________________________________________________
21
Figure 8: Mean annual PET distribution in Somalia

Climate Characteristics ____________________________________________________________________________
22
Within the year, PET varies from place to place all over the country. High PET values occur during the months of June to September in the north and from January to March in the south and central Somalia. Figure 9 shows the temporal distribution of PET across the country at chosen stations. The highest record was observed at Berbera (August, 448mm/month) and the lowest at Ceerigabo (November, 93mm/month) and at Jonte in the south (June, 97mm/month).
Figure 9: PET distribution for some selected stations
2.4 Water Balance Throughout the country, PET exceeds rainfall. Annual rainfall ranges from 0 - 800 mm while the annual PET ranges from 1 000 mm/yr to 3 010 mm/yr, causing a large water deficit throughout Somalia. On a monthly basis the situation is better, with some months having a surplus or near-surplus at some stations, for example Jilib, Mareere and Bur-Acaba in April and May. To determine water deficiency levels in these regions, the moisture deficit index (MDI) was evaluated for 49 stations in Somalia. MDI were determined on the basis of annual precipitation and annual PET as adapted by Thornthwaite and Mather (1955) which, while not reflecting the true nature of MDI for the purposes of crop production, does give information regarding the degree of aridity. Since this index is sometimes used as a criterion for crop planning, it would appear more appropriate for it to be based on precipitation and PET during
Seasonal Variation of PET in Somalia
0
60
120
180
240
300
360
420
480
1 2 3 4 5 6 7 8 9 10 11 12Month
PET(
mm
/Mon
th)
AFGOI BARDERA BERBERA BORAMA JONTE ERIGAVO
Climate Characteristics ____________________________________________________________________________
23
the crop growth period. The annual MDI for some stations across the country have been calculated and used to generate a map (Figure 10) The following formula (Thornthwaite) was used to calculate the MDI.
1001 xPERT
RMDI ⎟⎠⎞
⎜⎝⎛ −= (2.1)
Where R is the annual rainfall amount and PET is the Potential Evapotranspiration.
The map shows no area with a positive moisture index, which ranges from -100 to -50. Indeed, if PET is greater than the rainfall, crops must experience moisture stress and unless they receive irrigation, they will not grow. Two points must be borne in mind. First, crops do not grow annually, but PET is taken into account on an annual basis. Second, in crop production actual evapotranspiration is not expected to become equal to PET until a full canopy has been developed. This normally takes a fraction of the crop growth period. If these factors are not taken into consideration, a proper assessment of crop planning may be difficult. The monthly MDI for the eight stations are illustrated in appendix 4. In the south, some stations have positive MDI within the year, for example at Baidoa, Jilib and Jonte. In the north, the agricultural area only indicates situations of near positive MDI values, otherwise most of the country has negative MDIs through out the year. During wet seasons the MDI in most places ranged from -20% to -75%, indicating that available moisture may be enough for sowing and subsequent establishment of a crop but not necessarily for optimal growth if there was a full crop canopy. From the point of view of crop production, the moisture index for the period of crop growth provides a better picture than annual moisture indices. This information can be helpful in predicting whether a particular dry region is suitable for a single or double crop. However, one needs to know the moisture index at which the crop would be wilting, particularly during drought or in dry regions. This can be better explained by analysis of growing period lengths which is discussed in the next topic.

Climate Characteristics ____________________________________________________________________________
24
Figure 10: Moisture index distribution in Somalia

Climate Characteristics ____________________________________________________________________________
25
2.5 Length of Growing Period (LGP) The length of the growing period (LGP) as defined by FAO is the period (in days) during a year when precipitation exceeds half the potential evapotranspiration, plus a period required to transpire an assumed 100 mm of water from excess precipitation stored in the soil profile. It is a useful concept for calculating agricultural potential and can be used as a criterion for classifying areas and roughly determining crop cycle lengths. Calculation of the growing period is based on a simple water balance model, comparing precipitation with PET, using monthly values. A "normal" growing period has the following characteristics: Beginning: Coincides with the start of the normal rainy season and is taken as the date when precipitation equals half PET. A value of 0.5 PET has been chosen as water requirements of germinating seeds are well below the full rate of PET, reflected clearly in the magnitude of crop coefficients, and false starts to the rainy season are eliminated. Humid period: The period in which precipitation exceeds PET and during which crops are able to meet their full water requirements and the soil moisture deficit can be replenished. The end date of the humid period coincides with the end of the rainy season, and crops mature largely from water stored in the soil. End to the growing period: The point where the precipitation curve crosses the 0.5 PET curves, taking into consideration that most crops continue to grow beyond the end of the rainy season. Soil water-holding capacity is assumed to be 100 mm and the time taken to deplete the remaining soil reserves at the end of the season is added onto the LGP. In addition to a normal period, three other types of growing periods can be defined:
• Intermediate growing period - throughout the year, average monthly precipitation does not exceed the full rate of average monthly PET, but does exceed 0.5 PET. The beginning and ends of such intermediate growing periods are defined as the points where the precipitation curve crosses the 0.5 PET curves and there is no humid period.
• All year round humid growing period - the average monthly precipitation, for every month of the year, exceeds the full rate of the average monthly PET. Thus there is no true commencement of the growing or humid periods.
• All year round dry period - the average monthly precipitation for every month of the year is lower than half the average monthly PET. Areas with all-year dry periods have been inventoried separately as areas with a growing period of 0 days.
Characteristics used to describe growing periods are shown in Appendix 6. The length of growing period for Somalia has been calculated and is presented in Figure 10 for 49 stations throughout Somalia, with monthly1 rainfall (P) and potential evapotranspiration (PET) data. For each station monthly P/PET and P/0.5 PET are calculated and the number and lengths of normal and intermediate growing periods established.
1 Dekadal data, if available, would be more appropriate for a more accurate calculation of LGP.

Climate Characteristics ____________________________________________________________________________
26
A classification of all stations was made based on the number and length of intermediate2 growing periods and the length of the dry interval in the case of a bimodal rainfall pattern. For stations with a total GP of less than 30 days, further differentiation was made on the basis of mean annual rainfall and altitude3. Based on the classification, a legend was prepared for the LGP Map. Using the classification of the 49 stations as a reference and with topographic features as guidelines, mapping units were identified (Appendix 7). This is a somewhat arbitrary process and should be repeated and refined as and when more accurate data become available.
2 Most, if not all, growing periods in Somalia are of an intermediate nature. 3 Further differentiation was needed because the LGP characterization does not sufficiently highlight existing rainfall patterns and agricultural potential in some areas.

Climate Characteristics ____________________________________________________________________________
27
Figure 11: Length of growing period for Somalia

Climate Characteristics ____________________________________________________________________________
28
2.6 Air Temperature 2.6.1 Spatial and temporal variations of mean air temperature in Somalia Mean air temperatures are generally high throughout the year. Patterns of mean annual air temperature variation over Somalia are shown in figure 12. On this map, the main features of spatial temperature distribution are as follows: • In the south the temperature is highest inland, with Luuq in Gedo region near the border
with Ethiopia and Kenya having the highest mean temperature in Somalia of over 30°C. Temperatures along the southern coast are lower than those inland, due to the influence of cold ocean currents.
• The relative thermal uniformity prevailing in the south is distorted by the effects of altitude in the north, where temperature decreases with altitude giving a larger mean daily lapse rate of about 6°C per 1 000 m. It must however be noted that the lapse rate varies with season throughout the year, being larger in the dry season than in the wet season.
• Isotherms are more or less widely spaced in the south where the surface is more homogeneous, unlike in the north where they (isotherms) are relatively closer to each other, with a varied surface.

Climate Characteristics ____________________________________________________________________________
29
Figure 11: Mean annual temperature distribution

Climate Characteristics ____________________________________________________________________________
30
10
13
16
19
22
25
28
31
34
37
40
Jan Feb Mar Apr May Jun Jul Aug Sep Oct Nov DecMonth
Tem
pera
ture
(0 C)
Erigabo(North) Afgoi(south) Afmadow(South Belet Weyne(South) Bossaso(North) Berbera(North)
Average monthly temperatures reach 31-33°C in March around Bardheere, Luuq and Afmadow in the south; while the same can reach 36–38°C in the north around Berbera (see Appendix 8). Local communities in some areas have observed higher temperatures, however this has not been recorded and these observations have not been used in this report Southern Somalia is hottest in the months December - March. Temperatures are greatest at the Kenya, Somalia and Ethiopia borders (over 30°C), gradually decreasing towards the ocean (28°C). July and August are the coolest months in southern Somalia. The Somali low-level jet is coincidentally strongest over southern Somalia during this period, thus contributing to cooling effects in the region. The hottest weather in the north is experienced in the months June – September, especially around Awdal and Bossaso areas. The north becomes cooler in the months January - February. Appendix 9 shows the tabular mean annual temperatures for various stations in Somalia recorded between 1963-1990. The graph below (figure 13), compares temperature distribution between the south and the north, using selected stations from each area.
Figure 12: Temperature distribution at some selected stations

Climate Characteristics ____________________________________________________________________________
31
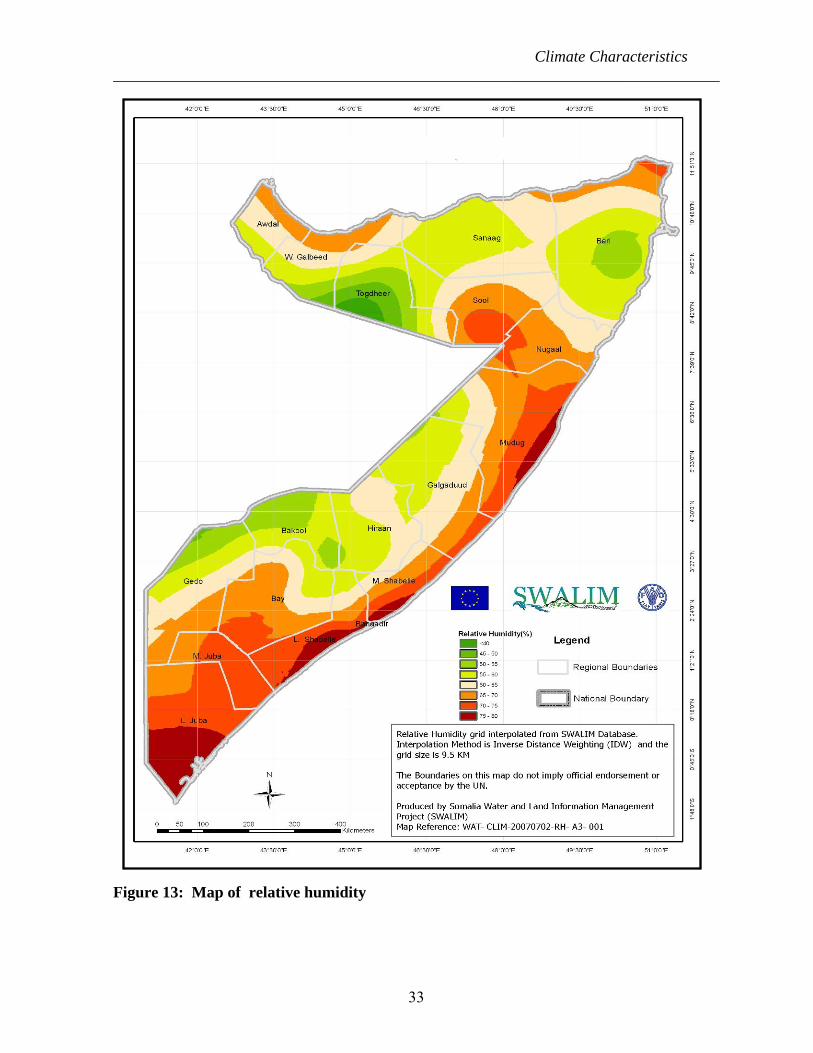
2.6.2 Mean maxima and minima temperatures Mean maximum and minimum temperatures in Somalia show a similar trend to that of the mean temperatures. The highest mean maximum value during the period 1963–1990) is 42° C in June and July at Berbera, and the lowest mean minimum temperature is 6°C at Ceerigavo in January (Appendices10 & 11). Greater contrasts between daily maximum and minimum temperatures occur inland compared to the coast, however these contrasts are generally small in comparison to those which might be expected for desert environments. Hutchinson and Polishchouk (1989) explain this by the relatively high humidity across the whole country. From mean monthly air temperature table in Appendix 12 it is evident that the range is highest inland and in the north than it is along the ocean, probably due to both the surface and the air being relatively drier in the north and inland. 2.7 Atmospheric Humidity Very few measurements of atmospheric humidity have been recorded in Somalia. The earliest records were made from the 1940s to the late 1950s, and therefore the Global FAO climate database does not have humidity data. Data used in this section was obtained from Polishchouck’s 1989 report, whose source is from three different agencies with conflicting figures. In Somalia the main source of humidity is the Indian Ocean in the east, the Juba and Shabelle rivers in the south and the Gulf of Aden in the north. Secondary sources include seasonal rivers and evapotranspiration from crops. The spatial distribution of the atmospheric humidity (figure 14) divides the country into three distinctive zones, namely:
• Southern areas • Western areas • Northern areas
Southern areas - are the southern and central coastline and lower reaches of the Juba and Shabelle Rivers. The relative humidity (RH) is higher in these regions, ranging from 70-80% on average. The RH is highest along the coastline, decreasing inland. During wet seasons (Appendix 13), the RH increases in these areas. RH is very high at stations near the coast, with little diurnal variation (Polishchouk, 1988).
Western area - the west of the southern and central parts of the country, from Gedo, upper Bakool, Hiraan and Galgadud regions. These areas are located along the lee of the Ethiopian-Kenyan mountain range, which is a zone of divergence (Polishchouck, 1988). Oceanic air seldom reaches these regions. During the passage of the ITCZ over the region, air becomes wetter and the RH rises steeply (see stations Luuq, Belet Weyne, Huddur and El bur).
Northern areas - RH in the northern areas is relatively low apart from the northern coastline that has relatively higher RH values (65-70%). The lowest values in the country occur in these areas at Togdheer (about 40%). Moisture conditions increase during the wet season but by a
Climate Characteristics ____________________________________________________________________________
32
small percentage. The permanent strong, dry wind from the Arabian Peninsula influences atmospheric moisture over these regions, in particular a very strong and dry wind during June to September named kharif contains an air mass of very low moisture content.
It must be noted that due to temperature variations in the country, RH is not a very good indicator of actual moisture in the air. Records of dewpoint or vapour pressure are preferred to RH. The few records that exist for dewpoint indicate a similar trend as the RH discussed above.
Climate Characteristics ____________________________________________________________________________
33
Figure 13: Map of relative humidity

Climate Characteristics ____________________________________________________________________________
34
2.8 Wind In Somalia, wind is a response to the north and south transition of the ITCZ and particularly the ITF. In the north, wind speed and wind direction are influenced by the varied topography. Data used for wind speed in this discussion were obtained from the FAO database, while data for wind direction were obtained from earlier studies of unknown period and verbal communication with Somali locals. 2.8.1 Wind speed The general pattern of wind speed in Somalia is shown in Figure 15. Wind speeds are generally between 0.2-8.5 m/s on average. Values do however vary greatly within the year and between seasons. Hargeisa has the highest average value of 17 m/s in July. Low wind speed values (0.2-4 m/s) are observed for most parts of southern Somalia with exception of areas south of lower Juba (8-10 m/s). Temporal wind distribution across Somalia is provided in Figure 16, which shows that wind patterns are similar for both the southern and northern parts of the country. Wind speeds are strongest during the south-westerly monsoon (June to August). In the northwest the gradual increase in wind speeds in May and June is notable, coinciding with the period when the ITF passes northwards. The decrease is also noted in September and October when the ITF crosses to the south. From the graph, the winds in the northern parts of the country (Hargeisa, Berbera and Iscusiban) are much stronger than in the south (Mogadishu, Luuq and Kismayo) especially during the Haggai season. On average, the lowest values of wind speed occur in April and October/November in the country, coinciding with the peaks of the two rainy seasons (Gu and Deyr) respectively.

Climate Characteristics ____________________________________________________________________________
35
Figure 14: Wind speed distribution

Climate Characteristics ____________________________________________________________________________
36
0
2
4
6
8
10
12
Jan feb mar Apr May Jun Jul Aug Sep Oct Nov Decmonth
win
dspe
ed(m
/s)
SCUSCIUBAN
HARGEISA
BERBERA KHISMAIO
MOGADISCIO
LUG-GANANE
Figure 15: Wind speed at selected stations

Climate Characteristics ____________________________________________________________________________
37
2.8.2 Wind direction In January the ITF is well to the south of the country and the winds blow persistently from the northeast with some easterlies and northerlies all over Somalia.
In March the ITF enters Somalia and the north-easterlies begin to veer from northeast through east to southeast.
In April the process mentioned above continues, the areas south of 8°N experiencing south-easterlies apart from lower Juba, which experiences winds veering from the southeast to southwest. Winds in areas north of 8°N are still from the northeast although local conditions may cause variations in wind direction.
In June the ITF has left Somalia and south-westerlies start to form.
In July, south-westerlies prevail almost everywhere in the country. However, due to macro-scale patterns over the ocean the very southern parts of the country experience southerly rather than south-westerly winds.
In October the ITF retreats through the north of the country between 10-11°N. The northern coastal strip experiences a return of the north-easterlies while in the rest of the country the winds are south-westerly to southerly ahead of the ITF.
In November and December, the same pattern is repeated as the ITF passes southwards.

Climate Classification ____________________________________________________________________________
38
3. CLIMATE CLASSIFICATION 3.1 Introduction In this chapter emphasis is put on patterns of spatial variation in climate. Although no two areas have identical climates, it is possible to define areas where climates are broadly uniform. Such an area is referred to as a climate zone. The climate of a region is the synthesis of all climate elements in a unique combination determined by the interplay of climatic processes. There is therefore a wide variety of climatic patterns prevailing on the earth’s surface. Climatic classification emerges from the need to synthesize and group similar climatic elements into climatic types from which climatic zones can be mapped. Climate classification for Somalia is not easily achieved. Problems arise from the inadequacy of existing climatic data both in terms of coverage, duration, and reliability. Climate is also dynamic and fluctuates and varies over time. Since the outbreak of civil war in Somalia in the early nineties, no climate data has been collected. This limits climate analysis to pre-war data over a decade old. Analysis would have been more meaningful if the most recent data had been used, as available data had limitations in that only a few weather elements were available for analysis. Any classification of climate depends to a large extent on the purpose of the classification. For instance, classification for the purpose of establishing airports and airstrips in areas where flying conditions need to be known, would differ considerably from a classification used for establishing the limits of potential crop-growing areas. This chapter attempts to classify the climate of Somalia using three different classifications, namely:
• Koppen classification • Thornthwaite classification • FAO climate classification
3.2 Koppen Classification Method Climatic zones of the world were first classified by Vladimir Koppen in 1918 and have been updated as new sources of information became available. Based on the concept that native vegetation is the best expression of climate, climate zone boundaries were selected with vegetation distribution in mind. It combines average annual and monthly temperatures, precipitation and seasonality of precipitation. The Koppen climate classification scheme divides climates into five main groups and several types and subtypes. Each particular climate type is represented by a two to four-letter symbol:

Climate Classification ____________________________________________________________________________
39
3.2.1 Group A: Tropical/Mega-thermal climates Tropical climates are characterized by constant high temperatures (at sea level and low elevations); all months of the year have average temperatures of 18°C or higher. They are subdivided as follows: • Tropical rain forest climate (Af): All twelve months have average precipitation of at
least 60 mm. This climate usually occurs within 5-10° latitude of the Equator.
• Tropical monsoon climate (Am): This type of climate is most common in southern Asia and west Africa and results from monsoon winds which change direction
according to the seasons. This climate has a driest month with rainfall less than 60 mm but more than 100 mm (total annual precipitation mm).
• Tropical wet and dry or savannah climate (Aw): This climate has a pronounced dry season with the driest month having precipitation less than 60 mm and also less than 100 (total annual precipitation mm).
3.2.2 Group B: Dry (arid and semi-arid) climates This climate is characterized by precipitation less than potential evapotranspiration. The threshold is determined as follows: • To find the precipitation threshold (in millimetres), multiply the average annual
temperature in °C by 20, then add 280 if 70% or more of the total precipitation is in the high-sun half of the year (April through September in the Northern Hemisphere, or October through March in the Southern), or 140 if 30-70% of the total precipitation is received during the applicable period, or 0 if less than 30% of the total precipitation is so received.
• If the annual precipitation is less than half the threshold for Group B, it is classified as BW (desert climate). However, if it is less than the threshold but more than half the threshold it is classified as BS (steppe climate).
• A third letter can be included to indicate temperature. An ‘h’ signified low latitude climate (average annual temperature above 18°C) while a ‘k’ signified middle latitude climate (average annual temperature below 18°C).
• Sometimes a fourth letter is added to indicate if either the winter or summer is wetter than the other half of the year. To qualify, the wettest month must have at least 60 mm of average precipitation if all twelve months are above 18°C, or 30 mm (1.18 inches) if not; plus at least 70% of the total precipitation must be in the same half of the year as the wettest month - but the letter used indicates when the dry season occurs, not the "wet" one.

Climate Classification ____________________________________________________________________________
40
3.2.3 Group C: Temperate/meso-thermal climates This climate has an average temperature above 10°C in their warmest months and a coldest month average between −3°C and 18°C.
3.2.4 Group D: Continental/micro-thermal climate This climate has an average temperature above 10°C in their warmest months and a coldest month average below −0°C.
3.2.5 Group E: Polar climates This climate is characterized by average temperatures below 10°C in all twelve months of the year. From the above definitions and discussions in previous chapters, Somalia’s climate falls under Category B (dry-arid and semi-arid climates) as rainfall is everywhere less than evapotranspiration. Using Koppen’s definition Somalia’s climate may be classified into three zones: BW "desert" - defined as a desert due to average precipitation being less than half of potential evaporation. Annual mean temperature exceeds 180 C. This actually covers the largest extent of the country (figure 17). Annual rainfall in these regions does not exceed 300mm/yr. BS - general steppe climate with some months. BSh "Steppe warm" - precipitation is less than but more than half of PET. Average temperature greater than 18°C. Steppes have considerable amounts of low-growing vegetation. Found in southern Somalia except bordering Ethiopia, and in northern Somalia around Sheikh and Burao. Hot, despite relatively high mean annual rains ranging from 500-800 mm/yr. BSk “Steppe cold” - average temperatures less than 18°C. Occur in the highlands of the northern part of the country around Ceerigabo which is the coldest place.

Climate Classification ____________________________________________________________________________
41
Figure 16: Koppen climate classification in Somalia
Climate Classification ____________________________________________________________________________
42
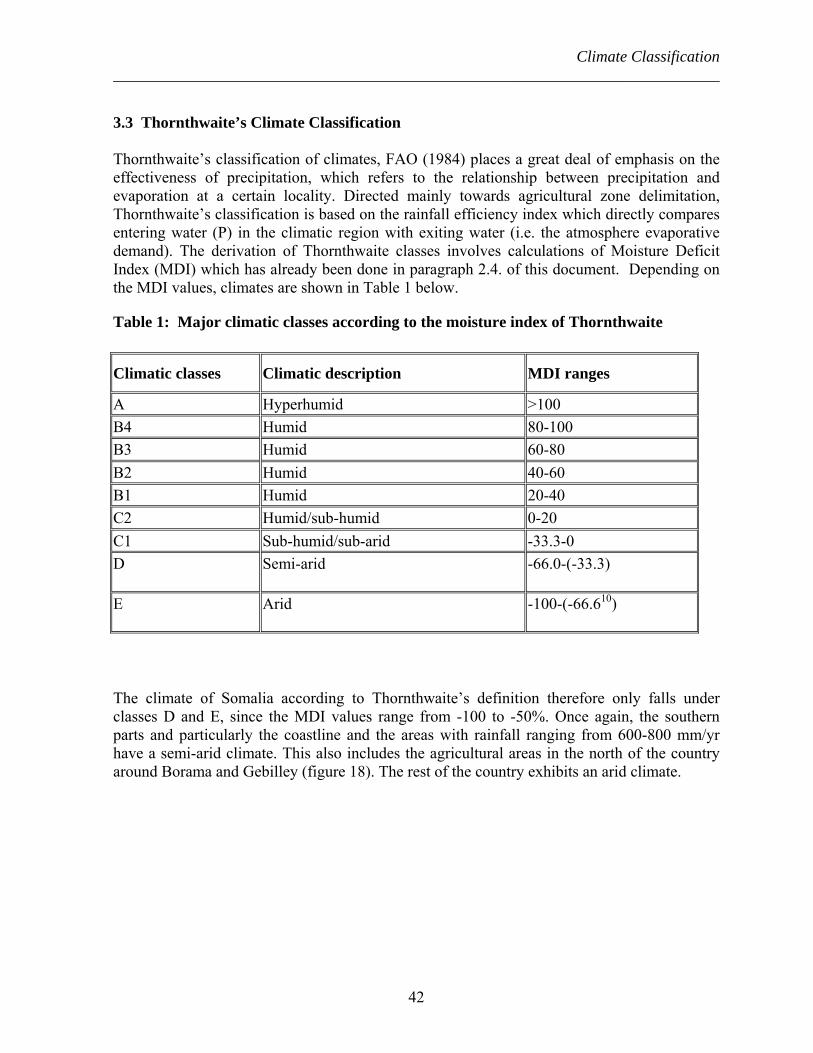
3.3 Thornthwaite’s Climate Classification Thornthwaite’s classification of climates, FAO (1984) places a great deal of emphasis on the effectiveness of precipitation, which refers to the relationship between precipitation and evaporation at a certain locality. Directed mainly towards agricultural zone delimitation, Thornthwaite’s classification is based on the rainfall efficiency index which directly compares entering water (P) in the climatic region with exiting water (i.e. the atmosphere evaporative demand). The derivation of Thornthwaite classes involves calculations of Moisture Deficit Index (MDI) which has already been done in paragraph 2.4. of this document. Depending on the MDI values, climates are shown in Table 1 below.
Table 1: Major climatic classes according to the moisture index of Thornthwaite
The climate of Somalia according to Thornthwaite’s definition therefore only falls under classes D and E, since the MDI values range from -100 to -50%. Once again, the southern parts and particularly the coastline and the areas with rainfall ranging from 600-800 mm/yr have a semi-arid climate. This also includes the agricultural areas in the north of the country around Borama and Gebilley (figure 18). The rest of the country exhibits an arid climate.
Climatic classes Climatic description MDI ranges
A Hyperhumid >100 B4 Humid 80-100 B3 Humid 60-80 B2 Humid 40-60 B1 Humid 20-40 C2 Humid/sub-humid 0-20 C1 Sub-humid/sub-arid -33.3-0 D Semi-arid -66.0-(-33.3)
E Arid -100-(-66.610)

Climate Classification ____________________________________________________________________________
43
Figure 17: Thornthwaite climate classification map for Somalia

Climate Classification ____________________________________________________________________________
44
3.4 FAO Eco-climate Classification
The FAO Eco-climate classification; adopted in 1981, is intended to take into consideration the whole body of available information that would present to the ecologist and agriculturalist a simple but accurate means to better understanding of the complex features of a developing continent.
The classification for Inter-tropical Africa uses the primary criteria of:
i) Rainfall distribution patterns ii) Annual precipitation iii) Annual distribution of rainfall (numbers of dry & rainy months) iv) Temperatures (occurrence of frost) v) Land use (pastures, crops, forest) vi) Nature of crops vii) Livestock species and breeds viii) Distribution of tsetse flies
According to the rainfall distribution, four classes are possible:
a. Simple rainy season/one dry season b. Two rainy seasons/two dry seasons c. No rainy season/permanent drought d. No dry season/permanent rains
It is not possible to classify criteria iv) and vii) in Somalia, but the rest are possible. However, in this document only rainfall distribution will be considered due to a lack of information on other categories. Detailed classification might be carried out later when there is improved data on land uses, tsetse distribution and types of crops.
Figure 19 indicates the major climatic zones of Somalia. Based on the annual rainfall, a distinction can be made between 4 major climatic zones for Somalia as shown in Table 2 below.
Table 2 - Major climatic zones for Somalia
Climatic Zone Annual Rainfall (mm) Wet period (months) Vegetation*Desert less than 100 0-1 Little or no vegetation Arid 100-400 1-3 Some scrub, some grassland
Semi-arid 400-600 3-4 Scrub & bushes, grassland Sub - humid 600-1200 4-6 Bushes to woodland, grassland
* this is general for any area

Climate Classification ____________________________________________________________________________
45
Desert and arid areas In desert and arid areas, irrigation is absolutely essential for crop growth. In these areas the wet period is maximum of three months. Even when water is stored in the root zone during the wet period and used later by plants, it is still not enough to obtain a good harvest. In addition, rainfall is unreliable in desert and arid regions - in one year there might be a lot of rainfall, the next year there may be only a little. On top of that, rainfall usually comes in heavy showers resulting in high water losses due to runoff. Semi-arid areas Even in semi-arid areas, irrigation is indispensable for reliable, good harvests. Some drought-resistant crops such as sorghum and millet may give reasonable yields, but there is still a risk of unreliable rainfall and subsequent crop failure. Sub-humid In the sub-humid and moist sub-humid areas, irrigation is required only during the dry season. In principle, on a yearly basis there is a rainfall excess as yearly rainfall is higher than yearly evapotranspiration. During the rainy season it may even be too wet for crops such as sorghum and millet.
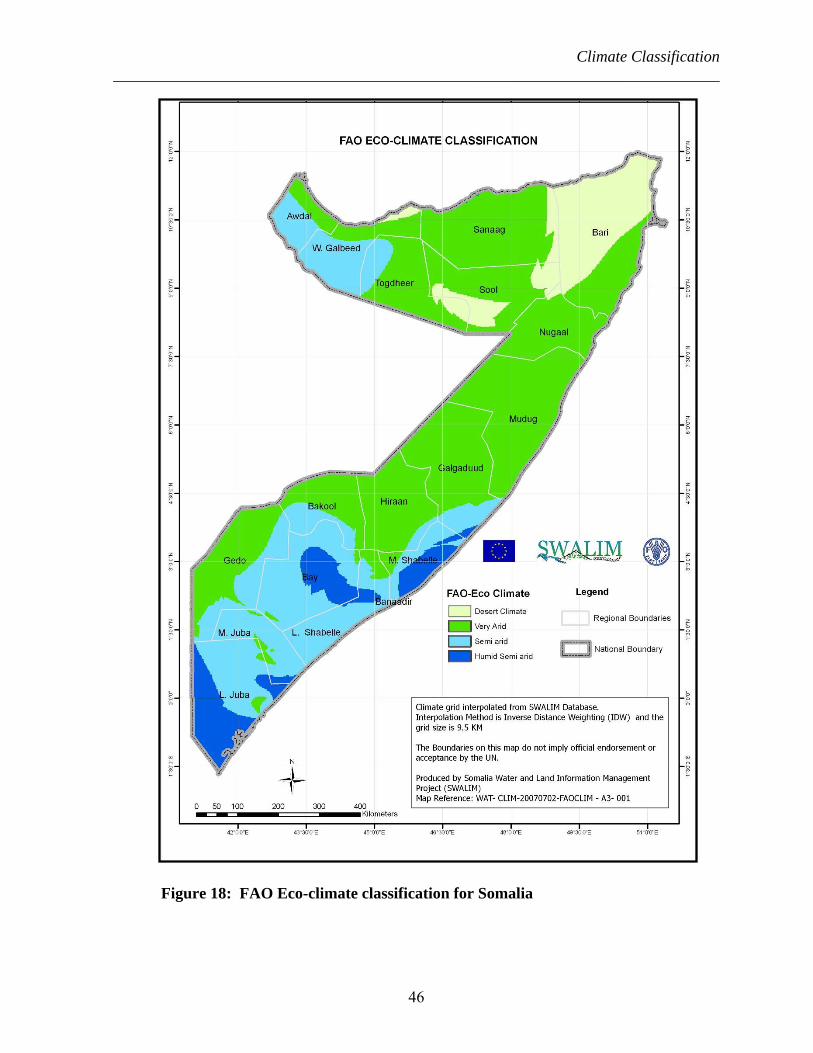
Climate Classification ____________________________________________________________________________
46
Figure 18: FAO Eco-climate classification for Somalia

Bibliography ____________________________________________________________________________
47
Bibliography FEWS – Ministry of Food and Agriculture somalia 1986 - 1988 Daily, Monthly and Annual Rainfall for Somalia Technical Reports
Griffiths J.F (1972) Climates of Africa
Hacrow and partners (1980) Northern Rangeland development project- hydrology report
Heather Musgrave (2002) Drought and Hydrological variability in Southern Somalia
Hunt John A. (1951) A General Survey of the Somaliland Protectorate 1944-1950
Hunting technical services (1983) Bay Regional Agricutural development project Vol I - III
Lahmeyer Int. (1986) Shabelle Water Strategy(Vol 1-3)
Lockwood Surveyor CR (1968) Agricultural and water surveys (Vol 1,2 and final report)
Macfadyen W. A., (1950) Water Supply and Geology of Parts of British Somaliland
Meteorological service -Somalia (1986) Climatological data, tables of monthly means 1954-1980
P.Hutchinson, O. Polishchouk (1989) The Agroclimatology of Somalia
WMO (1990) Daily Rainfall and Decadal Rainfall of somalia (1980 - 1990)
C.R.Print (1996) Rainfall, Environment and Water Resources Development in Somaliland and Sahel

Appendices ____________________________________________________________________________
48
APPEDICES Appendix 1: Temporal rainfall distribution in Somalia
Afgoi
020406080
100120140
1 2 3 4 5 6 7 8 9 10 11 12
Rai
nfal
l(mm
Balad
020406080
100120
1 2 3 4 5 6 7 8 9 10 11 12
Rai
nfal
l(mm
)
Bardera
020406080
100120140
1 2 3 4 5 6 7 8 9 10 11 12
Rai
nfal
l(mm
)
Belet Weyne
0
20
40
60
80
100
1 2 3 4 5 6 7 8 9 10 11 12
Rai
nfal
l(mm
)
Genale
0
20
40
60
80
100
1 2 3 4 5 6 7 8 9 10 11 12
Rai
nfal
l(mm
)
Jowhar
0
20
4060
80
100
120
1 2 3 4 5 6 7 8 9 10 11 12
Rai
nfal
l(mm
)
Luuq
0
20
40
60
80
100
1 2 3 4 5 6 7 8 9 10 11 12
Rai
nfal
l(mm
)
MOGADISHU
0
20
40
60
80
100
1 2 3 4 5 6 7 8 9 10 11 12
Rai
nfal
l(mm
)
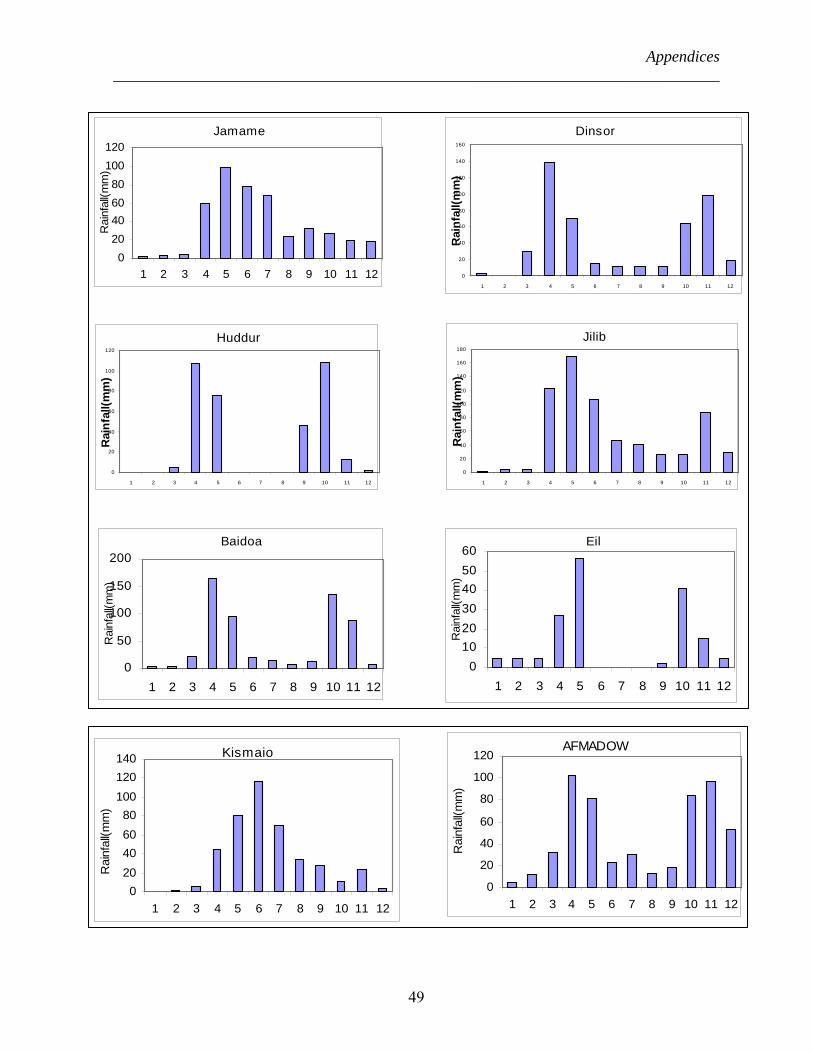
Appendices ____________________________________________________________________________
49
AFMADOW
0
20
40
60
80
100
120
1 2 3 4 5 6 7 8 9 10 11 12
Rai
nfal
l(mm
)
Kismaio
020406080
100120140
1 2 3 4 5 6 7 8 9 10 11 12
Rai
nfal
l(mm
)
Dinsor
0
20
40
60
80
100
120
140
160
1 2 3 4 5 6 7 8 9 10 11 12
Rai
nfal
l(mm
)
Eil
0102030405060
1 2 3 4 5 6 7 8 9 10 11 12
Rai
nfal
l(mm
)
Huddur
0
20
40
60
80
100
120
1 2 3 4 5 6 7 8 9 10 11 12
Rai
nfal
l(mm
)
Baidoa
0
50
100
150
200
1 2 3 4 5 6 7 8 9 10 11 12
Rai
nfal
l(mm
)
Jilib
0
20
40
60
80
100
120
140
160
180
1 2 3 4 5 6 7 8 9 10 11 12
Rai
nfal
l(mm
)
Jamame
020406080
100120
1 2 3 4 5 6 7 8 9 10 11 12
Rai
nfal
l(mm
)

Appendices ____________________________________________________________________________
50
Alula
01234567
1 2 3 4 5 6 7 8 9 10 11 12
Rai
nfal
l(mm
)
Las-anod
0
10
20
3040
50
60
1 2 3 4 5 6 7 8 9 10 11 12
Rai
nfal
l(mm
)
Qardo
05
101520253035
1 2 3 4 5 6 7 8 9 10 11 12
Rai
nfal
l(mm
)
Scusciub
0
5
10
15
20
25
1 2 3 4 5 6 7 8 9 10 11 12
Rai
nfal
l(mm
)
El-bur
0
10
20
30
40
50
60
1 2 3 4 5 6 7 8 9 10 11 12
Rai
nfal
l(mm
)
Capo-Guadaffi
05
101520253035
1 2 3 4 5 6 7 8 9 10 11 12
Rai
nfal
l(mm
)
Bulo-burti
0
20
40
60
80
100
1 2 3 4 5 6 7 8 9 10 11 12
Rai
nfal
l(mm
)
Brava
0
20
40
60
80
100
120
1 2 3 4 5 6 7 8 9 10 11 12
Rai
nfal
l(mm
)
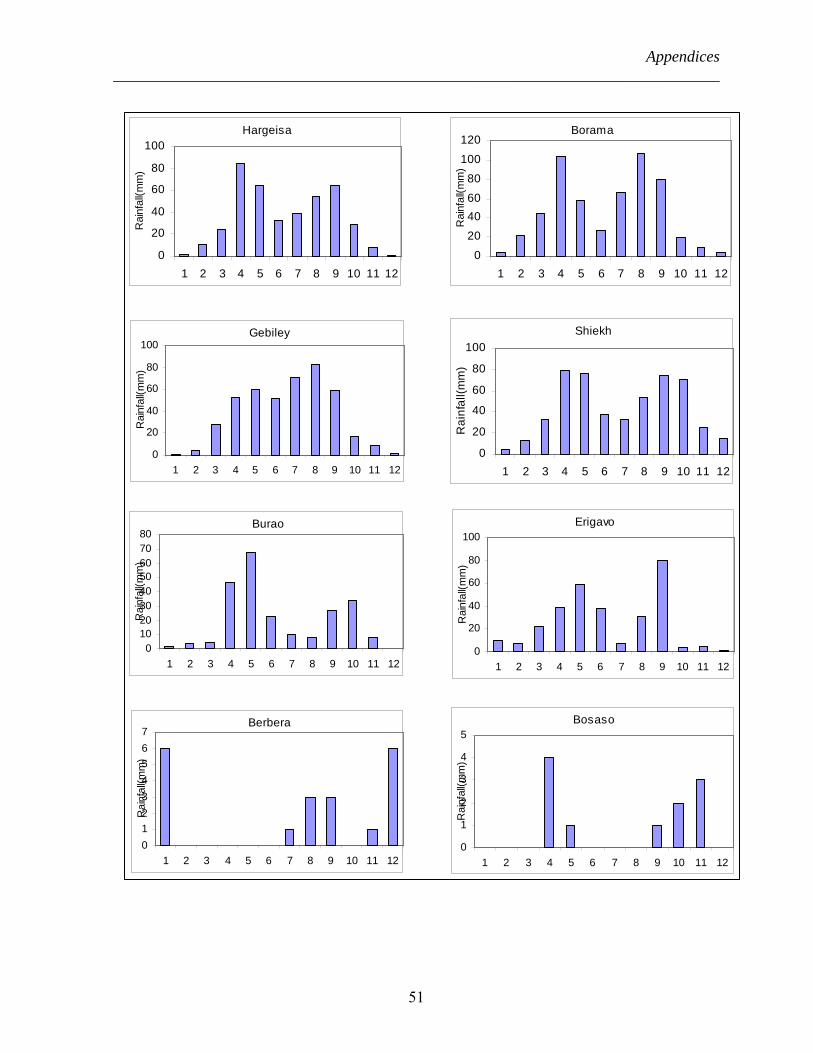
Appendices ____________________________________________________________________________
51
Berbera
01234567
1 2 3 4 5 6 7 8 9 10 11 12
Rai
nfal
l(mm
) Borama
0
20
4060
80
100
120
1 2 3 4 5 6 7 8 9 10 11 12
Rai
nfal
l(mm
)
Bosaso
0
1
2
3
4
5
1 2 3 4 5 6 7 8 9 10 11 12
Rai
nfal
l(mm
)
Burao
01020304050607080
1 2 3 4 5 6 7 8 9 10 11 12
Rai
nfal
l(mm
)
Erigavo
0
20
40
60
80
100
1 2 3 4 5 6 7 8 9 10 11 12
Rai
nfal
l(mm
)
Gebiley
0
20
40
60
80
100
1 2 3 4 5 6 7 8 9 10 11 12
Rai
nfal
l(mm
) Hargeisa
0
20
40
60
80
100
1 2 3 4 5 6 7 8 9 10 11 12
Rai
nfal
l(mm
)
Shiekh
0
20
40
60
80
100
1 2 3 4 5 6 7 8 9 10 11 12R
ainf
all(m
m)

Appendices __________________________________________________________________________________________________________
52
February
Appendix 2: Seasonal distribution of rainfall
January
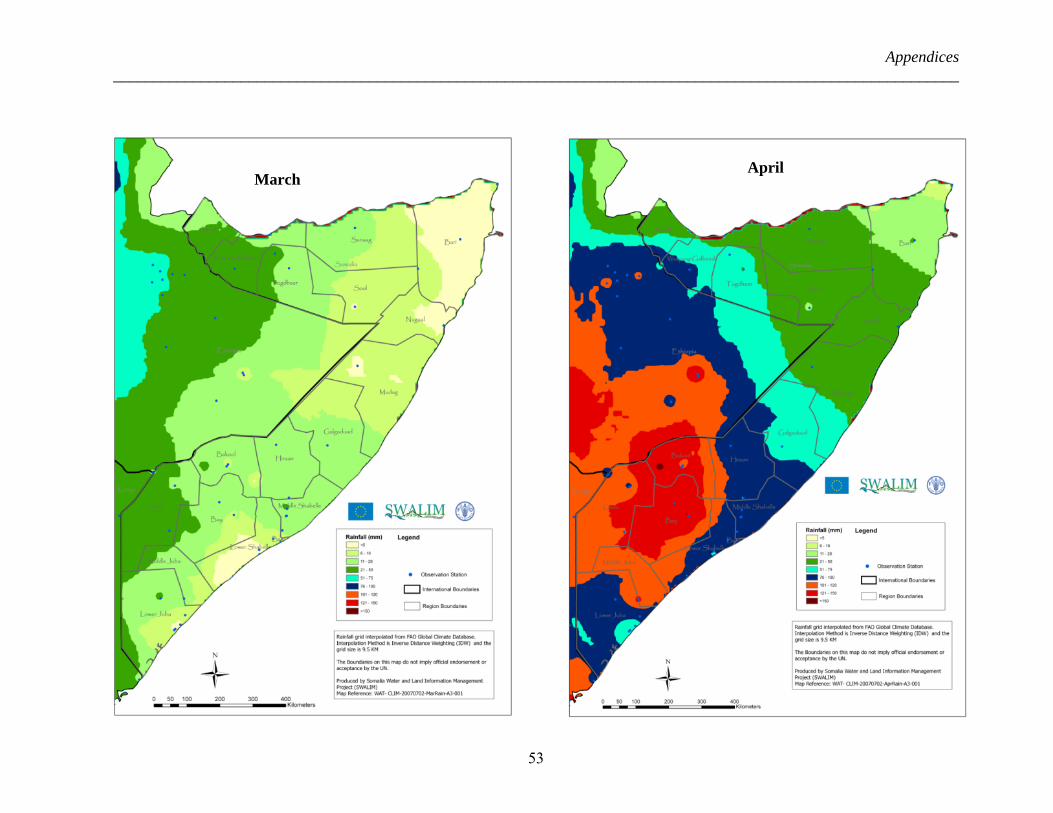
Appendices __________________________________________________________________________________________________________
53
March April

Appendices __________________________________________________________________________________________________________
54
May June

Appendices __________________________________________________________________________________________________________
55
July August
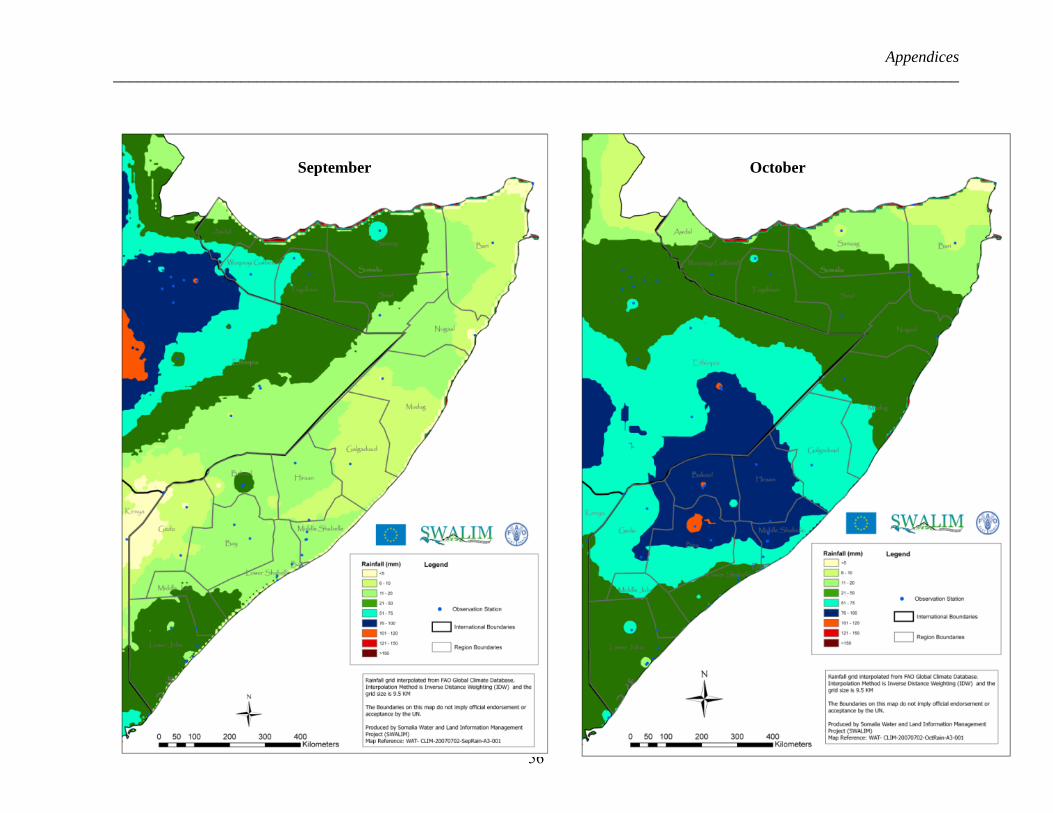
Appendices __________________________________________________________________________________________________________
56
September October
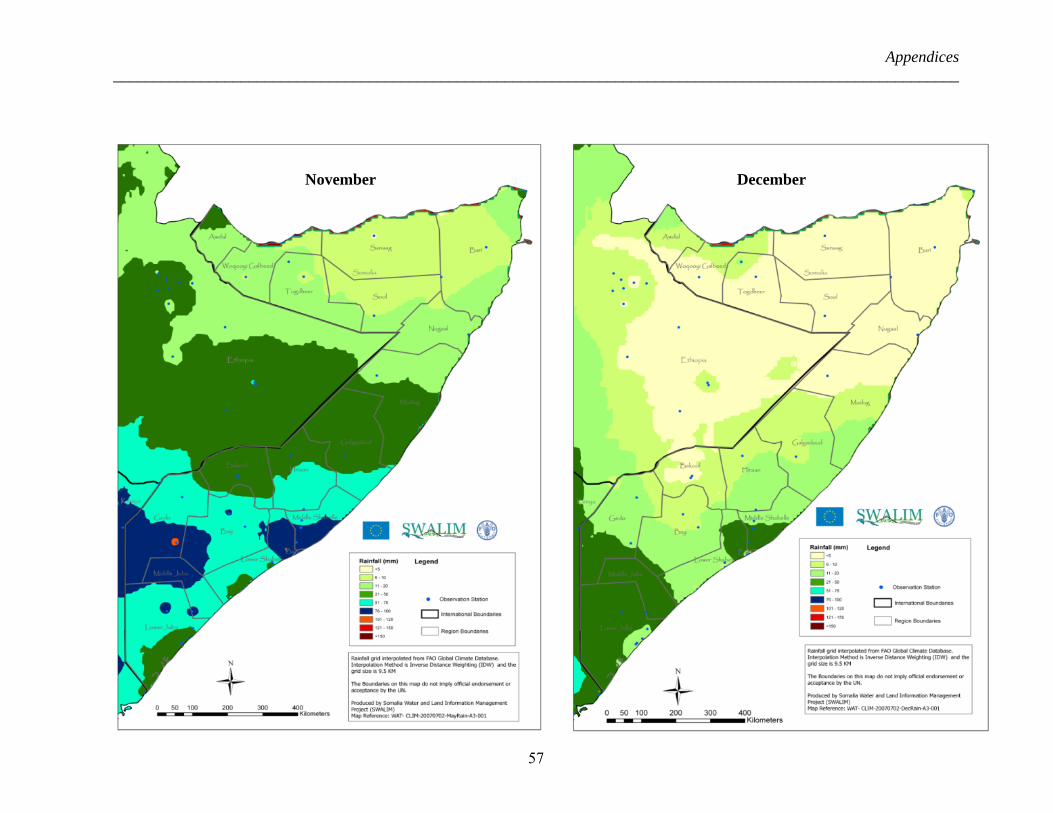
Appendices __________________________________________________________________________________________________________
57
November December

Appendices
____________________________________________________________________________
58
Name Lon Lat Alt JAN FEB MAR APR MAY JUN JUL AUG SEP OCT NOV DECAfgoi 45.13 2.13 83 172.3 161.4 184.3 151.6 134.9 118.5 137.4 143.2 154.2 150.5 135 153 Afmadu 42.06 0.51 29 168.8 153.7 170.5 133.2 124.5 120.5 120.3 131.9 144 137.4 127.5 134.5 Alessandra 42.70 0.50 25 153.6 148 170.7 129.7 121.1 101.9 104.4 116.3 126.6 129.9 117.1 131.6 Alula 50.75 11.96 6 119.4 122.4 153.1 151.7 180.3 244.8 289.7 265.7 224.4 142.9 92.7 107.3 Balad 45.38 2.36 95 139.8 134.9 158.8 144.1 138.5 121.6 125.7 129.8 129.5 140.2 130.6 134.9 Bardera 42.30 2.35 116 199.9 173.6 190.7 141.9 154.1 157.4 158.5 169.1 177.2 151.2 144.7 158 Barro-uen 45.50 2.86 104 148.4 151.8 169.9 137.8 128.9 110.7 112.2 123.6 133.7 137.4 131.5 143.9 Belet-uen 45.21 4.70 173 158.9 157.3 161.4 138.7 138.1 146.3 142.9 154.8 165.1 138.5 130.3 145.5 Berbera 45.03 10.43 89 156.3 142.1 165.4 172.5 224 408.4 437.8 439.8 310 204.2 166.8 149.9 Borama 43.18 9.93 1454 102.1 94.6 116.2 115 120.8 111.2 105.4 109.3 108.5 108 104.7 105.7 Bosaso 49.18 11.28 6 119.4 122.4 153.1 151.7 180.3 244.8 289.7 265.7 224.4 142.9 92.7 107.3 Brava 44.03 1.10 6 128.9 113.2 134.9 128.6 123.6 109.6 113 119.7 119.2 121.7 118.7 125.8 Bulo-burti 45.56 3.25 158 179.1 180.5 208.2 170.1 152.9 152.3 150.7 160.1 171.5 157.2 152.2 160.7 Bur-acaba 44.06 2.78 194 163.6 156.1 172 137 125.2 118.8 108.9 123.2 130.9 118.5 119.6 136.3 Burao 45.56 9.51 1032 156.3 142.1 165.4 172.5 224 408.4 437.8 439.8 310 204.2 166.8 149.9 Burdhuxul 43.30 4.10 400 166.3 167 182.1 169.3 148.4 165 167.4 176.2 175.8 141.1 134.2 148.4 Capo-guard 51.25 11.81 244 151.5 131.3 174.5 180.3 240.2 279.5 273.1 276.9 255.5 183 144.4 149.3 Dinsor 42.98 2.41 280 199.9 173.6 190.7 141.9 154.1 157.4 158.5 169.1 177.2 151.2 144.7 158 Eil 49.78 7.95 36 155.7 136.1 166.9 166.5 188 228.9 195.4 214.8 211.8 167.3 130.5 131 El-bur 46.61 4.68 175 159.7 156.3 183.1 145.2 144.6 132.7 145.6 161.3 175.7 144.4 130.3 142.3 El-mugne 44.76 1.71 12 132.9 115.3 136.8 123.8 119.2 107.2 111.3 114.7 121.2 128.4 117.1 125.8 Erigavo 47.36 10.61 1744 119.4 122.4 153.1 151.7 180.3 244.8 289.7 265.7 224.4 142.9 92.7 107.3 Galcayo 47.43 6.85 302 151.3 143.2 181.5 163.4 173.3 204.6 195.3 197.3 181.8 137.7 129.6 155.3 Gebiley 43.28 9.61 1563 102.1 94.6 116.2 115 120.8 111.2 105.4 109.3 108.5 108 104.7 105.7 Genale 44.75 1.83 69 134.8 132.2 141.4 129.1 121.5 103.5 103 117.8 127.3 125 111.5 121.4Jowhar 45.50 2.76 108 148.4 151.8 169.9 137.8 128.9 110.7 112.2 123.6 133.7 137.4 131.5 143.9 Giumbo 42.60 -0.21 30 125.5 116 138.7 124 117 96.8 99.5 105.7 114.9 125.3 111.1 123.4 Hargeisa 44.08 9.50 1326 153.6 148.7 197.7 201.5 210.1 248.6 257.6 256.9 225.9 239.8 162 147.7 Huddur 43.90 4.16 500 166.3 167 182.1 169.3 148.4 165 167.4 176.2 175.8 141.1 134.2 148.4Baidoa 43.66 3.13 487 163.6 156.1 172 137 125.2 118.8 108.9 123.2 130.9 118.5 119.6 136.3Mubarak 44.66 3.68 135 166.3 167 182.1 169.3 148.4 165 167.4 176.2 175.8 141.1 134.2 148.4 Jilib 42.80 0.43 23 153.6 148 170.7 129.7 121.1 101.9 104.4 116.3 126.6 129.9 117.1 131.6 Jonte 42.46 -0.33 8 125.5 116 138.7 124 117 96.8 99.5 105.7 114.9 125.3 111.1 123.4Mareere 42.71 0.43 12 153.6 148 170.7 129.7 121.1 101.9 104.4 116.3 126.6 129.9 117.1 131.6Kismayo 42.43 -0.36 8 152.1 142.8 150.9 148.8 123.7 115.8 120 126.9 137 148.8 140.5 147.6 Lafoole 45.15 2.10 100 172.3 161.4 184.3 151.6 134.9 118.5 137.4 143.2 154.2 150.5 135 153 Las-anod 47.36 8.46 705 151.3 143.2 181.5 163.4 173.3 204.6 195.3 197.3 181.8 137.7 129.6 155.3luuq 42.45 3.58 165 205.6 177.2 198.2 160.6 172 181.9 173.1 168.1 181.7 167 158.2 169.2Mahaddey 45.51 2.95 125 148.4 151.8 169.9 137.8 128.9 110.7 112.2 123.6 133.7 137.4 131.5 143.9Jamame 42.73 0.05 10 153.6 148 170.7 129.7 121.1 101.9 104.4 116.3 126.6 129.9 117.1 131.6 Modun 44.00 1.15 50 128.9 113.2 134.9 128.6 123.6 109.6 113 119.7 119.2 121.7 118.7 125.8 Mogadiscio 45.35 2.03 9 139.8 134.9 158.8 144.1 138.5 121.6 125.7 129.8 129.5 140.2 130.6 134.9 Mogambo 42.75 0.06 10 153.6 148 170.7 129.7 121.1 101.9 104.4 116.3 126.6 129.9 117.1 131.6 Obbia 48.56 5.33 10 115.9 120 152.8 153.1 130.2 133.4 128.3 128.1 120.4 128.4 125 119.5 Qardo 49.08 9.50 810 155.7 136.1 166.9 166.5 188 228.9 195.4 214.8 211.8 167.3 130.5 131 Sablaale 43.80 1.30 50 128.9 113.2 134.9 128.6 123.6 109.6 113 119.7 119.2 121.7 118.7 125.8 Scusciuban 50.23 10.30 344 151.5 131.3 174.5 180.3 240.2 279.5 273.1 276.9 255.5 183 144.4 149.3 Shiekh 45.18 9.91 1441 156.3 142.1 165.4 172.5 224 408.4 437.8 439.8 310 204.2 166.8 149.9 Villabruzzi 45.48 2.75 108 148.4 151.8 169.9 137.8 128.9 110.7 112.2 123.6 133.7 137.4 131.5 143.9
Appendix 3: Mean monthly PET in Somalia (1963-1990)

Appendices
____________________________________________________________________________
59
Appendix .4: Moisture deficit index for selected stations in Somalia
AFGOI
-120-100-80-60-40-20
0
J F M A M J J A S O N D
BARDERA
-120-100-80-60-40-20
0
J F M A M J J A S O N D
BERBERA
-102-100-98-96-94-92
J F M A M J J A S O N D
Moi
stur
e In
dex(
%)
BORAMA
-120-100-80-60-40-20
0
J F M A M J J A S O N D
Moi
stur
e In
dex(
%)
JONTE
-120-100-80-60-40-20
020
J F M A M J J A S O N D
Moi
stur
e In
dex(
%)
GEBILEY
-120-100-80-60-40-20
0
J F M A M J J A S O N D
Moi
stur
e In
dex(
%)
BAIDOA
-150
-100
-50
0
50
J F M A M J J A S O N D
Moi
stur
e In
dex(
%)
JILIB
-150
-100
-50
0
50
J F M A M J J A S O N D
Moi
stur
e In
dex(
%)

Appendices
____________________________________________________________________________
60
Name Lon Lat Alt SeasTot Nr Type LGS BegSd.m BegSJul EndSd.m BegHd.m EndHd.mAFGOI 45.130 2.130 83 2 1 2 76 11.0 101 25.06 -999 -999AFGOI 45.130 2.130 83 2 2 2 44 21.1 294 3.12 -999 -999AFMADU 42.060 0.510 29 2 1 2 60 9.1 282 7.12 -999 -999AFMADU 42.060 0.510 29 2 2 2 53 4.0 94 26.05 -999 -999ALESSANDR 42.700 0.500 25 2 1 3 103 2.0 92 13.07 15.04 26.05ALESSANDR 42.700 0.500 25 2 2 2 21 3.1 307 23.11 -999 -999ALULA 50.750 11.960 6 1 1 1 0 -999 -999 -999 -999 -999BALAD 45.380 2.360 95 2 1 2 74 9.0 99 21.06 -999 -999BALAD 45.380 2.360 95 2 2 2 45 19.1 292 2.12 -999 -999BARDERA 42.300 2.350 116 2 1 2 47 13.1 286 28.11 -999 -999BARDERA 42.300 2.350 116 2 2 2 40 3.0 93 12.05 -999 -999BARRO-UEN 45.500 2.860 104 2 1 2 52 3.0 93 24.05 -999 -999BARRO-UEN 45.500 2.860 104 2 2 2 40 7.1 280 15.11 -999 -999BELET-UEN 45.210 4.700 173 2 1 2 39 14.0 104 22.05 -999 -999BELET-UEN 45.210 4.700 173 2 2 2 19 10.1 283 28.10 -999 -999BERBERA 45.030 10.430 89 1 1 1 0 -999 -999 -999 -999 -999BORAMA 43.180 9.930 1454 2 1 2 86 5.1 186 28.09 -999 -999BORAMA 43.180 9.930 1454 2 2 2 53 22.0 81 13.05 -999 -999BOSASO 49.180 11.280 6 1 1 1 0 -999 -999 -999.00 -999 -999BRAVA 44.030 1.100 6 1 1 2 83 1.0 121 22.07 -999 -999BULO-BURTI 45.560 3.250 158 1 1 2 17 12.1 285 28.10 -999 -999BUR-ACABA 44.060 2.780 194 2 1 3 70 26.0 85 3.06 7.03999996 17.05BUR-ACABA 44.060 2.780 194 2 2 2 45 1.1 274 14.11 -999 -999BURAO 45.560 9.510 1032 1 1 1 0 -999 -999 -999 -999 -999BURDHUXUL43.300 4.100 400 2 1 3 51 25.0 84 14.05 9.03999996 26.04BURDHUXUL43.300 4.100 400 2 2 2 21 8.1 281 28.10 -999 -999CAPO-GUAR 51.250 11.810 244 1 1 1 0 -999.0 -999 -999.00 -999 -999DINSOR 42.980 2.410 280 2 1 2 43 1.0 91 13.05 -999 -999DINSOR 42.980 2.410 280 2 2 2 31 25.1 298 24.11 -999 -999EIL 49.780 7.950 36 1 1 1 0 -999 -999 -999 -999 -999EL-BUR 46.610 4.680 175 1 1 1 0 -999 -999 -999 -999 -999EL-MUGNE 44.760 1.710 12 1 1 2 21 5.1 156 25.06 -999 -999ERIGAVO 47.360 10.610 1744 1 1 1 0 -999 -999 -999 -999 -999GALCAYO 47.430 6.850 302 1 1 1 0 -999 -999 -999 -999 -999GEBILEY 43.280 9.610 1563 1 1 2 90 22.1 173 19.09 -999 -999GENALE 44.750 1.830 69 2 1 2 122 8.0 98 7.08 -999 -999GENALE 44.750 1.830 69 2 2 2 6 13.1 317 18.11 -999 -999GIOHAR 45.500 2.760 108 2 1 2 62 6.0 96 6.06 -999 -999GIOHAR 45.500 2.760 108 2 2 2 47 6.1 279 21.11 -999 -999GIUMBO 42.600 -0.210 30 1 1 3 106 24.0 114 7.08 25.05 22.06HARGEISA 44.080 9.500 1326 1 1 1 0 -999 -999 -999 -999 -999HUDDUR 43.900 4.160 500 2 1 2 38 9.0 99 16.05 -999 -999HUDDUR 43.900 4.160 500 2 2 2 28 1.1 274 28.10 -999 -999ISCIA-BAIDO 43.660 3.130 487 2 1 3 64 27.0 86 29.05 11.04 1.04999995ISCIA-BAIDO 43.660 3.130 487 2 2 3 59 28.1 271 25.11 12.1000004 26.1000004JAMECO-MU 44.660 3.680 135 1 1 2 41 8.0 98 18.05 -999 -999JILIB 42.800 0.430 23 2 1 3 102 3.0 93 13.07 20.04 17.06JILIB 42.800 0.430 23 2 2 2 27 3.1 307 29.11 -999 -999JONTE 42.460 -0.330 8 1 1 3 86 23.0 113 17.07 13.0500002 25.05JSP-MARERE42.710 0.430 12 2 1 3 108 27.0 86 12.07 12.04 9.06JSP-MARERE42.710 0.430 12 2 2 2 47 22.1 295 7.12 -999 -999KHISMAIO 42.430 -0.360 8 1 1 3 81 4.1 124 23.07 15.0600004 16.06LAFOOLE 45.150 2.100 100 2 1 2 88 8.0 98 4.07 -999 -999LAFOOLE 45.150 2.100 100 2 2 2 20 6.1 310 25.11 -999 -999LAS-ANOD 47.360 8.460 705 1 1 1 0 -999 -999 -999 -999 -999LUG-GANANE42.450 3.580 165 1 1 2 3 15.0 105 17.04 -999 -999MAHADDEI-U45.510 2.950 125 2 1 2 44 12.0 102 25.05 -999 -999MAHADDEI-U45.510 2.950 125 2 2 2 20 13.1 286 1.11 -999 -999MARGHERITA42.730 0.050 10 1 1 2 98 19.0 109 25.07 -999 -999MODUN 44.000 1.150 50 2 1 2 92 3.0 93 3.07 -999 -999MODUN 44.000 1.150 50 2 2 2 14 8.1 220 21.08 -999 -999MOGADISCIO45.350 2.030 9 2 1 2 82 6.1 126 26.07 -999 -999MOGADISCIO45.350 2.030 9 2 2 2 9 11.1 315 19.11 -999 -999MOGAMBO 42.750 0.060 10 2 1 3 100 3.0 93 11.07 2.04999995 24.06MOGAMBO 42.750 0.060 10 2 2 2 16 8.1 312 23.11 -999 -999OBBIA 48.560 5.330 10 1 1 1 0 -999 -999 -999 -999 -999QARDO 49.080 9.500 810 1 1 1 0 -999 -999 -999 -999 -999SABLAALE 43.800 1.300 50 2 1 3 102 1.0 91 11.07 13.0500002 16.05SABLAALE 43.800 1.300 50 2 2 2 33 12.1 285 13.11 -999 -999SCUSCIUBAN50.230 10.300 344 1 1 1 0 -999 -999 -999 -999 -999SHIEKH 45.180 9.910 1441 1 1 1 0 -999 -999 -999 -999 -999VILLABRUZZ 45.480 2.750 108 2 1 2 52 7.0 97 28.05 -999 -999VILLABRUZZ 45.480 2.750 108 2 2 2 51 4.1 277 23.11 -999 -999
Appendix 5: LGP calculations per station

Appendices
____________________________________________________________________________
61
Appendix 6: LGP characteristics The first line of the file lists the limit you choose for determining the beginning and end of the growing season, i.e., 1/2 PET. This is followed by columns with the station name, latitude, longitude, altitude and several growing season characteristics. Table below describes the parameters in the output file and the range of possible answers Growing Season Characteristics
Column Heading Meaning of the column variable Range of Answers Seastot Seasonal total rainfall (mm) N.A. Nr Number of seasons 1 - single; > 1 - multiple Type Type of season 1 - dry; 2 - intermediate; 3 - normal; 6 -
normal with no dry period LGS Length of the Growing Season
(days) 0 to 365
BegSd.m Beginning of the season (day.month) BegSJul Beginning of the season (Julian
days) 0 to 365
EndSd.m End of the season (day.month) BegHd.m Beginning of the humid period
(day.month) -999 if no humid period
EndHd.m End of the humid period (day.month)
-999 if no humid period
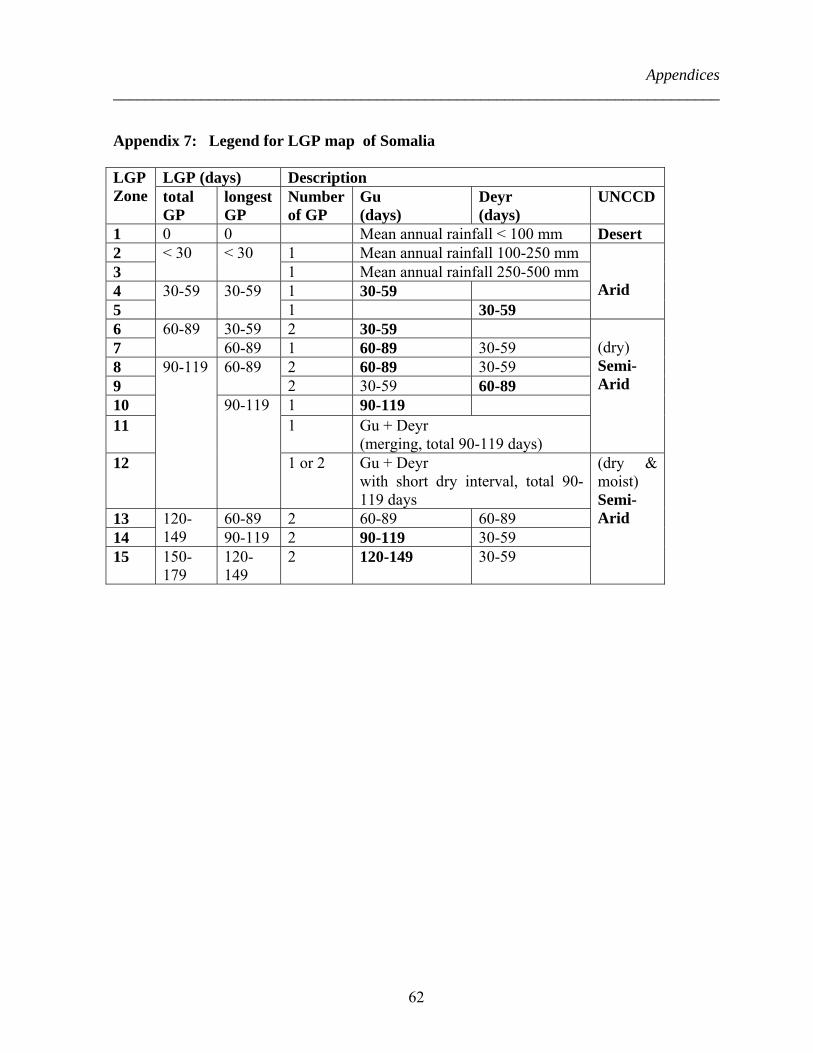
Appendices
____________________________________________________________________________
62
Appendix 7: Legend for LGP map of Somalia
LGP Zone
LGP (days) Description total GP
longest GP
Number of GP
Gu (days)
Deyr (days)
UNCCD
1 0 0 Mean annual rainfall < 100 mm Desert 2 < 30 < 30 1 Mean annual rainfall 100-250 mm
Arid
3 1 Mean annual rainfall 250-500 mm 4 30-59 30-59 1 30-59 5 1 30-59 6 60-89 30-59 2 30-59
(dry) Semi-Arid
7 60-89 1 60-89 30-59 8 90-119 60-89 2 60-89 30-59 9 2 30-59 60-89 10 90-119
1 90-119
11 1 Gu + Deyr (merging, total 90-119 days)
12 1 or 2 Gu + Deyr with short dry interval, total 90-119 days
(dry & moist) Semi-Arid 13 120-
149 60-89 2 60-89 60-89
14 90-119 2 90-119 30-59 15 150-
179 120-149
2 120-149 30-59

Appendices __________________________________________________________________________________________________________
63
Appendix 8: Monthly temperature distribution
January February
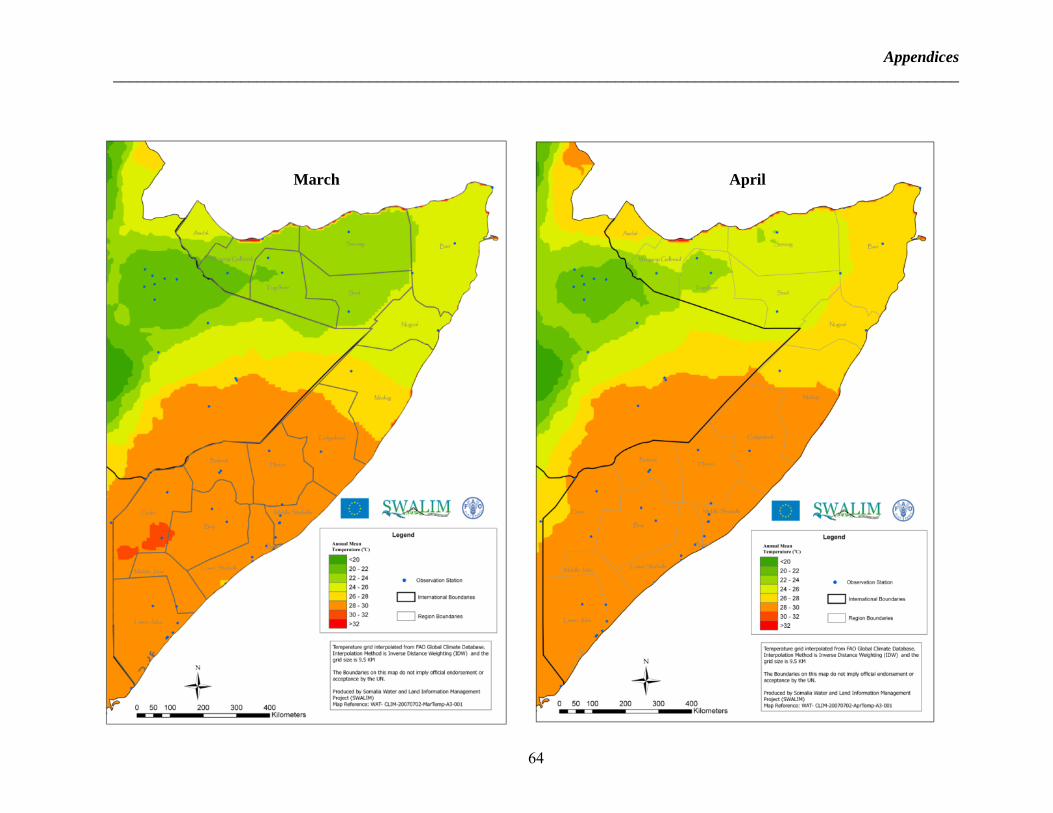
Appendices __________________________________________________________________________________________________________
64
March April

Appendices __________________________________________________________________________________________________________
65
May June
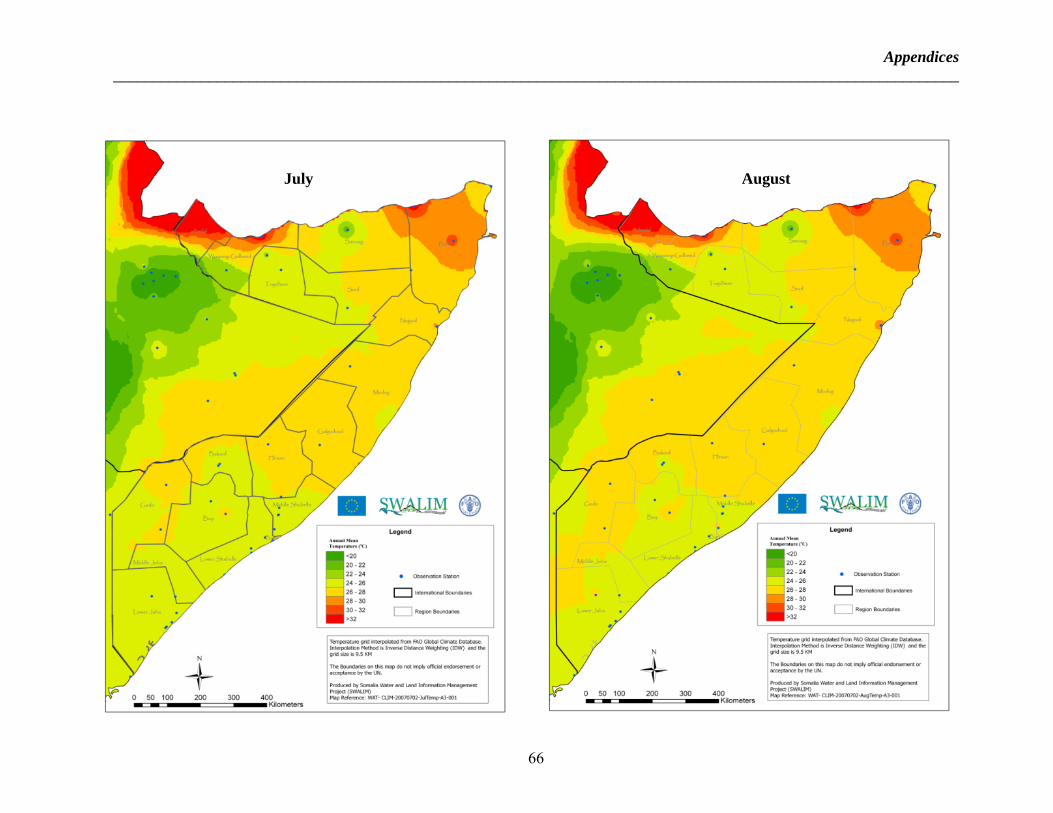
Appendices __________________________________________________________________________________________________________
66
July August

Appendices __________________________________________________________________________________________________________
67
September October
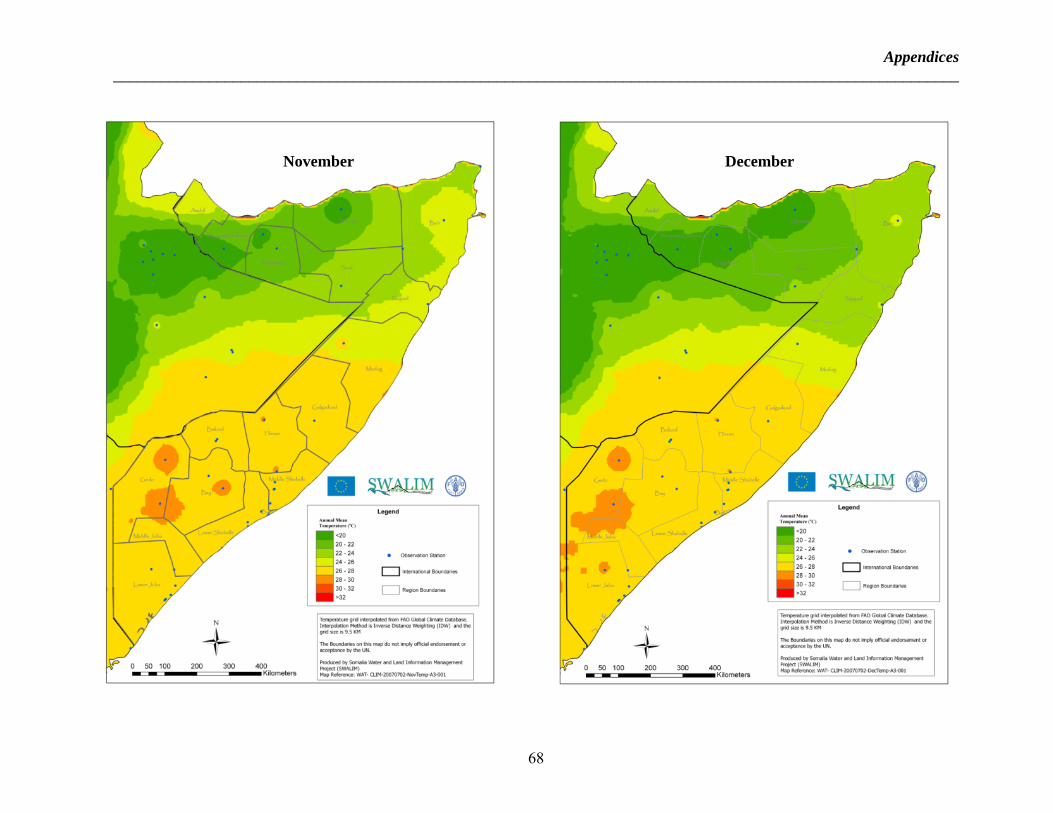
Appendices __________________________________________________________________________________________________________
68
November December

Appendices __________________________________________________________________________________________________________
69
Appendix 9: Daily mean temperatures
Name Lon Lat Alt Jan Feb Mar Apr May Jun Jul Aug Sep Oct Nov Dec Mean Afgoi 45.13 2.13 83.0 27.5 28.0 28.7 29.0 28.0 26.7 26.0 26.2 26.7 27.0 27.0 27.2 27.3 Afmadu 42.06 0.51 29.0 29.7 30.5 31.0 30.0 28.0 26.5 25.7 26.2 27.2 28.5 28.2 28.5 28.3 Alessandra 42.70 0.50 25.0 28.6 28.7 29.0 29.1 28.1 26.2 25.5 25.7 26.2 27.2 28.0 28.1 27.5 Balad 50.75 11.96 6.0 28.0 28.8 29.5 29.2 27.7 26.8 26.2 26.5 26.8 27.5 27.5 27.5 27.6 Bardera 45.38 2.36 95.0 29.6 30.5 31.5 30.2 29.0 27.6 26.1 26.7 28.1 29.0 28.7 29.0 28.8 Belet-uen 45.21 4.70 173.0 28.1 28.6 30.0 30.2 29.1 28.2 27.6 27.6 29.0 28.6 28.5 28.5 28.6 Berbera 45.03 10.43 89.0 24.3 25.2 25.7 28.2 31.1 35.7 37.4 35.4 34.0 28.7 26.3 24.7 29.7 Bosaso 49.18 11.28 6.0 24.8 25.2 26.2 28.7 31.0 35.0 35.4 35.0 33.4 27.8 25.2 24.7 29.4 Brava 44.03 1.10 6.0 26.2 25.7 27.0 27.7 27.2 26.0 25.2 25.0 25.2 26.2 26.6 26.6 26.2 Bulo-burti 45.56 3.25 158.0 28.6 29.5 30.6 30.5 28.0 27.6 26.7 27.0 28.2 28.7 28.7 28.5 28.5 Bur-acaba 44.06 2.78 194.0 28.1 28.6 29.7 29.6 29.1 28.0 27.3 27.6 28.2 28.2 30.7 28.2 28.6 Burao 45.56 9.51 1032.0 19.7 21.1 22.7 24.2 25.0 25.2 24.3 25.0 25.6 23.1 21.1 19.7 23.0 Quardafui 51.25 11.81 244.0 23.5 23.2 24.6 25.7 27.2 27.1 25.3 25.5 24.8 24.7 24.0 23.3 24.9 Eil 49.78 7.95 36.0 24.0 24.6 26.2 28.1 28.8 29.0 28.3 28.5 28.6 27.1 25.2 24.3 26.9 El-bur 46.61 4.68 175.0 26.7 27.5 29.1 30.0 29.5 28.5 27.5 27.5 28.2 28.5 27.5 26.7 28.1 El-mugne 44.76 1.71 12.0 26.0 25.7 27.0 27.2 26.5 25.5 24.7 24.7 25.2 26.1 26.2 26.2 25.9 Erigavo 47.36 10.61 1744.0 15.0 16.3 16.8 18.2 19.2 19.3 19.7 19.7 18.6 16.7 15.5 14.3 17.4 Galcayo 47.43 6.85 302.0 25.0 26.0 27.5 28.7 28.7 28.2 27.1 27.3 27.8 27.3 26.5 25.7 27.1 Genale 44.75 1.83 69.0 26.5 27.1 28.1 28.2 27.2 25.6 24.7 25.0 25.7 26.5 26.5 26.5 26.4 Giohar 45.50 2.76 108.0 27.5 28.5 29.5 29.5 28.2 26.6 25.5 25.7 26.7 27.5 27.2 27.1 27.4 Giumbo 42.60 -0.21 30.0 25.7 26.1 26.0 25.7 25.8 25.5 25.7 26.2 26.2 26.2 25.8 26.2 25.9 Hargeisa 44.08 9.50 1326.0 17.7 18.7 21.6 23.0 24.1 24.3 23.6 23.6 23.6 24.1 18.7 18.0 21.7 Huddur 43.90 4.16 500.0 25.5 27.1 28.7 28.6 27.2 26.2 25.2 25.6 26.7 26.5 26.0 25.7 26.5 Baidoa 43.66 3.13 487.0 27.2 28.0 28.2 27.5 26.0 25.0 24.0 24.2 25.1 25.5 26.0 26.5 26.1 Jonte 42.46 -0.33 8.0 28.2 28.0 28.6 29.0 27.6 26.0 25.5 25.6 26.0 27.5 27.5 28.0 27.2 Khismaio 42.43 -0.36 8.0 27.1 27.3 28.2 28.7 27.2 26.1 25.6 25.6 26.0 26.7 27.6 27.5 27.0 Las-anod 47.36 8.46 705.0 20.2 22.5 23.0 25.2 25.7 24.7 25.0 25.2 26.1 25.2 24.2 22.5 24.1 Lug-ganane 42.45 3.58 165.0 31.5 32.2 33.2 31.7 30.2 29.5 28.2 28.2 29.6 30.5 30.5 30.5 30.5 Mahaddey 45.51 2.95 125.0 27.3 27.5 27.3 28.2 27.2 25.8 25.1 25.2 25.6 26.7 27.1 27.2 26.7 Margherita 42.73 0.05 10.0 28.5 28.8 28.6 29.3 28.5 27.1 26.1 26.1 26.7 27.7 28.0 28.3 27.8 Mogadiscio 45.35 2.03 9.0 26.6 26.7 28.0 28.5 27.6 26.6 25.7 25.6 26.1 26.8 26.7 26.7 26.8 Obbia 48.56 5.33 10.0 25.7 26.5 27.7 29.0 27.7 26.1 25.2 25.1 25.5 26.5 27.1 26.2 26.5 Oddur 49.08 9.50 810.0 25.6 27.2 28.7 28.7 27.2 26.3 25.2 25.7 26.7 26.6 26.1 25.7 26.6 Qardo 43.80 1.30 50.0 21.8 22.7 24.7 26.3 27.7 27.0 26.3 26.2 27.6 25.7 23.0 21.7 25.1 Scusciuban 50.23 10.30 344.0 23.7 24.0 26.7 29.5 32.0 32.2 31.5 31.7 31.7 28.7 25.7 25.0 28.5 Shiekh 45.18 9.91 1441.0 14.3 16.1 18.2 19.7 21.0 22.5 21.8 21.8 22.2 20.0 16.0 15.0 19.0 Villabruzzi 45.48 2.75 108.0 27.6 28.5 29.5 29.6 28.3 26.7 25.6 25.8 26.8 27.5 27.2 27.2 27.5

Appendices __________________________________________________________________________________________________________
70
Appendix 10: Daily mean minimum temperature Station Name Longitude Latitude Altitude Jan Feb Mar Apr May Jun Jul Aug Sep Oct Nov Dec
Iscusciuban 50.23 10.3 344 17.7 17.7 20 22.6 24 25.2 25.1 25.2 24.7 21.2 19.1 18.5 Khismaio 42.43 -0.36 8 24.1 24.5 25.2 25.7 24.7 23.5 23 23.2 23.2 24 24.5 24.2 Afmadu 42.06 0.51 29 21.5 21.7 22.5 22.6 21.7 20.2 19.5 19.5 19.5 21 21.5 21.5 Jonte 42.46 -0.33 8 23.6 23.2 24.5 24.7 23.7 22.5 21.7 21.5 22.2 23.2 23.2 23.5 Allessandra 42.7 0.5 25 22.1 21.7 22.2 23 23 21.2 20.5 20.2 20.2 21.5 22 21.7 Berbera 45.03 10.43 89 20 21.7 22.7 25 26.7 30 31.1 30.5 28.8 24.3 21.7 20 Erigavo 47.36 10.61 1744 5.5 7.1 8.3 10 11.6 12.8 13.3 13.3 11.6 8.3 7.1 5.5 Brava 44.03 1.1 6 23.6 23.7 24.6 25.5 24.7 23.7 22.7 22 22.7 23.5 24.1 24 Genale 44.75 1.83 69 21 21.5 22.7 23.5 23.2 21.7 21.2 21.1 22 22.6 22.1 21.5 El-mugne 44.76 1.71 12 21.7 21.7 23.1 23.5 22.6 21.6 21.5 21.2 22 22.7 22.2 22.1 Bosaso 49.18 11.28 6 20.2 20.2 21.1 23.2 25 29.1 30.1 29.1 27.6 22.5 19.7 19.7 Bardera 42.3 2.35 116 21.2 22 22.7 22.7 22.5 21.2 20.2 20.7 21.5 22 21.6 21.5 Afgoi 45.13 2.13 83 21.6 21.7 23 23.5 23.1 22.6 21.5 21.5 21.7 22 21.7 21.6 Jowhar 45.5 2.76 108 21.1 21.5 22.5 23.2 23 21.6 20.7 20.7 21.2 22 21.7 21.5 Mogadiscio 45.35 2.03 9 23 23.2 24.7 25.5 24.7 23.6 23 23 23.2 24.2 24.1 23.5 Luuq 42.45 3.58 165 23.7 24.5 25.2 25 24.7 23.7 23.1 22.6 23.5 23.7 23.7 23 Baidoa 43.66 3.13 487 19.7 20.2 20.7 21 20.7 20 19.2 19.2 19.6 20.2 20.1 20.1 Bulo-burti 45.56 3.25 158 21.7 21.7 23 23.5 23.2 22.2 21.7 21.6 22.2 22.5 22.2 22 Huddur 43.9 4.16 500 17 18.1 20.2 21 20.7 19.7 19.1 19.6 19.7 20 20 17.7 Belet-uen 45.21 4.7 173 22 22 23.2 23.7 23.2 22.7 22.5 21.5 22.6 22.5 22.2 22.2 El-bur 46.61 4.68 175 19.6 19.7 21.1 22.5 22.7 22.2 21.5 21 21.5 21.5 20 19.7 Obbia 48.56 5.33 10 22.2 23 24.1 24.7 24.2 22.7 21.6 21.7 22.1 23.2 23.2 22.7 Galcayo 47.43 6.85 302 17.7 18.8 20 22.2 22.7 22.7 22.2 22.2 22.2 22.2 20 18.8 Hargeisa 44.08 9.5 1326 11.6 12.6 15 16.6 17.7 17.7 17.1 17.1 17.1 15 13.1 12.1 Burao 45.56 9.51 1032 12.8 13.8 15.6 17.2 18.2 19.3 19.3 19.3 19.3 16.1 14.3 12.8 Qardo 49.08 9.5 810 13.3 13.5 15.1 18.5 20.5 21.1 20.5 20.2 20 17.5 13.5 13.5

Appendices __________________________________________________________________________________________________________
71
Appendix 11: Daily mean maximum temperature
Name Longitude
Latitude
Altitude
Jan Feb Mar Apr May Jun Jul Aug Sep Oct Nov Dec
Iscusciuban
50.23 10.3 344 29.7 30.1 33.5 36 40 39.5 37.7 38.5 39 36.2 32.5 31.2
Khismaio 42.43 -0.36 8 29.5 29.7 31 31.7 30.2 28.5 28 28.2 28.5 29.5 30.5 30.5 Afmadu 42.06 0.51 29 38 39.2 39.5 37 34.2 32.5 32 33 35 35.7 35.5 35.7 Jonte 42.46 -0.33 8 32.7 32.7 32.7 33.5 31.5 29.5 29.1 29.7 29.7 31.5 32 32.5 Alessandra 42.7 0.5 25 35 35.5 36 35.5 33.2 32 30.5 31.2 32.2 33 33.7 34.5 Berbera 45.03 10.43 89 28.8 28.8 30 31.7 35.5 41.7 41.7 41 39.4 33.2 31.1 29.3 Erigavo 47.36 10.61 1744 24.3 25.5 25.5 26.7 26.7 26.1 26.1 26.1 25.5 25 23.8 23.2Brava 44.03 1.1 6 28.7 28.5 29.5 30.2 29.7 28.1 27.6 27.6 27.6 28.6 29 29.1 Genale 44.75 1.83 69 32.2 32.5 33.5 33 31.5 29.5 28.5 28.7 29.5 30.5 31 31.5 El-mugne 44.76 1.71 12 30.1 29.7 31 31.5 30.5 29.5 27.7 28.2 28.6 29.5 30.2 30.5 Bosaso 49.18 11.28 6 39.2 30.1 31 34 37 41 40.5 40 39 32.7 30 29.2 Bardera 42.3 2.35 116 38 39.2 41.2 38 35.5 34 32.5 33 34.7 36 35.7 36.5 Afgoi 45.13 2.13 83 33.5 34 35 34.2 32.7 31.2 30.5 31.1 32 32.2 32.2 33 Giohar 45.5 2.76 108 34 35.2 36.2 35.7 33.5 31.5 30.1 31 32.2 32.7 32.5 32.5 Mogadishu 45.35 2.03 9 30.1 30.1 30.7 32 31.1 29.5 28.5 28.5 29.2 30.1 30.5 30.6 Luuq 42.45 3.58 165 38.5 39.5 40.5 38.2 36 35 33.5 33.7 36 37 37.5 37.7Baidoa 43.66 3.13 487 34.2 35.5 35.7 34 31.5 30.2 28.7 29.2 30.7 30.7 31.5 32.7 Bulo-burti 45.56 3.25 158 35.5 37.2 30.2 37.5 35 32.7 31.7 32.5 34.2 34.7 35.5 35 Huddur 43.9 4.16 500 34.5 36 37.5 36.2 33.7 32.7 29.7 32 33.7 33 33 33.5 Belet-uen 45.21 4.7 173 34.5 35.2 36.5 36.7 34.7 34 33 33.7 35.2 34.2 34.7 34.5 El-bur 46.61 4.68 175 34.2 35.2 37 37.5 36.2 35 33.5 33.7 35 35.2 34.7 34 Obbia 48.56 5.33 10 29.2 30.1 31.5 33.2 31.5 29.5 28.6 28.5 28.7 30 31 30 Galcayo 47.43 6.85 302 32.2 32.7 35 36 35 33.9 32.7 32.7 33.9 33.9 33.9 32.7 Hargeisa 44.08 9.5 1326 24.2 26.6 28.7 29.2 30.5 31 29.2 29.2 30.5 28.2 26 23.7 Burao 45.56 9.51 1032 26.7 28.2 30 31.1 31.7 31.1 29.3 30.5 31.7 30 27.7 26.7 Qardo 49.08 9.5 810 29.2 30 32.5 33.5 34.5 33.2 31.5 32.5 34.2 33 30.6 29.2
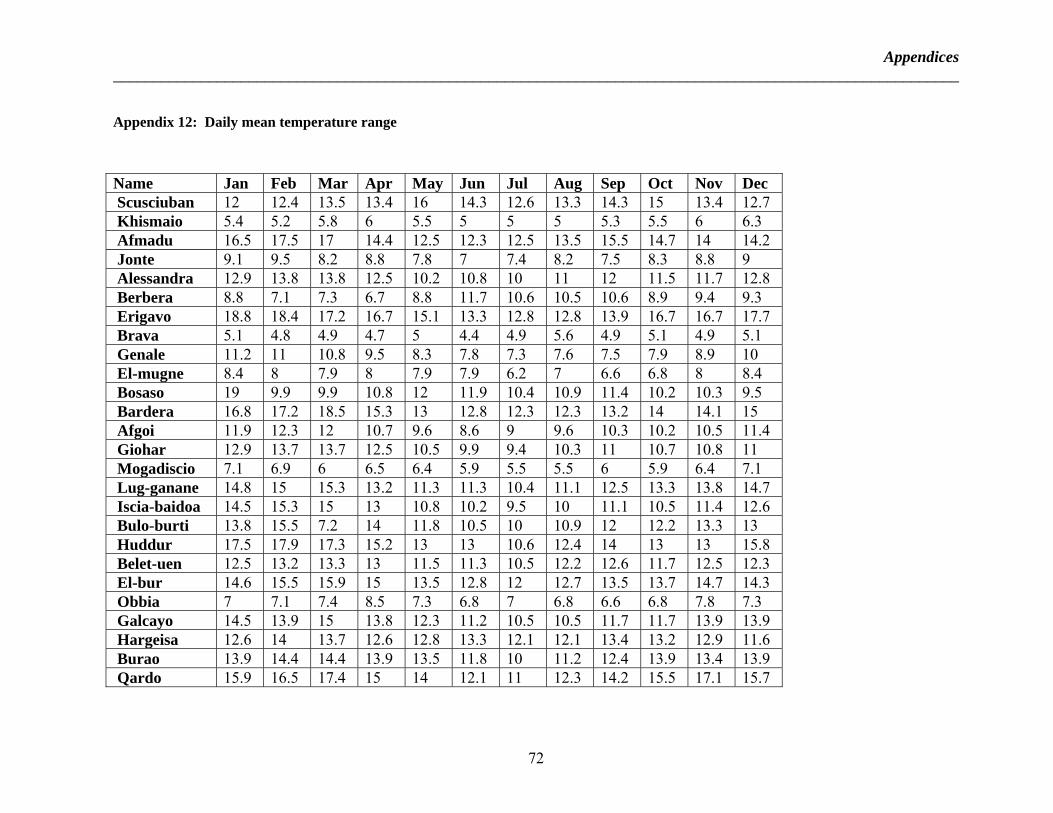
Appendices __________________________________________________________________________________________________________
72
Appendix 12: Daily mean temperature range
Name Jan Feb Mar Apr May Jun Jul Aug Sep Oct Nov Dec Scusciuban 12 12.4 13.5 13.4 16 14.3 12.6 13.3 14.3 15 13.4 12.7 Khismaio 5.4 5.2 5.8 6 5.5 5 5 5 5.3 5.5 6 6.3 Afmadu 16.5 17.5 17 14.4 12.5 12.3 12.5 13.5 15.5 14.7 14 14.2 Jonte 9.1 9.5 8.2 8.8 7.8 7 7.4 8.2 7.5 8.3 8.8 9 Alessandra 12.9 13.8 13.8 12.5 10.2 10.8 10 11 12 11.5 11.7 12.8 Berbera 8.8 7.1 7.3 6.7 8.8 11.7 10.6 10.5 10.6 8.9 9.4 9.3 Erigavo 18.8 18.4 17.2 16.7 15.1 13.3 12.8 12.8 13.9 16.7 16.7 17.7 Brava 5.1 4.8 4.9 4.7 5 4.4 4.9 5.6 4.9 5.1 4.9 5.1 Genale 11.2 11 10.8 9.5 8.3 7.8 7.3 7.6 7.5 7.9 8.9 10 El-mugne 8.4 8 7.9 8 7.9 7.9 6.2 7 6.6 6.8 8 8.4 Bosaso 19 9.9 9.9 10.8 12 11.9 10.4 10.9 11.4 10.2 10.3 9.5 Bardera 16.8 17.2 18.5 15.3 13 12.8 12.3 12.3 13.2 14 14.1 15 Afgoi 11.9 12.3 12 10.7 9.6 8.6 9 9.6 10.3 10.2 10.5 11.4 Giohar 12.9 13.7 13.7 12.5 10.5 9.9 9.4 10.3 11 10.7 10.8 11 Mogadiscio 7.1 6.9 6 6.5 6.4 5.9 5.5 5.5 6 5.9 6.4 7.1 Lug-ganane 14.8 15 15.3 13.2 11.3 11.3 10.4 11.1 12.5 13.3 13.8 14.7 Iscia-baidoa 14.5 15.3 15 13 10.8 10.2 9.5 10 11.1 10.5 11.4 12.6 Bulo-burti 13.8 15.5 7.2 14 11.8 10.5 10 10.9 12 12.2 13.3 13 Huddur 17.5 17.9 17.3 15.2 13 13 10.6 12.4 14 13 13 15.8 Belet-uen 12.5 13.2 13.3 13 11.5 11.3 10.5 12.2 12.6 11.7 12.5 12.3 El-bur 14.6 15.5 15.9 15 13.5 12.8 12 12.7 13.5 13.7 14.7 14.3 Obbia 7 7.1 7.4 8.5 7.3 6.8 7 6.8 6.6 6.8 7.8 7.3 Galcayo 14.5 13.9 15 13.8 12.3 11.2 10.5 10.5 11.7 11.7 13.9 13.9 Hargeisa 12.6 14 13.7 12.6 12.8 13.3 12.1 12.1 13.4 13.2 12.9 11.6 Burao 13.9 14.4 14.4 13.9 13.5 11.8 10 11.2 12.4 13.9 13.4 13.9 Qardo 15.9 16.5 17.4 15 14 12.1 11 12.3 14.2 15.5 17.1 15.7
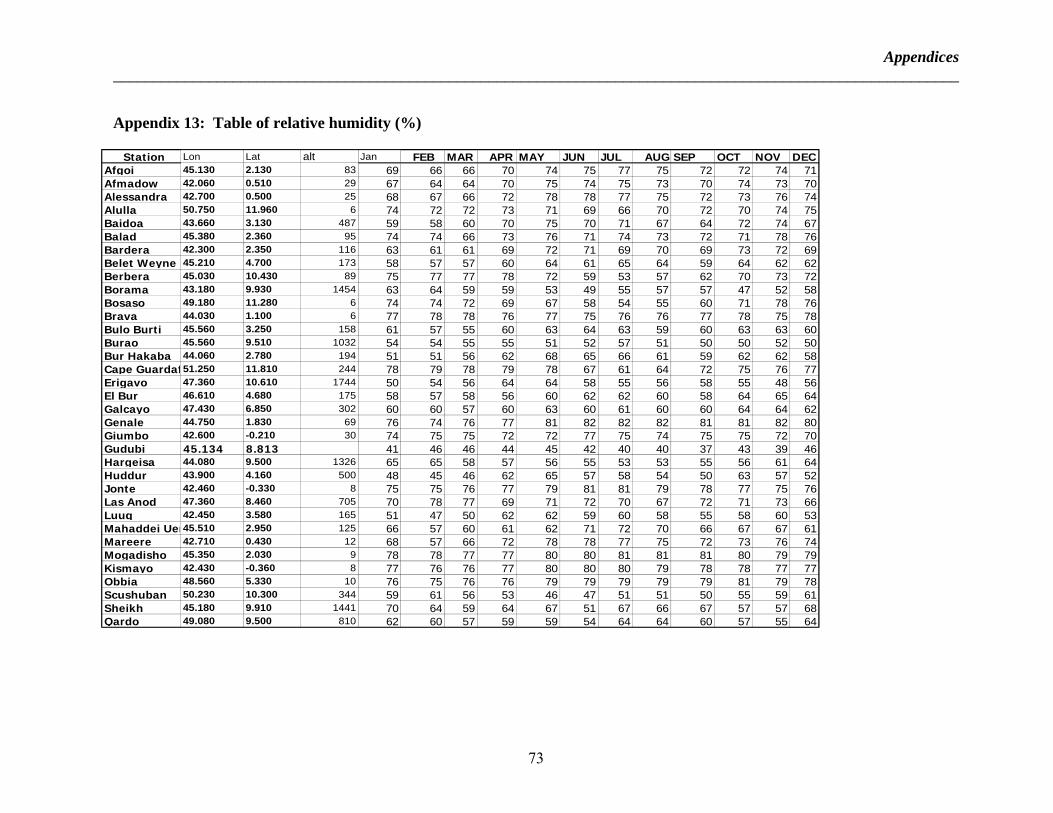
Appendices __________________________________________________________________________________________________________
73
Station Lon Lat alt Jan FEB MAR APR MAY JUN JUL AUG SEP OCT NOV DECAfgoi 45.130 2.130 83 69 66 66 70 74 75 77 75 72 72 74 71Afmadow 42.060 0.510 29 67 64 64 70 75 74 75 73 70 74 73 70Alessandra 42.700 0.500 25 68 67 66 72 78 78 77 75 72 73 76 74Alulla 50.750 11.960 6 74 72 72 73 71 69 66 70 72 70 74 75Baidoa 43.660 3.130 487 59 58 60 70 75 70 71 67 64 72 74 67Balad 45.380 2.360 95 74 74 66 73 76 71 74 73 72 71 78 76Bardera 42.300 2.350 116 63 61 61 69 72 71 69 70 69 73 72 69Belet Weyne 45.210 4.700 173 58 57 57 60 64 61 65 64 59 64 62 62Berbera 45.030 10.430 89 75 77 77 78 72 59 53 57 62 70 73 72Borama 43.180 9.930 1454 63 64 59 59 53 49 55 57 57 47 52 58Bosaso 49.180 11.280 6 74 74 72 69 67 58 54 55 60 71 78 76Brava 44.030 1.100 6 77 78 78 76 77 75 76 76 77 78 75 78Bulo Burti 45.560 3.250 158 61 57 55 60 63 64 63 59 60 63 63 60Burao 45.560 9.510 1032 54 54 55 55 51 52 57 51 50 50 52 50Bur Hakaba 44.060 2.780 194 51 51 56 62 68 65 66 61 59 62 62 58Cape Guardaf51.250 11.810 244 78 79 78 79 78 67 61 64 72 75 76 77Erigavo 47.360 10.610 1744 50 54 56 64 64 58 55 56 58 55 48 56El Bur 46.610 4.680 175 58 57 58 56 60 62 62 60 58 64 65 64Galcayo 47.430 6.850 302 60 60 57 60 63 60 61 60 60 64 64 62Genale 44.750 1.830 69 76 74 76 77 81 82 82 82 81 81 82 80Giumbo 42.600 -0.210 30 74 75 75 72 72 77 75 74 75 75 72 70Gudubi 45.134 8.813 41 46 46 44 45 42 40 40 37 43 39 46Hargeisa 44.080 9.500 1326 65 65 58 57 56 55 53 53 55 56 61 64Huddur 43.900 4.160 500 48 45 46 62 65 57 58 54 50 63 57 52Jonte 42.460 -0.330 8 75 75 76 77 79 81 81 79 78 77 75 76Las Anod 47.360 8.460 705 70 78 77 69 71 72 70 67 72 71 73 66Luuq 42.450 3.580 165 51 47 50 62 62 59 60 58 55 58 60 53Mahaddei Uen45.510 2.950 125 66 57 60 61 62 71 72 70 66 67 67 61Mareere 42.710 0.430 12 68 57 66 72 78 78 77 75 72 73 76 74Mogadisho 45.350 2.030 9 78 78 77 77 80 80 81 81 81 80 79 79Kismayo 42.430 -0.360 8 77 76 76 77 80 80 80 79 78 78 77 77Obbia 48.560 5.330 10 76 75 76 76 79 79 79 79 79 81 79 78Scushuban 50.230 10.300 344 59 61 56 53 46 47 51 51 50 55 59 61Sheikh 45.180 9.910 1441 70 64 59 64 67 51 67 66 67 57 57 68Qardo 49.080 9.500 810 62 60 57 59 59 54 64 64 60 57 55 64
Appendix 13: Table of relative humidity (%)


