
(VYK 3ZIVHSWI (IEXLW -RZSPZMRK 3TMSMHW
6
Transcript of (VYK 3ZIVHSWI (IEXLW -RZSPZMRK 3TMSMHW
Mississippi State Department of Health
Drug Overdose DeathsInvolving Opioids2011-2016
Epidemiological Report

THE
MISSISSIPPI
OPIOID
EPIDEMIC
PROJECT
DRUG OVERDOSE DEATHS INVOLVING
OPIOIDS IN MISSISSIPPI,
2011-2016
THE
MISSISSIPPI
OPIOID
EPIDEMIC
PROJECT
During 2016, Mississippi had the fourth highest opioid prescription rate in the nation with 105.6 opioid prescriptions
per 100 persons.1 In addition to such prescription rates, the growing popularity of highly toxic synthetic opioid
substances and availability of cheap heroin are also contributing to rapidly increasing opioid mortality nationwide.2
To evaluate the impact of opioid misuse, we analyzed mortality data from the Mississippi State Department of
Health. This report presents data on numbers, trends, rates, and demographics associated with opioid-related deaths
in Mississippi from 2011 through 2016.
OVERALL OPIOID DEATHS
During 2016 there were 172 opioid-related deaths in Mississippi. This represents an increase of 17.8% compared to
2015 and an increase of 126.3% compared to 2011. The age-adjusted death rate in 2016 was 5.9 deaths per 100,000
standard population, an increase of 110.7% from the 2011 rate of 2.8.
From 2011 through 2016, there were a total of 715 opioid-related
deaths: Most of these deaths (643 or 89.9%) were unintentional;
however, 34 cases (4.8%) were due to suicide. Among the 715 opioid
overdose deaths, 11.7% (84 cases) involved at least one more opioid and
43.6% (312 cases) involved at least one more non-opioid drug of abuse.
OPIOID DEATHS BY TYPE OF OPIOID INVOLVED
During 2016
Natural or semisynthetic opioids such as hydrocodone were involved in the majority of opioid deaths (98 cases
or 57.0%).
Synthetic opioids, including illicit or prescription fentanyl, were documented in 41 deaths (23.8%).
Methadone, a medication used mostly for treatment of opioid addiction, was recorded in 8 deaths.
Mortality Trends, 2011-2016
Deaths involving natural or semisynthetic opioids doubled from 49 in 2011 to 98 in 2016.
Deaths due to synthetic opioids increased by 156.3% from 16 in 2011 to 41 in 2016.
The number of heroin overdose deaths demonstrated a steep and steady increase from 2011 until 2015. Heroin
deaths, however, decreased by 7 cases from 2015 to 2016.
Epidemiological Report
2/2/2018
Note: Death certificates may have more than one opioid recorded. Therefore, the categories presented in Figure 2 are not mutually exclusive.

Page 2
DEMOGRAPHIC PROFILE, 2011-2016
Race: Mirroring national trends, the overwhelming majority (649 or 90.8%) of opioid-related deaths between 2011
and 2016 occurred among Caucasians (Figure 3). When examined by rates, Caucasians had considerably higher
rates of opioid-related deaths than African Americans (6.1 deaths versus 0.9 deaths per 100,000 persons).
Sex: During 2011-2016, more male (402 deaths or 56.2%) than female deaths (313 cases or 43.8%) were reported
(Figure 4). Males also had higher opioid-related death rates than females (4.6 deaths versus 3.4 deaths per 100,000
persons) during the same period.
Age: The age groups 25-34 years, 35-44 years, and 45-54 years were almost equally affected. Although each of
these age groups accounted for approximately one quarter of all 715 opioid-related deaths during 2011-2016, the 45
-54 age group had a slightly higher opioid mortality rate of 8.4 deaths per 100,000 persons (Figure 5).
EDUCATIONAL AND MARITAL STATUS, 2011-2016
Education and family relations are some of the social determinants of health. To illustrate how these factors are
implicated in Mississippi’s opioid overdoses deaths, we stratified the data by educational levels and marital status.
Education: Only 49 (6.9%) of all decedents from opioid
overdoses had a college degree or higher level of
education. This finding may reflect Mississippi’s poor
educational rankings. In 2016, only 21.0% of the state
population of ≥ 25 years had a college education, which
was 9.3 percentage points below the national average of
30.3%.3 Investing in Mississippi’s system of higher
education and improving educational performance may
be important steps for increasing the well-being of state
residents and preventing drug addiction and deaths.
Marital Status: Less than one third (217 cases or
30.3%) of all decedents were married or not separated at
the time of their death. Researching and implementing
strategies to combat social isolation may help to provide
essential social support to persons with opioid addiction.
Table 1. Overdose deaths involving opioids by education and
marital status
Educational level
Number of
deaths Percent of
deaths Percent of
population*
8th grade or less 33 4.6% 5.8% 9th - 12th grade, no diploma 118 16.5% 11.2% High school graduate or GED 260 36.4% 30.4% Some college, no degree 120 16.8% 22.8% Associate degree 49 6.9% 8.7% Bachelor's degree 32 4.5% 13.1% Graduate or professional degree 17 2.3% 7.9% Unknown 86 12.0% -
Marital Status
Number of
deaths
Percent of
deaths
Percent of
population**
Married 217 30.3% 44.6% Married, but separated 22 3.1% 3.0% Widowed 39 5.5% 7.1% Divorced 216 30.2% 11.8% Never married 218 30.5% 33.5% Unknown 3 0.4% - *Source: U.S. Census Bureau, 2016 American Community Survey
**Source: U.S. Census Bureau, 2012-2016 American Community Survey 5-Year Estimates
Page 3
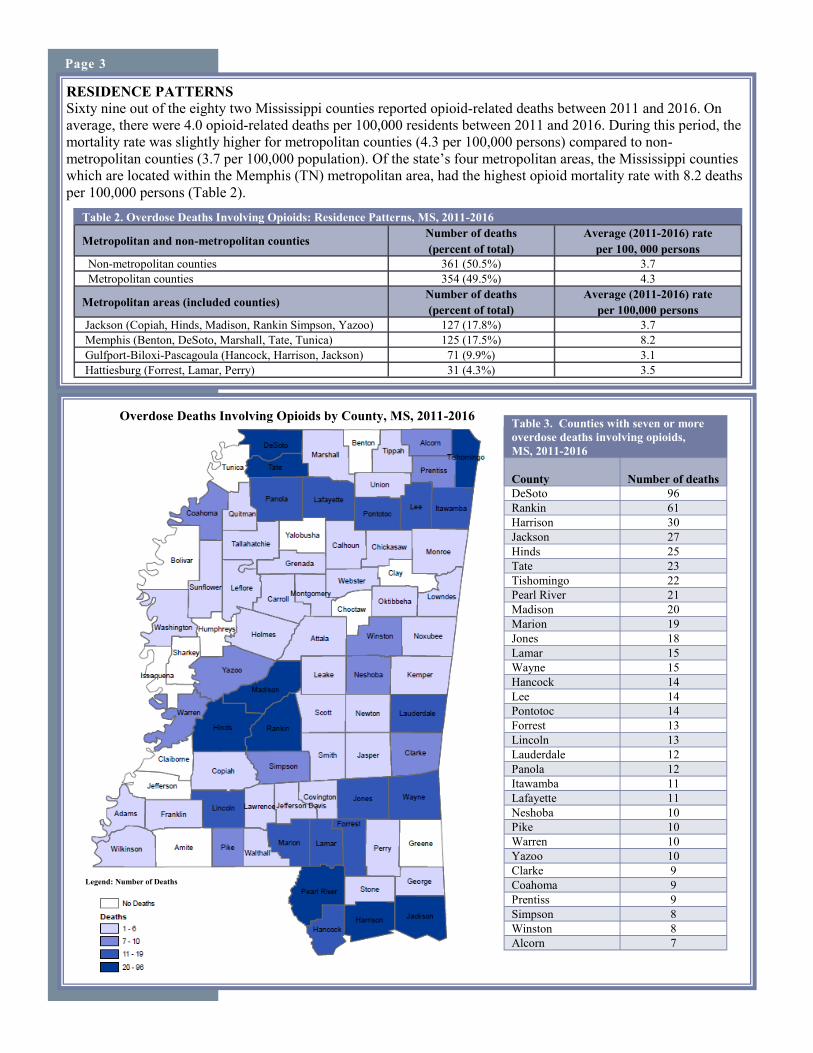
RESIDENCE PATTERNS
Sixty nine out of the eighty two Mississippi counties reported opioid-related deaths between 2011 and 2016. On
average, there were 4.0 opioid-related deaths per 100,000 residents between 2011 and 2016. During this period, the
mortality rate was slightly higher for metropolitan counties (4.3 per 100,000 persons) compared to non-
metropolitan counties (3.7 per 100,000 population). Of the state’s four metropolitan areas, the Mississippi counties
which are located within the Memphis (TN) metropolitan area, had the highest opioid mortality rate with 8.2 deaths
per 100,000 persons (Table 2).
Legend: Number of Deaths
Table 3. Counties with seven or more
overdose deaths involving opioids,
MS, 2011-2016
County Number of deaths
DeSoto 96
Rankin 61
Harrison 30
Jackson 27
Hinds 25
Tate 23
Tishomingo 22
Pearl River 21
Madison 20
Marion 19
Jones 18
Lamar 15
Wayne 15
Hancock 14
Lee 14
Pontotoc 14
Forrest 13
Lincoln 13
Lauderdale 12
Panola 12
Itawamba 11
Lafayette 11
Neshoba 10
Pike 10
Warren 10
Yazoo 10
Clarke 9
Coahoma 9
Prentiss 9
Simpson 8
Winston 8
Alcorn 7
Table 2. Overdose Deaths Involving Opioids: Residence Patterns, MS, 2011-2016
Metropolitan and non-metropolitan counties Number of deaths
(percent of total)
Average (2011-2016) rate
per 100, 000 persons
Non-metropolitan counties 361 (50.5%) 3.7
Metropolitan counties 354 (49.5%) 4.3
Metropolitan areas (included counties) Number of deaths
(percent of total)
Average (2011-2016) rate
per 100,000 persons
Jackson (Copiah, Hinds, Madison, Rankin Simpson, Yazoo) 127 (17.8%) 3.7
Memphis (Benton, DeSoto, Marshall, Tate, Tunica) 125 (17.5%) 8.2
Gulfport-Biloxi-Pascagoula (Hancock, Harrison, Jackson) 71 (9.9%) 3.1
Hattiesburg (Forrest, Lamar, Perry) 31 (4.3%) 3.5
Legend: Number of Deaths
Overdose Deaths Involving Opioids by County, MS, 2011-2016

CONCLUSIONS
Our study demonstrated that the number of opioid-related deaths has escalated in Mississippi. Between 2011 and
2016, overdose deaths involving opioids more than doubled in our state. During 2016, prescription opioids were
documented in more than half, while synthetic prescription or illicit opioids were implicated in nearly one quarter
of all deaths. Between 2015 and 2016, deaths involving natural, semisynthetic, or synthetic opioids continued to
climb, but heroin-related deaths decreased. Nonetheless, heroin was involved in 100 (14.0%) of all opioid deaths
during the six-year period. Multiple drug use is an overdose risk factor.4 During 2011-2016, the coexistence of
opioid and non-opioid substances was recorded in well over one third of all opioid-related fatalities in Mississippi.
The high rates of multiple drug use emphasizes the need of building comprehensive surveillance systems
monitoring trends and patterns of all types of drug abuse.
The demographic breakdown revealed that Caucasian race,
low educational achievement, single status, and male sex
were highly prevalent among opioid-related fatalities. The
geographic analysis uncovered that the opioid epidemic is
widespread in our state: Nearly all Mississippi counties
have suffered an opioid-related death between 2011 and
2016. These findings highlight the importance of statewide
measures to curb Mississippi’s opioid epidemic.
The Mississippi Opioid Epidemic Project is a collaborative effort between the Public Health Pharmacy, Office of Epidemiology, and Office of Preventive Health at the Mississippi State Department of Health. The project’s mission is to use evidence-based research methods to evaluate the scope of the opioid
epidemic in Mississippi and build statewide surveillance systems utilizing different data sources. For additional information on opioid drug abuse statistics as
well as state and national initiatives targeting this epidemic, please visit the Mississippi State Department of Health’s website at: http://msdh.ms.gov.
Page 4
Data Analysis:
To analyze opioid overdose deaths, we implemented the Center for Disease Control and Prevention’s coding algorithm for capturing such deaths.4 First, we identified all deaths with
undelaying cause of death codes: X40-44 (accidental drug poisoning), X60-X64 (intentional self-drug poisoning), X85 (assault by drug poisoning), Y10-Y14 (drug poisoning by
undetermined intent). Then, we selected the following ICD-10 (International Classification of Diseases, Tenth Revisions) codes: T40.0 (opium), T40.1 (heroin), T40.2 (natural and
semisynthetic opioids), T40.3 (methadone), T40.4 (synthetic opioids other than methadone), and T40.6 (other and unspecified opioids).5 The following ICD-10 codes were used for
capturing multidrug use: T40.5 (cocaine), T40.7 (cannabis), T40.8 (lysergide), T40.9 (other and unspecified psychodysleptics), T42.2-T42.8 (antiepileptic, sedative-hypnotic and
antiparkinsonism drugs), T43.0-T43.6 (antidepressants). Crude rates for 2016 were calculated using the 2016 Mississippi population data set, while the average rates for the period
2011-2016 were calculated using the sum of the 2011-2016 population data sets. Age-adjusted death rates were calculated using the direct method and adjusted to the 2000 U. S.
standard population.6 Patient residence was determined according to categories of 2013 National Center for Health Statistics Urban-Rural Classification.7
Data Limitations:
The accurate assessment of drug-related fatalities depends on complete and good quality data.8 The reliability of mortality data in our state, however, has been impacted by several
constraints such as insufficient resources, training, or time for performing thorough death investigations. In addition, the ICD-10 coded data does not distinguish between illicit and
prescription fentanyl.
Acknowledgements:
Corresponding author: Manuela Staneva, MPH; Epidemiologist; Mississippi State Department of Health; [email protected]
Contributors: Thomas Dobbs, MD, MPH; Richard Jonson, MS; Meg Pearson, PharmD, MS; Paul Byers, MD; Carl Haydel, MS; Nykiconia Preacely, DrPH, MPH
References:
1. U.S. Prescribing Rates. 2016. Centers for Disease Control and Prevention://www.cdc.gov/drugoverdose/maps/rxstate2016.html.
2. O’Donnell JK, Gladden RM, Seth P. Trends in Deaths Involving Heroin and Synthetic Opioids Excluding Methadone, and Law Enforcement Drug Product Reports, by Census Region — United States, 2006–
2015. MMWR Morb Mortal Wkly Rep 2017;66:897–903. DOI: http://dx.doi.org/10.15585/mmwr.mm6634.
3. Quick Facts. U.S. Census Bureau: https://www.census.gov/quickfacts/fact/table/US/PST045216.
4. A Longitudinal Study of Multiple Drug Use and Overdose Among Young People Who Inject Drugs. Elise D. Riley, Jennifer L. Evans, Judith A. Hahn, Alya Briceno, Peter J. Davidson, Paula J. Lum, Kimberly
Page Am J Public Health. 2016 May; 106(5): 915–917. doi: 10.2105/AJPH.2016.303084: http://ajph.aphapublications.org/doi/10.2105/AJPH.2016.303084.
5. Centers for Disease Control and Prevention. Annual Surveillance Report of Drug-Related Risks and Outcomes.—United States, 2017. Surveillance Report 1. Centers for Disease Control and Prevention. US.
Department of Health and Human Services. Published August 31: https://www.cdc.gov/drugoverdose/pdf/pubs/2017-cdc-drug-surveillance-report.pdf.
6. Murphy SL, Xu JQ, Kochanek KD, Curtin SC, Arias E. Final Data for 2015. National Vital Statistics Reports; vol 66 no 6. Hyattsville, MD: National Center for Health Statistics. 2017: https://www.cdc.gov/
nchs/data/nvsr/nvsr66/nvsr66_06.pdf.
7. Ingram D, Franco S. 2013. NCHS urban-rural classification scheme for counties. National Center for Health Statistics. Accessed on 12//10/2017 from https://www.cdc.gov/nchs/data/series/sr_02/sr02_166.pdf.
8. Slavova et al. Drug Overdose Deaths: Let's Get Specific. Public Health Reports. 2015 Jul-Aug; 130(4): 339–342: http://ai2-s2-pdfs.s3.amazonaws.com/9555/b4c0ea72cd906bd9e12f6a0834465867f9c3.pdf.

MISSISSIPPI STATE DEPARTMENT OF HEALTH
![fgjk dk lans'k Shahganj MAgazine pdf/hindi... · 2019. 11. 20. · fgjk dk lans'k vYk&fgjk ifCyd Ldwy] 'kkgxat] iVuk;s gS vk/qfud t+ekuk] cPpksa ls cqtqxksZa rd Facebook, Whatsapp](https://static.fdocuments.net/doc/165x107/611d80edba44500b5b06669a/fgjk-dk-lansk-shahganj-magazine-pdfhindi-2019-11-20-fgjk-dk-lansk-vykfgjk.jpg)
![;YHKL 6US` - Jones Interiors · 2016. 3. 4. · v\y jvtwsphuj` jly[pmpjh[pvu pz vus` ]hspk ^olu [olzl [vnnslz hyl \zlk pu jvuq\uj[pvu ^p[o / )spuk *vyk ;OLZL ;VNNSLZ HYL H]HPSHISL](https://static.fdocuments.net/doc/165x107/60c5b202accee82f414a5edc/yhkl-6us-jones-interiors-2016-3-4-vy-jvtwsphuj-jlypmpjhpvu-pz-vus.jpg)


![Active Risk Manager Sword GRC & Amazon Web Services · & amazon web ser v ices. 4hu` i\zpulzzlz i lulmp[ myvt [ol kpz[puj[ p]l hk]hu[hnl vm :^vyk .9* zvs\[ pvuz pu jvuq\uj[pvu ^p[o](https://static.fdocuments.net/doc/165x107/5ec9dd56f4c826280677c1aa/active-risk-manager-sword-grc-amazon-web-services-amazon-web-ser-v-ices.jpg)


![T · (u hj[ vm z\itp[[pun huv[oly»z ^vyr ^vyk mvy ^vyk hz vul»z v^u *; ... [vwylzly]lp[ >opsl@vzltp[lovskzhzwljphsnypwvu[ol ^lz[lyutpuk wlyjlw[pvuzhiv\ ...](https://static.fdocuments.net/doc/165x107/5d45cd6d88c9936f738d5efb/t-u-hj-vm-zitppun-huvolyz-vyr-vyk-mvy-vyk-hz-vulz-vu-vwylzlylp.jpg)


