VVD for Cloud Providers Scale and Performance...VVD for Cloud Providers: Scale and Performance 9 |...
23
VVD for Cloud Providers: Scale and Performance Guidelines October 2018
Transcript of VVD for Cloud Providers Scale and Performance...VVD for Cloud Providers: Scale and Performance 9 |...

VVDfor Cloud Providers: Scale and Performance Guidelines October 2018

VVD for Cloud Providers: Scale and Performance
2 | VMware vCloud® Architecture Toolkit™ for Service Providers
© 2018 VMware, Inc. All rights reserved. This product is protected by U.S. and international copyright and intellectual property laws. This product is covered by one or more patents listed at http://www.vmware.com/download/patents.html.
VMware is a registered trademark or trademark of VMware, Inc. in the United States and/or other jurisdictions. All other marks and names mentioned herein may be trademarks of their respective companies.
VMware, Inc. 3401 Hillview Ave Palo Alto, CA 94304 www.vmware.com

VVD for Cloud Providers: Scale and Performance
3 | VVD for Cloud Providers: Scale and Performance
Contents
Introduction ........................................................................................................ 5 1.1 Audience ................................................................................................................. 5 1.2 Scope ...................................................................................................................... 5
Interoperability Stack (Bill of Materials) ............................................................. 7 2.1 Support ................................................................................................................... 9 2.2 Performance Characteristics ................................................................................ 10
Sizing Guidelines ................................................................................................ 12 3.1 Tenant Resource Capacity Clusters ...................................................................... 12 3.2 Management and Resource Component Sizing .................................................... 12
Appendix A – Test Environment and Benchmarking Methods ......................... 15 Test Environment ....................................................................................................... 15 Management Cluster .................................................................................................. 15 Resource Cluster ......................................................................................................... 17 Test Driver .................................................................................................................. 20 Benchmarking Methods ............................................................................................. 20 Scale Test .................................................................................................................... 20 Performance Test ....................................................................................................... 20 Uptime Tests ............................................................................................................... 21 List of Operations ....................................................................................................... 21
Appendix B – FAQ .............................................................................................. 23

VVD for Cloud Providers: Scale and Performance
4 | VVD for Cloud Providers: Scale and Performance
List of Tables
Table 1. Bill of Materials ................................................................................................... 7 Table 2. Scale Profile B .................................................................................................... 9 Table 3. Performance and Throughput .......................................................................... 10 Table 4. API Operations Latency ................................................................................... 10 Table 5. OVF Upload and Download Times ................................................................... 11 Table 6. VM Migration to vCloud Director ...................................................................... 11 Table 7. Network Latency Impact on Migration Performance ........................................ 11 Table 6. Management and Resource Component Sizing .............................................. 12 Table 7. vCloud Director Operations (Part 1) ................................................................. 21 Table 8. vCloud Director Operations (Part 2) ................................................................. 22
List of Figures
1. Management Component Deployment ...................................................................... 16 Figure 2. Management Cluster Networking .................................................................... 17 Figure 3. Resource Cluster Setup .................................................................................. 18 Figure 4. Resource Cluster Networking ......................................................................... 19

VVD for Cloud Providers: Scale and Performance
5 | VVD for Cloud Providers: Scale and Performance
Introduction The VVD for Cloud Providers: Scale and Performance Guidelines (Scale and Performance) is an evolution of Certified Reference Design for VMware Cloud Providers™. It is a pre-validated set of software components that simplify the deployment of a VMware vCloud Director® based multitenant cloud in a predictable and efficient manner. The intent of the Scale and Performance initiative is to document a verified stack and provide scale and performance benchmarking. It also helps reduce the complexity of figuring out dependencies between the VMware components required for a vCloud Director based service. While this initiative does not yet involve software automation for software upgrades, it aims to clearly present what components are needed, which versions should be used, and what kind of scale and performance VMware Cloud Providers can expect.
VMware Cloud Providers get clarity and predictability about which version of each software component of the stack is recommended at a given time. Each Scale and Performance version also comes with a predictable support time frame for all underlying components, typically 12 – 18 months from the launch of the corresponding Scale and Performance release. This reduces the expense and time involved in determining what components to upgrade when and to which version, so that the entire software stack stays in support and incompatible combinations are avoided.
VMware Cloud Providers also benefit from clear guidelines for sizing hardware and software components to match their expected tenant load. While the Scale and Performance does not cover every cloud configuration and size, it provides a sizing recommendation for a “typical” cloud (a cloud size representative of a broad set of VMware Cloud Providers). Future versions of the Scale and Performance may address larger and less common environment configurations as well as more specialized use cases.
It is not the current intent of Scale and Performance to push vCloud Director to its absolute limits. For configuration maximums and limits, see the VMware vCloud Director Configuration Maximums.
This document also includes the expected performance as observed by tenant users and VMware Cloud Provider administrators interacting with the vCloud Director user interface and API.
A vCloud Director based platform can be properly sized by following the sizing guidelines for hardware and scale based on anticipated tenant demand.
1.1 Audience This document is intended for VMware Cloud Provider architects and technical leads responsible for planning and executing the deployment and upgrades of a VMware-based cloud environment.
1.2 Scope This document addresses the following aspects:
• Interop stack
Provides a list of certified versions of all of the component software comprising the software stack. Using the recommended versions guarantees known support life of the stack as well as performance characteristics.
• Sizing guidelines and software requirements
• Performance characteristics of the solution
The certified solution stack provides known performance and scale characteristics and comes with recommendations and guidelines for hardware and scale based on anticipated tenant demand.

VVD for Cloud Providers: Scale and Performance
6 | VVD for Cloud Providers: Scale and Performance
Consult complimentary documents that are part of the VMware vCloud® Architecture Toolkit™ for Service Providers:
• Architecting a VMware vCloud Director Solution for VMware Cloud Providers
• Architecting Tenant Networking with VMware NSX® in VMware vCloud Director
• Developing a Hyper-Converged Storage Strategy for VMware vCloud Director with VMware vSAN™
• VMware vCloud Director Configuration Maximums
The VMware Product Interoperability Matrices is the authoritative resource for interoperability between VMware software components.
A compliant solution must comply with all relevant security guidelines outlined in the product-specific documentation as well as security recommendations in the VMware vCloud Architecture Toolkit for Service Providers document.

VVD for Cloud Providers: Scale and Performance
7 | VVD for Cloud Providers: Scale and Performance
Interoperability Stack (Bill of Materials) The Bill of Materials table lists the pre-validated set of software components for Cloud Providers at the time of the Scale and Performance 9.1 launch. While VMware Cloud Providers are free to choose and pick other versions or different combinations of VMware Cloud Provider Program software products, the specified stack guarantees a known predictable support time and specific performance and scaling characteristics. Performance and scaling information is provided later this document. Products marked “Core” are required to officially achieve VVD for Cloud Providers compliance.
Table 1. Bill of Materials Component Version
and Build Core/ Optional
Notes
VMware vCenter Server®
6.5 Core See Table 8 for patch level tested.
VMware ESXi™ 6.5 Core See Table 8 for patch level tested.
VMware NSX 6.4 Core
VMware vSAN 6.6 Core See Note 2
vCloud Director 9.1 Core 1. Databases tested:
• Main Database: both PostgreSQL 10.3 and Microsoft SQL Server 2016
• Metric Database: Cassandra 3.9
2. Apply the latest available patch of vCloud Director 9.1.
vCloud Director Extender
1.1 Optional
VMware vRealize® Log Insight™
4.6 Optional
VMware vRealize® Network Insight™
3.9 Optional Apply the latest available patch.
VMware vRealize® Orchestrator™
7.4 Optional Apply the latest available patch.
VMware vCloud Usage Meter
3.6 Core Apply the latest available patch.
VMware vRealize Operations™
7.0 Optional Apply the latest available patch.
Note 1. These are the recommended set of products, but this is not a full interoperability matrix. For example, vCloud Director 9.1 is supported with multiple versions of NSX but in the current benchmarking we used a specific NSX version. Test results generally apply to a product version
VVD for Cloud Providers: Scale and Performance
8 | VVD for Cloud Providers: Scale and Performance
regardless of individual patches. See the VMware Product Interoperability Matrix for full vCloud Director interoperability information.
2. vSAN based storage must be deployed in at least one cluster (either management or capacity).

VVD for Cloud Providers: Scale and Performance
9 | VVD for Cloud Providers: Scale and Performance
2.1 Support Each component of the Cloud Provider Platform stack is supported according to its support lifecycle. A cloud deployment compliant with the Bill of Materials is in support for at least 12 months after the Scale and Performance release date.
The Scale Profile B table represents a common environment similar to the environments of approximately 60% of all VMware Cloud Providers. While vCloud Director is capable of a larger scale, the following profile is what is validated and benchmarked in the current Scale and Performance.
Table 2. Scale Profile B Parameter Value
Number of tenants (Organizations in vCloud Director) 400
Number of tenant workloads (mix of powered-on and powered-off virtual machines)
15,000
Number of powered-on tenant virtual machines (with OS installed)
5,000
Number of data centers 1
Number of vCloud Director cells 4
Number of vCenter Server instances managed by vCloud Director 1 vCenter Server for management cluster
3 vCenter Server instances for resource capacity
Number of hosts and clusters 3 resource capacity clusters
1 management cluster
Maximum network latency from vCloud Director to VMware vCenter Server, VMware NSX Manager™, and ESXi hosts
Network RTT latency up to 150 ms
Concurrent API operations Up to 128 concurrent users executing operations against the vCloud Director API
Concurrent VM migrations to vCloud Director from tenant environments by vCloud Director Extender
100

VVD for Cloud Providers: Scale and Performance
10 | VVD for Cloud Providers: Scale and Performance
2.2 Performance Characteristics
2.2.1 Environment Setup The multitenant cloud environment is set up based on Scale Profile B.
Testing is performed at different levels of network latency from vCloud Director cells to vCenter Server and NSX Manager to measure the impact of network latency on performance.
2.2.2 Performance and Throughput The test throughput is measured as the number of operations executed over 30 minutes. The test was run with different test concurrency (32, 64, and 128) and network latency (0.3 ms, 40 ms, and 150 ms). During this test, a representative random sample of operations from the List of Operations is used.
Table 3. Performance and Throughput Concurrency
(Number of concurrent users)
Throughput at RTT = 0.3 ms
(Successfully completed operations per minute)
Throughput at RTT = 40 ms
Throughput at RTT = 150 ms
32 82 76 61
64 113 109 90
128 201 191 159
2.2.3 API Latency The API Operations Latency table shows average user observed latency (in seconds) for a selection of API operations at RTT = 0.3 ms. See the
List of Operations for the full list of operations invoked during this test.
Table 4. API Operations Latency Operation
Concurrency
32 64 128
Instantiate 150 MB vApp from a template 44 s 57 s 103 s
Create edge gateway 95 s 122 s 160 s
Create independent disk 35 s 74 s 76 s
Increasing network RTT from 0.3 ms to 150 ms affects these numbers with the size of the effect varying significantly depending on the operation. With vast majority of API operations RTT increase from 0.3 ms to 150 ms caused the latency to increase by a factor of 2 or less.
VVD for Cloud Providers: Scale and Performance
11 | VVD for Cloud Providers: Scale and Performance
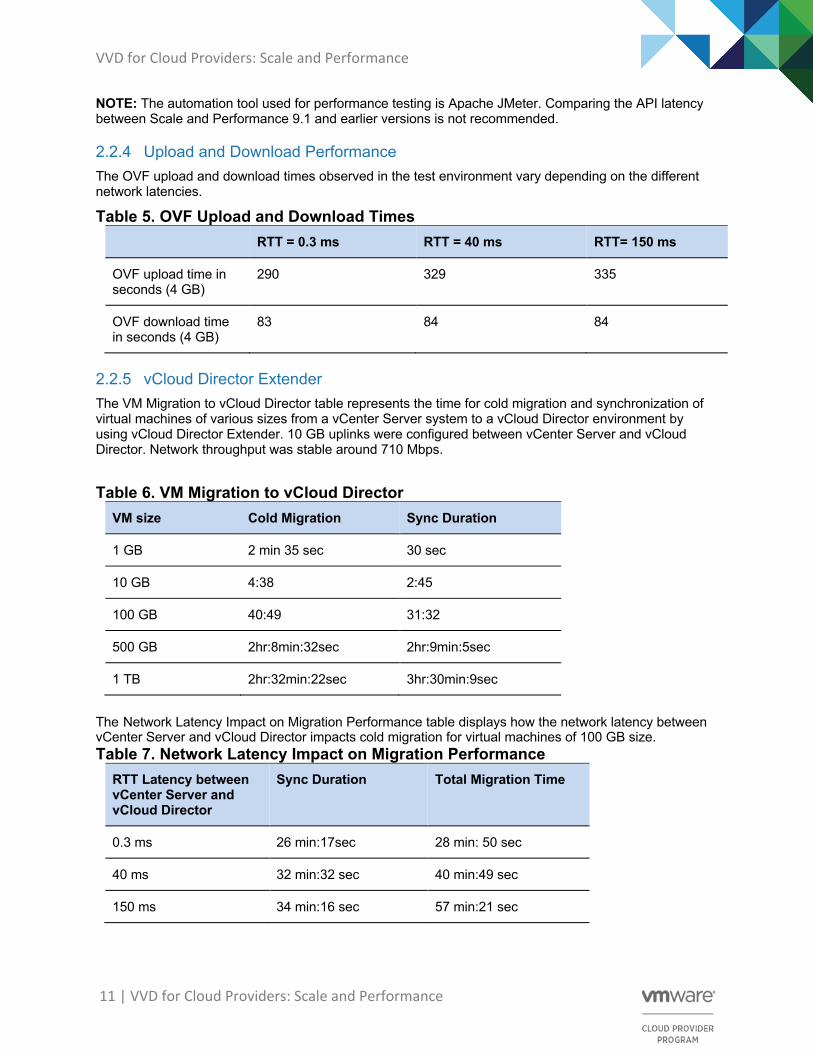
NOTE: The automation tool used for performance testing is Apache JMeter. Comparing the API latency between Scale and Performance 9.1 and earlier versions is not recommended.
2.2.4 Upload and Download Performance The OVF upload and download times observed in the test environment vary depending on the different network latencies.
Table 5. OVF Upload and Download Times RTT = 0.3 ms RTT = 40 ms RTT= 150 ms
OVF upload time in seconds (4 GB)
290 329 335
OVF download time in seconds (4 GB)
83 84 84
2.2.5 vCloud Director Extender The VM Migration to vCloud Director table represents the time for cold migration and synchronization of virtual machines of various sizes from a vCenter Server system to a vCloud Director environment by using vCloud Director Extender. 10 GB uplinks were configured between vCenter Server and vCloud Director. Network throughput was stable around 710 Mbps.
Table 6. VM Migration to vCloud Director
VM size Cold Migration Sync Duration
1 GB 2 min 35 sec 30 sec
10 GB 4:38 2:45
100 GB 40:49 31:32
500 GB 2hr:8min:32sec 2hr:9min:5sec
1 TB 2hr:32min:22sec 3hr:30min:9sec
The Network Latency Impact on Migration Performance table displays how the network latency between vCenter Server and vCloud Director impacts cold migration for virtual machines of 100 GB size. Table 7. Network Latency Impact on Migration Performance
RTT Latency between vCenter Server and vCloud Director
Sync Duration Total Migration Time
0.3 ms 26 min:17sec 28 min: 50 sec
40 ms 32 min:32 sec 40 min:49 sec
150 ms 34 min:16 sec 57 min:21 sec

VVD for Cloud Providers: Scale and Performance
12 | VVD for Cloud Providers: Scale and Performance
Sizing Guidelines Use these guidelines to size the hardware and software components to match your anticipated tenant load. These guidelines apply to environments with size which is roughly similar to or smaller than Scale Profile B.
Sizing of the environment is done in two steps:
1. By determining the number of vCenter Server instances, ESXi hosts, and vCloud Director cells to use for handling at least 15,000 VMs with 9000 powered-on VMs.
2. By making specific configurations of resources (memory, CPU, disk) for each component in the stack.
3.1 Tenant Resource Capacity Clusters Number of vCenter Server instances
The vCenter Server sizing guide suggests using a medium profile of vCenter Server to support 4000 VMs. Number of vCenter Server instances = number of VMs/4000 = 15,000/4000 = 4 (rounded)
Number of ESXi hosts ESXi host count is determined based on the number of powered-on VMs, using the formula below. The formula provides a rough estimate and the actual number of hosts required depends on many parameters and the type of workloads. Number of hosts = (number of powered on VMs * Avg # of vCPUs per VM) / (sockets*cores*hyper threading*vCPU-to-pCPU ratio) = (9000*1)/(2*8*2*16) = 17 We used 21 hosts, with a set of 6 managed by each vCenter Server.
Number of vCloud Director cells
As with the vCloud Director design guide, the number of vCloud Director cells for this setup is calculated using following formula: Number of vCloud Director cells = (Number of VMs/4000) + 1 = (15,000/4000) + 1 = 5 (rounded)
3.2 Management and Resource Component Sizing The following table summarizes sizing choices made for various management components.
Table 8. Management and Resource Component Sizing Component Version Size Resources Notes
Management vCenter Server
(vCenter Server Appliance with an embedded Platform Services Controller)
6.5 Update 2b Tiny RAM: 10 GB
CPU: 2
Storage: 250 GB
1 management vCenter Server
Resource vCenter Server
(vCenter Server Appliance with an embedded Platform Services Controller)
6.5 Update 2c Medium RAM: 24 GB
CPU: 8
Storage: 400 GB
3 resource vCenter Server instances

VVD for Cloud Providers: Scale and Performance
13 | VVD for Cloud Providers: Scale and Performance
Component Version Size Resources Notes
ESXi 6.5 Update 2c
vSAN (deployed in management cluster)
6.6.1
NSX for vSphere 6.4.3 RAM: 16 GB
CPU: 4
Storage: 60 GB
vCloud Director 9.1.0.2 RAM: 16GB
CPU: 4
Storage: 60 GB
Allocate 60 GB of storage for each vCloud Director cell and 500 GB of shared NSX storage for the vCloud Director transfer service.
vCloud Director DB Microsoft SQL Server 2016 Enterprise SP2
RAM: 32GB
CPU: 16
Storage: 500 GB
vCloud AMQP RabbitMQ 3.6.1
vRealize Log Insight deployment
4.6.1 Medium RAM: 16 GB
CPU: 8
Storage: 1 TB
Use the vRealize Log Insight sizing calculator: http://www.vmware.com/go/loginsight/calculator
vCloud Usage Meter 3.6.1 Standard
RAM: 4 GB
CPU: 2
Storage: 100 GB
Use the deployment requirements for vCloud Usage Meter 3.6: https://www.vmware.com/support/vcloud-usage-meter/doc/vcloud-usage-meter-36-interop.html
vRealize Operations Manager
7.0 Large RAM: 32GB x 3
CPU: 8 x 3
Storage: 300GB x 3
Use the vRealize Operations sizing guidelines: https://kb.vmware.com/s/article/54370

VVD for Cloud Providers: Scale and Performance
14 | VVD for Cloud Providers: Scale and Performance
Component Version Size Resources Notes
Management Pack for NSX for vSphere
3.5.2
Management Pack for vSphere
7
Management Pack for vRealize Log Insight
7
Management Pack for vCloud Director
5
Management Pack for Storage Devices
7
Management Pack for vSAN
2.0
vCloud Director Extender
1.1.0.1
VVD for Cloud Providers: Scale and Performance
15 | VVD for Cloud Providers: Scale and Performance
Appendix A – Test Environment and Benchmarking Methods
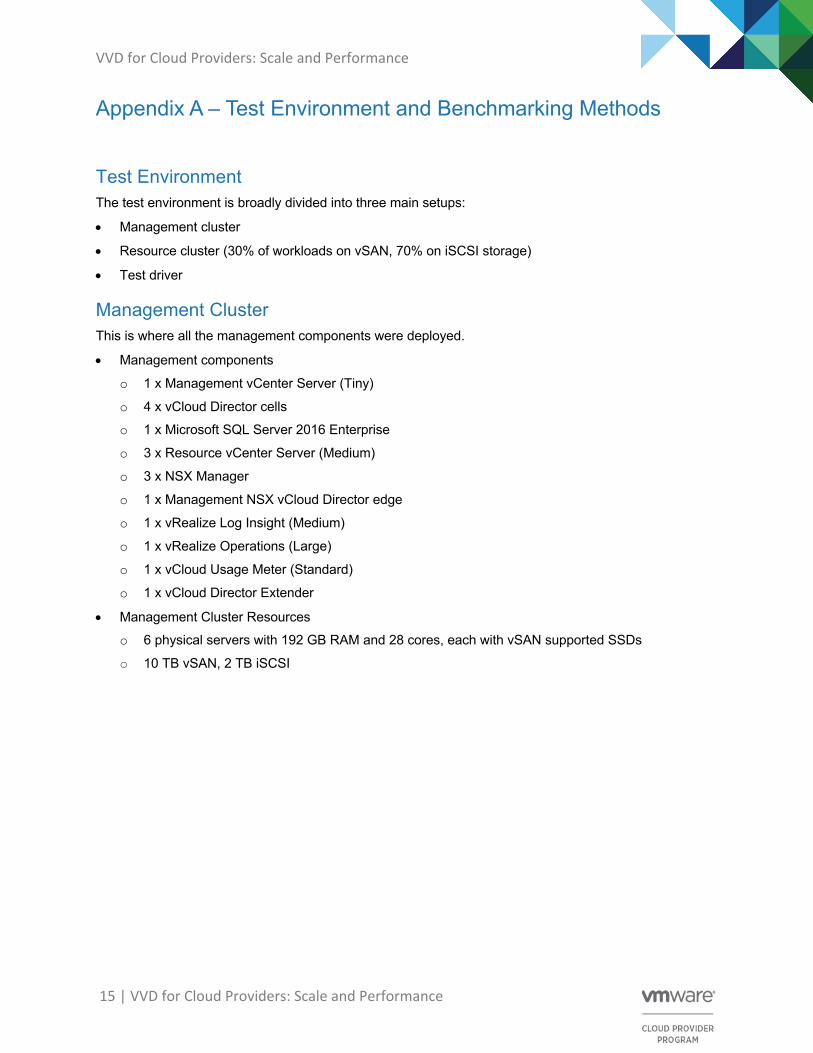
Test Environment The test environment is broadly divided into three main setups:
• Management cluster
• Resource cluster (30% of workloads on vSAN, 70% on iSCSI storage)
• Test driver
Management Cluster This is where all the management components were deployed.
• Management components
o 1 x Management vCenter Server (Tiny)
o 4 x vCloud Director cells
o 1 x Microsoft SQL Server 2016 Enterprise
o 3 x Resource vCenter Server (Medium)
o 3 x NSX Manager
o 1 x Management NSX vCloud Director edge
o 1 x vRealize Log Insight (Medium)
o 1 x vRealize Operations (Large)
o 1 x vCloud Usage Meter (Standard)
o 1 x vCloud Director Extender
• Management Cluster Resources
o 6 physical servers with 192 GB RAM and 28 cores, each with vSAN supported SSDs
o 10 TB vSAN, 2 TB iSCSI

VVD for Cloud Providers: Scale and Performance
16 | VVD for Cloud Providers: Scale and Performance
1. Management Component Deployment

VVD for Cloud Providers: Scale and Performance
17 | VVD for Cloud Providers: Scale and Performance
Figure 2. Management Cluster Networking
Resource Cluster This is where Tenant Organizations and workload virtual machines were created.
• Resource cluster resources
o 20 physical servers with 192 GB RAM and 28 cores, each with vSAN supported SSDs
o 30 TB vSAN, 10 TB iSCSI

VVD for Cloud Providers: Scale and Performance
18 | VVD for Cloud Providers: Scale and Performance
Figure 3. Resource Cluster Setup

VVD for Cloud Providers: Scale and Performance
19 | VVD for Cloud Providers: Scale and Performance
Figure 4. Resource Cluster Networking

VVD for Cloud Providers: Scale and Performance
20 | VVD for Cloud Providers: Scale and Performance
Test Driver The test suite is executed from this environment.
• 4 CPU, 8 GB memory, Cent OS 7.3
Benchmarking Methods The testing process is focused primarily on verifying and measuring environment behavior for:
• Scale – Verify whether the environment meets the Scale Profile B requirement of 15,000 virtual machines and 9000 powered-on virtual machines.
• Performance – Measure operation latency and throughput when the environment is running at scale (15,000 virtual machines with 9000 powered-on virtual machines).
• Uptime – Verify that the environment can operate at scale with reasonable performance for a long time.
The remainder of this section details the exact methods used for test execution and measurement.
Scale Test Scale was carried out with a mix of manual operations and JMeter test tool-based script operations by using the following steps:
1. Create 400 Tenant Organizations in vCloud Director.
2. Create 15,000 virtual machines across these 400 Tenant Organizations.
• 90% of the virtual machines were Dummy Small Tiny virtual machines with 4 MB disk, 4 MB memory
• 10% actual virtual machines
o 7% Linux virtual machines
o 3% Windows virtual machines
3. Power on 9000 virtual machines with similar distribution (90%:10%) of dummy to actual virtual machines.
4. Some simple vCloud Director operations were carried out to verify that system behaves normally at this scale.
Performance Test Performance tests were done by executing a well-known distribution of vCloud Director operations with the help of an internal test tool. For the complete operation list, see List of Operations.
The following were the key steps in execution and measurement of the operations:
1. Scaled up the environment as outlined in the previous section.
2. After the environment was at scale, executed continuous stream of operations for 30 minutes with following distribution:
• 35-40% vApp operations such as instantiate, deploy, edit, clone, and delete.
• 25% storage-centric operations such as create, attach, detach, and delete disk.
• 15% networking-related operations, such as create and delete gateway, routed networks and firewall configurations.
• 5% create and delete Orgs, users, catalogs, and virtual data centers.

VVD for Cloud Providers: Scale and Performance
21 | VVD for Cloud Providers: Scale and Performance
3. Operations were executed using vCloud Director local users of different roles (vApp Author, Org Admin, System Admin) with 10% admin roles and 90% user operation roles.
5. Given that most of the operations are asynchronous, the test tool monitors the task returned by vCloud Director to get completion status and execution time details.
6. Steps 2 to 4 were repeated with 32, 64, and 128 concurrent users to ascertain the ability of the system to deal with concurrent operation invocation.
7. Step 5 was repeated for following latency (between vCloud Director and vCenter Server) values (achieved by artificial latency injection with a tool):
• 0.3 ms (default)
• 40 ms
• 150 ms
Uptime Tests Uptime tests involved executing operations carried out during performance tests, with following changes to exaction duration and concurrency:
1. Tests ran continuously for 7 days.
2. Of 100 concurrent users each invoked an operation at every 20 seconds.
3. No artificial latency injection was done.
List of Operations For performance benchmarking, API test clients executed a predetermined distribution across different types of vCloud Director operations as described in the following tables.
Table 9. vCloud Director Operations (Part 1) vApp Operations Network Operations Management Operations
Instantiate vApp Deploy fenced vApp Create org
Deploy (power on) Undeploy fenced vApp Create user
Edit vApp Create isolated network Create Org VDC
Compose vApp Delete isolated network Create direct VDC network
Clone vApp Create gateway Create catalog
Power off vApp Create routed Org network Delete catalog
Delete vApp Instantiate vApp in that network Delete VDC network
Deploy vApp Delete Org VDC
Undeploy vApp Delete user
Delete vApp Delete Org
Delete routed Org network
VVD for Cloud Providers: Scale and Performance
22 | VVD for Cloud Providers: Scale and Performance
Delete gateway
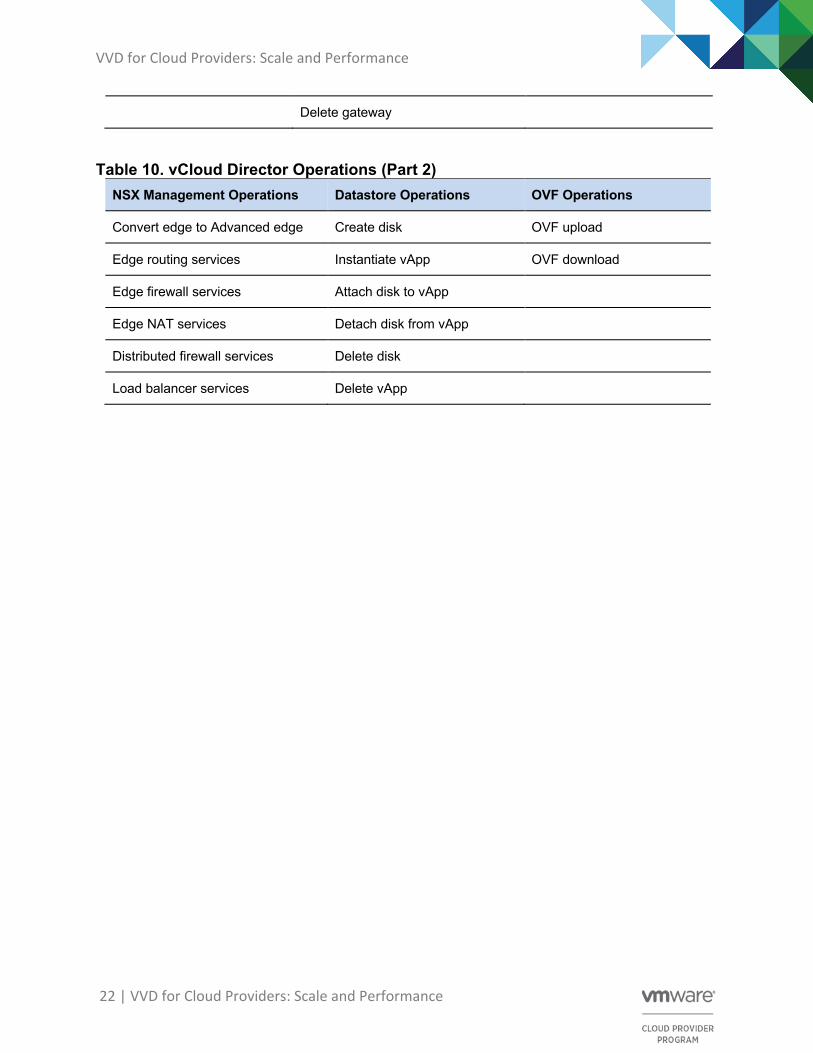
Table 10. vCloud Director Operations (Part 2) NSX Management Operations Datastore Operations OVF Operations
Convert edge to Advanced edge Create disk OVF upload
Edge routing services Instantiate vApp OVF download
Edge firewall services Attach disk to vApp
Edge NAT services Detach disk from vApp
Distributed firewall services Delete disk
Load balancer services Delete vApp

VVD for Cloud Providers: Scale and Performance
23 | VVD for Cloud Providers: Scale and Performance
Appendix B – FAQ How frequently will the Scale and Performance be updated?
Ø We expect to release an updated Scale and Performance with every major vCloud Director release.
How is this document related to the VMware interoperability matrix?
Ø The benchmarked stack is a subset of the full interoperability matrix and reflects the exact components we validated and benchmarked in this exercise. The full interoperability includes many more products and versions than what is tested in this exsercise
How is the Scale and Performance related to VMware Cloud Foundation?
Ø VMware Cloud Foundation is not currently part of the benchmarking, however the stack we are testing is closely aligned with VCF
Is Scale and Performance suitable for greenfield environments or brownfield environments?
Ø Any environment can be made compliant by simply upgrading all of its components to versions listed in the Scale and Performance Bill of Materials. There is no other qualification.
How can we provide input/recommendations for future versions of this doc? Ø Contact vCloud Director team at [email protected] or reach out to your VMware
account team and pass your feedback through them.