Vulnerability of Southern Mediterranean Countries to Exogenous Shocks: Structural VAR Approach
23
Online Publication Date: 10 January, 2012 Publisher: Asian Economic and Social Society Vulnerability of Southern Mediterranean Countries to Exogenous Shocks: Structural VAR Approach Sarra BEN SLIMANE (Najran University, DEFI Université de la Méditerranée Aix Marseille II) Moez BEN TAHAR (CEMAFI, Université de Nice Sophia Antipolis and LEFA, IHEC Carthage) Zied ZSSID (CEMAFI, Université de Nice Sophia) Citation: Sarra BEN SLIMANE, Moez BEN TAHAR, Zied ZSSID (2011): “ Vulnerability of Southern Mediterranean Countries to Exogenous Shocks: Structural VAR Approach ” Asian Economic and Financ ial Review Vol.1, No.4, p p.254-275.
-
Upload
editoraess -
Category
Documents
-
view
218 -
download
0
Transcript of Vulnerability of Southern Mediterranean Countries to Exogenous Shocks: Structural VAR Approach

8/3/2019 Vulnerability of Southern Mediterranean Countries to Exogenous Shocks: Structural VAR Approach
http://slidepdf.com/reader/full/vulnerability-of-southern-mediterranean-countries-to-exogenous-shocks-structural 1/23
Online Publication Date: 10 January, 2012
Publisher: Asian Economic and Social Society
Vulnerability of Southern Mediterranean Countries to Exogenous
Shocks: Structural VAR Approach
Sarra BEN SLIMANE (Najran University, DEFI Université de la Méditerranée Aix
Marseille II)
Moez BEN TAHAR (CEMAFI, Université de Nice Sophia Antipolis and LEFA, IHEC
Carthage)
Zied ZSSID (CEMAFI, Université de Nice Sophia)
Citation: Sarra BEN SLIMANE, Moez BEN TAHAR, Zied ZSSID (2011): “ Vulnerability of
Southern Mediterranean Countries to Exogenous Shocks: Structural VAR Approach ” Asian Economic
and Financial Review Vol.1, No.4, pp.254-275.

8/3/2019 Vulnerability of Southern Mediterranean Countries to Exogenous Shocks: Structural VAR Approach
http://slidepdf.com/reader/full/vulnerability-of-southern-mediterranean-countries-to-exogenous-shocks-structural 2/23
Asian Economic and Financial Review, 1(4),pp.254-275
254
Introduction
Developing countries are characterized by high
volatility of economic performance mainly due to
fluctuations whose origins are not well identified.
Several studies have addressed the issue of economic fluctuations in the Mediterranean region
because of the disappointment caused by their slow
growth and the considerable variation in economic
activity. These studies show the preponderance of
the secular nature and erratic economic growth
mainly due to the uneven development of key
macroeconomic aggregates, particularly the growth
rate. This irregularity results from the exposure of
these countries to exogenous shocks.
Because of their economic structures,
Mediterranean countries are open to the rest of the
world and their growth paths are dependent on both
the turbulent changes of international environment
and various external shocks. The economic
fluctuations of these countries have recently beenshaken by violent turbulence shocks including oil
price shocks and cons, changing terms of trade, the
trend of global growth, the turbulent international
financial system, the crises of political international
and obviously the current financial crisis.
In the light of these findings, the identification of
the nature of economic fluctuations is an important
factor in macroeconomic management in thesecountries and constitutes an important step to
minimize costs incurred by macroeconomic
instability. To identify the relative importance of
each type of shock, empirical studies literature use
structural VAR models or stochastic general
equilibrium models.
Recently a number of research purposes to analyze
economic fluctuations in developing countries.
Pindyck [1991], Aizenman and Marion [1993] have
developed a theoretical framework to suggest thatmacroeconomic volatility has a negative effect in
terms of economic growth. Ramey and Ramey
[1995] found that developing countries have low
growth rates because they suffer from a highly
volatile environment.
Other authors support the idea that economic
instability is linked to external shocks such as
fluctuations in terms of trade, international
economic conditions and natural disasters.Mendoza [1995] showed that external shocks,
especially terms of trade shocks, explained 56% of
the variability of GDP and the real exchange rate.
However, Hausman and Gavin [1995] found thatexternal shocks explain only a negligible proportion
Vulnerability of Southern Mediterranean Countries to Exogenous Shocks:Structural VAR Approach
Abstract
Author (s)
Sarra BEN SLIMANE Najran University, DEFI Université de la
Méditerranée Aix Marseille II
E-mail: [email protected]
Moez BEN TAHAR CEMAFI, Université de Nice Sophia Antipolis
and LEFA, IHEC Carthage.
E-mail: [email protected]
Zied ZSSID CEMAFI, Université de Nice Sophia
E-mail:[email protected]
Key words: Economic Fluctuations,
SVAR, Southern Mediterranean.
All statistics and empirical studies relating to the Mediterranean region show the
irregular fluctuation of the main macroeconomic aggregates. It is appear that the
vulnerability of these countries is largely the result of different range of shocks.
Regarding their economic structures, the prospects of growth for Southern
Mediterranean countries are largely driven by changes in their externalenvironment. Among the external shocks affecting these countries, we include oil
price shocks, terms of trade, the trend of global growth, turmoil in the international
financial system, and the crises of international policies (2nd and 3rd war Gulf,
event of September 11 ...) and obviously the current global financial crisis.
The interest of this work is to determine the various domestic and external shocks
affecting the level of economic activity and prices and to identify, later, the mainexogenous sources of economic fluctuations in the Southern Mediterranean
countries. The sources of fluctuations are determined using a Structural VAR
model.

8/3/2019 Vulnerability of Southern Mediterranean Countries to Exogenous Shocks: Structural VAR Approach
http://slidepdf.com/reader/full/vulnerability-of-southern-mediterranean-countries-to-exogenous-shocks-structural 3/23
Vulnerability of Southern Mediterranean Countries.....
255
of domestic GDP fluctuations and real exchange
rate.
Roldos and Hoffmaister [1996] evaluated the
contribution of domestic (supply and demand) and
external shocks (oil shocks, changes in the global
economy and structural reforms) in economicfluctuations of two developing countries Korea and
Brazil. They identified two constraints; the first
reflects the assumption of a small open economy so
that domestic shocks do not affect the economies of
the world. The second constraint is used to identify
supply shocks and demand as the latter does not
affect production in the long term. The results
show the dominance of supply shocks in explaining
output fluctuations, even in the short run.However, external shocks explain only 20% of
economic fluctuations, which contradicts previous
conclusions which attributed to the international
environment an important weight in explainingeconomic fluctuations. Finally, nominal shocks and
fiscal impulses are dominant in the explanation of inflation and exchange rates.
Roldos and Hoffmaister [1997] conducted
empirical studies using VAR model to determine
the source of macroeconomic fluctuations in
developing countries. Their analysis focuses on the
external shocks (terms of trade, the world interest
rate) and domestic (supply or demand shocks). The
results show that domestic shocks are the source of
macroeconomic fluctuations in developing
countries. The terms of trade and world interestrate account for 7% and 6% variations in
production in Asia.
Hoffmaister, Roldos and Wickham [1998]
compared the sources of macroeconomic
fluctuations in African Franc Zone countries and
other sub-Saharan countries. The results show that
internal shocks are more dominant in explaining
economic fluctuations. However, external shocks
(terms of trade, foreign demand and international
interest rate) are relatively low. The contribution of
terms of trade dominates the role of external shocksand it appears to have a great influence (15%),
while that of the world interest rate is 6%.
Kose and Riezman [2001] identified the role of
external shocks in macroeconomic fluctuations in
Africa using a multi-sector dynamic stochastic
general equilibrium model that reproduces the main
stylized facts of 22 African countries during the
period 1970-1992. The economy is facingtechnological, trade and financial shocks.
Technological shocks are represented by the total
productivity factor in each activity sector, trade
shocks correspond to the relative prices of capitalgoods and intermediate goods imported from theexported raw materials prices, while financial
shocks are associated with world interest rates. The
results show that 44% of economic fluctuations in
are due to the trade shocks, 80% of the fluctuations
of investment and labor supply are induced by
external shocks as well. Thus, the importance of
interest rates is significant only in cases where
highly indebted countries were considered.
Arreaza and Dorta [2004] assessed changes in
economic activities in Venezuela on the basis of
quarterly data. They conclude that domestic shocks
caused by supply shocks explain about 70% of the
volatility of non-oil GDP. They found that nominal
shocks contribute about 50% of the variability of
inflation. These results are consistent with those
proposed by Hoffmaister, Roldos ([1997], [2001])and Ahmed [2003] for the countries of Latin
America.
The interest of our paper is to determine the variousdomestic and external shocks affecting economic
activities and to identify later the main exogenous
sources of economic fluctuations in the
Mediterranean region. The purpose of this paper is
to present a framework for empirical analysis that
will address the following questions:
What are the effects of exogenous shocks on
economic fluctuations in the Mediterranean area?
What is the contribution of domestic and external
shocks in the variability of real activity in the SouthMediterranean area?
Do the countries of the Mediterranean area exhibit
the same sensitivity to sources of external shocks?
Choice of variablesTwo types of shocks are considered, domestic and
external ones. The domestic shocks are measured
by the industrial production index; this variable
reflects changes in productivity with an innovation
called "supply shock". The index of consumer
prices, this indicator is an important predictor of
production. We choose also the real exchange rate.The choice of this variable determines the
transmission between the monetary sphere and the
real economy. Indeed, we want to know how a
shock on the real exchange rate affects the domestic
GDP.
As far as external shocks are concerned, they are
the terms of trade. Changes in the terms of trade are
a major external shock to developing countries,
because they affect the gains a country obtains or
the losses it undergoes in international trade. These
terms of trade were taken into account in severalempirical studies, looking for sources of economic
fluctuations in developing countries because they

8/3/2019 Vulnerability of Southern Mediterranean Countries to Exogenous Shocks: Structural VAR Approach
http://slidepdf.com/reader/full/vulnerability-of-southern-mediterranean-countries-to-exogenous-shocks-structural 4/23
Asian Economic and Financial Review, 1(4),pp.254-275
256
are an essential part of mechanism for adjusting the
balance of payments. The oil price is an external
variable that is largely the decision of OPEC, and
causes changes in GDP as well as the foreign terms
of trade. The high oil prices affect the economy
through four channels. The first is the transfer of
income is the importing countries to oil exportingcountries. The second channel is the increase in
crude oil prices resulting in higher relative prices of
goods and services. The third channel is that the
price of oil can have a magnified impact on theprice level and inflation. The last channel is the
financial market. It is influenced directly and
indirectly by increasing the price of oil. The
current and anticipated changes in economic
activity, inflation and monetary policy, which are
due to increased oil prices affect the price of sharesand bonds on the market and exchange rates.
Structural VAR model for SouthernMediterranean CountriesBefore estimating VAR model, we must firstdetermine the order of integration of series and the
possible presence of co-integration relationships,
that is to say, the long-term relationships between
variables.
We use quarterly data covering the period 1980:1-
2008: 4. All variables are expressed in logarithm.
The statistical tests for stationary level variables for
all countries are reported in Table (1), Augmented
Dicky Fuller test (ADF) and Phillips-Perron (PP)
test accept the presence of a unit root in the fiveseries expressed in level. The statistical tests of
stationary for the variables in first differences are
reported in Table (2). The (ADF) and (PP) tests
reject the null hypothesis of unit root at 5% for all
variables. Thus, all variables are stationary in first
difference.
To test the possible existence of cointegration
relationship between variables, we rely on
cointegration test implemented by Johansen [1991]
and Johansen and Jesulius [1990]. To determine
the number of cointegration vectors r, Johansenproposes two statistics: the trace test and the test of
the Eigen value. Both tests are likelihood ratio tests;
however, the test trace is used more than the Eigen
value. We adopt the trace test in the development of our cointegration tests.
The results of cointegration tests are reported in
Table (3). We can reject the null hypothesis of no
cointegration at the statistical threshold of 5% forall countries. However, we accept the null
hypothesis that there are at most two cointegration
relationships between the five variables for all
countries. However, the estimated Vector ErrorCorrection model leads us to reject modelling aVECM. Indeed, despite the fact that the error
correction terms are negative, their values are not
significant. Moreover, the rejection of the VECM
model is justified by the fact that modelling as
SVAR is not yet applicable to the model to Vector
Error Correction. Ultimately, different tests, make
us conclude for reject of the stationary and
cointegration of the five-level series in all countries,leading thus to adopt a specification in first
difference.
We chose the identification of Blanchard and Quah
[1989] which introduced restrictions on long-term
impact. Economic theory offers a view concerning
the persistence of shocks affecting an economic
system. In particular, the neoclassical approach
distinguished between supply shocks and demandshocks in terms of their degree of persistence: the
supply shocks drive the dynamics of long-term,
while demand shocks have an effect in the short
term. In this logic, it is necessary to impose thezero long-term effect of shock. Such restrictions are
particularly relevant in view of the business cycleanalysis.
The determination of five shocks is through the
vector of variablet
X : A supply shock
(t
PIBR domestic real GDP), a real demand shock
(t
REER shock of the real effective exchange rate),
a nominal demand shock (t
DEFPIB shock of GDP
deflator), terms of trade shock(t
TE shock of
terms of trade), and an oil price shock (t PP ,
shock of oil prices).
t
t
t
t
t
PP
TE
DEFPIB
REER
PIBR
t
t
t
t
t
L D
PP
TE
DEFPIB
REER
PIBR
)(
The identification of these structural shocks
required by Blanchard and Quah impose long term
constraints. These long-term constraints are usually
presented through the matrix denoted )1( D . For
the system of selected variables, we identify the
various shocks from the matrix )1( D as follows:

8/3/2019 Vulnerability of Southern Mediterranean Countries to Exogenous Shocks: Structural VAR Approach
http://slidepdf.com/reader/full/vulnerability-of-southern-mediterranean-countries-to-exogenous-shocks-structural 5/23
Vulnerability of Southern Mediterranean Countries.....
257
)1()1()1()1()1(
)1()1()1()1()1(
)1()1()1()1()1(
)1()1()1()1()1(
)1()1()1()1()1(
)1(
5544535251
4544434241
3534333231
2524232221
1514131211
d d d d d
d d d d d
d d d d d
d d d d d
d d d d d
D
The identification of shocks in a 5 variables VAR
system requires2
)1( nnconstraints, where n = 5
and the model requires 10 constraints.
External shocks do not affect domesticvariables. It thus follows from the
assumption of a small open economy:
14d = 15d = 24d = 25d = 34d = 35d =0.
Economic theory, especially the RBC
model, shows that only supply shocks can
affect real economic activities in the long
term. This results in two additional long-
term constraints. The demand shocks
generated by the real exchange rate and the
GDP deflator can affect the level of
economic activity 12d = 13d =0.
An oil shock is identified as the only
shock that can affect long-term price of
oil. Hence 45d =0.
The last constraint 23d =0 allows to
distinguish between demand shocks: a
shock to real demand (generally regardedas a fiscal shock or an adjustment of
exchange rates) and a nominal shock
(specifically a monetary shock) not
affecting the level of rates real exchange
long term.
Thus our matrix examining the effects of structural
shocks on the variables of the model is as follows:
)1()1()1()1()1(
0)1()1()1()1(
00)1()1()1(
000)1()1(
0000)1(
)1(
5544535251
44434241
333231
2221
11
d d d d d
d d d d
d d d
d d
d
D
Sources of Economic Fluctuations in theSouthern Mediterranean CountriesThe variance decomposition of real GDP gives theproportions of error forecast attributable to the
impact on real GDP itself and other variables
allowing assessing the relative importance of
different types of shocks in explaining the
variability of economic activities.
Source of Fluctuations of GDP Growth
Table 4 shows the contribution of each shock toeconomic growth through the variance
decomposition of error forecast. We note the
dominance of supply shocks in explaining thedynamics of the growth rate for all countries.
Indeed, short term or long term impact has
accounted for between 96% and 54% for Tunisia,
93% and 74% for Morocco, 87% and 76% for
Egypt and 90% and 55% for Jordan of the
variability of economic activities. This result is
consistent with the findings of the real business
cycle model.
As for the demand shocks (real or nominal), the
variance decomposition of error forecast of real
GDP reveals a contribution that does not exceed a
threshold of 15% in the explanation of rate
variability of economic growth even in the long
term for all countries except Jordan, where it
exceeds the threshold of 29% in the long term. Thisconfirms our theoretical assumptions stating that
demand shocks have no permanent effect on the
GDP fluctuations.
The variance decomposition of error forecast of
economic growth has a substantial effect onexternal shocks in both short term and long term.
These external shocks contribute about 33%, 11%,
7% and 13% to fluctuations in real GDP in the long
term respectively for Tunisia, Morocco, Egypt andJordan,. In the case of Tunisia, the contribution of
terms of trade is greater than 20% compared to that
of the oil shock which is 13%. The contribution of
terms of trade is more important than the oil shock
for all countries
The domestic shocks explain respectively 67%,
89%, 85% and 86% of fluctuations in economic
activity for Tunisia, Morocco, Egypt and Jordanwith a predominance of supply shocks. It is now
time to clarify the nature of the effects of shocks onthe rate of economic growth.
The nature of the effects of the five structural
shocks on real GDP is given by the functions of
reactions to shocks. These are shown in Annex (1).
The results of the reaction function of real GDP to
shocks coincide largely with those of the
decomposition of the variance. It appears from this
graph that for all countries there is a positive,
significant and very substantial impact of the
supply shock on the rate of economic growthregardless of horizon. The supply shock maintains a

8/3/2019 Vulnerability of Southern Mediterranean Countries to Exogenous Shocks: Structural VAR Approach
http://slidepdf.com/reader/full/vulnerability-of-southern-mediterranean-countries-to-exogenous-shocks-structural 6/23
Asian Economic and Financial Review, 1(4),pp.254-275
258
cumulative and very persistent effect on GDP.
Indeed, as predicted by the new economic theory
for the analysis of cyclical fluctuations, a positive
monetary supply shock leads to an improved level
of activity, and despite a slight decline in this
positive effect, improving the situation remains
fairly sustainable in the long term.
As far as monetary shocks, fiscal and exchange rate
adjustment are concerned, we note a limited effect
on the level of economic activity. It is insignificant
and is close to 0 for any horizon chosen. The
meaning is not apparent to the real demand shocks.
In addition, the cumulative effect is minimal and
not permanent. The response functions to shocks
thus confirm the results of variance decompositionand show the transient contribution of demand
shocks, both real and nominal exchange rate to
economic growth. A
Finally the response functions of real GDP to
external shocks can conclude that a negative effect
of oil prices for all countries. This degradation can
be explained by the current rise in oil prices. These
functions show that improved terms of trade
implies a positive effect on the rate of growth of
domestic economic activity. An increase in the
external shock (oil price shock and the exchange
term) of 1% leads to a cumulative increase of
domestic real GDP slight and insignificant. The
reaction of GDP to shocks to the terms of trade is
more significant in case of impact favourably.
To summarize, the decomposition of the variance
and response functions of real GDP agree on the
dominant effect and persistent supply shocks on the
level of economic activity. The impact of external
shocks is significant and increases economic
activity. Finally, the contribution of pulses of
economic policy is not significant.
Source of Fluctuations of Real Exchange Rate Table 5 shows the variance decomposition of real
exchange rate. We note for all countries a
predominance of domestic shocks in explainingfluctuations in the real exchange rate, this particular
real demand shocks studied in this model as well as
fiscal shocks by adjustment of exchange rates.They account for respectively 61%, 85%, 75% and
73% for Tunisia, Morocco, Egypt and Jordan’s
fluctuations of real exchange rate in the long term.
In theory a real demand shock, resulting from a
worsening budget deficit, cause an appreciation of
real exchange rate and a deteriorating of externalposition. Our empirical results are consistent with
this theoretical concept. Thus it is clear that the
fiscal shock affects the real value of domestic
currency through its impact on the level of non-tradable prices.
On other domestic shocks, our estimates show that
their contribution to the fluctuations of real
exchange rate is very limited. The share of
exchange rate variability due to supply shocks does
not exceed, respectively, 11%, 3%, 13% and 10%
for Tunisia, Morocco, Egypt and Jordan and that of
nominal demand shocks is respectively 3%, 2.89%,4.66% and 3.41. The insignificant contribution to
the fluctuations of real exchange rate is due to the
exogeneity of exchange rates in these countries. In
addition, there is a low correlation with theexchange rate of money supply and inflation hence
the very limited supply of the monetary stimulus to
the variability of real exchange rates. For supply
shocks, the negligible contribution is primarily due
to the limited impact of GDP on the level of prices
in these countries. Secondly, it is due to a weak correlation between changes in GDP and the
exchange rate. The evolution of the nominal
exchange rate is not affected by the irregularity of the rate of economic growth but by the politics of
exchange rates. The insignificant effect of GDP on
the exchange rate and inflation rate reflects thelimited impact of supply shocks on the real
exchange rate.
Finally, regarding the contribution of external
shocks to fluctuations in the real exchange rate, the
contribution is limited for all countries except the
Tunisian case where the contribution is about 25%
of the variability of exchange rates in long term.
These shocks explain respectively 10%, 8% and
13% for Morocco, Egypt and Jordan. It should benoted that the limited contribution of changes in the
terms of trade (18.84%, 6.39% and 4.22%
respectively 10% for Tunisia, Morocco, Egypt and
Jordan) on the real exchange rate is mainly
explained by domestic pricing policies. The
authorities intervene through fiscal and monetaryimpulses to counter any external pressure on the
price level. This is particularly true if adverse
terms of trade caused by higher prices of imported
essential commodities (oil, cereals). In addition,
changes in the terms of trade are not followed by
adjustments of exchange rates. This leads first to a
minor effect of terms of trade on the price level andthe value of the currency of these countries and then
the real exchange rate. In addition, the increase in
oil prices contributes to the appreciation of the
exchange rate in the short term and its depreciation
in the long term. The recovery of the external
position is possible through improving the terms of
trade with the acquisition of new market shares.
Indeed, whatever the horizon features’ responses toshocks (Annex 2) agree on the assessment of the
real exchange rate following a real demand shock
resulting from an overvalued domestic currency or
increasing budget deficit. In contrast, the domestic
currency devaluations combined with fiscal
8/3/2019 Vulnerability of Southern Mediterranean Countries to Exogenous Shocks: Structural VAR Approach
http://slidepdf.com/reader/full/vulnerability-of-southern-mediterranean-countries-to-exogenous-shocks-structural 7/23
Vulnerability of Southern Mediterranean Countries.....
259
restraint result in a depreciation of the real
exchange rate that is verified for all countries.
Finally, the variance decomposition and functions
of responses to shocks show that fluctuations in the
real exchange rate are mainly due to real demand
shocks and external ones.
Sources of Fluctuations of InflationTable 6 describes the decomposition of the variance
of the forecast error of inflation. It shows a very
substantial contribution of economic policy
impulses to the explanation of fluctuations in the
level of prices. The contribution of changes in
inflation is greater for nominal demand shocks; it is
of the order, respectively 30%, 40%, 45% and 39%
for Tunisia, Morocco, Egypt and Jordan. Thispredominance of nominal shocks remains short and
long term. These nominal shocks primarily reflect
changes in money and highlight the close
correlation between the level of prices andmonetary aggregates. The estimates show for
nominal demand shock, that an increase of moneysupply, results in an increase in the price level.
Moreover, in addition to the predominance of
nominal demand shocks, the variance
decomposition reveals a significant contribution of
the fiscal stimulus to the variability of inflation.
Here we find a result consistent with the teachings
of economic theory, confirming that increasing the
money supply results in inflationary pressures,
especially if it is not accompanied by improvements
in the level of economic activity. But for all thecountries studied estimates show a low uptake of
supply shock fluctuations in the price level.
Considering the importance of the openness of all
countries, it is interesting to highlight the impact of
external shocks on the price level. Through the
decomposition of the variance of the error forecast,
we find a contribution that varies between 10% and
18% for all countries with a long-term horizon. It
comes from both terms of trade and the oil shock.
We note that the oil shock is accompanied by an
increase in the price level mainly in the long term.In the short term, the relative contribution of the
shock on the price of oil is almost null, whereas in
the long run, it is around 2.5 to 5.5% for all
countries. This increase amputated the purchasingpower of households and lower consumption levels
and growth. Rising oil prices in recent years due to
the unstable geopolitical environment, the Gulf War
and the conflict between Iran and the West seems to
be sustainable and not cyclical. We should then
expect a continuous rise in oil prices. Economicpolicies should take into account this new world
order by setting more stringent energy policies.
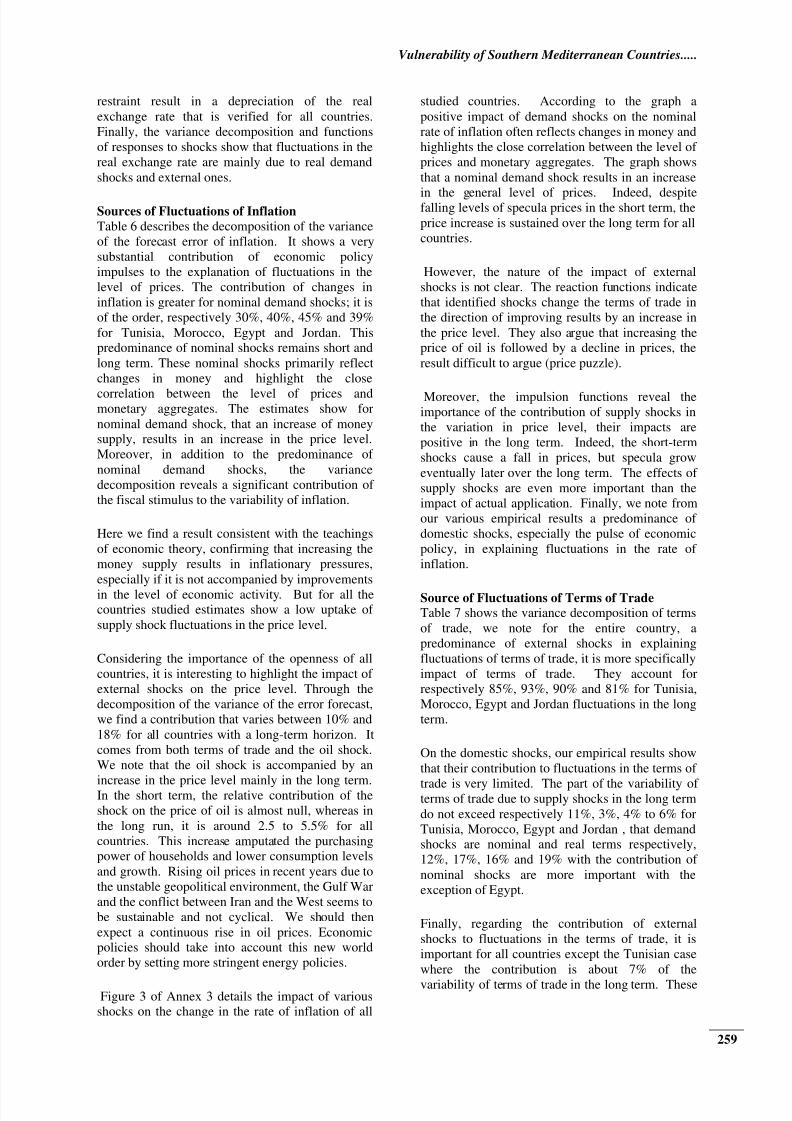
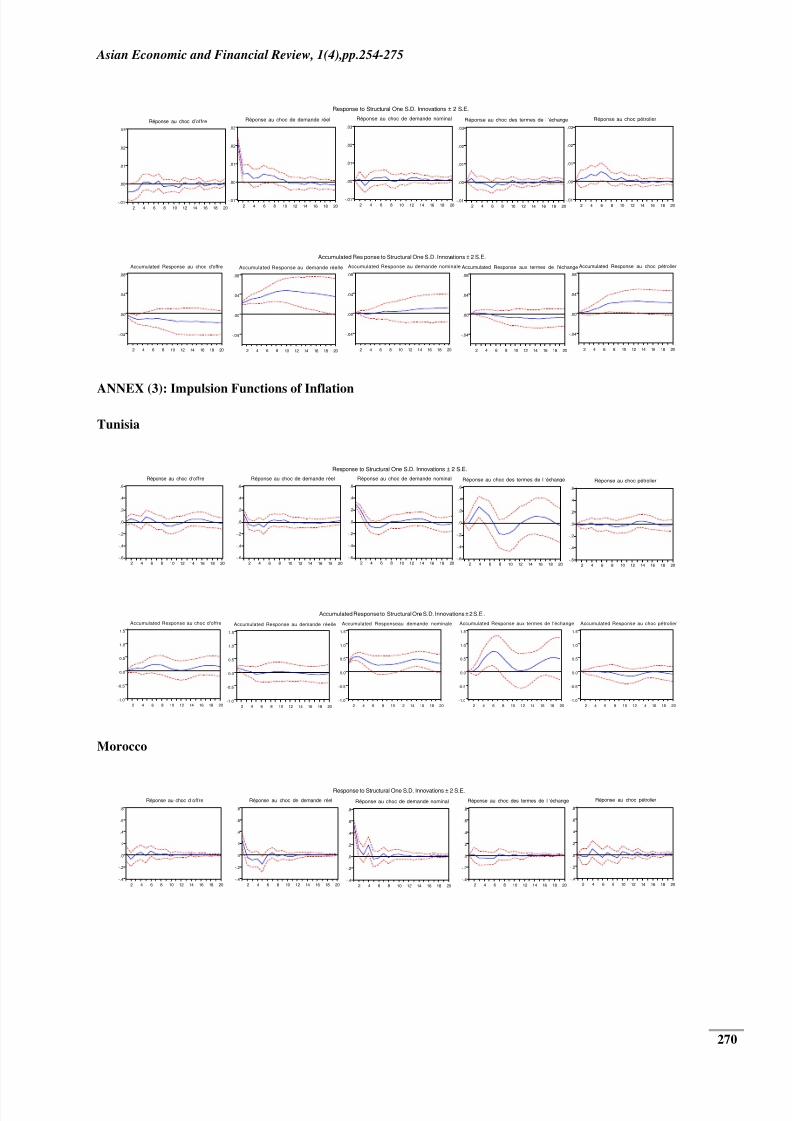
Figure 3 of Annex 3 details the impact of variousshocks on the change in the rate of inflation of all
studied countries. According to the graph a
positive impact of demand shocks on the nominal
rate of inflation often reflects changes in money and
highlights the close correlation between the level of
prices and monetary aggregates. The graph shows
that a nominal demand shock results in an increase
in the general level of prices. Indeed, despitefalling levels of specula prices in the short term, the
price increase is sustained over the long term for all
countries.
However, the nature of the impact of external
shocks is not clear. The reaction functions indicate
that identified shocks change the terms of trade in
the direction of improving results by an increase in
the price level. They also argue that increasing theprice of oil is followed by a decline in prices, the
result difficult to argue (price puzzle).
Moreover, the impulsion functions reveal theimportance of the contribution of supply shocks in
the variation in price level, their impacts are
positive in the long term. Indeed, the short-term
shocks cause a fall in prices, but specula grow
eventually later over the long term. The effects of
supply shocks are even more important than the
impact of actual application. Finally, we note from
our various empirical results a predominance of
domestic shocks, especially the pulse of economic
policy, in explaining fluctuations in the rate of
inflation.
Source of Fluctuations of Terms of TradeTable 7 shows the variance decomposition of terms
of trade, we note for the entire country, a
predominance of external shocks in explaining
fluctuations of terms of trade, it is more specifically
impact of terms of trade. They account for
respectively 85%, 93%, 90% and 81% for Tunisia,
Morocco, Egypt and Jordan fluctuations in the long
term.
On the domestic shocks, our empirical results show
that their contribution to fluctuations in the terms of
trade is very limited. The part of the variability of terms of trade due to supply shocks in the long term
do not exceed respectively 11%, 3%, 4% to 6% for
Tunisia, Morocco, Egypt and Jordan , that demandshocks are nominal and real terms respectively,
12%, 17%, 16% and 19% with the contribution of
nominal shocks are more important with the
exception of Egypt.
Finally, regarding the contribution of external
shocks to fluctuations in the terms of trade, it is
important for all countries except the Tunisian case
where the contribution is about 7% of the
variability of terms of trade in the long term. These

8/3/2019 Vulnerability of Southern Mediterranean Countries to Exogenous Shocks: Structural VAR Approach
http://slidepdf.com/reader/full/vulnerability-of-southern-mediterranean-countries-to-exogenous-shocks-structural 8/23
Asian Economic and Financial Review, 1(4),pp.254-275
260
shocks explain respectively 12%, 19% and 17% for
Morocco, Egypt and Jordan.
Figure 4 of Annex 3 details the impact of various
shocks on the change in the terms of trade for all
countries studied. According to graph a negative
impact of nominal demand shocks on the terms of trade. The figure shows that a positive shock to the
terms of trade results in a lower overall level of
prices. Indeed, the decline in prices is sustained
over the long term for all countries.
Furthermore, response functions to shocks reveal
the importance of the contribution of real demand
shocks in the variation of terms of trade, their
impacts are positive in the long term. Indeed, in the
short term these shocks lead to a fall in terms of
trade but they eventually grow over the long term.
The effects of demand shocks are even more
important than the impact of supply shocks.
Source of Fluctuations of Oil Prices Table 8 shows the variance decomposition of the oil
prices; we note for all countries, a predominance of
external shocks in explaining fluctuations in the
price of oil, they are particularly price oil shocks.They account for respectively 66%, 78%, 75% and
78% for Tunisia, Morocco, Egypt and Jordan
fluctuations in oil prices in the long term. The
terms of trade contributed respectively 19%, 3%,
5% and 10% in Tunisia, Morocco, Egypt and
Jordan fluctuations in oil prices in the long term.
The first effect of fluctuating oil prices on the
activity resulting from the transfer of purchasing
power between importing and oil exportingcountries. The magnitude of the loss of purchasing
power in importing countries depends on the oil
intensity of production and the elasticity of demand
of oil. The impact on global demand depends on the
part of additional revenues of oil exporters is spent.
In general, these recipes are not fully recycled inthe short term. Changes in the terms of trade have
been very strong in the past, but these changes
became more moderate in the current period.
On the domestic shocks, our empirical results showthat their contribution to fluctuations in oil prices is
limited. The proportion of the variability of oil
prices is mainly due to supply shocks for Tunisia
and Egypt, which does not exceed 11% in the long
term. The real demand shocks and nominal does
not exceed 9% including the impact of the real
demand is higher. As for Morocco and Jordan
variability in oil prices is mainly due to demand
shocks, which is about respectively 16% and 7%
long-term contribution of nominal shocks are more
important.
Conclusion
In theory, the fluctuations are the result of the only
real factors namely the agents' preferences,
technological opportunities, endowments factor and
possibly certain institutional constraints. For the
Tunisian case, the growth rate is closely linked toTFP, which explains the predominance of the
supply shock. In the case of Morocco, it is
especially resource endowment, mainly rainfall,
which can explain the fluctuations in the level of
activity. Indeed, one can interpret the
predominance of the supply shock in explaining
fluctuations in economic activity in Morocco by the
powerful effect of weather on the Moroccan
economy. Despite the limited contribution of agriculture to overall GDP not exceeding 20%,
GDP is strongly correlated with agricultural
production, which is itself closely linked to rainfall.
Agriculture is obeyed throughout the economy toits production cycle.
It should be noted that the impact of structural
changes that have affected the economy of all
countries studied since the early eighties is not
negligible. In the context of economic
liberalization and the establishment of a market
economy, several measures aimed at stimulating the
supply have been undertaken. The liberalization of
prices, abolition of exchange controls, liberalization
of foreign trade, financial market reforms,
privatization transactions, reorganization
operations, legal reform, the introduction of interbank foreign exchange market, the
liberalization of interest rates should result in a
possible improvement, qualitatively and
quantitatively, at the level of economic activity.
For all countries, the small contribution of fiscal
stimulus to growth reveals the failure of the
administration of these countries in the
management of public funds. Poor governance
makes the impact of public spending on economic
activity very limited. The absence of performance
monitoring, control and policy evaluation of theresults makes the output of public spending
generally minimal compared to the cost incurred.
Furthermore the structure of public expenditure is
characterized by the dominance of operatingexpenses and debt service. The effect of these
expenditures on GDP simulation is very limited.
This public investment is expected to improve the
level of activity in stimulating the private sector, a
catalyst for growth. However, its share in total
public expenditure has substantially deteriorateddue to budgetary constraints.
As for the contribution of low nominal demandshock for all countries, monetary policy is generallypassive. It aims more at regulating the money

8/3/2019 Vulnerability of Southern Mediterranean Countries to Exogenous Shocks: Structural VAR Approach
http://slidepdf.com/reader/full/vulnerability-of-southern-mediterranean-countries-to-exogenous-shocks-structural 9/23
Vulnerability of Southern Mediterranean Countries.....
261
based on the real economy than financing economic
development. Its evolution shows concern for
inflationary pressures mastery displayed by the
monetary authorities without giving too much
importance to economic growth. It is through
interest rate that monetary shocks should boost the
level of investment and mobilize savings’advantage. However, these rates do not react to
changes in money supply as they are officially set
by the monetary authorities before liberalization.
This results in a very limited impact of monetaryshock on the economy.
Like what is stated in theory, the small open
economy where all countries would submit all
countries to the effects of both favourable andunfavourable developments in the external
environment. The estimates show a significant
impact of both shocks to the terms of trade as the
oil shock on the level of economic activity. Theeffect is more apparent in terms of trade, which is
obvious since all countries studied are price takers.
Table 1: Test Results for Unit Roots in Level
Countries Variables ADF PP Order of integrati
EGYPT
LPIB -2.114788 -2.742598 I(1)
LREER -1.901994 -1.927449 I(1)
LDEFPIB -1.483578 -1.125434 I(1)
LTE -1.757955 -1.077637 I(1)
LPP -1.585566 -1.651832 I(1)
JORDAN
LPIB -0.845808 -1.232438 I(1)
LREER -1.810113* -1.383328* I(1)
LDEFPIB -1.819835 -1.707208 I(1)
LTE -2.680930 -2.645307 I(1)
LPP -1.585566 -1.651832 I(1)
MOROCCO
LPIB -2.843323 -1.965211 I(1)
LREER -2.782869 -3.053584 I(1)
LDEFPIB -2.864262 -2.780140 I(1)
LTE -2.696694 -2.687636 I(1)
LPP -1.585566 -1.651832 I(1)
TUNISIA
LPIB -3.085580 -2.725156 I(1)
LREER -2.220629 -1.714296 I(1)
LDEFPIB -1.133635 -1.467777 I(1)
LTE -1.484649 -1.669083 I(1)
LPP -1.036695* -1.378210* I(1)

8/3/2019 Vulnerability of Southern Mediterranean Countries to Exogenous Shocks: Structural VAR Approach
http://slidepdf.com/reader/full/vulnerability-of-southern-mediterranean-countries-to-exogenous-shocks-structural 10/23
Asian Economic and Financial Review, 1(4),pp.254-275
262
Critical values 1% 5% 10% 1% 5% 10%
Constance and intercept -4.04281 -3.45080 -3.15076 -4.03979 -3.44936 -3.14992
Constance -3.495677 -2.890037 -2.582041 -3.493129 -2.888932 -2.581453
Table 2: Test Results for Unit Roots in First Difference
Countries Variables ADF PP Order of
integration
EGYPT
LPIB -7.641044 -12.33403 I(0)
LREER -4.094427 -8.517193 I(0)
LDEFPIB -3.599319 -8.838513 I(0)
LTE -3.716170 -5.174122 I(0)
LPP -6.139164 -5.858801 I(0)
JORDAN
LPIB -3.698198 -7.222397 I(0)
LREER -2.911863* -7.669556* I(0)
LDEFPIB -3.470116 -8.661115 I(0)
LTE -3.715300 -3.861672 I(0)
LPP -6.139164 -5.858801 I(0)
MOROCCO
LPIB -5.102618 -6.991976 I(0)
LREER -4.573857 -9.285081 I(0)
LDEFPIB -4.474977 -8.260141 I(0)
LTE -3.624578 -3.514409 I(0)
LPP -6.139164 -5.858801 I(0)
TUNISIA
LPIB -3.650096 -6.116830 I(0)
LREER -4.188752 -8.631431 I(0)
LDEFPIB -4.080658 -6.216152 I(0)
LTE -2.868596* -3.789325* I(0)
LPP -5.785271* -6.254309* I(0)
Critical values 1% 5% 10% 1% 5% 10%
Constance and intercept -4.04360 -3.45118 -
3.150
98
-4.04053 -3.449716 -3.15012
Constance -3.49634 -2.89032 -
2.582
19
-4.04053 -3.449716 -3.15012

8/3/2019 Vulnerability of Southern Mediterranean Countries to Exogenous Shocks: Structural VAR Approach
http://slidepdf.com/reader/full/vulnerability-of-southern-mediterranean-countries-to-exogenous-shocks-structural 11/23
Vulnerability of Southern Mediterranean Countries.....
263
Table 3: Test Results for Cointegration
Countries Null Hypothesis Eigen value Trace test P values
EGYPT
r =0 0.303963 104.9767 0.0001r ≤1 0.213455 64.75549 0.0042
r ≤2 0.161752 35.19275 0.0236
r ≤3 0.101273 18.51885 0.0853
r ≤4 0.058292 6.666707 0.1452
JORDAN
r =0 0.570939 86.30804 0.0000
r ≤1 0.425472 56.52906 0.0001
r ≤2 0.217881 25.06632 0.2145
r ≤3 0.122734 13.35635 0.6460
r ≤4 0.073909 7.831853 0.6214
MORROCO
r =0 0.458857 118.5073 0.0000
r ≤1 0.360760 69.99558 0.0057r ≤2 0.181209 34.64497 0.2081
r ≤3 0.151538 18.85078 0.2075
r ≤4 0.059158 5.868694 0.4522
TUNISIA
r =0 0.422647 146.5373 0.0000
r ≤1 0.386747 103.1425 0.0001
r ≤2 0.335377 54.07904 0.1345
r ≤3 0.118864 16.96877 0.1337
r ≤4 0.084469 6.971812 0.1279
Table 4: Decomposition Variance of Economic Growth
Periods
Supply
shocks
Real demand
shocks
Nominal
demand
shocks
Term of
trade shocks
Oil prices
shocks
TUNISIA
2 96.05339 1.635896 0.268230 1.179213 0.863267
4 80.93432 10.45921 1.789008 1.725763 5.091702
8 59.70185 9.831689 1.748854 18.84932 9.868284
12 57.61696 9.231334 2.585575 18.37268 12.19345
16 55.70176 8.919733 3.168169 19.00941 13.20092
20 54.34251 8.929215 3.482098 19.82265 13.42352
MOROCCO
2 93.65054 1.473868 0.172291 4.090197 0.613107
4 84.85353 6.049670 2.216489 6.022429 0.8578818 77.14619 8.801692 3.891341 8.323381 1.837398
12 75.44602 9.359128 4.462632 8.785156 1.947069
16 74.97930 9.503000 4.546483 9.002927 1.968291
20 74.81463 9.535721 4.562313 9.120274 1.967067
EGYPT
2 87.44288 9.080607 1.163434 1.586118 0.726960
4 79.56156 12.64945 2.923288 2.945568 1.920135
8 78.28263 11.43110 4.149940 4.424383 1.711950
12 77.32945 11.20870 4.383841 5.294460 1.783550
16 76.93547 11.17584 4.533839 5.525113 1.829734
20 76.81485 11.17607 4.591202 5.575364 1.842515
2 89.97490 6.064048 1.599393 1.735371 0.626291
4 78.63280 14.70002 3.596140 1.957501 1.113537

8/3/2019 Vulnerability of Southern Mediterranean Countries to Exogenous Shocks: Structural VAR Approach
http://slidepdf.com/reader/full/vulnerability-of-southern-mediterranean-countries-to-exogenous-shocks-structural 12/23
Asian Economic and Financial Review, 1(4),pp.254-275
264
JORDAN
8 66.35493 18.21271 4.975389 6.422214 4.034754
12 60.60569 17.77947 7.850883 8.008063 5.755897
16 57.72424 20.86227 8.629620 7.445765 5.338102
20 55.51943 21.97827 8.873963 7.606315 6.022025
Table 5: Decomposition Variance of Real Exchange Rate
Periods
Supply
shocks
Real demand
shocks
Nominal
demand
shocks
Term of
trade shocks
Oil prices
shocks
TUNISIA
TUNISIA
2 1.034946 93.61851 0.124292 3.691953 1.530299
4 9.495290 71.37628 1.367905 13.45159 4.308934
8 11.20573 64.23079 2.664826 15.84503 6.053624
12 11.11081 62.84803 2.808358 17.17302 6.059776
16 11.12050 61.71478 2.913146 18.29887 5.95270220 11.12867 61.08767 3.011708 18.84575 5.926199
MOROCCO
2 2.059054 92.56354 0.639216 4.713046 0.025141
4 2.164582 90.62129 0.914926 5.610311 0.688892
8 2.156933 86.62888 2.689122 6.390203 2.134856
12 2.320683 85.63923 2.865567 6.395840 2.778677
16 2.350246 85.49473 2.890983 6.392761 2.871284
20 2.355004 85.48117 2.894774 6.393477 2.875572
EGYPT
2 12.16804 85.52559 1.085568 0.595367 0.625432
4 12.95634 80.10309 3.030120 3.240685 0.669758
8 12.50818 76.85010 4.214022 3.858702 2.569000
12 12.41926 75.21321 4.621955 4.196180 3.54939816 12.46521 74.95306 4.652395 4.244526 3.684812
20 12.47145 74.90710 4.664174 4.253638 3.703631
JORDAN
2 8.364856 90.57569 0.129413 0.258590 0.671449
4 9.372467 85.35426 1.387244 3.096199 0.789826
8 8.553108 76.22272 2.414679 9.862475 2.947022
12 9.426919 74.33224 2.814568 10.07306 3.353207
16 9.658008 73.33887 3.295043 10.18707 3.521014
20 9.710702 73.21085 3.411374 10.10226 3.564807
Table 6: Decomposition Variance of Inflation
Periods
Supply
shocks
Real demand
shocks
Nominal
demand
shocks
Term of
trade shocks
Oil prices
shocks
TUNISIA
2 1.921610 35.55149 52.37417 10.00544 0.152190
4 1.458226 31.44137 51.88601 14.93644 0.277962
8 13.56421 30.01633 40.14945 15.64200 0.628001
12 15.23253 38.27385 32.55145 12.60671 1.335455
16 15.95930 37.74756 30.65971 13.31557 2.317849
20 115.9502 37.54046 30.51010 13.46704 2.532106
2 1.570028 33.02100 55.13362 10.00890 0.265459
4 1.792949 36.35724 48.55273 11.03650 2.2605788 2.535521 39.91082 42.55244 12.13802 2.863147

8/3/2019 Vulnerability of Southern Mediterranean Countries to Exogenous Shocks: Structural VAR Approach
http://slidepdf.com/reader/full/vulnerability-of-southern-mediterranean-countries-to-exogenous-shocks-structural 13/23
Vulnerability of Southern Mediterranean Countries.....
265
MOROCCO 12 2.698085 39.80380 41.29385 12.25360 3.950660
16 2.742673 39.69462 40.86943 12.26714 4.426129
20 2.752783 39.67364 40.80851 12.27099 4.494080
EGYPT
2 10.33167 21.50915 57.75910 10.07635 0.323728
4 18.12097 20.23724 47.96239 11.15329 2.526107
8 10.00998 28.85405 46.03081 11.33729 3.76786012 9.934305 28.99084 45.55812 11.32419 4.192547
16 10.18063 28.90154 45.21140 11.35238 4.354049
20 10.23412 28.95229 45.09962 11.34602 4.367947
JORDAN
2 12.85368 19.57492 54.69040 12.15314 0.727858
4 12.40950 23.27217 50.56513 11.94497 1.808228
8 8.174141 33.16235 42.99413 12.90914 2.760232
12 5.978997 35.81439 40.15545 13.64295 4.408215
16 5.964258 35.31930 39.74011 13.76020 5.216141
20 5.779902 36.01711 39.05601 13.77089 5.376085
Table 7: Decomposition Variance of Terms of Trade
Periods
Supply
shocks
Real demand
shocks
Nominal
demand
shocks
Term of
trade shocks
Oil prices
shocks
TUNISIA
2 5.139150 1.452577 5.906307 85.51141 1.990551
4 8.302413 3.430950 4.749603 79.57685 3.940188
8 10.01642 3.845092 6.590078 72.87433 6.674089
12 10.42261 3.950068 8.111072 70.35450 7.161746
16 10.42914 3.999642 7.924905 70.90504 6.741267
20 10.31540 4.069898 8.060650 70.92365 6.630401
MOROCCO
2 1.162238 0.076102 5.221206 93.50729 0.033161
4 1.835314 0.178053 9.46761 86.76327 1.755760
8 3.183693 7.929244 9.44813 71.07242 8.366512
12 3.209606 7.866796 9.97116 67.90264 11.04980
16 3.206433 7.755637 10.24157 67.19818 11.59818
20 3.217098 7.735007 10.26944 67.09009 11.68836
EGYPT
2 6.404203 0.294387 2.486455 90.79875 0.016205
4 3.969278 0.205593 6.649101 85.40350 3.772528
8 3.274504 8.398156 3.977866 63.73385 20.61562
12 3.150282 12.19137 4.435896 60.69000 19.53245
16 3.915183 12.45686 4.698362 59.71372 19.21587
20 4.098016 12.48528 4.748274 59.50899 19.15944
JORDAN
2 8.397221 2.822960 5.686758 81.42579 1.667270
4 10.60469 4.35329 8.669121 75.27304 1.099859
8 6.58238 7.50827 12.93582 56.79893 16.17460
12 4.70881 3.98227 13.94702 50.13466 17.22723
16 3.88913 7.47428 13.06416 58.84243 16.73000
20 3.80682 7.63029 12.82457 58.42841 17.30991

8/3/2019 Vulnerability of Southern Mediterranean Countries to Exogenous Shocks: Structural VAR Approach
http://slidepdf.com/reader/full/vulnerability-of-southern-mediterranean-countries-to-exogenous-shocks-structural 14/23
Asian Economic and Financial Review, 1(4),pp.254-275
266
Table 8: Decomposition Variance of Oil Prices
Periods
Supply
shocks
Real demand
shocks
Nominal
demand
shocks
Term of
trade shocks
Oil prices
shocks
TUNISIA
2 6.491498 2.383730 2.130405 15.47094 73.52343
4 9.041442 2.594858 2.650710 15.51921 70.19378
8 11.38506 3.649790 5.230014 13.13997 66.59517
12 10.59902 4.338021 5.342557 16.70386 63.01654
16 10.48872 4.351798 5.185920 18.64300 61.33056
20 10.56185 4.313881 5.303965 18.81095 61.00935
MOROCCO
MOROCCO
2 0.775632 0.776119 2.191511 0.540351 95.71639
4 0.869851 5.141968 9.905538 2.566722 81.51592
8 0.873029 5.384011 10.42709 3.709344 79.60653
12 0.891425 5.460930 10.48251 3.845481 79.31966
16 0.893986 5.564558 10.68515 3.848896 79.00741
20 0.893495 5.584754 10.78906 3.849220 78.88347
EGYPT
2 1.124765 0.109996 5.511386 2.930051 90.32380
4 6.528345 0.772783 6.445122 4.377467 81.87628
8 6.546102 2.058635 7.975784 5.171375 78.24810
12 8.775685 2.088669 7.645024 5.290978 76.19964
16 9.413377 2.163979 7.621845 5.266148 75.53465
20 9.940909 2.202842 7.581207 5.224678 75.05036
JORDANIE
2 0.558486 0.332168 1.761533 0.737338 96.61048
4 1.369312 0.437271 1.943811 8.543726 87.70588
8 3.718570 2.206161 3.065174 10.20693 80.80316
12 3.922643 2.778345 3.959518 10.06398 79.27551
16 4.124249 2.984320 4.157696 10.05704 78.6767020 4.334129 3.017851 4.204493 10.06510 78.37843
References
Agénor, P.R, McDermott, C.J and Prasad, E.(1999). “Macroeconomic Fluctuations inDeveloping Countries: Some Stylized Facts” World
Bank Economic Review, No. 14, pp. 251- 285.
Blanchard, O and Quah, D. (1989) “The Dynamic
Effects of Aggregate Demand and Supply
Disturbances.” American Economic Review
Hartely, P.R and Whitt, J. (2003) “Macroeconomic Fluctuations: Demand or supply,
Permanent or Temporary?” European Economic
Review, 47, pp. 61-94.
Hilde, C. (2000) “The Dynamic Effect of
Aggregate Demand, Supply and Oil Price Shocks, a
Comparative Study” the Manchester School, 68, pp.578-607.
Hilde, C. (2004) “The Role of Exchange Rate as a
Shock Absorber in a small open Economy” OpenEconomies Review, 15, pp. 23-43.
Hirata, H, Kim, S and Kose, M (2007) “Sources
of Fluctuations: The Case of MENA” Emerging
Markets Finance and Trade, vol. 43, No. 1,
Hoffmaister, A and Roldos, J. (1997) “Are
Business Cycles Different in Asia and Latin
America?” International Monetary Fund Working
Paper
Hoffmaister, A and Roldos, J. (2000) “The Sourceof Macroeconomic Fluctuations in Developing
Countries: Brazil and Korea” Journal of
Macroeconomics, 23, pp. 213- 239
Hoffman, M. (2001) “Long Run Recursive VAR
Models and QR Decompositions” Economics
Letters, 73, pp. 15-20
Kose, A and Riezman, R. (2001) “Trade Shocksand Macroeconomic Fluctuations in Africa” Journal
of Development Economics, No. 65, pp. 55-80.
Moreno, R. (1990) “External Shocks and
Adjustment in Four Asian Economies 1978- 1987”Federal Reserve Bank of San Francisco Economic
Review, N° 1, pp. 27- 41.

8/3/2019 Vulnerability of Southern Mediterranean Countries to Exogenous Shocks: Structural VAR Approach
http://slidepdf.com/reader/full/vulnerability-of-southern-mediterranean-countries-to-exogenous-shocks-structural 15/23
Vulnerability of Southern Mediterranean Countries.....
267
Soofi, A and Moussavi, S. (2004) “Transmissions
of Real Economic Shocks Across the Pacific Rim
Economies” Journal of Policy Modelling, No. 26,
pp. 959-972.
ANNEX (1): Impulsions Functions of GDP Growth
Tunisia
-.008
-.004
.000
.004
.008
.012
2 4 6 8 10 12 14 16 18 20
Réponse au choc d’offre
-.008
-.004
.000
.004
.008
.012
2 4 6 8 10 12 14 16 18 20
Réponse au choc de demande réel
-.008
-.004
.000
.004
.008
.012
2 4 6 8 10 12 14 16 18 20
Réponse au choc de demande nominal
-.008
-.004
.000
.004
.008
.012
2 4 6 8 10 12 14 16 18 20
Réponse au choc des termes de l ’échange
-.008
-.004
.000
.004
.008
.012
2 4 6 8 10 12 14 16 18 20
Réponse au choc pétrolier
Response to Structural One S.D. Innovations ± 2 S.E.
-.03
-.02
-.01
.00
.01
.02
.03
.04
2 4 6 8 10 12 14 16 18 20
Accumulated Response au choc d'offre
-.03
-.02
-.01
.00
.01
.02
.03
.04
2 4 6 8 10 12 14 16 18 20
Accumulated Response au Demande Réelle
-.03
-.02
-.01
.00
.01
.02
.03
.04
2 4 6 8 10 12 14 16 18 20
Accumulated Respons e au demande nominale
-.03
-.02
-.01
.00
.01
.02
.03
.04
2 4 6 8 10 12 14 16 18 20
Accumulated Response aux termes de l'échange
-.03
-.02
-.01
.00
.01
.02
.03
.04
2 4 6 8 10 12 14 16 18 20
Accumulated Response au choc pétrolier
Accumulated Response to Structural One S.D. Innovations ± 2 S.E.
Morocco
-.02
-.01
.00
.01
.02
.03
2 4 6 8 10 12 14 16 18 20
Réponse au choc d’offre
-.02
-.01
.00
.01
.02
.03
2 4 6 8 10 12 14 16 18 20
Réponse au choc de demande réel
-.02
-.01
.00
.01
.02
.03
2 4 6 8 10 12 14 16 18 20
Réponse au choc de demande nominal
-.02
-.01
.00
.01
.02
.03
2 4 6 8 10 12 14 16 18 20
Réponse au choc des termes de l’échange
-.02
-.01
.00
.01
.02
.03
2 4 6 8 10 12 14 16 18 20
Réponse au choc pétrolier
Response to Structural One S.D. Innovations ± 2 S.E.
-.03
-.02
-.01
.00
.01
.02
.03
.04
2 4 6 8 10 12 14 16 18 20
Accumulated Response au choc d’offre
-.03
-.02
-.01
.00
.01
.02
.03
.04
2 4 6 8 10 12 14 16 18 20
Accumulated Response au demande réel
-.03
-.02
-.01
.00
.01
.02
.03
.04
2 4 6 8 10 12 14 16 18 20
Accumulated Response au demande nominal
-.03
-.02
-.01
.00
.01
.02
.03
.04
2 4 6 8 10 12 14 16 18 20
Accumulated Response au termes de l’échange
-.03
-.02
-.01
.00
.01
.02
.03
.04
2 4 6 8 10 12 14 16 18 20
Accumulated Response au choc pétrolier
Accumulated Response to Structural One S.D. Innovations ± 2 S.E.
Egypt

8/3/2019 Vulnerability of Southern Mediterranean Countries to Exogenous Shocks: Structural VAR Approach
http://slidepdf.com/reader/full/vulnerability-of-southern-mediterranean-countries-to-exogenous-shocks-structural 16/23
Asian Economic and Financial Review, 1(4),pp.254-275
268
-.02
-.01
.00
.01
.02
.03
2 4 6 8 10 12 14 16 18 20
Réponse au choc d’offre
-.02
-.01
.00
.01
.02
.03
2 4 6 8 10 12 14 16 18 20
Réponse au choc de demande réel
-.02
-.01
.00
.01
.02
.03
2 4 6 8 10 12 14 16 18 20
Réponse au choc de demande nominal
-.02
-.01
.00
.01
.02
.03
2 4 6 8 10 12 14 16 18 20
Réponse au choc des termes de l’échange
-.02
-.01
.00
.01
.02
.03
2 4 6 8 10 12 14 16 18 20
Réponse au choc pétrolier
Response to Structural One S.D. Innovations ± 2 S.E.
-.01
.00
.01
.02
.03
2 4 6 8 10 12 14 16 18 20
Accumulated Response au choc d'offre
-.01
.00
.01
.02
.03
2 4 6 8 10 12 14 16 18 20
Accumulated Response au Demande Réelle
-.01
.00
.01
.02
.03
2 4 6 8 10 12 14 16 18 20
Accumulated Response aux termes de l'échange
-.01
.00
.01
.02
.03
2 4 6 8 10 12 14 16 18 20
Accumulated Response au demande nominale
-.01
.00
.01
.02
.03
2 4 6 8 10 12 14 16 18 20
Accumulated Responseau choc pétrolier
Acc umulated Respons e to Structural One S.D. Innovations ± 2 S.E.
Jordan
-.010
-.005
.000
.005
.010
.015
.020
2 4 6 8 10 12 14 16 18 20
Réponse au choc d’offre
-.010
-.005
.000
.005
.010
.015
.020
2 4 6 8 10 12 14 16 18 20
Réponse au choc de demande réel
-.010
-.005
.000
.005
.010
.015
.020
2 4 6 8 10 12 14 16 18 20
Réponse au choc de demande nominal
-.010
-.005
.000
.005
.010
.015
.020
2 4 6 8 10 12 14 16 18 20
Réponse au choc des termes de l ’échange
-.010
-.005
.000
.005
.010
.015
.020
2 4 6 8 10 12 14 16 18 20
Réponse au choc pétrolier
Response to S tructural One S.D. Innovations ± 2 S .E.
-.04
-.02
.00
.02
.04
.06
2 4 6 8 10 12 14 16 18 20
Accumulated Response au choc d'offre
-.04
-.02
.00
.02
.04
.06
2 4 6 8 10 12 14 16 18 20
Accumulated Response au demande réelle
-.04
-.02
.00
.02
.04
.06
2 4 6 8 10 12 14 16 18 20
Accumulated Response au demande nominale
-.04
-.02
.00
.02
.04
.06
2 4 6 8 10 12 14 16 18 20
Accumulated Response aux termes de l'échange
-.04
-.02
.00
.02
.04
.06
2 4 6 8 10 12 14 16 18 20
Accumulated Response au choc pétrolier
Accumul ated Response to Structural One S.D. Innovations ± 2 S.E.
ANNEX (2): Impulsion Functions of Real Exchange Rate
Tunisia
-.01
.00
.01
.02
2 4 6 8 10 12 14 16 18 20
Réponse au choc d’offre
-.01
.00
.01
.02
2 4 6 8 10 12 14 16 18 20
Réponse au choc de demande réel
-.01
.00
.01
.02
2 4 6 8 10 12 14 16 18 20
Réponse au choc de demande nominal
-.01
.00
.01
.02
2 4 6 8 10 12 14 16 18 20
Réponse au choc des termes de l’échange
-.01
.00
.01
.02
2 4 6 8 10 12 14 16 18 20
Réponse au choc pétrolier
Response to Structural One S.D. Innovations ± 2 S.E.

8/3/2019 Vulnerability of Southern Mediterranean Countries to Exogenous Shocks: Structural VAR Approach
http://slidepdf.com/reader/full/vulnerability-of-southern-mediterranean-countries-to-exogenous-shocks-structural 17/23
Vulnerability of Southern Mediterranean Countries.....
269
-.04
-.02
.00
.02
.04
.06
2 4 6 8 10 12 14 16 18 20
Accumulated Responseau choc d'offre
-.04
-.02
.00
.02
.04
.06
2 4 6 8 10 12 14 16 18 20
Accumulated Response au demande réelle
-.04
-.02
.00
.02
.04
.06
2 4 6 8 10 12 14 16 18 20
Accumulated Response au demande nominale
-.04
-.02
.00
.02
.04
.06
2 4 6 8 10 12 14 16 18 20
Accumulated Response aux termes de l'échange
-.04
-.02
.00
.02
.04
.06
2 4 6 8 10 12 14 16 18 20
Accumulated Response au choc pétrolier
Accumulated Respons e to Structural One S.D. Innovations ± 2 S.E .
Morocco
-.010
-.005
.000
.005
.010
.015
.020
2 4 6 8 10 12 14 16 18 20
Réponse au choc d’offre
-.010
-.005
.000
.005
.010
.015
.020
2 4 6 8 10 12 14 16 18 20
Réponse au choc de demande réel
-.010
-.005
.000
.005
.010
.015
.020
2 4 6 8 10 12 14 16 18 20
Réponse au choc de demande nominal
-.010
-.005
.000
.005
.010
.015
.020
2 4 6 8 10 12 14 16 18 20
Réponse au choc des termes de l’échange
-.010
-.005
.000
.005
.010
.015
.020
2 4 6 8 10 12 14 16 18 20
Réponse au choc pétrolier
Response to Structural One S.D. Innovations ± 2 S.E.
-.02
-.01
.00
.01
.02
.03
.04
2 4 6 8 10 12 14 16 18 20
Accumulated Response au choc d'offre
-.02
-.01
.00
.01
.02
.03
.04
2 4 6 8 10 12 14 16 18 20
Accumulated Response au demande réelle
-.02
-.01
.00
.01
.02
.03
.04
2 4 6 8 10 12 14 16 18 20
Accumulated Response au demande nominale
-.02
-.01
.00
.01
.02
.03
.04
2 4 6 8 10 12 14 16 18 20
Accumulated Response aux termes de l'échange
-.02
-.01
.00
.01
.02
.03
.04
2 4 6 8 10 12 14 16 18 20
Accumulated Response au choc pétrolier
Accumulated Res ponse to Structural One S.D. Innovations ± 2 S.E.
Egypt
-.04
-.02
.00
.02
.04
.06
.08
2 4 6 8 10 12 14 16 18 20
Réponse au choc d’offre
-.04
-.02
.00
.02
.04
.06
.08
2 4 6 8 10 12 14 16 18 20
Réponse au choc de demande réel
-.04
-.02
.00
.02
.04
.06
.08
2 4 6 8 10 12 14 16 18 20
Réponse au choc de demande nominal
-.04
-.02
.00
.02
.04
.06
.08
2 4 6 8 10 12 14 16 18 20
Réponse au choc des termes de l ’échange
-.04
-.02
.00
.02
.04
.06
.08
2 4 6 8 10 12 14 16 18 20
Réponse au choc pétrolier
Response to Structural One S.D. Innovations ± 2 S.E.
-.10
-.05
.00
.05
.10
.15
2 4 6 8 10 12 14 16 18 20
Accumulated Response au choc d'offre
-.10
-.05
.00
.05
.10
.15
2 4 6 8 10 12 14 16 18 20
Accumulated Response au demande réelle
-.10
-.05
.00
.05
.10
.15
2 4 6 8 10 12 14 16 18 20
Accumulated Response au demande nominale
-.10
-.05
.00
.05
.10
.15
2 4 6 8 10 12 14 16 18 20
Accumulated Response aux termes de l'échange
-.10
-.05
.00
.05
.10
.15
2 4 6 8 10 12 14 16 18 20
Accumulated Response au choc pétrolier
Accumulated Response to Structural One S.D. Innovations ± 2 S.E.
Jordan
8/3/2019 Vulnerability of Southern Mediterranean Countries to Exogenous Shocks: Structural VAR Approach
http://slidepdf.com/reader/full/vulnerability-of-southern-mediterranean-countries-to-exogenous-shocks-structural 18/23
Asian Economic and Financial Review, 1(4),pp.254-275
270
-.01
.00
.01
.02
.03
2 4 6 8 10 12 14 16 18 20
Réponse au choc d’offre
-.01
.00
.01
.02
.03
2 4 6 8 10 12 14 16 18 20
Réponse au choc de demande réel
-.01
.00
.01
.02
.03
2 4 6 8 10 12 14 16 18 20
Réponse au choc de demande nominal
-.01
.00
.01
.02
.03
2 4 6 8 10 12 14 16 18 20
Réponse au choc des termes de l ’échange
-.01
.00
.01
.02
.03
2 4 6 8 10 12 14 16 18 20
Réponse au choc pétrolier
Response to Structural One S.D. Innovations ± 2 S.E.
-.04
.00
.04
.08
2 4 6 8 10 12 14 16 18 20
Accumulated Response au choc d'offre
-.04
.00
.04
.08
2 4 6 8 10 12 14 16 18 20
Accumulated Response au demande réelle
-.04
.00
.04
.08
2 4 6 8 10 12 14 16 18 20
Accumulated Response au demande nominale
-.04
.00
.04
.08
2 4 6 8 10 12 14 16 18 20
Accumulated Response aux termes de l'échange
-.04
.00
.04
.08
2 4 6 8 10 12 14 16 18 20
Accumulated Response au choc pétrolier
Accumulated Res ponse to Structural One S.D. Innovations ± 2 S.E.
ANNEX (3): Impulsion Functions of Inflation
Tunisia
-.6
-.4
-.2
.0
.2
.4
.6
2 4 6 8 10 12 14 16 18 20
Réponse au choc d’offre
-.6
-.4
-.2
.0
.2
.4
.6
2 4 6 8 10 12 14 16 18 20
Réponse au choc de demande réel
-.6
-.4
-.2
.0
.2
.4
.6
2 4 6 8 10 12 14 16 18 20
Réponse au choc de demande nominal
-.6
-.4
-.2
.0
.2
.4
.6
2 4 6 8 10 12 14 16 18 20
Réponse au choc des termes de l ’échange
-.6
-.4
-.2
.0
.2
.4
.6
2 4 6 8 10 12 14 16 18 20
Réponse au choc pétrolier
Response to Structural One S.D. Innovations ± 2 S.E.
-1.0
-0.5
0.0
0.5
1.0
1.5
2 4 6 8 10 12 14 16 18 20
Accumulated Response au choc d'offre
-1.0
-0.5
0.0
0.5
1.0
1.5
2 4 6 8 10 12 14 16 18 20
Accumulated Response au demande réelle
-1.0
-0.5
0.0
0.5
1.0
1.5
2 4 6 8 10 12 14 16 18 20
Accumulated Responseau demande nominale
-1.0
-0.5
0.0
0.5
1.0
1.5
2 4 6 8 10 12 14 16 18 20
Accumulated Response aux termes de l'échange
-1.0
-0.5
0.0
0.5
1.0
1.5
2 4 6 8 10 12 14 16 18 20
Accumulated Response au choc pétrolier
Accumulated Response to Structural One S.D. Innovations ± 2 S.E .
Morocco
-.4
-.2
.0
.2
.4
.6
.8
2 4 6 8 10 12 14 16 18 20
Réponse au choc d’offre
-.4
-.2
.0
.2
.4
.6
.8
2 4 6 8 10 12 14 16 18 20
Réponse au choc de demande réel
-.4
-.2
.0
.2
.4
.6
.8
2 4 6 8 10 12 14 16 18 20
Réponse au choc de demande nominal
-.4
-.2
.0
.2
.4
.6
.8
2 4 6 8 10 12 14 16 18 20
Réponse au choc des termes de l ’échange
-.4
-.2
.0
.2
.4
.6
.8
2 4 6 8 10 12 14 16 18 20
Réponse au choc pétrolier
Response to Structural One S.D. Innovations ± 2 S.E.

8/3/2019 Vulnerability of Southern Mediterranean Countries to Exogenous Shocks: Structural VAR Approach
http://slidepdf.com/reader/full/vulnerability-of-southern-mediterranean-countries-to-exogenous-shocks-structural 19/23
Vulnerability of Southern Mediterranean Countries.....
271
-1.0
-0.5
0.0
0.5
1.0
1.5
2 4 6 8 10 12 14 16 18 20
Accumulated Response au choc d'offre
-1.0
-0.5
0.0
0.5
1.0
1.5
2 4 6 8 10 12 14 16 18 20
Accumulated Response au demande réelle
-1.0
-0.5
0.0
0.5
1.0
1.5
2 4 6 8 10 12 14 16 18 20
Accumulated Response au demande nominale
-1.0
-0.5
0.0
0.5
1.0
1.5
2 4 6 8 10 12 14 16 18 20
Accumulated Response aux termes de l'échange
-1.0
-0.5
0.0
0.5
1.0
1.5
2 4 6 8 10 12 14 16 18 20
Accumulated Response au choc pétrolier
Accumulated Response to Structural One S.D. Innovations ± 2 S.E.
Egypt
-.020
-.016
-.012
-.008
-.004
.000
.004
.008
.012
2 4 6 8 10 12 14 16 18 20
Réponse au choc d’offre
-.020
-.016
-.012
-.008
-.004
.000
.004
.008
.012
2 4 6 8 10 12 14 16 18 20
Réponse au choc de demande réel
-.020
-.016
-.012
-.008
-.004
.000
.004
.008
.012
2 4 6 8 10 12 14 16 18 20
Réponse au choc de demande nominal
-.020
-.016
-.012
-.008
-.004
.000
.004
.008
.012
2 4 6 8 10 12 14 16 18 20
Réponse au choc des termes de l’échange
-.020
-.016
-.012
-.008
-.004
.000
.004
.008
.012
2 4 6 8 10 12 14 16 18 20
Réponse au choc pétrolier
Response to Structural One S.D. Innovations ± 2 S.E.
-.08
-.04
.00
.04
.08
2 4 6 8 10 12 14 16 18 20
Accumulated Response au choc d'offre
-.08
-.04
.00
.04
.08
2 4 6 8 10 12 14 16 18 20
Accumulated Responseau demande réelle
-.08
-.04
.00
.04
.08
2 4 6 8 10 12 14 16 18 20
Accumulated Response au demande nominale
-.08
-.04
.00
.04
.08
2 4 6 8 10 12 14 16 18 20
Accumulated Response aux termes de l'échange
-.08
-.04
.00
.04
.08
2 4 6 8 10 12 14 16 18 20
Accumulated Response au choc pétrolier
Accumulated Response to Structural One S.D. Innovations ± 2 S.E.
Jordan
-.06
-.04
-.02
.00
.02
.04
2 4 6 8 10 12 14 16 18 20
Accumulated Response au choc d'offre
-.06
-.04
-.02
.00
.02
.04
2 4 6 8 10 12 14 16 18 20
Accumulated Response au demande réelle
-.06
-.04
-.02
.00
.02
.04
2 4 6 8 10 12 14 16 18 20
Accumulat ed Response au demande nominale
-.06
-.04
-.02
.00
.02
.04
2 4 6 8 10 12 14 16 18 20
Accumulated Response aux termes de l'échange
-.06
-.04
-.02
.00
.02
.04
2 4 6 8 10 12 14 16 18 20
Accumulated Response au choc pétrolier
Accumulated Response to Structural One S.D. Innovations ± 2 S .E.
-.015
-.010
-.005
.000
.005
.010
2 4 6 8 10 12 14 16 18 20
Réponse au choc d’offre
-.015
-.010
-.005
.000
.005
.010
2 4 6 8 10 12 14 16 18 20
Réponse au choc de demande réel
-.015
-.010
-.005
.000
.005
.010
2 4 6 8 10 12 14 16 18 20
Réponse au choc de demande nominal
-.015
-.010
-.005
.000
.005
.010
2 4 6 8 10 12 14 16 18 20
Réponse au choc des termes de l’échange
-.015
-.010
-.005
.000
.005
.010
2 4 6 8 10 12 14 16 18 20
Réponse au choc pétrolier
Response to Structural One S.D. Innovations ± 2 S.E.
ANNEX (4): Impulsions Function of Terms of Trade
Tunisia

8/3/2019 Vulnerability of Southern Mediterranean Countries to Exogenous Shocks: Structural VAR Approach
http://slidepdf.com/reader/full/vulnerability-of-southern-mediterranean-countries-to-exogenous-shocks-structural 20/23
Asian Economic and Financial Review, 1(4),pp.254-275
272
-.015
-.010
-.005
.000
.005
.010
.015
2 4 6 8 10 12 14 16 18 20
Réponse au choc d’offre
-.015
-.010
-.005
.000
.005
.010
.015
2 4 6 8 10 12 14 16 18 20
Réponse au choc de demande réel
-.015
-.010
-.005
.000
.005
.010
.015
2 4 6 8 10 12 14 16 18 20
Réponse au choc de demande nominal
-.015
-.010
-.005
.000
.005
.010
.015
2 4 6 8 10 12 14 16 18 20
Réponse au choc des termes de l’échange
-.015
-.010
-.005
.000
.005
.010
.015
2 4 6 8 10 12 14 16 18 20
Réponse au c hoc pétrolier
Response to Structural One S.D. Innovations ± 2 S.E.
-.04
-.02
.00
.02
.04
.06
2 4 6 8 10 12 14 16 18 20
Accumulated Response au choc d'offre
-.04
-.02
.00
.02
.04
.06
2 4 6 8 10 12 14 16 18 20
Accumulated Response au demande réelle
-.04
-.02
.00
.02
.04
.06
2 4 6 8 10 12 14 16 18 20
Accumulated Response au demande nominale
-.04
-.02
.00
.02
.04
.06
2 4 6 8 10 12 14 16 18 20
Accumulated Response aux termes de l'échange
-.04
-.02
.00
.02
.04
.06
2 4 6 8 10 12 14 16 18 20
Accumulated Response au choc pétrolier
Accumulated Response to Structural One S.D. Innovations ± 2 S.E.
Morocco
-.008
-.004
.000
.004
.008
.012
2 4 6 8 10 12 14 16 18 20
Réponse au choc d’offre
-.008
-.004
.000
.004
.008
.012
2 4 6 8 10 12 14 16 18 20
Réponse au choc de demande réel
-.008
-.004
.000
.004
.008
.012
2 4 6 8 10 12 14 16 18 20
Réponse au choc de demande nominal
-.008
-.004
.000
.004
.008
.012
2 4 6 8 10 12 14 16 18 20
Réponse au choc des termes de l’échange
-.008
-.004
.000
.004
.008
.012
2 4 6 8 10 12 14 16 18 20
Réponse au choc pétrolier
Response to Structural One S.D. Innovations ± 2 S.E.
-.03
-.02
-.01
.00
.01
.02
.03
.04
2 4 6 8 10 12 14 16 18 20
Accumulated Response au choc d'offre
-.03
-.02
-.01
.00
.01
.02
.03
.04
2 4 6 8 10 12 14 16 18 20
Accumulated Response au demande réelle
-.03
-.02
-.01
.00
.01
.02
.03
.04
2 4 6 8 10 12 14 16 18 20
Accumulated Response au demande nominale
-.03
-.02
-.01
.00
.01
.02
.03
.04
2 4 6 8 10 12 14 16 18 20
Accumulated Response aux termes de l'échange
-.03
-.02
-.01
.00
.01
.02
.03
.04
2 4 6 8 10 12 14 16 18 20
Accumulated Response au choc pétrolier
Accumulated Response to Structural One S.D. Innovations ± 2 S.E.
Egypt
-.010
-.005
.000
.005
.010
.015
2 4 6 8 10 12 14 16 18 20
Réponse au choc d’offre
-.010
-.005
.000
.005
.010
.015
2 4 6 8 10 12 14 16 18 20
Réponse au choc de demande réel
-.010
-.005
.000
.005
.010
.015
2 4 6 8 10 12 14 16 18 20
Réponse au choc de demande nominal
-.010
-.005
.000
.005
.010
.015
2 4 6 8 10 12 14 16 18 20
Réponse au choc des termes de l’échange
-.010
-.005
.000
.005
.010
.015
2 4 6 8 10 12 14 16 18 20
Réponse au choc pétrolier
Response to Structural One S.D. Innovations ± 2 S.E.
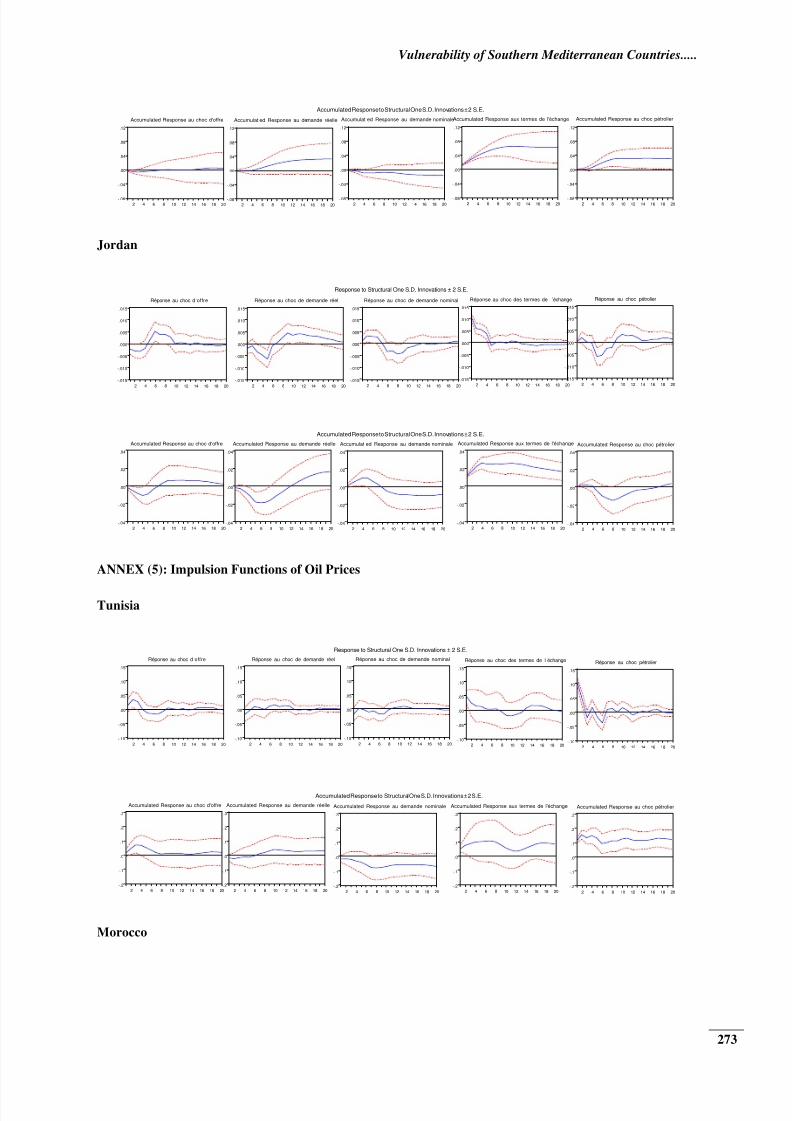
8/3/2019 Vulnerability of Southern Mediterranean Countries to Exogenous Shocks: Structural VAR Approach
http://slidepdf.com/reader/full/vulnerability-of-southern-mediterranean-countries-to-exogenous-shocks-structural 21/23
Vulnerability of Southern Mediterranean Countries.....
273
-.08
-.04
.00
.04
.08
.12
2 4 6 8 10 12 14 16 18 20
Accumulated Response au choc d'offre
-.08
-.04
.00
.04
.08
.12
2 4 6 8 10 12 14 16 18 20
Accumulat ed Response au demande réelle
-.08
-.04
.00
.04
.08
.12
2 4 6 8 10 12 14 16 18 20
Accumulat ed Response au demande nominale
-.08
-.04
.00
.04
.08
.12
2 4 6 8 10 12 14 16 18 20
Accumulated Response aux termes de l'échange
-.08
-.04
.00
.04
.08
.12
2 4 6 8 10 12 14 16 18 20
Accumulated Response au choc pétrolier
Accumulated Response to Structural One S.D. Innovations ± 2 S.E.
Jordan
-.015
-.010
-.005
.000
.005
.010
.015
2 4 6 8 10 12 14 16 18 20
Réponse au choc d’offre
-.015
-.010
-.005
.000
.005
.010
.015
2 4 6 8 10 12 14 16 18 20
Réponse au choc de demande réel
-.015
-.010
-.005
.000
.005
.010
.015
2 4 6 8 10 12 14 16 18 20
Réponse au choc de demande nominal
-.015
-.010
-.005
.000
.005
.010
.015
2 4 6 8 10 12 14 16 18 20
Réponse au choc des termes de l ’échange
-.015
-.010
-.005
.000
.005
.010
.015
2 4 6 8 10 12 14 16 18 20
Réponse au choc pétrolier
Response to Structural One S.D. Innovations ± 2 S.E.
-.04
-.02
.00
.02
.04
2 4 6 8 10 12 14 16 18 20
Accumulated Response au choc d'offre
-.04
-.02
.00
.02
.04
2 4 6 8 10 12 14 16 18 20
Accumulated Response au demande réelle
-.04
-.02
.00
.02
.04
2 4 6 8 10 12 14 16 18 20
Accumulat ed Response au demande nominale
-.04
-.02
.00
.02
.04
2 4 6 8 10 12 14 16 18 20
Accumulated Response aux termes de l'échange
-.04
-.02
.00
.02
.04
2 4 6 8 10 12 14 16 18 20
Accumulated Response au choc pétrolier
Accumulated Response to Structural One S.D. Innovations ± 2 S.E.
ANNEX (5): Impulsion Functions of Oil Prices
Tunisia
-.10
-.05
.00
.05
.10
.15
2 4 6 8 10 12 14 16 18 20
Réponse au choc d’offre
-.10
-.05
.00
.05
.10
.15
2 4 6 8 10 12 14 16 18 20
Réponse au choc de demande réel
-.10
-.05
.00
.05
.10
.15
2 4 6 8 10 12 14 16 18 20
Réponse au choc de demande nominal
-.10
-.05
.00
.05
.10
.15
2 4 6 8 10 12 14 16 18 20
Réponse au choc des termes de l’échange
-.10
-.05
.00
.05
.10
.15
2 4 6 8 10 12 14 16 18 20
Réponse au choc pétrolier
Response to Structural One S.D. Innovations ± 2 S.E.
-.2
-.1
.0
.1
.2
.3
2 4 6 8 10 12 14 16 18 20
Accumulated Response au choc d'offre
-.2
-.1
.0
.1
.2
.3
2 4 6 8 10 12 14 16 18 20
Accumulated Response au demande réelle
-.2
-.1
.0
.1
.2
.3
2 4 6 8 10 12 14 16 18 20
Accumulated Response au demande nominale
-.2
-.1
.0
.1
.2
.3
2 4 6 8 10 12 14 16 18 20
Accumulated Response aux termes de l'échange
-.2
-.1
.0
.1
.2
.3
2 4 6 8 10 12 14 16 18 20
Accumulated Response au choc pétrolier
Accumulated Response to Structural One S.D. Innovations ± 2 S.E.
Morocco

8/3/2019 Vulnerability of Southern Mediterranean Countries to Exogenous Shocks: Structural VAR Approach
http://slidepdf.com/reader/full/vulnerability-of-southern-mediterranean-countries-to-exogenous-shocks-structural 22/23
Asian Economic and Financial Review, 1(4),pp.254-275
274
-.10
-.05
.00
.05
.10
.15
2 4 6 8 10 12 14 16 18 20
Réponse au choc d’offre
-.10
-.05
.00
.05
.10
.15
2 4 6 8 10 12 14 16 18 20
Réponse au choc de demande réel
-.10
-.05
.00
.05
.10
.15
2 4 6 8 10 12 14 16 18 20
Réponse au choc de demande nominal
-.10
-.05
.00
.05
.10
.15
2 4 6 8 10 12 14 16 18 20
Réponse au choc des termes de l ’échange
-.10
-.05
.00
.05
.10
.15
2 4 6 8 10 12 14 16 18 20
Réponse au choc pétrolier
Response to Structural One S.D. Innovations ± 2 S.E.
-.2
-.1
.0
.1
.2
.3
2 4 6 8 10 12 14 16 18 20
Accumulated Response au choc d'offre
-.2
-.1
.0
.1
.2
.3
2 4 6 8 10 12 14 16 18 20
Accumulated Response au demande réelle
-.2
-.1
.0
.1
.2
.3
2 4 6 8 10 12 14 16 18 20
Accumulated Response au demande nominale
-.2
-.1
.0
.1
.2
.3
2 4 6 8 10 12 14 16 18 20
Accumulated Response aux termes de l'échange
-.2
-.1
.0
.1
.2
.3
2 4 6 8 10 12 14 16 18 20
Accumulated Response au choc pétrolier
Acc umulated Respons e to Structural One S.D. Innovations ± 2 S.E.
Egypt
-.10
-.05
.00
.05
.10
.15
2 4 6 8 10 12 14 16 18 20
Réponse au choc d’offre
-.10
-.05
.00
.05
.10
.15
2 4 6 8 10 12 14 16 18 20
Réponse au choc de demande réel
-.10
-.05
.00
.05
.10
.15
2 4 6 8 10 12 14 16 18 20
Réponse au choc de demande nominal
-.10
-.05
.00
.05
.10
.15
2 4 6 8 10 12 14 16 18 20
Réponse au choc des termes de l ’échange
-.10
-.05
.00
.05
.10
.15
2 4 6 8 10 12 14 16 18 20
Réponse au choc pétrolier
Response to Structural One S.D. Innovations ± 2 S.E.
-.1
.0
.1
.2
2 4 6 8 10 12 14 16 18 20
Accumulated Response au choc d'offre
-.1
.0
.1
.2
2 4 6 8 10 12 14 16 18 20
Accumulated Response au demande rélle
-.1
.0
.1
.2
2 4 6 8 10 12 14 16 18 20
Accumulated Response au demande nominale
-.1
.0
.1
.2
2 4 6 8 10 12 14 16 18 20
Accumulated Response aux termes de l'échange
-.1
.0
.1
.2
2 4 6 8 10 12 14 16 18 20
Accumulated Response au choc pétrolier
Accumulated Response to Structural One S.D. Innovations ± 2 S.E.
Jordan
-.10
-.05
.00
.05
.10
.15
2 4 6 8 10 12 14 16 18 20
Réponse au choc d’offre
-.10
-.05
.00
.05
.10
.15
2 4 6 8 10 12 14 16 18 20
Réponse au choc de demande réel
-.10
-.05
.00
.05
.10
.15
2 4 6 8 10 12 14 16 18 20
Réponse au choc de demande nominal
-.10
-.05
.00
.05
.10
.15
2 4 6 8 10 12 14 16 18 20
Réponse au choc des termes de l ’échange
-.10
-.05
.00
.05
.10
.15
2 4 6 8 10 12 14 16 18 20
Réponse au choc pétrolier
Response to Structural One S.D. Innovations ± 2 S.E.
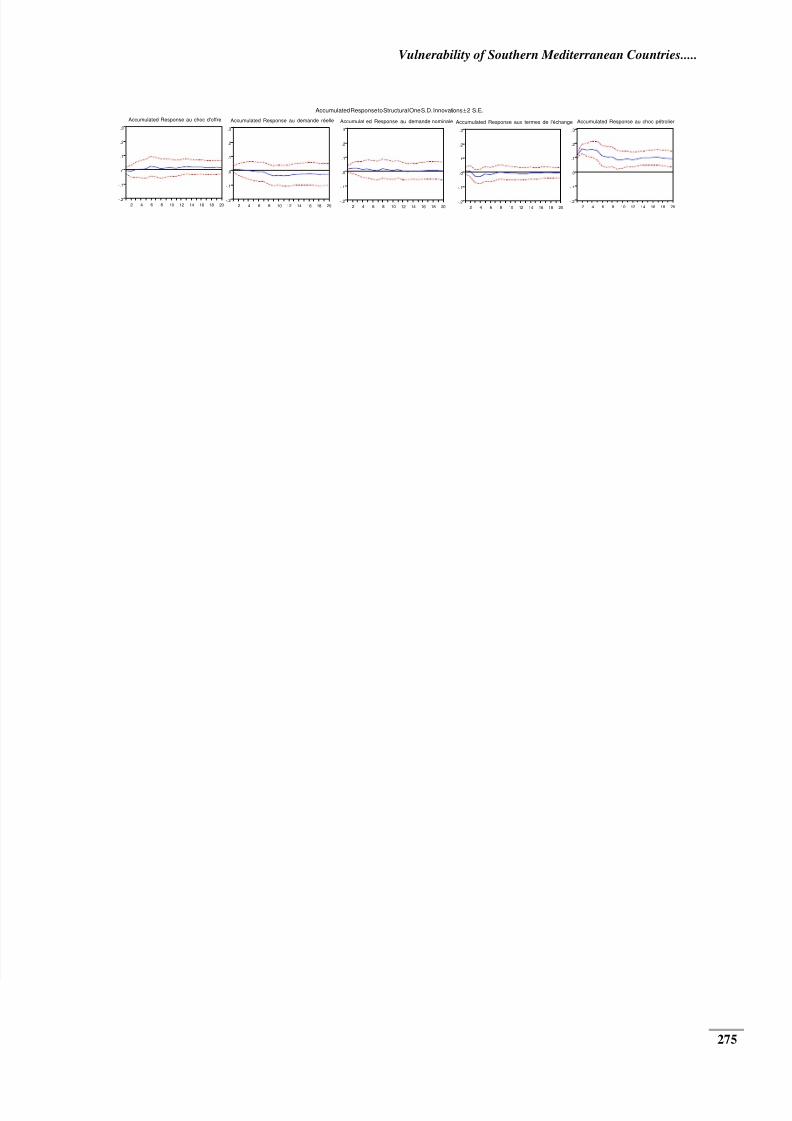
8/3/2019 Vulnerability of Southern Mediterranean Countries to Exogenous Shocks: Structural VAR Approach
http://slidepdf.com/reader/full/vulnerability-of-southern-mediterranean-countries-to-exogenous-shocks-structural 23/23
Vulnerability of Southern Mediterranean Countries.....
275
-.2
-.1
.0
.1
.2
.3
2 4 6 8 10 12 14 16 18 20
Accumulated Response au choc d'offre
-.2
-.1
.0
.1
.2
.3
2 4 6 8 10 12 14 16 18 20
Accumulated Response au demande réelle
-.2
-.1
.0
.1
.2
.3
2 4 6 8 10 12 14 16 18 20
Accumulat ed Response au demande nominale
-.2
-.1
.0
.1
.2
.3
2 4 6 8 10 12 14 16 18 20
Accumulated Response aux termes de l'échange
-.2
-.1
.0
.1
.2
.3
2 4 6 8 10 12 14 16 18 20
Accumulated Response au choc pétrolier
Accumulated Response to Structural One S.D. Innovations ± 2 S.E.