
Vulnerability Assessment of Jamaica's Transport Sector · priority regions and specific...
89
March 2018 This document was produced for review by the United States Agency for International Development. It was prepared by Chemonics for the ATLAS Task Order. VULNERABILITY ASSESSMENT OF JAMAICA’S TRANSPORT SECTOR TECHNICAL REPORT
Transcript of Vulnerability Assessment of Jamaica's Transport Sector · priority regions and specific...
March 2018 This document was produced for review by the United States Agency for International Development. It was prepared by Chemonics for the ATLAS Task Order.
VULNERABILITY ASSESSMENT OF JAMAICA’S TRANSPORT SECTOR
TECHNICAL REPORT

This document was produced for review by the United States Agency for International Development. It was prepared
by Chemonics International for the Climate Change Adaptation, Thought Leadership and Assessments (ATLAS) Task
Order No. AID-OAA-I-14-00013, under the Restoring the Environment through Prosperity, Livelihoods, and Conserving
Ecosystems (REPLACE) IDIQ.
Chemonics contact:
Chris Perine, Chief of Party ([email protected])
Chemonics International Inc.
1717 H Street NW
Washington, DC 20006
ATLAS reports and other products are available on the Climatelinks website: https://www.climatelinks.org/projects/atlas Cover Photo: National Works Agency, 2010; a completed section of Segment 3 - Northern Coastal Highway Improvement Project.

VULNERABILITY ASSESSMENT OF JAMAICA’S TRANSPORT SECTOR
March 2018
Prepared for:
United States Agency for International Development
Climate Change Adaptation, Thought Leadership and Assessments (ATLAS)
Prepared by:
Maria Fernanda Zermoglio and Owen Scott (Chemonics International Inc.)
This report is made possible by the support of the American people through the United States Agency for International Development (USAID). The contents of this report are the sole responsibility of the author or authors and do not necessarily reflect the views of USAID or the United States government.
VULNERABILITY ASSESSMENT OF JAMAICA’S TRANSPORT SECTOR | i
CONTENTS
LIST OF FIGURES AND TABLES ······································································ I
ACRONYMS ································································································· III
MESSAGE FROM THE MINISTER ··································································· IV
EXECUTIVE SUMMARY ·················································································· 1 Overview ......................................................................................................................... 1
What climate risks does Jamaica face and how will this impact the transport sector? ................................................................................................................... 1
What makes Jamaica’s transport sector vulnerable to climate variability and climate change? ..................................................................................................... 2
Priority vulnerabilities ....................................................................................................... 4 Recommendations........................................................................................................... 5
Investments and finance ..................................................................................................... 5 Leadership and governance - Institutions ........................................................................... 5 Leadership and governance - ............................................................................................. 6 Information systems ............................................................................................................ 7
INTRODUCTION ···························································································· 9 Overview ......................................................................................................................... 9 Objectives ....................................................................................................................... 9 The Jamaican transport sector ...................................................................................... 10
Roads ............................................................................................................................. 10 Public transport network ................................................................................................... 11 Airports ............................................................................................................................. 11 Ports ............................................................................................................................. 12 Railways ............................................................................................................................ 12
Climate variability and climate change and events that impact the transport sector ................................................................................................................. 14
Historical occurrence of damage to the transport sector ................................................ 16 Hurricanes and associated heavy rains ............................................................................ 19 Heavy rain-induced flooding, landslides, landslips and debris flow .................................. 19 Sea level rise and coastal storm surge ............................................................................. 20
INSTITUTIONAL ANALYSIS ···········································································21 Existing institutions in the transport sector ..................................................................... 22 Situational analysis of transport policy ........................................................................... 25
Policy overview ................................................................................................................. 25 Progress to date in achieving policy objectives ................................................................ 28 Gaps and challenges ........................................................................................................ 32
Evaluation of stakeholder readiness to climate-proof investments ................................. 34 Government of Jamaica .................................................................................................... 34 Transport sector stakeholders .......................................................................................... 35
VULNERABILITY ASSESSMENT ····································································38 Assumptions and limitations .......................................................................................... 39 Sensitivity – What parts of the transport network and its users are vulnerable and
why? .................................................................................................................. 40 Road conditions ................................................................................................................ 40

VULNERABILITY ASSESSMENT OF JAMAICA’S TRANSPORT SECTOR | ii
Drainage infrastructure ..................................................................................................... 43 Status of the country’s bridges .......................................................................................... 46 Status of the country’s principal public transportation network ......................................... 46
Exposure: What are the assets and system users vulnerable to? .................................. 47 Landslides ......................................................................................................................... 50 Floods ............................................................................................................................. 50
Criticality: Based on critical economic or social protection functions, which assets should be prioritized? ......................................................................................... 54 Future risk ......................................................................................................................... 54
Recommendations......................................................................................................... 61 Investments and finance ................................................................................................... 61 Leadership and governance ............................................................................................. 61 Information systems .......................................................................................................... 63
TRANSPORT SECTOR BEST PRACTICE FOR SMALL ISLAND DEVELOPING STATES ·····························································································65
REFERENCES ······························································································69
ANNEX A: DATA LIST OF SPATIAL INFORMATION COMPILED AND UTILIZED FOR THIS ASSESMENT ·························································72
ANNEX B: TRANSPORT POLICIES, PLANS, REPORTS AND STUDIES ···············74
ANNEX C: GUIDANCE DOCUMENTS AND TOOLS TO ASSESS CLIMATE RISKS TO THE TRANSPORT SECTOR ···················································76
VULNERABILITY ASSESSMENT OF JAMAICA’S TRANSPORT SECTOR | i
LIST OF FIGURES AND TABLES
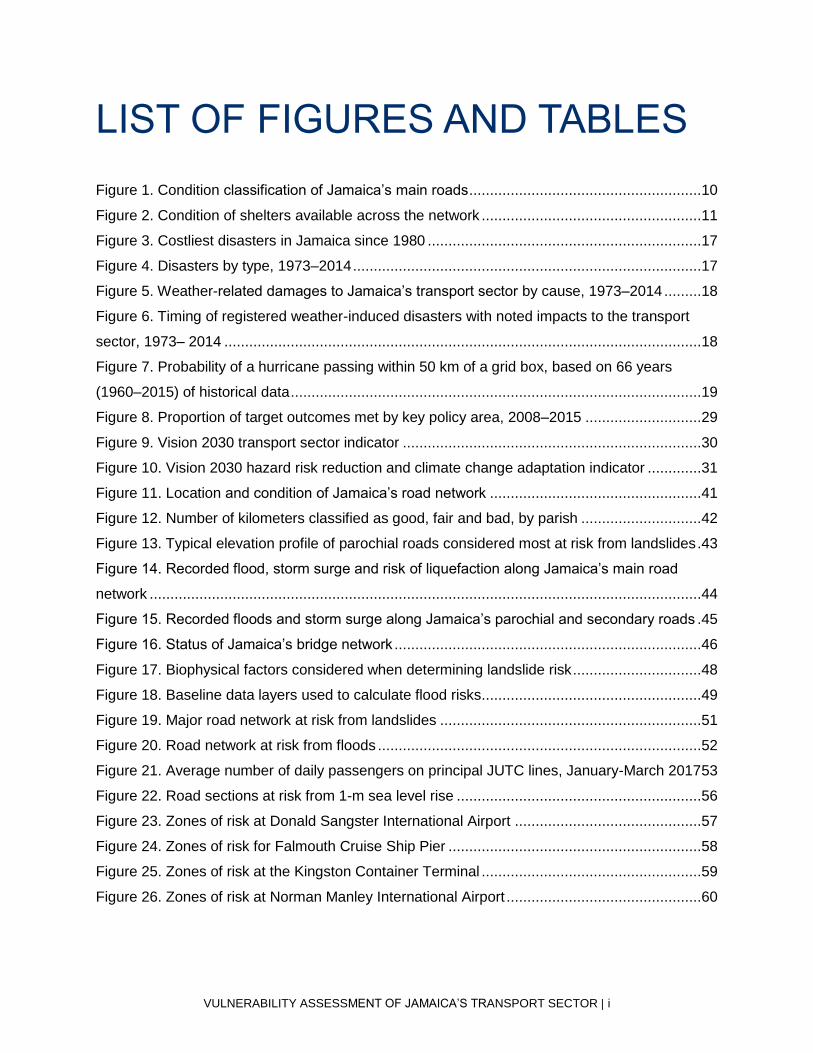
Figure 1. Condition classification of Jamaica’s main roads ........................................................10
Figure 2. Condition of shelters available across the network .....................................................11
Figure 3. Costliest disasters in Jamaica since 1980 ..................................................................17
Figure 4. Disasters by type, 1973–2014 ....................................................................................17
Figure 5. Weather-related damages to Jamaica’s transport sector by cause, 1973–2014 .........18
Figure 6. Timing of registered weather-induced disasters with noted impacts to the transport
sector, 1973– 2014 ...................................................................................................................18
Figure 7. Probability of a hurricane passing within 50 km of a grid box, based on 66 years
(1960–2015) of historical data ...................................................................................................19
Figure 8. Proportion of target outcomes met by key policy area, 2008–2015 ............................29
Figure 9. Vision 2030 transport sector indicator ........................................................................30
Figure 10. Vision 2030 hazard risk reduction and climate change adaptation indicator .............31
Figure 11. Location and condition of Jamaica’s road network ...................................................41
Figure 12. Number of kilometers classified as good, fair and bad, by parish .............................42
Figure 13. Typical elevation profile of parochial roads considered most at risk from landslides .43
Figure 14. Recorded flood, storm surge and risk of liquefaction along Jamaica’s main road
network .....................................................................................................................................44
Figure 15. Recorded floods and storm surge along Jamaica’s parochial and secondary roads .45
Figure 16. Status of Jamaica’s bridge network ..........................................................................46
Figure 17. Biophysical factors considered when determining landslide risk ...............................48
Figure 18. Baseline data layers used to calculate flood risks .....................................................49
Figure 19. Major road network at risk from landslides ...............................................................51
Figure 20. Road network at risk from floods ..............................................................................52
Figure 21. Average number of daily passengers on principal JUTC lines, January-March 2017 53
Figure 22. Road sections at risk from 1-m sea level rise ...........................................................56
Figure 23. Zones of risk at Donald Sangster International Airport .............................................57
Figure 24. Zones of risk for Falmouth Cruise Ship Pier .............................................................58
Figure 25. Zones of risk at the Kingston Container Terminal .....................................................59
Figure 26. Zones of risk at Norman Manley International Airport ...............................................60
VULNERABILITY ASSESSMENT OF JAMAICA’S TRANSPORT SECTOR | ii
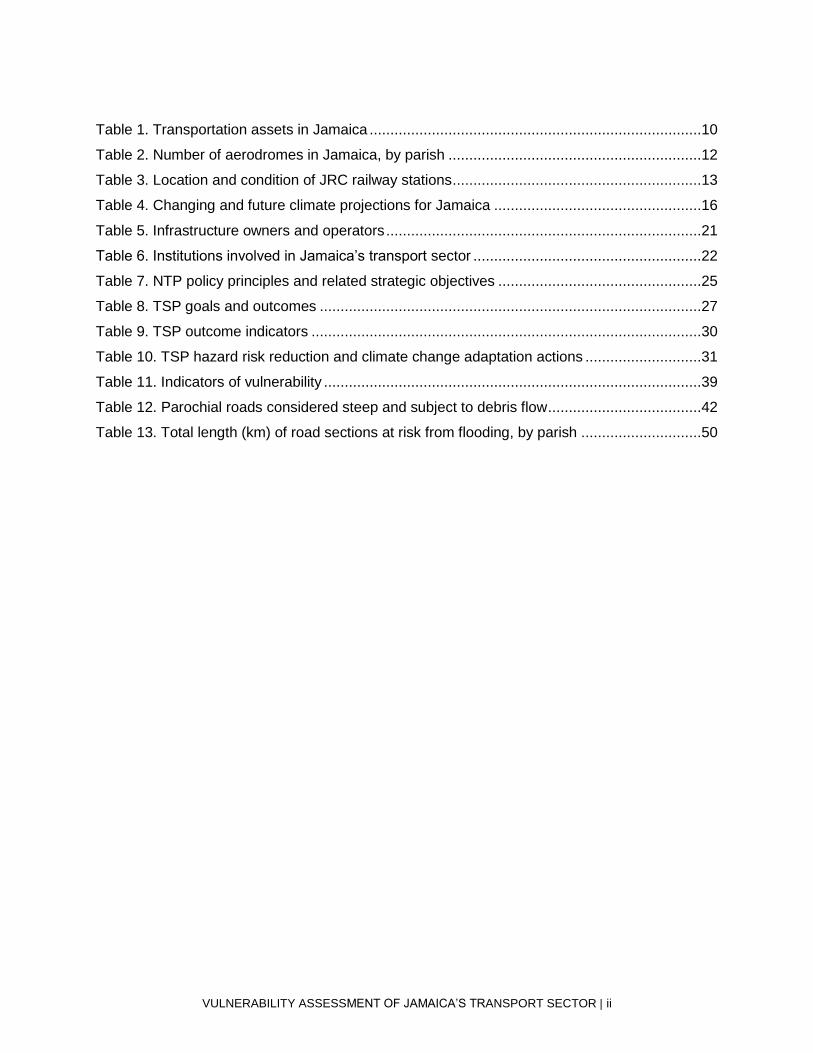
Table 1. Transportation assets in Jamaica ................................................................................10
Table 2. Number of aerodromes in Jamaica, by parish .............................................................12
Table 3. Location and condition of JRC railway stations ............................................................13
Table 4. Changing and future climate projections for Jamaica ..................................................16
Table 5. Infrastructure owners and operators ............................................................................21
Table 6. Institutions involved in Jamaica’s transport sector .......................................................22
Table 7. NTP policy principles and related strategic objectives .................................................25
Table 8. TSP goals and outcomes ............................................................................................27
Table 9. TSP outcome indicators ..............................................................................................30
Table 10. TSP hazard risk reduction and climate change adaptation actions ............................31
Table 11. Indicators of vulnerability ...........................................................................................39
Table 12. Parochial roads considered steep and subject to debris flow .....................................42
Table 13. Total length (km) of road sections at risk from flooding, by parish .............................50
VULNERABILITY ASSESSMENT OF JAMAICA’S TRANSPORT SECTOR | iii
ACRONYMS
AAJ Airports Authority of Jamaica CCD Climate Change Division
CSGM University of the West Indies Mona – Climate Studies Group
DRR Disaster Risk Reduction
GCI Global Competitiveness Index
GDP Gross Domestic Product
GIS Geographical Information System
GOJ Government of Jamaica
IPCC Intergovernmental Panel on Climate Change
JMD Jamaican Dollars
JRC Jamaica Railway Corporation
JUTC Jamaica Urban Transit Company
KCT Kingston Container Terminal
MEGJC Ministry of Economic Growth and Job Creation
M&E Monitoring and Evaluation
MGI University of the West Indies Mona – Geoinformatics Institute
MLGCD Ministry of Local Government and Community Development
MSJ Meteorological Service of Jamaica
MTM Ministry of Transport and Mining
MTWH Ministry of Transport, Works and Housing
NEPA National Environment and Planning Agency
NTP National Transport Policy
NWA National Works Agency
ODPEM Office of Disaster Preparedness and Emergency Management
PAJ Port Authority of Jamaica
PIOJ Planning Institute of Jamaica
RCP Representative Concentration Pathway
SIDS Small Island Developing States
TSP Vision 2030 Transport Sector Plan
TWG Thematic Working Group
UN United Nations
USAID United States Agency for International Development
USD United States Dollars
UWI Mona University of the West Indies, Mona Campus
WRA Water Resources Authority

VULNERABILITY ASSESSMENT OF JAMAICA’S TRANSPORT SECTOR | iv
MESSAGE FROM THE MINISTER
Hon. Michael Henry, C.D., M.P.
It has been proven over and over that the fundamental
principle of cooperation underpins a relatively safe and
efficient transport system. Effective transportation of
people, goods and services support the economic, social
and cultural development of our nation and by extension
our region. Everyone must therefore, ensure that he or she
plays his or her role in advancing our transportation system
to achieve its greatest potential.
This Government remains totally committed to developing a safe and efficient Transport Sector.
Since 2007 this administration has embarked on various initiatives to develop and implement a
seamless multi-modal system of transportation involving land (road, rail), sea and air using the
already existing road, rail connection to the sea and for the future the air.
This study is therefore instrumental in providing information that is vital to addressing some of
the country’s challenges in developing a sustainable transport system. The analysis provides a
clear view of priority areas for intervention and certain vulnerabilities in our systems for our
attention.
The average climate of the Caribbean Region is changing and will experience even further
changes as global warming increases. As temperatures continue to rise, extreme weather
events possibly increase, and sea levels continue to rise, it is extremely important that we are
aware of the challenges we are faced with in order to plan ahead and recognise how important
the air links are for the Region of the Caribbean.
Our highly heterogeneous topographic environment remains at risk to natural hazards, which
impact the transport sector, our people and economic activities. As Minister with responsibility of
the development of an integrated transport system (road, rail, sea and air), it is important that
we implement strategies that are in line with this objective.
Growth and development are significant elements of any progressive nation. These are among
the characteristics that provide a platform for continuity. The team at the Ministry is cognisant
that our success is dependent on the involvement of external entities and the adaptation of
global best practices. We are also aware that the assessment process is one that needs to be
treated with utmost importance and must be consistent with international norms and standards.

VULNERABILITY ASSESSMENT OF JAMAICA’S TRANSPORT SECTOR | v
I therefore use this opportunity to endorse partnerships as essential to mitigate the threats
associated with the natural hazards of the country’s climate to the Transportation Sector.
As we continue to work towards Jamaica achieving its vision of sustainability, let us use the
findings of this report to guide our plans and decisions, as we work to making “Jamaica the
place to live, work, raise families and do business”.
Honorable Michael Henry, C.D., M.P.
Minister of Transport and Mining
VULNERABILITY ASSESSMENT OF JAMAICA’S TRANSPORT SECTOR | 1
EXECUTIVE SUMMARY
OVERVIEW
Jamaica’s transportation system is already affected by weather extremes. Damage to roads,
bridges and supporting infrastructure such as drains and culverts is commonplace, both as a
result of extreme events as well as outdated design and inadequate maintenance. This
document examines the vulnerability of the transport sector’s assets to weather, climate
variability and climate change, and identifies locations within the system that currently
experience and are likely to experience future negative impacts. The analysis sheds light on
priority regions and specific vulnerabilities. With the upcoming revision of Jamaica’s National
Transport Policy (NTP), this assessment aims to offer guidance on how to climate-proof future
and current investments in light of a changing and more variable climate.
WHAT CLIMATE RISKS DOES JAMAICA FACE AND HOW WILL THIS IMPACT THE TRANSPORT SECTOR?
Weather and climatic conditions experienced in the Caribbean region are a product of both
human-induced climate change and natural cyclical climate patterns. Climate experts agree that
the average climate of the Caribbean region is changing and will undergo significant changes as
global warming continues, even if key mitigation efforts were taken today to reduce the emission
of greenhouse gases (IPCC 2007, others). The following is a summary of these changes:
Temperatures will continue to rise. When compared with the 1986–2005 time period,
Jamaica is expected to experience a significant rise in temperatures across all seasons of about
0.85–1.8°C by mid-century, and up to 4°C by the end of the century. By themselves, increases
in temperature can have a significant impact on critical transport sector functions. For example:
• Higher temperatures and increased heat extremes can increase not only the discomfort for those using public transportation but also the risk from heat exposure, especially for children and the elderly.
• Higher temperatures and increased heat extremes may require an alteration of maintenance and construction crew schedules, to protect workers from heat risks.
• Higher temperatures can increase the need for and costs of maintaining adequate cooling in public transportation vehicles.
• Higher temperatures and more heat extremes could result in aircraft payload restrictions, flight cancellations and service disruptions, which would have critical impacts on the tourism industry. Extreme heat can cause buckling of runways. Aircraft lift may also be affected, as the less dense, hotter air reduces the mass flow necessary over the wing to create lift. If runways are not long enough for large aircraft to build speed to generate lift, their weight must be reduced. In extreme cases, flights will need to be cancelled.
• Higher temperatures could lead to more frequent buckling of pavements and misalignment of rail lines. Concrete and reinforcement structures of rail lines expand and

VULNERABILITY ASSESSMENT OF JAMAICA’S TRANSPORT SECTOR | 2
contract due to moisture absorption, which could, in cases of extreme heat, lead to buckling.
Extreme weather events could increase. Extreme events have had a significant impact on
Jamaica’s economy, environment and people. Five major storm events between 2004 and 2008
reportedly caused USD1.2 billion in losses and damage (Neufville/IPS 2012). More intense
tropical storms are a likely result of climate variability and change. With respect to the transport
sector, four extremes are relevant: hurricanes, precipitation, wind and storm surges.
• Stronger storms generally extend the periods of intense precipitation and strong winds, and cause tidal surges that can devastate the transport sector. Jamaica lies in the path of Atlantic hurricanes and spends upwards of JMD72 billion, or approximately 3 percent of its gross domestic product (GDP), dealing with the impacts (Burgess 2015).
• Excessive rainfall and flooding can damage road infrastructure. Because many coastal
roadways serve as evacuation routes during hurricanes, their vulnerability may increase
coastal areas’ overall vulnerability to climate risks. Furthermore, severe storms can
disrupt traffic, potentially leading to more accidents and delays.
• Heavy rains increase the risk of exposure to the elements and challenge those most in
need of public transportation, including children and the elderly.
Sea levels will continue to rise. Port infrastructure, including facilities such as the Montego
Bay and Ocho Rios cruise terminals, as well as Port Antonio are important transport assets with
long design lives. They are sensitive to sea level rise, with decking and wharves more frequently
exposed to larger wave forces, resulting in increased scour of foundations of marine structures.
They are also vulnerable to increased risk of
overtopping during storm surges. Many airports
are located near the coast and vulnerable to rising
seas, including Norman Manley International
Airport, which sits at an average elevation of 3
meters (m) above sea level and is also vulnerable
to flooding. Projections suggest a minimum of 2–3
millimeters (mm) rise in sea levels per year during
the first half of the century. At a minimum, these impacts are likely to result in more weather
delays and periodic interruptions.
WHAT MAKES JAMAICA’S TRANSPORT SECTOR VULNERABLE TO CLIMATE VARIABILITY AND CLIMATE CHANGE?
A highly heterogeneous topographic environment. Jamaica has an extensive coastline and
rugged mountains that are subject to landslides, extreme weather (inclement weather) and
seismic events, as well as a diverse network of rivers and streams. These all contribute to its
vulnerability to hydro-meteorological hazards, which impact the transport sector, people and
economic activities. The interior of the island, particularly in the east, is characterized by steep,
well-weathered slopes, highly fractured geological formations and well-developed networks of
rivers and natural drains (gullies) draining north and south from a central east–west-trending
“Where climate change is concerned, everything
up to 10 meters is vulnerable. That will put all our
critical facilities at risk, our transshipment port in
Kingston, both major airports and the north-south
coast – that is effectively 70 percent of our GDP.”
— Maurice Mason, Environmental Economist

VULNERABILITY ASSESSMENT OF JAMAICA’S TRANSPORT SECTOR | 3
mountainous axis. As such, erosion and landslides are serious problems affecting the transport
and other sectors.
Limited scheduling and financing of infrastructure maintenance. Transport infrastructure
assets have a limited lifetime, after which they may need to be reconstructed to meet the
new construction codes, climate risks and demand realities. This lifetime, however, is also
dependent on a proper operations and maintenance regime, including drainage, cleaning
and repairs, so that assets continue to fulfill their function. There is a case to be made for
the value of operations and maintenance investments in the country’s transport network,
especially in light of the fact that many if not most of the floods that negatively impact the
sector are a function of improper drainage and insufficient maintenance.
Unregulated land use change and outdated construction codes. Sidewalks, pavement,
roads and other impermeable surfaces have reduced the absorptive capacity of the landscape,
exacerbating erosion from flooding caused by extreme storm events as the water essentially
gets channeled through these impermeable surfaces. Construction on steep terrain and removal
of the native forests that helped to stabilize the soil have increased erosion and landslide risk.
Design criteria for the country’s principal drainage system are outdated and do not properly
consider the changing climate dynamics, including the occurrence of more intense storms that
require, for example, larger culverts. Given the various stakeholders involved in building and
permitting the road network, even well-designed systems can suffer adverse impacts from
nearby developments, forcing drainage systems to absorb more than their intended flows.
Inconsistent planning and limited consideration related to increased urbanization and
population growth. Jamaica has seen rapid population growth, coupled with significant
migration from rural agricultural areas to cities. In 1960, 34 percent of the population lived in
urban areas; in 2011 that figure was at 54 percent, and the United Nations (UN) projects that it
will rise to 65 percent by 2050 (Tindigarukayo 2014). This growth and migration over the last
several decades was unplanned, often resulting in squatter occupation of available lands, in
many cases in high-risk areas such as those prone to landslides and flooding. Inconsistent land
use planning and limited capacity to enforce existing regulations allowed for uncontrolled urban
expansion into high-risk areas such as those on steep slopes or along the banks of tributaries.
A highly concentrated coastal population. Jamaica’s population is concentrated in coastal
areas that are vulnerable to storm surges and flooding. Given the tourism sector’s prominence
in the country’s economy, development of the coastline is likely to continue. Many cities and
towns occupy highly vulnerable locations such as riverbanks, unstable hillsides, deforested
lands or fragile water catchments. Access roads to these areas often require navigating fords
and bridges that are themselves subject to the negative impacts of floods, storm surge and
rising sea levels.
Policies and planning measures that lack sufficient climate change considerations.
Neither the NTP nor the Vision 2030 Transport Sector Plan (TSP) includes meaningful climate
change considerations. As a result, the sector developed rapidly over the past 20 to 30 years
VULNERABILITY ASSESSMENT OF JAMAICA’S TRANSPORT SECTOR | 4
with limited consideration for disaster risk and little planning for a changing climate. While
certain projects have accounted for climate change in their design, a comprehensive approach
will be needed to climate-proof existing infrastructure.
Insufficient climate and weather data for decision making. Recent efforts by the University
of the West Indies, Mona Campus (UWI Mona) Climate Studies Group (CSGM) and by the
Meteorological Service of Jamaica (MSJ) have worked to address this issue, but reliable data
on return periods, rainfall, disaster risk and climate projections continue to be insufficient and
difficult to access. Where data do exist, many of the transport stakeholders involved in policy,
planning and implementation do not have sufficient in-house expertise to analyze the data and
incorporate them in a meaningful way into decision making and design.
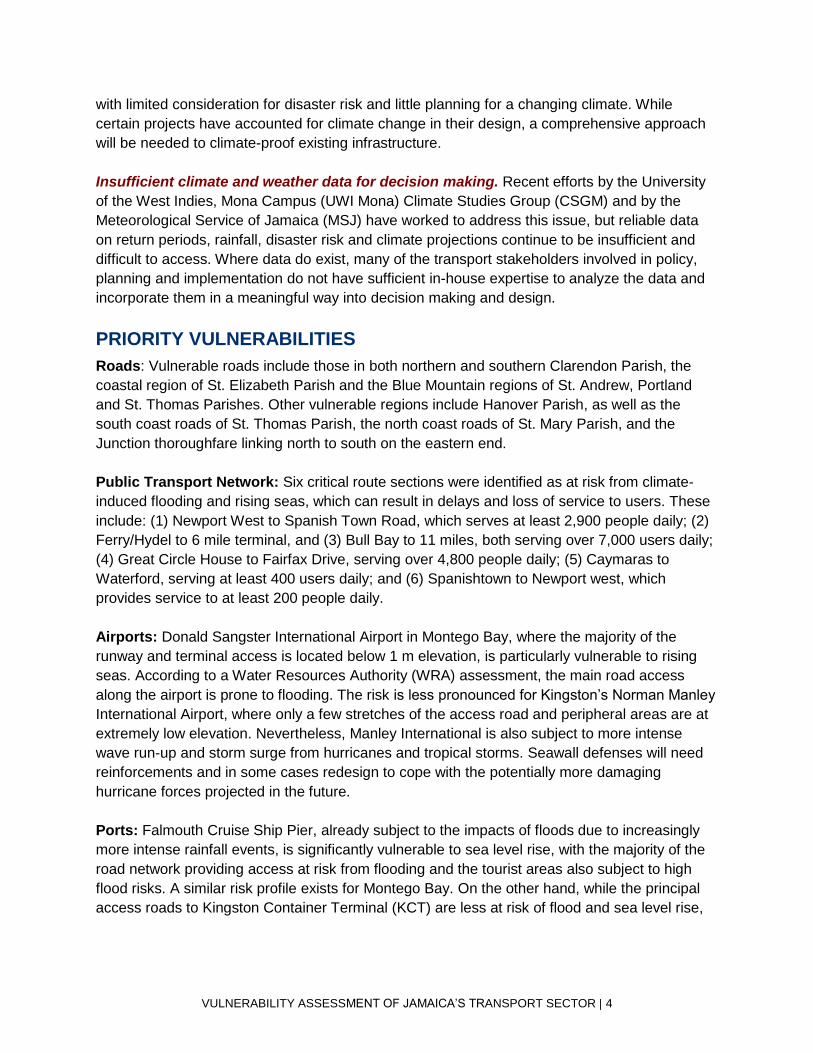
PRIORITY VULNERABILITIES
Roads: Vulnerable roads include those in both northern and southern Clarendon Parish, the
coastal region of St. Elizabeth Parish and the Blue Mountain regions of St. Andrew, Portland
and St. Thomas Parishes. Other vulnerable regions include Hanover Parish, as well as the
south coast roads of St. Thomas Parish, the north coast roads of St. Mary Parish, and the
Junction thoroughfare linking north to south on the eastern end.
Public Transport Network: Six critical route sections were identified as at risk from climate-
induced flooding and rising seas, which can result in delays and loss of service to users. These
include: (1) Newport West to Spanish Town Road, which serves at least 2,900 people daily; (2)
Ferry/Hydel to 6 mile terminal, and (3) Bull Bay to 11 miles, both serving over 7,000 users daily;
(4) Great Circle House to Fairfax Drive, serving over 4,800 people daily; (5) Caymaras to
Waterford, serving at least 400 users daily; and (6) Spanishtown to Newport west, which
provides service to at least 200 people daily.
Airports: Donald Sangster International Airport in Montego Bay, where the majority of the
runway and terminal access is located below 1 m elevation, is particularly vulnerable to rising
seas. According to a Water Resources Authority (WRA) assessment, the main road access
along the airport is prone to flooding. The risk is less pronounced for Kingston’s Norman Manley
International Airport, where only a few stretches of the access road and peripheral areas are at
extremely low elevation. Nevertheless, Manley International is also subject to more intense
wave run-up and storm surge from hurricanes and tropical storms. Seawall defenses will need
reinforcements and in some cases redesign to cope with the potentially more damaging
hurricane forces projected in the future.
Ports: Falmouth Cruise Ship Pier, already subject to the impacts of floods due to increasingly
more intense rainfall events, is significantly vulnerable to sea level rise, with the majority of the
road network providing access at risk from flooding and the tourist areas also subject to high
flood risks. A similar risk profile exists for Montego Bay. On the other hand, while the principal
access roads to Kingston Container Terminal (KCT) are less at risk of flood and sea level rise,
VULNERABILITY ASSESSMENT OF JAMAICA’S TRANSPORT SECTOR | 5
the container terminal itself, particularly the storage areas in the south terminal, has significant
areas located below 1 m in elevation.1
RECOMMENDATIONS
This study demonstrates that as the impacts of climate change (i.e., rising temperatures, more
extreme heat events, more intense rainfall events, rising seas) manifest, the burden of risks to
Jamaica’s transport sector is expected to increase unless additional investments are made.
Some projected additional losses, for example from landslides, are potentially preventable if
high-risk areas are identified and design criteria for transport networks take these risks into
account. Reducing transport sector risks will require modifying current policies and programs
and implementing new ones to explicitly consider climate variability and change. Adaptation
actions should focus on building a more climate-resilient transport system, reducing overall
vulnerability and developing specific system capacities. Entry points include: 1) investments and
finance, 2) leadership and governance, specifically regarding institutions and planning
mechanisms, and 3) information systems. Specific actions to align with Jamaica’s Vision 2030
document are detailed below.
INVESTMENTS AND FINANCE
Conduct additional assessment(s) on scope of financing needs. Navigation and port
facilities, roads and drainage infrastructure, and other transport assets have a design lifetime,
after which they may need to be reconstructed to meet the climate and demand realities of the
day. Furthermore, this lifetime is dependent on proper maintenance and repairs to guarantee
asset performance. For example, a typical asphalt road may be designed to last 26 years but
will require resealing sometime during the first 13 years depending on traffic volumes and
vehicle weights. This assessment clearly points to the need to budget for and undertake
consistent maintenance of the country’s transport network to guarantee full functionality,
particularly with respect to drainage, maintenance and cleaning. Additionally, some nearshore
roads, seawalls and bridges will increasingly require repair, and if the sea level rise is
augmented by increased storm activity, the impact will necessitate redesign to new standards.
Further assessment should be undertaken to understand the scope of financing needs by
cataloguing the design lifetime of major infrastructure (e.g., roads, bridges, ports) and costing
out improved maintenance regimes for different types of infrastructure.
LEADERSHIP AND GOVERNANCE - Institutions
Increase capacity for the Ministry of Transport and Mining (MTM) to coordinate and
convene the relevant expertise to build climate resilience and disaster risk reduction
(DRR) approaches into plans and operations. The MTM does not currently have a unit
dedicated to DRR under its technical services or planning and research departments, despite
the climate-related impacts on the sector. Nevertheless, several external agencies (National
Works Agency/NWA on road design; Climate Change Division/CCD on climate adaptation;
1 Note that risks to ports in this assessment focused on access and function rather than infrastructure damage, since a full
infrastructure risk assessment would require a detailed engineering analysis.
VULNERABILITY ASSESSMENT OF JAMAICA’S TRANSPORT SECTOR | 6
Office of Disaster Preparedness and Emergency Management/ODPEM on disaster risk
management) do have relevant expertise that could be brought to bear on the subject. CCD or
other external consultants should conduct training for other MTM staff, particularly those
involved in developing policy, action plans, and monitoring and evaluation (M&E) plans. Topics
could include: understanding climate change impacts on the transport sector; crafting policy to
reduce impacts from climate-related risks; devising strategies and actions to increase the
climate resilience of transport infrastructure; and developing relevant indicators and targets to
track performance over time. Such a training could position and prepare MTM staff to convene
and coordinate the analyses and discussion necessary to climate-proof transport operations.
Establish a task force for NTP revisions and a Transport Sector Thematic Working Group
(TWG) under Vision 2030. A task force similar to the one that leads the TSP process should be
created within the MTM to lead NTP policy revision and coordinate with stakeholders. A
dedicated task force with representatives from multiple agencies will ensure all subsectors are
adequately addressed in the policy and that consultations are conducted with the wide network
of sector stakeholders.
TWGs in other sectors have proven successful as a mechanism to support the implementation
and M&E of Vision 2030 sectoral plans. They provide an important forum that brings in voices
outside of government from civil society, the private sector and development partners, and can
assist with planning, tracking progress, addressing shortfalls, identifying and mobilizing
resources, sharing information and ensuring coordination among stakeholders.
Increase capacity of other transport sector stakeholders to understand and address
climate risks within the context of the expected lifespan of investments. From the
technical personnel in parish councils to government agencies responsible for oversight and
regulation of transport infrastructure, additional capacity is strongly needed to 1) better
understand and cope with climate risks, and 2) better understand the scientific basis for
improved design and planning, as well as the more important development implications of new
investments and their coordinated operations.
Include tailored climate change adaptation clauses on all new concession agreements,
and review and amend existing concession agreements where possible. With the update
of the NTP, as well as the creation of the Climate Change Policy Framework, all new
agreements (and where possible, existing agreements) should ensure concessionaires’
operations are in compliance with provisions of national transport and climate change policies,
as well as with national environmental laws and international standards.
LEADERSHIP AND GOVERNANCE - Planning mechanisms
Develop a strategy, action plan and M&E plan to accompany the revised NTP. Policy must
be accompanied by planning mechanisms such as a medium-term strategic plan, an action plan
with defined tasks, and an M&E plan that assigns responsibility for collecting data and sets clear
indicators and targets. The action plan should consist of discrete tasks that can be
implemented, measured and completed, and should assign responsible parties and timeframe,
VULNERABILITY ASSESSMENT OF JAMAICA’S TRANSPORT SECTOR | 7
along with budget estimates. The M&E plan should establish a methodology for monitoring the
progress of tasks, along with indicators that clearly measure efforts to implement the action
plan, as well as a system to collect indicator data.
Incorporate climate change considerations into the revised NTP. Three main areas, at a
minimum, should be addressed: climate data to be used in analysis; design criteria; and risk
screening requirements. The NTP should set requirements for the use of climate data (including
historical and future projections of rainfall, flooding, storm surge and tropical storms) when
making planning and investment decisions. Design standards for infrastructure and best
practices for operations and maintenance informed by climate information and international best
practice should also be included in the policy. The NTP should also designate the types (in
terms of capital expenditure or extent of construction) of investments that should be screened
for climate risk and define the tool(s) to be used as well as a standard process for screening.
Establish partnerships to help address indirect issues, such as solid waste management,
construction waste and drainage, that cause or exacerbate flooding and infrastructure
deterioration. While aspects of solid waste management and drainage fall under the
responsibility of the National Solid Waste Management Authority (NSWMA) and WRA, the MTM
has purview over certain elements. Examples of issues to incorporate into the revised NTP
include: setting requirements for storm drain cleaning, establishing standards for road drainage,
and setting policy and enforcement mechanisms for road repair and post-repair waste removal,
among others. The Vision 2030 TWG for transportation would be a logical entity to liaise with
others to guarantee consistency of operations across related sectors.
Develop a hazard mitigation strategy and disaster response strategy for each subsector.
Following on plans from the NTP, TSP and the Climate Change Policy Framework, the MTM
should follow through on developing formal hazard mitigation and disaster response strategies
for each of the transport subsectors (roads, airports, seaports and possibly railways). These
strategies, developed together with the revised NTP, will guide action to address and respond to
natural disasters. The strategies should also be developed and refined through stakeholder
consultations to ensure broad-based input during the drafting phase.
Update urban development plans. In coordination with the Ministry of Local Government and
Community Development (MLGCD), municipal corporations need to update urban development
plans to reflect the changing risk profile for floods and landslides to the parish road networks.
Updated plans also need to be aligned with the Master Drainage Plan developed by NWA.
INFORMATION SYSTEMS
Conduct analyses to inform revisions to design criteria for all assets, taking into account
a changing climate. For example, bridges and culverts are currently designed using standards
and river flow models developed prior to 1960. Shifting rainfall patterns need to be considered in
new design criteria to safeguard investments. Novel ways of incorporating the large volume of
debris and vegetation being carried into drains, culverts and channels need to be devised, as
the current structural guidelines accommodate only pure water flows. Design criteria, land use

VULNERABILITY ASSESSMENT OF JAMAICA’S TRANSPORT SECTOR | 8
regulations and other related regulations are contained in a variety of documents, including the
National Building Code, the Main Roads Act, the Parochial Roads Act, the Town and Country
Planning Act, the Local Improvements Act, the Beach Control Act, and Volume 3 of the National
Environment and Planning Agency’s (NEPA) Development and Investment Manual.
Improve quality and maintenance of existing data. Significant data are available on the road
network and road conditions, bridge locations and conditions, airport and seaport infrastructure,
flood- and landslide-prone areas, floodplain maps, river and gulley networks, watersheds, soil
condition and composition, weather and climate, and a host of other relevant information. These
data can be used in transport infrastructure management and investment planning, but they are
often available only within the ministries or agencies that developed them. In addition, the
quality of data varies across datasets. However, the dispersed and uncoordinated natural
hazards records pose significant challenges for the formulation of plans and projects to deal
with current and emerging risks. Dissemination mechanisms within the key institutions
responsible for risk management currently also impede the use and application of available
studies. A database housed within the National Spatial Data Planning Division that integrates
climatic, geophysical and infrastructure data in a meaningful way, along with a plan and team
dedicated to curating these data, would be useful across the sector.
Develop more detailed hazard assessments for specific assets at finer spatial scales.
According to Brabb (1993) and others, at least 90 percent of the losses due to landslides, for
example, could be avoided if detailed information and responses were available to engineers
and communities. While this assessment begins to unpack these risks, additional information is
required for the regions and assets specified as vulnerable to determine appropriate safeguards
to put in place.
Conduct detailed vulnerability assessments for specific assets. A deeper dive into the
vulnerability of specific investments could offer important information on the need to climate-
proof the assets. For example, the Airports Authority of Jamaica’s (AAJ) planned vulnerability
assessment of Norman Manley International Airport will, over the course of at least nine months,
collect and model vulnerability to storm surges, wave run-up and other risks within the confines
of the airport facilities and their access roads. This information is critical for prioritizing
investments. This assessment points to the need to prioritize such analyses for the country’s
parochial road network, for which limited information is available.
Conduct a public education program that helps to raise awareness of the risks from
floods and other climate changes. A public education program can offer salient advice on
new developments in sensitive areas. In the long term, this may also help to raise awareness of
officials in municipal corporations, which in large part approve construction in high-risk zones.
Leveraging and capitalizing on the collective experiences of CARICOM (Caribbean Community)
countries and the Caribbean Community Climate Change Centre could help to bring island-
appropriate knowledge and insights to the task.
VULNERABILITY ASSESSMENT OF JAMAICA’S TRANSPORT SECTOR | 9
INTRODUCTION
OVERVIEW
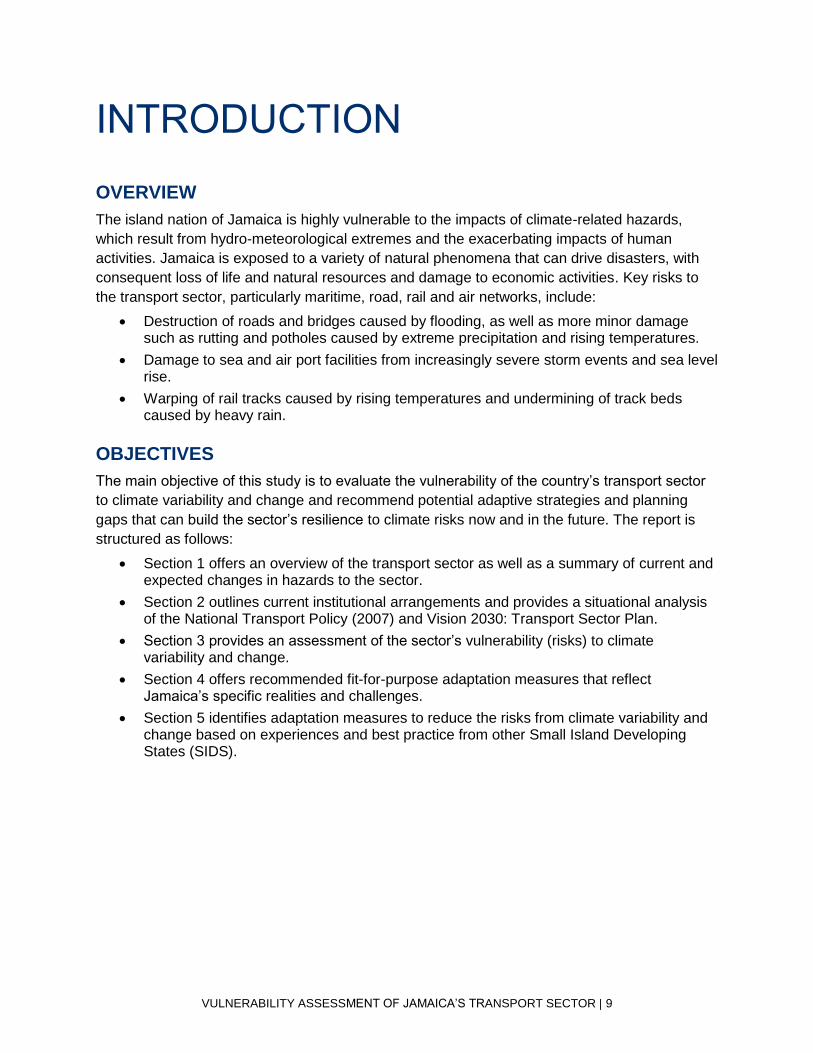
The island nation of Jamaica is highly vulnerable to the impacts of climate-related hazards,
which result from hydro-meteorological extremes and the exacerbating impacts of human
activities. Jamaica is exposed to a variety of natural phenomena that can drive disasters, with
consequent loss of life and natural resources and damage to economic activities. Key risks to
the transport sector, particularly maritime, road, rail and air networks, include:
• Destruction of roads and bridges caused by flooding, as well as more minor damage such as rutting and potholes caused by extreme precipitation and rising temperatures.
• Damage to sea and air port facilities from increasingly severe storm events and sea level rise.
• Warping of rail tracks caused by rising temperatures and undermining of track beds caused by heavy rain.
OBJECTIVES
The main objective of this study is to evaluate the vulnerability of the country’s transport sector
to climate variability and change and recommend potential adaptive strategies and planning
gaps that can build the sector’s resilience to climate risks now and in the future. The report is
structured as follows:
• Section 1 offers an overview of the transport sector as well as a summary of current and expected changes in hazards to the sector.
• Section 2 outlines current institutional arrangements and provides a situational analysis of the National Transport Policy (2007) and Vision 2030: Transport Sector Plan.
• Section 3 provides an assessment of the sector’s vulnerability (risks) to climate variability and change.
• Section 4 offers recommended fit-for-purpose adaptation measures that reflect Jamaica’s specific realities and challenges.
• Section 5 identifies adaptation measures to reduce the risks from climate variability and change based on experiences and best practice from other Small Island Developing States (SIDS).
VULNERABILITY ASSESSMENT OF JAMAICA’S TRANSPORT SECTOR | 10
THE JAMAICAN TRANSPORT SECTOR
The Jamaican transportation sector consists of an extensive network of roads and bridges,
railways, ports and airports (Table 1). The following offers an overview of the sector’s assets
with a discussion of their current condition and operational integrity. This discussion is the basis
of the subsequent analysis of vulnerabilities.
Table 1. Transportation assets in Jamaica
ASSET CHARACTERISTICS
Main Roads23 Total 4,922 km
Class A 826 km
Class B 624 km
Class C 2,955 km
Undefined class 517
Parochial and other
roads4
17,155 km
Bridges 736 bridges
Airports 3 international airports, 3 public aerodromes, 2 Defense Force aerodromes and 34 private or other classification aerodromes
Seaports 11 specialized seaports and 3 public deep-water ports
Railway lines and stations
330 km of track, 6 privately owned railway lines
Source: Authors’ calculations and information from the National Works Agency, 2016.
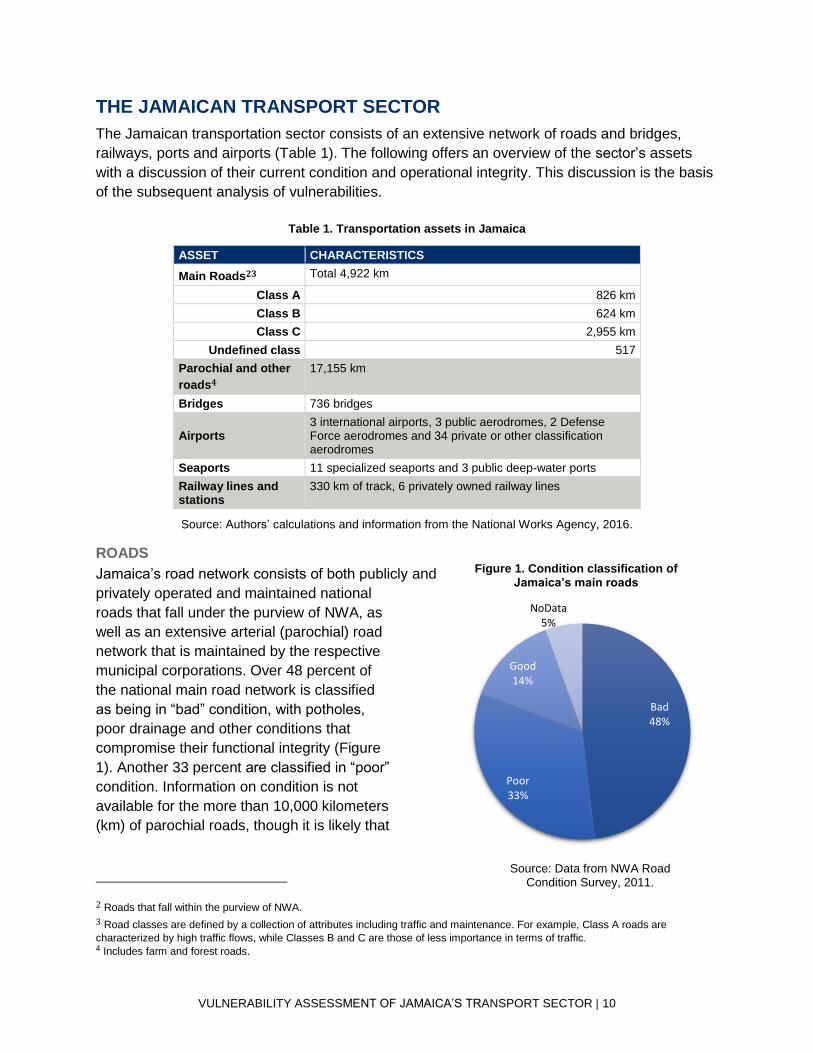
ROADS
Jamaica’s road network consists of both publicly and
privately operated and maintained national
roads that fall under the purview of NWA, as
well as an extensive arterial (parochial) road
network that is maintained by the respective
municipal corporations. Over 48 percent of
the national main road network is classified
as being in “bad” condition, with potholes,
poor drainage and other conditions that
compromise their functional integrity (Figure
1). Another 33 percent are classified in “poor”
condition. Information on condition is not
available for the more than 10,000 kilometers
(km) of parochial roads, though it is likely that
2 Roads that fall within the purview of NWA.
3 Road classes are defined by a collection of attributes including traffic and maintenance. For example, Class A roads are
characterized by high traffic flows, while Classes B and C are those of less importance in terms of traffic. 4 Includes farm and forest roads.
Bad48%
Poor33%
Good14%
NoData5%
Figure 1. Condition classification of Jamaica’s main roads
Source: Data from NWA Road Condition Survey, 2011.
VULNERABILITY ASSESSMENT OF JAMAICA’S TRANSPORT SECTOR | 11
these are in the same or worse condition, as they tend to be more remote, unpaved and less
frequently maintained.
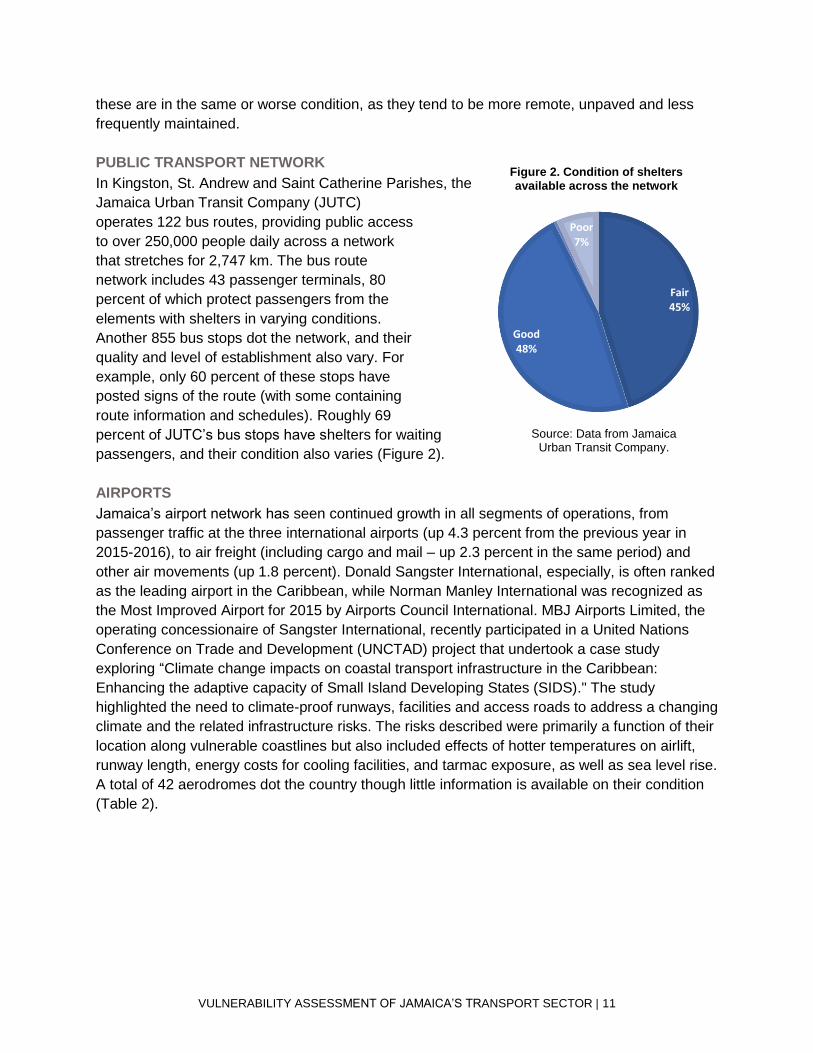
PUBLIC TRANSPORT NETWORK
In Kingston, St. Andrew and Saint Catherine Parishes, the
Jamaica Urban Transit Company (JUTC)
operates 122 bus routes, providing public access
to over 250,000 people daily across a network
that stretches for 2,747 km. The bus route
network includes 43 passenger terminals, 80
percent of which protect passengers from the
elements with shelters in varying conditions.
Another 855 bus stops dot the network, and their
quality and level of establishment also vary. For
example, only 60 percent of these stops have
posted signs of the route (with some containing
route information and schedules). Roughly 69
percent of JUTC’s bus stops have shelters for waiting
passengers, and their condition also varies (Figure 2).
AIRPORTS
Jamaica’s airport network has seen continued growth in all segments of operations, from
passenger traffic at the three international airports (up 4.3 percent from the previous year in
2015-2016), to air freight (including cargo and mail – up 2.3 percent in the same period) and
other air movements (up 1.8 percent). Donald Sangster International, especially, is often ranked
as the leading airport in the Caribbean, while Norman Manley International was recognized as
the Most Improved Airport for 2015 by Airports Council International. MBJ Airports Limited, the
operating concessionaire of Sangster International, recently participated in a United Nations
Conference on Trade and Development (UNCTAD) project that undertook a case study
exploring “Climate change impacts on coastal transport infrastructure in the Caribbean:
Enhancing the adaptive capacity of Small Island Developing States (SIDS)." The study
highlighted the need to climate-proof runways, facilities and access roads to address a changing
climate and the related infrastructure risks. The risks described were primarily a function of their
location along vulnerable coastlines but also included effects of hotter temperatures on airlift,
runway length, energy costs for cooling facilities, and tarmac exposure, as well as sea level rise.
A total of 42 aerodromes dot the country though little information is available on their condition
(Table 2).
Fair45%
Good48%
Poor7%
Figure 2. Condition of shelters available across the network
Source: Data from Jamaica Urban Transit Company.

VULNERABILITY ASSESSMENT OF JAMAICA’S TRANSPORT SECTOR | 12
Table 2. Number of aerodromes in Jamaica, by parish
PARISH NUMBER OF AERODROMES
Clarendon 5
Hanover 1
Manchester 3
Portland 2
Kingston & St. Andrew 3
St. Ann 5
St. Catherine 6
St. Elizabeth 5
St. James 3
St. Mary 2
St. Thomas 2
Trelawny 1
Westmoreland 4
Total 42
Source: Jamaica Civil Aviation Authority, 2014.
PORTS
Marine transportation infrastructure includes ports, harbors and supporting intermodal terminals,
and the ships and barges that use these facilities. Sea transportation is often the only mode of
transportation for moving freight within the Caribbean. Jamaica is also an important destination
for cruise tourism, which contributes significantly to the tourism sector. The country’s newest
and most extensive cruise ship terminal, Historic Falmouth Cruise Ship Pier, was built in 2011
and is operated by Falmouth Jamaica Land Company, a partnership between Royal Caribbean
Cruise Lines and the Port Authority of Jamaica (PAJ). In spite of its prominence in the tourism
industry (accounting for approximately 50 percent of total cruise ship passenger arrivals to the
country), the port suffers from poor connectivity, with only one roadway access point, off
Trelawny Street in the town of Falmouth. Because of the port’s location, it is impossible to
access without driving through the small town’s narrow, potholed roads, which are susceptible
to flooding due to poor drainage. A second critical port facility is KCT, in operation since 1975. It
handles roughly 8 million metric tons of cargo each year. While improvement works are
underway for all facilities, few plans, if any, consider engineering requirements to deal with a
changing climate.
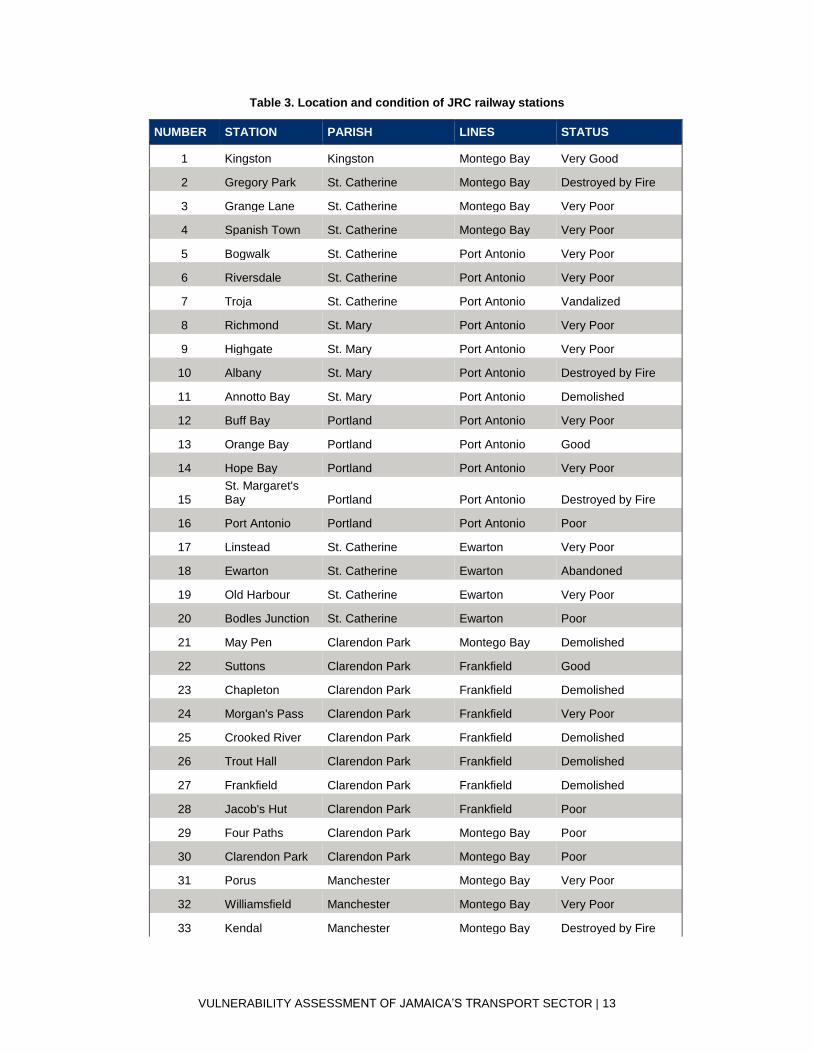
RAILWAYS
The majority of Jamaica’s railways were constructed prior to the 1950s, initially to promote
passenger travel on the island and later to support a growing bauxite mining industry. Many of
these railroads were closed during the 1970s due to concerns about operational deficits. Today,
only a single line offers mine-to-port connectivity. The condition of existing stations is primarily
categorized by the Jamaica Railway Corporation (JRC) as very poor or deplorable (Table 3).
Significant investments would be required to revitalize them.
VULNERABILITY ASSESSMENT OF JAMAICA’S TRANSPORT SECTOR | 13
Table 3. Location and condition of JRC railway stations
NUMBER STATION PARISH LINES STATUS
1 Kingston Kingston Montego Bay Very Good
2 Gregory Park St. Catherine Montego Bay Destroyed by Fire
3 Grange Lane St. Catherine Montego Bay Very Poor
4 Spanish Town St. Catherine Montego Bay Very Poor
5 Bogwalk St. Catherine Port Antonio Very Poor
6 Riversdale St. Catherine Port Antonio Very Poor
7 Troja St. Catherine Port Antonio Vandalized
8 Richmond St. Mary Port Antonio Very Poor
9 Highgate St. Mary Port Antonio Very Poor
10 Albany St. Mary Port Antonio Destroyed by Fire
11 Annotto Bay St. Mary Port Antonio Demolished
12 Buff Bay Portland Port Antonio Very Poor
13 Orange Bay Portland Port Antonio Good
14 Hope Bay Portland Port Antonio Very Poor
15 St. Margaret's Bay Portland Port Antonio Destroyed by Fire
16 Port Antonio Portland Port Antonio Poor
17 Linstead St. Catherine Ewarton Very Poor
18 Ewarton St. Catherine Ewarton Abandoned
19 Old Harbour St. Catherine Ewarton Very Poor
20 Bodles Junction St. Catherine Ewarton Poor
21 May Pen Clarendon Park Montego Bay Demolished
22 Suttons Clarendon Park Frankfield Good
23 Chapleton Clarendon Park Frankfield Demolished
24 Morgan's Pass Clarendon Park Frankfield Very Poor
25 Crooked River Clarendon Park Frankfield Demolished
26 Trout Hall Clarendon Park Frankfield Demolished
27 Frankfield Clarendon Park Frankfield Demolished
28 Jacob's Hut Clarendon Park Frankfield Poor
29 Four Paths Clarendon Park Montego Bay Poor
30 Clarendon Park Clarendon Park Montego Bay Poor
31 Porus Manchester Montego Bay Very Poor
32 Williamsfield Manchester Montego Bay Very Poor
33 Kendal Manchester Montego Bay Destroyed by Fire
VULNERABILITY ASSESSMENT OF JAMAICA’S TRANSPORT SECTOR | 14
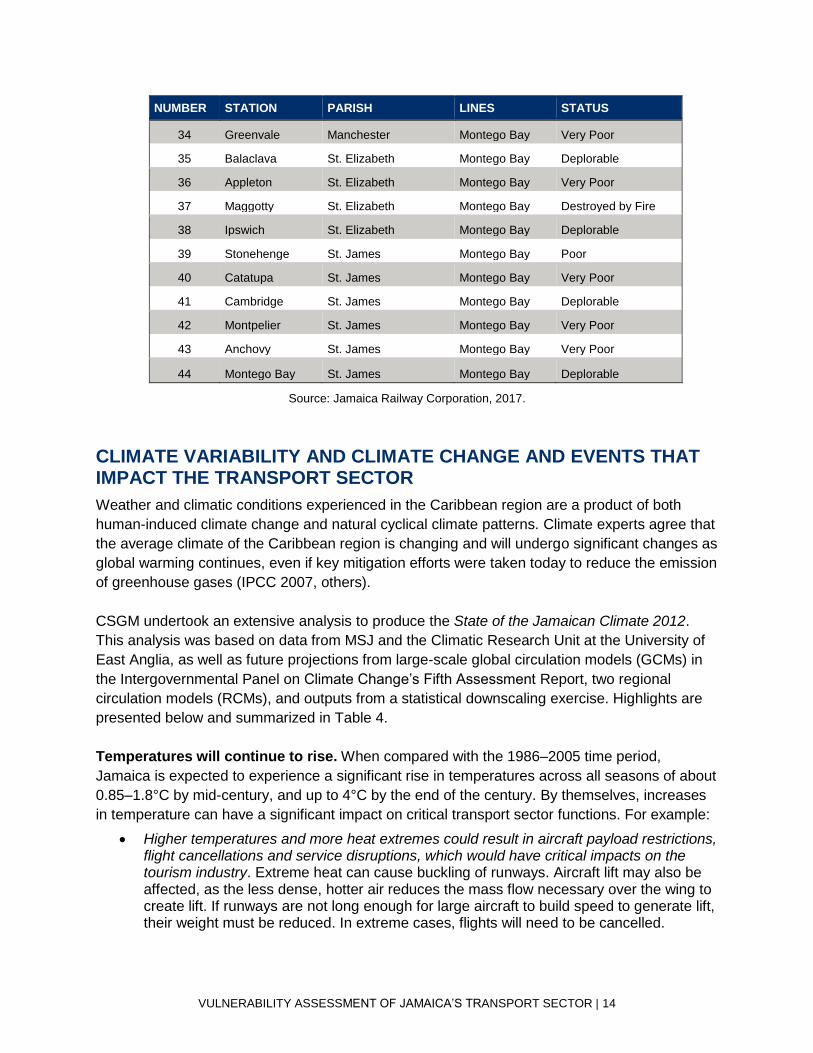
NUMBER STATION PARISH LINES STATUS
34 Greenvale Manchester Montego Bay Very Poor
35 Balaclava St. Elizabeth Montego Bay Deplorable
36 Appleton St. Elizabeth Montego Bay Very Poor
37 Maggotty St. Elizabeth Montego Bay Destroyed by Fire
38 Ipswich St. Elizabeth Montego Bay Deplorable
39 Stonehenge St. James Montego Bay Poor
40 Catatupa St. James Montego Bay Very Poor
41 Cambridge St. James Montego Bay Deplorable
42 Montpelier St. James Montego Bay Very Poor
43 Anchovy St. James Montego Bay Very Poor
44 Montego Bay St. James Montego Bay Deplorable
Source: Jamaica Railway Corporation, 2017.
CLIMATE VARIABILITY AND CLIMATE CHANGE AND EVENTS THAT IMPACT THE TRANSPORT SECTOR
Weather and climatic conditions experienced in the Caribbean region are a product of both
human-induced climate change and natural cyclical climate patterns. Climate experts agree that
the average climate of the Caribbean region is changing and will undergo significant changes as
global warming continues, even if key mitigation efforts were taken today to reduce the emission
of greenhouse gases (IPCC 2007, others).
CSGM undertook an extensive analysis to produce the State of the Jamaican Climate 2012.
This analysis was based on data from MSJ and the Climatic Research Unit at the University of
East Anglia, as well as future projections from large-scale global circulation models (GCMs) in
the Intergovernmental Panel on Climate Change’s Fifth Assessment Report, two regional
circulation models (RCMs), and outputs from a statistical downscaling exercise. Highlights are
presented below and summarized in Table 4.
Temperatures will continue to rise. When compared with the 1986–2005 time period,
Jamaica is expected to experience a significant rise in temperatures across all seasons of about
0.85–1.8°C by mid-century, and up to 4°C by the end of the century. By themselves, increases
in temperature can have a significant impact on critical transport sector functions. For example:
• Higher temperatures and more heat extremes could result in aircraft payload restrictions, flight cancellations and service disruptions, which would have critical impacts on the tourism industry. Extreme heat can cause buckling of runways. Aircraft lift may also be affected, as the less dense, hotter air reduces the mass flow necessary over the wing to create lift. If runways are not long enough for large aircraft to build speed to generate lift, their weight must be reduced. In extreme cases, flights will need to be cancelled.

VULNERABILITY ASSESSMENT OF JAMAICA’S TRANSPORT SECTOR | 15
• Higher temperature could lead to more frequent buckling of pavements and misalignment of rail lines. Concrete and reinforcement structures of rail lines expand and contract due to moisture absorption, which could, in cases of extreme heat, lead to buckling.
• Higher temperatures and increased heat extremes can increase not only the discomfort for those using public transportation but also the risk from heat exposure, especially for children and the elderly.
• Higher temperatures can increase the need for and costs of maintaining adequate cooling in public transportation vehicles.
Extreme weather events could increase. Extreme events have had a significant impact on
Jamaica’s economy, environment and people. Five major storm events between 2004 and 2008
reportedly caused USD1.2 billion in losses and damage (Neufville/ IPS 2012). More intense
tropical storms are a likely result of climate variability and change. With respect to the transport
sector, four extremes are relevant: hurricanes, precipitation, wind and storm surges.
• Stronger storms generally extend the periods of intense precipitation and strong winds, and cause tidal surges that can devastate the transport sector. Jamaica lies in the path of Atlantic hurricanes and spends upwards of JMD72 billion or approximately 3 percent of its GDP dealing with the impacts (Burgess 2015).
• Excessive rainfall and flooding can damage road infrastructure. Because many coastal
roadways serve as evacuation routes during hurricanes, their vulnerability may increase
coastal areas’ overall vulnerability to climate risks.
• Heavy rains increase the risk of exposure to the elements and challenge those most in
need of public transportation, including children and the elderly.
Sea levels will continue to rise. Port infrastructure, including facilities such as the Montego
Bay and Ocho Rios cruise terminals, as well as Port Antonio are important transport assets with
long design lives. They are sensitive to sea level rise, with decking and wharves more frequently
exposed to larger wave forces, resulting in increased scour of foundations of marine structures.
They are also vulnerable to increased risk of overtopping during storm surges. Many airports
are located near the coast and vulnerable to rising seas, including Norman Manley International
Airport, which sits at an average elevation of 3 m above sea level and is also vulnerable to
flooding. Projections suggest a minimum of 2–3 mm rise in sea levels per year during the first
half of the century. At a minimum, these impacts are likely to result in more weather delays and
periodic interruptions.

VULNERABILITY ASSESSMENT OF JAMAICA’S TRANSPORT SECTOR | 16
Table 4. Changing and future climate projections for Jamaica
TEMPERATURES
Historical Projected
• Rising maximum, minimum and mean temperatures
• Minimum temperatures increasing faster (~0.27 °C/decade) than maximum temperatures (~0.06 °C/decade)
• Mean temperatures increasing at a rate of 0.16 °C/decade
• Minimum, maximum and mean temperatures increase
• Projected mean temperature increases include:
o 0.49–0.57°C by the 2020s
o 0.65–0.84°C by the 2030s
o 0.85–1.80°C by the 2050s and
o 0.82–3.09°C for 2081–2100 relative to 1986–2005
• RCMs suggest higher magnitude increases for specific downscaled grid boxes: up to 4°C by end of century
• Coastal regions show slightly smaller increases than interior regions
• Mean daily maximum temperature each month at the Norman Manley International Airport station is expected to increase by 0.8–1.3°C across all Representative Concentration Pathways (RCPs) by early (mid-) century
• Annual frequency of warm days in any given month at Norman Manley International station may increase by 2–12 days across all RCPs by early (mid-) century
RAINFALL
Historical Projected
• Significant year-to-year variability due to the influence of phenomena such as the El Niño Southern Oscillation (ENSO)
• Insignificant upward trend
• Strong decadal signal with wet anomalies in the 1960s, early 1980s, late 1990s and mid- to late 2000s, and dry anomalies in the late 1970s, mid- and late 1980s and post-2010
• Intensity and occurrence of extreme rainfall events increasing from 1940-2010
• Mid-2020s will see 0–2% less rainfall in the annual mean. The 2030s will be up to 4% drier, the 2050s up to 10% drier, while by the end of the century the country as a whole may be up to 21% drier for the most severe RCP scenario (RCP8.5)
• Change in summer rainfall is the primary driver of the drying trend
• Dry season rainfall generally shows small increases or no change
• Spatial variation across the country and even within blocks, with the south and east showing greater decreases than the north and west
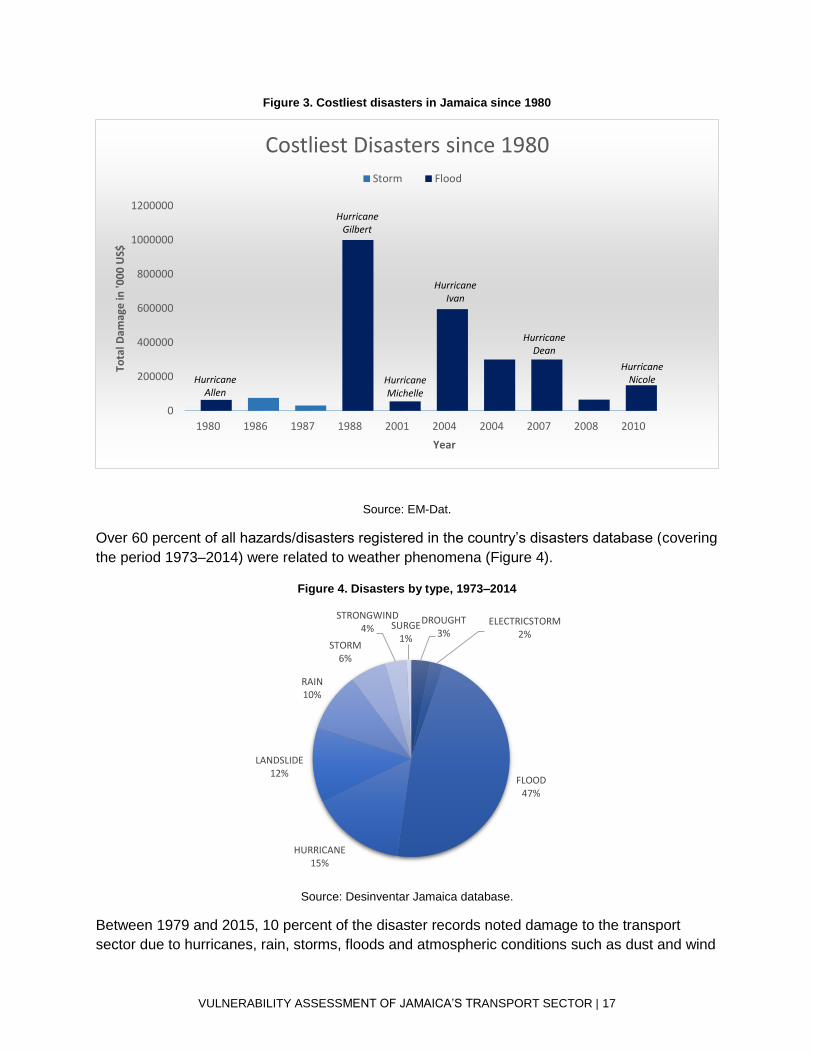
HISTORICAL OCCURRENCE OF DAMAGE TO THE TRANSPORT SECTOR
Historically, climate events in Jamaica have caused considerable damage to transport
infrastructure. The costliest disasters in the country were due to floods and storms (Figure 3).
For example, in 2004, Hurricane Ivan’s storm surge caused heavy damage to the highway
connecting Kingston and Norman Manley International, while related flooding and landslides cut
off entire sections of other roads, blocked and destroyed drains and culverts, and damaged
retaining walls and bridge approaches. Overflowing rivers and streams caused collapse on
many road sections. Prior to the arrival of Hurricane Dennis in 2005, the island had received
above normal rainfall, resulting in a high level of soil saturation. This exacerbated the impact of
the hurricane and associated flooding, landslides and debris flows. The estimated cost to repair
the road network was USD51.6 million and airport repairs reached USD60 million.
VULNERABILITY ASSESSMENT OF JAMAICA’S TRANSPORT SECTOR | 17
Figure 3. Costliest disasters in Jamaica since 1980
Source: EM-Dat.
Over 60 percent of all hazards/disasters registered in the country’s disasters database (covering
the period 1973–2014) were related to weather phenomena (Figure 4).
Figure 4. Disasters by type, 1973–2014
Source: Desinventar Jamaica database.
Between 1979 and 2015, 10 percent of the disaster records noted damage to the transport
sector due to hurricanes, rain, storms, floods and atmospheric conditions such as dust and wind
DROUGHT3%
ELECTRICSTORM2%
FLOOD47%
HURRICANE15%
LANDSLIDE12%
RAIN10%
STORM6%
STRONGWIND4% SURGE
1%
0
200000
400000
600000
800000
1000000
1200000
1980 1986 1987 1988 2001 2004 2004 2007 2008 2010
Tota
l Dam
age
in '0
00
US$
Year
Costliest Disasters since 1980Storm Flood
Hurricane Allen
Hurricane Gilbert
Hurricane Michelle
Hurricane Ivan
Hurricane Dean
Hurricane Nicole
VULNERABILITY ASSESSMENT OF JAMAICA’S TRANSPORT SECTOR | 18
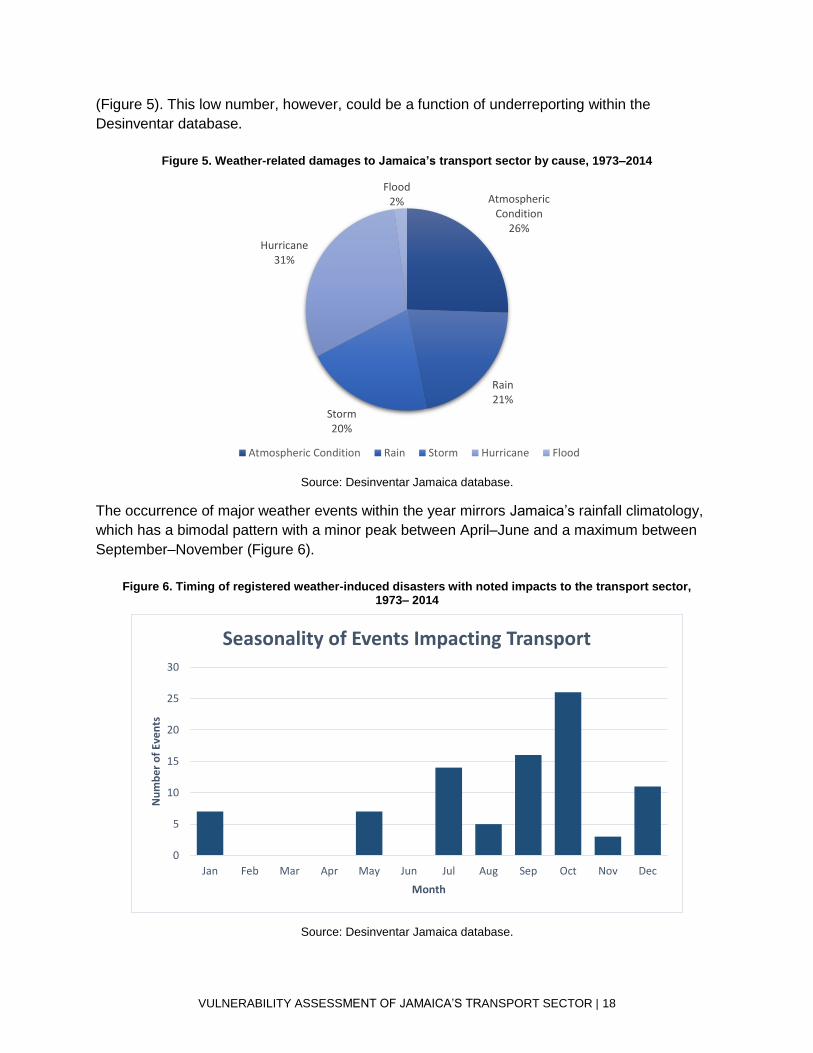
(Figure 5). This low number, however, could be a function of underreporting within the
Desinventar database.
Figure 5. Weather-related damages to Jamaica’s transport sector by cause, 1973–2014
Source: Desinventar Jamaica database.
The occurrence of major weather events within the year mirrors Jamaica’s rainfall climatology,
which has a bimodal pattern with a minor peak between April–June and a maximum between
September–November (Figure 6).
Figure 6. Timing of registered weather-induced disasters with noted impacts to the transport sector,
1973– 2014
Source: Desinventar Jamaica database.
Atmospheric Condition
26%
Rain21%
Storm20%
Hurricane31%
Flood2%
Atmospheric Condition Rain Storm Hurricane Flood
0
5
10
15
20
25
30
Jan Feb Mar Apr May Jun Jul Aug Sep Oct Nov Dec
Nu
mb
er
of
Eve
nts
Month
Seasonality of Events Impacting Transport
VULNERABILITY ASSESSMENT OF JAMAICA’S TRANSPORT SECTOR | 19
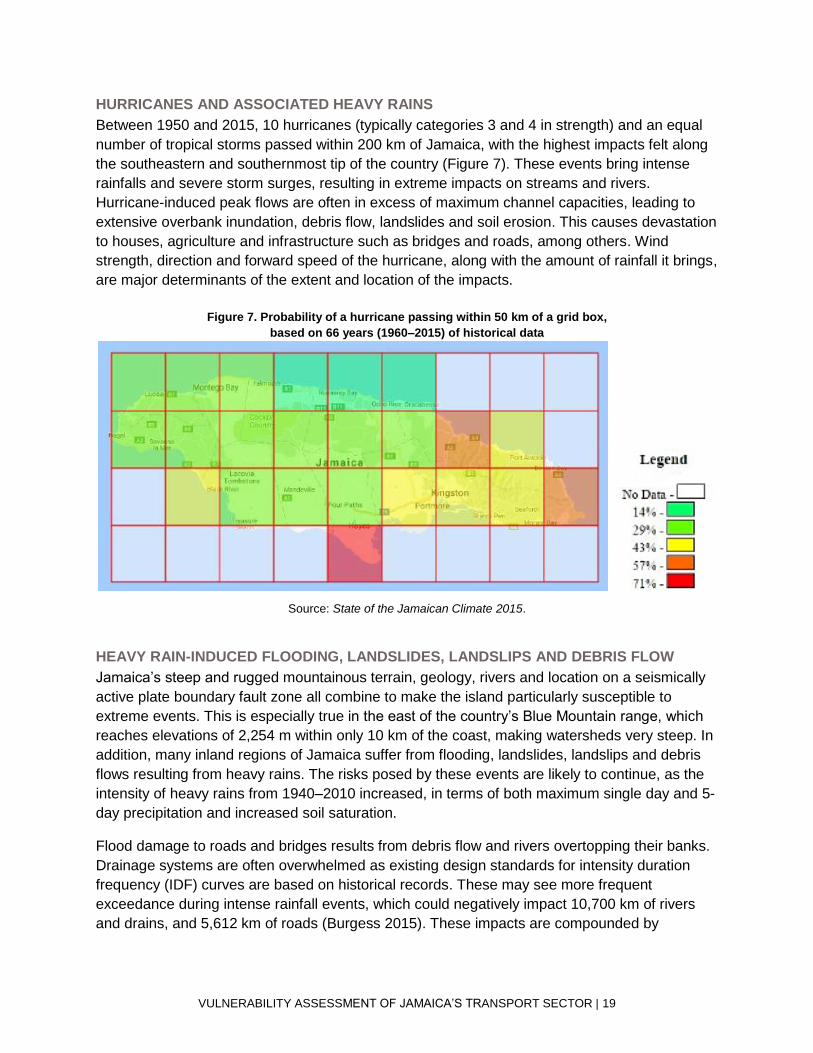
HURRICANES AND ASSOCIATED HEAVY RAINS
Between 1950 and 2015, 10 hurricanes (typically categories 3 and 4 in strength) and an equal
number of tropical storms passed within 200 km of Jamaica, with the highest impacts felt along
the southeastern and southernmost tip of the country (Figure 7). These events bring intense
rainfalls and severe storm surges, resulting in extreme impacts on streams and rivers.
Hurricane-induced peak flows are often in excess of maximum channel capacities, leading to
extensive overbank inundation, debris flow, landslides and soil erosion. This causes devastation
to houses, agriculture and infrastructure such as bridges and roads, among others. Wind
strength, direction and forward speed of the hurricane, along with the amount of rainfall it brings,
are major determinants of the extent and location of the impacts.
Figure 7. Probability of a hurricane passing within 50 km of a grid box,
based on 66 years (1960–2015) of historical data
Source: State of the Jamaican Climate 2015.
HEAVY RAIN-INDUCED FLOODING, LANDSLIDES, LANDSLIPS AND DEBRIS FLOW
Jamaica’s steep and rugged mountainous terrain, geology, rivers and location on a seismically
active plate boundary fault zone all combine to make the island particularly susceptible to
extreme events. This is especially true in the east of the country’s Blue Mountain range, which
reaches elevations of 2,254 m within only 10 km of the coast, making watersheds very steep. In
addition, many inland regions of Jamaica suffer from flooding, landslides, landslips and debris
flows resulting from heavy rains. The risks posed by these events are likely to continue, as the
intensity of heavy rains from 1940–2010 increased, in terms of both maximum single day and 5-
day precipitation and increased soil saturation.
Flood damage to roads and bridges results from debris flow and rivers overtopping their banks.
Drainage systems are often overwhelmed as existing design standards for intensity duration
frequency (IDF) curves are based on historical records. These may see more frequent
exceedance during intense rainfall events, which could negatively impact 10,700 km of rivers
and drains, and 5,612 km of roads (Burgess 2015). These impacts are compounded by
VULNERABILITY ASSESSMENT OF JAMAICA’S TRANSPORT SECTOR | 20
underlying vulnerabilities including poor planning mechanisms, uncontrolled population growth
and limited financial resources for maintenance and repairs.
SEA LEVEL RISE AND COASTAL STORM SURGE
Global sea levels have risen between 0.05–0.17 m, mirroring levels in the Caribbean. Key
findings of the State of the Jamaican Climate 2012 with respect to sea level rise are
summarized below:
• Satellite measurements show a rate of sea level rise of about 3 mm/year since the early 1990s (Bindoff et al. 2007), with the potential to affect an estimated 102 km2 of some of the most densely populated coastal areas of the country.
• By the end of the century, sea level is expected to rise by 0.21–0.48 m under an A1B scenario using 2007 Intergovernmental Panel on Climate Change (IPCC) projections, but the models exclude future rapid dynamical changes in ice flow. A recent study of ice flow suggests that the rate of rise may actually double or be even greater than that (Hay et al. 2015). Evaporation is also projected to increase by approximately 0.3 mm/day over the sea. The changes over land may be less.
• According to the UWI Mona, a 1–2 m rise in sea levels would “devastate low-lying coastal areas and key installations, including major power generation facilities, the oil refinery, airports and seaports. It would also have a serious impact on the natural protection of the Kingston harbour” (CSGM 2012).
• For the tourism sector, which contributed 27.2 percent of GDP in 2014, sea level rise poses a significant threat even under the smallest sea level rise scenarios (0.5 m), which suggest, for example, that 35–68 percent of the highly valued beach resources in Portland Parish could be lost (Simpson et al. 2008).
VULNERABILITY ASSESSMENT OF JAMAICA’S TRANSPORT SECTOR | 21
INSTITUTIONAL ANALYSIS
Despite Jamaica’s rank as 162nd in the world in
size, its transport system is uncharacteristically
complex, with one of the densest road networks
in the world, three international airports and three
domestic aerodromes, a railway network, and 14
major seaports (Vision 2030). The Government
of Jamaica (GOJ) acknowledges that developing
and maintaining a strong transportation system is
crucial to economic development. In the Vision
2030 Jamaica – National Development Plan, the
national outcome “Strong Economic Infrastructure” includes five (of seven) national strategies
focused on transportation.
The transport sector is also highly vulnerable to natural disasters and the effects of climate
change, as discussed in the previous section. In 2011, the Planning Institute of Jamaica (PIOJ)
conducted an overall damage and loss assessment of nine major weather-related natural
disasters over the past decade. From that assessment, PIOJ estimated that the total cost of
these nine events was JMD111.4 billion (USD869 million); the transport sector accounted for 40
percent of the overall cost, with losses of JMD44.4 billion (USD346.5 million) (PIOJ 2011).
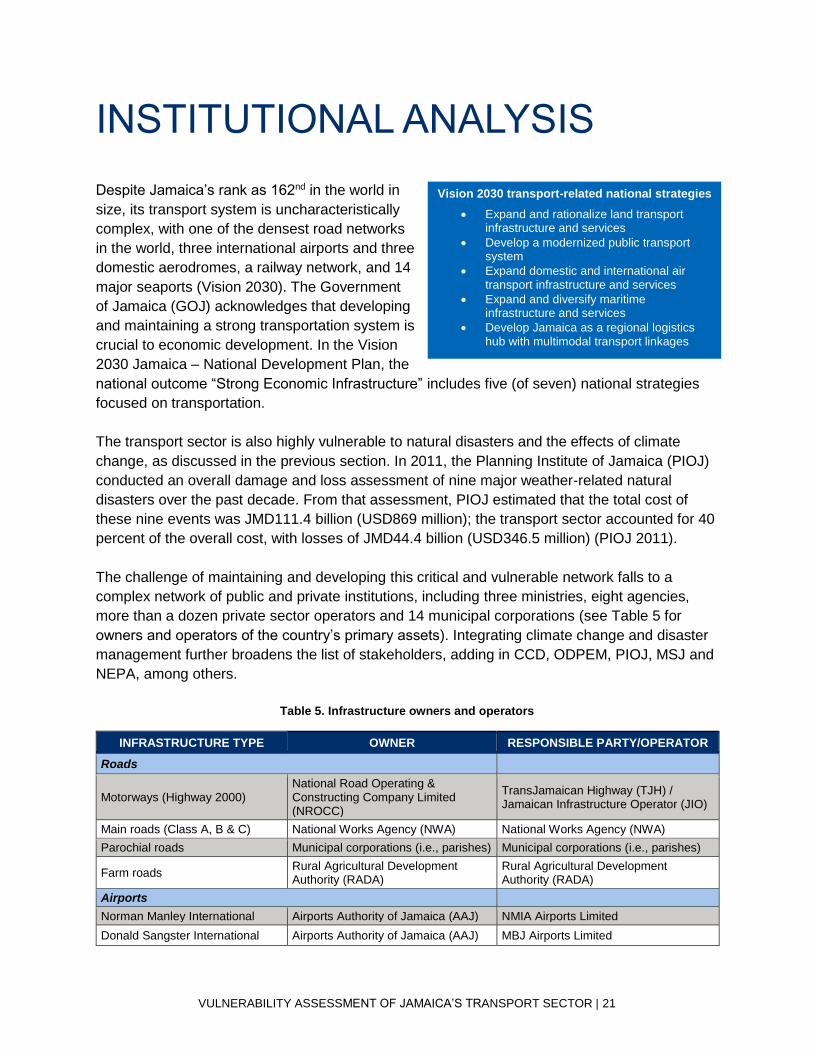
The challenge of maintaining and developing this critical and vulnerable network falls to a
complex network of public and private institutions, including three ministries, eight agencies,
more than a dozen private sector operators and 14 municipal corporations (see Table 5 for
owners and operators of the country’s primary assets). Integrating climate change and disaster
management further broadens the list of stakeholders, adding in CCD, ODPEM, PIOJ, MSJ and
NEPA, among others.
Table 5. Infrastructure owners and operators
INFRASTRUCTURE TYPE OWNER RESPONSIBLE PARTY/OPERATOR
Roads
Motorways (Highway 2000) National Road Operating & Constructing Company Limited (NROCC)
TransJamaican Highway (TJH) / Jamaican Infrastructure Operator (JIO)
Main roads (Class A, B & C) National Works Agency (NWA) National Works Agency (NWA)
Parochial roads Municipal corporations (i.e., parishes) Municipal corporations (i.e., parishes)
Farm roads Rural Agricultural Development Authority (RADA)
Rural Agricultural Development Authority (RADA)
Airports
Norman Manley International Airports Authority of Jamaica (AAJ) NMIA Airports Limited
Donald Sangster International Airports Authority of Jamaica (AAJ) MBJ Airports Limited
Vision 2030 transport-related national strategies
• Expand and rationalize land transport infrastructure and services
• Develop a modernized public transport system
• Expand domestic and international air transport infrastructure and services
• Expand and diversify maritime infrastructure and services
• Develop Jamaica as a regional logistics hub with multimodal transport linkages

VULNERABILITY ASSESSMENT OF JAMAICA’S TRANSPORT SECTOR | 22
INFRASTRUCTURE TYPE OWNER RESPONSIBLE PARTY/OPERATOR
Ian Fleming International Airports Authority of Jamaica (AAJ) Airports Authority of Jamaica (AAJ)
Domestic airports (Tinson Pen Aerodrome, Negril Aerodrome, Ken Jones Aerodrome)
Airports Authority of Jamaica (AAJ) Airports Authority of Jamaica (AAJ)
Major Seaports
Kingston Container Terminal (KCT)
Port Authority of Jamaica (PAJ)/GOJ Kingston Freeport Terminal Limited (KFTL)
Port of Montego Bay Port Authority of Jamaica (PAJ)/GOJ Port Handlers Limited
Ocho Rios Cruise Port Port Authority of Jamaica (PAJ)/GOJ Lannaman & Morris Shipping
Falmouth Port Port Authority of Jamaica (PAJ)/Royal Caribbean Cruises International
Royal Caribbean Cruises International
Reynolds Bauxite Pier Jamaica Bauxite Mining Limited Jamaica Bauxite Mining Limited
Railway
Railway network Jamaica Railway Corporation (JRC) Jamaica Railway Corporation (JRC)
Mining rail system Jamaica Railway Corporation (JRC) WINDALCO
The section below provides an overview of institutions that govern the transport sector; a
situational analysis of the 2007 National Transport Policy and the Vision 2030 Transport Sector
Plan; and an evaluation of the readiness of the transport sector to climate-proof infrastructure
investments.
EXISTING INSTITUTIONS IN THE TRANSPORT SECTOR
The transport sector is governed and influenced by a complex network of ministries, agencies,
private sector actors and local municipal corporations. Overall, three ministries lead policy and
oversee implementation: The MTM, the Ministry of Economic Growth and Job Creation
(MEGJC), and the MLGCD. Three key agencies under those ministries lead implementation and
provide regulatory oversight (NWA, PAJ and Airports Authority of Jamaica/AAJ) along with 14
municipal corporations. Table 6 summarizes the major institutions involved in the transport
sector, along with their primarily role.
Table 6. Institutions involved in Jamaica’s transport sector
NAME ROLE
National Government – Ministries
Ministry of Transport and Mining (MTM)
MTM is primarily concerned with transport policy and has regulatory responsibility for the safety of all modes of transportation, whether publicly or privately operated. This includes airports, aerodromes, airline operators, seaports, shipping traffic and public land transportation as well as road infrastructure and road safety. With the move of NWA and PAJ under the MEGJC, the ministry is now less focused on infrastructure development and maintenance.
Ministry of Economic Growth and Job Creation (MEGJC)
Created in 2016, MEGJC has broad authority over any government function related to economic growth. On transport, it oversees the main road network and port development and regulation, as well as related areas such as land development and utilization, land policy and administration, land titling, civil works, environmental regulation, and town and country planning.
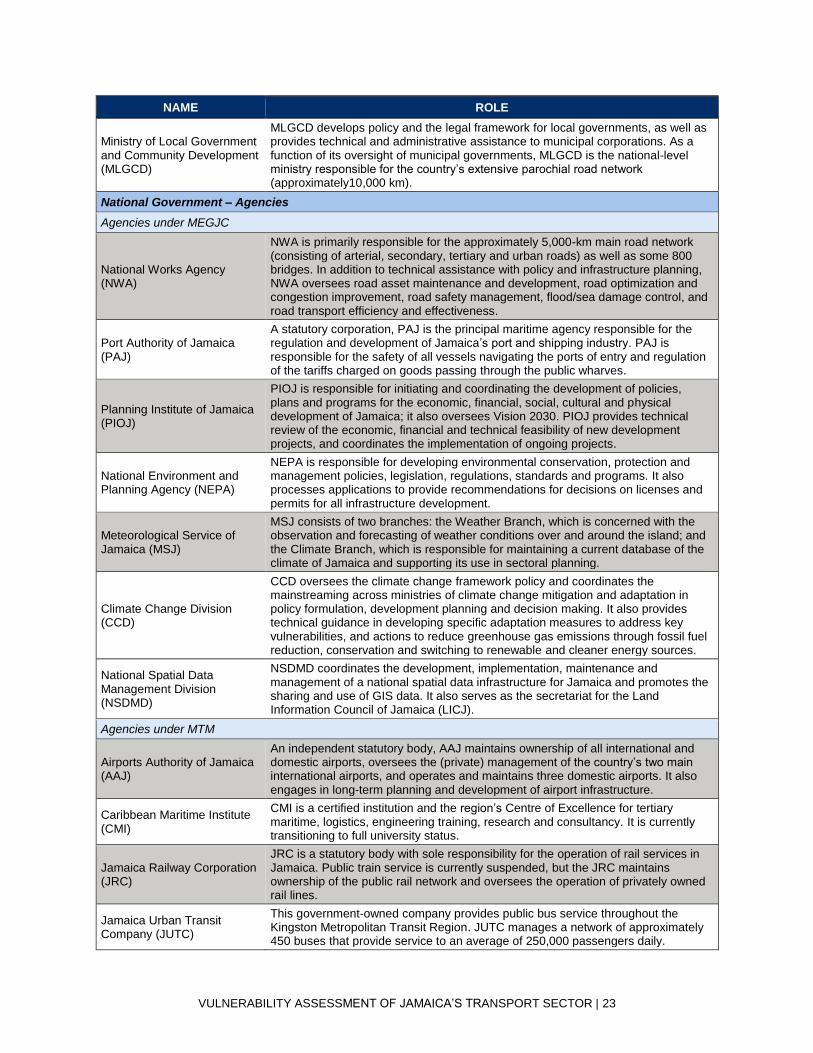
VULNERABILITY ASSESSMENT OF JAMAICA’S TRANSPORT SECTOR | 23
NAME ROLE
Ministry of Local Government and Community Development (MLGCD)
MLGCD develops policy and the legal framework for local governments, as well as provides technical and administrative assistance to municipal corporations. As a function of its oversight of municipal governments, MLGCD is the national-level ministry responsible for the country’s extensive parochial road network (approximately10,000 km).
National Government – Agencies
Agencies under MEGJC
National Works Agency (NWA)
NWA is primarily responsible for the approximately 5,000-km main road network (consisting of arterial, secondary, tertiary and urban roads) as well as some 800 bridges. In addition to technical assistance with policy and infrastructure planning, NWA oversees road asset maintenance and development, road optimization and congestion improvement, road safety management, flood/sea damage control, and road transport efficiency and effectiveness.
Port Authority of Jamaica (PAJ)
A statutory corporation, PAJ is the principal maritime agency responsible for the regulation and development of Jamaica’s port and shipping industry. PAJ is responsible for the safety of all vessels navigating the ports of entry and regulation of the tariffs charged on goods passing through the public wharves.
Planning Institute of Jamaica (PIOJ)
PIOJ is responsible for initiating and coordinating the development of policies, plans and programs for the economic, financial, social, cultural and physical development of Jamaica; it also oversees Vision 2030. PIOJ provides technical review of the economic, financial and technical feasibility of new development projects, and coordinates the implementation of ongoing projects.
National Environment and Planning Agency (NEPA)
NEPA is responsible for developing environmental conservation, protection and management policies, legislation, regulations, standards and programs. It also processes applications to provide recommendations for decisions on licenses and permits for all infrastructure development.
Meteorological Service of Jamaica (MSJ)
MSJ consists of two branches: the Weather Branch, which is concerned with the observation and forecasting of weather conditions over and around the island; and the Climate Branch, which is responsible for maintaining a current database of the climate of Jamaica and supporting its use in sectoral planning.
Climate Change Division (CCD)
CCD oversees the climate change framework policy and coordinates the mainstreaming across ministries of climate change mitigation and adaptation in policy formulation, development planning and decision making. It also provides technical guidance in developing specific adaptation measures to address key vulnerabilities, and actions to reduce greenhouse gas emissions through fossil fuel reduction, conservation and switching to renewable and cleaner energy sources.
National Spatial Data Management Division (NSDMD)
NSDMD coordinates the development, implementation, maintenance and management of a national spatial data infrastructure for Jamaica and promotes the sharing and use of GIS data. It also serves as the secretariat for the Land Information Council of Jamaica (LICJ).
Agencies under MTM
Airports Authority of Jamaica (AAJ)
An independent statutory body, AAJ maintains ownership of all international and domestic airports, oversees the (private) management of the country’s two main international airports, and operates and maintains three domestic airports. It also engages in long-term planning and development of airport infrastructure.
Caribbean Maritime Institute (CMI)
CMI is a certified institution and the region’s Centre of Excellence for tertiary maritime, logistics, engineering training, research and consultancy. It is currently transitioning to full university status.
Jamaica Railway Corporation (JRC)
JRC is a statutory body with sole responsibility for the operation of rail services in Jamaica. Public train service is currently suspended, but the JRC maintains ownership of the public rail network and oversees the operation of privately owned rail lines.
Jamaica Urban Transit Company (JUTC)
This government-owned company provides public bus service throughout the Kingston Metropolitan Transit Region. JUTC manages a network of approximately 450 buses that provide service to an average of 250,000 passengers daily.
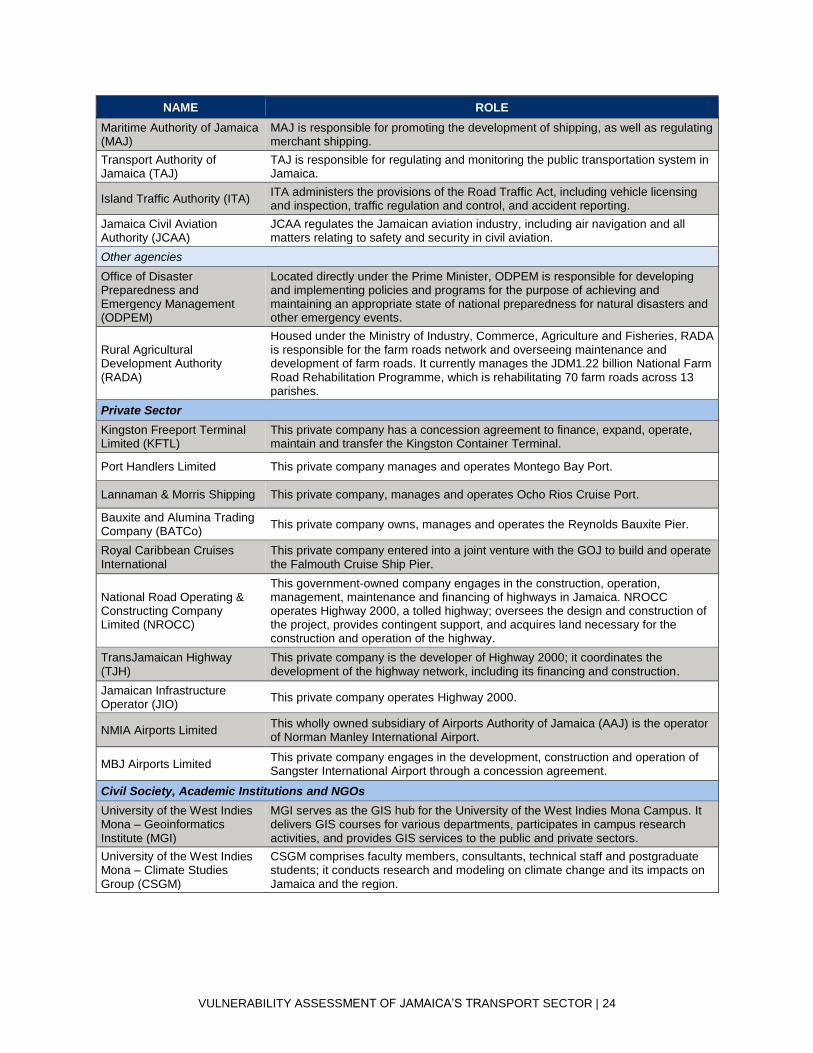
VULNERABILITY ASSESSMENT OF JAMAICA’S TRANSPORT SECTOR | 24
NAME ROLE
Maritime Authority of Jamaica (MAJ)
MAJ is responsible for promoting the development of shipping, as well as regulating merchant shipping.
Transport Authority of Jamaica (TAJ)
TAJ is responsible for regulating and monitoring the public transportation system in Jamaica.
Island Traffic Authority (ITA) ITA administers the provisions of the Road Traffic Act, including vehicle licensing and inspection, traffic regulation and control, and accident reporting.
Jamaica Civil Aviation Authority (JCAA)
JCAA regulates the Jamaican aviation industry, including air navigation and all matters relating to safety and security in civil aviation.
Other agencies
Office of Disaster Preparedness and Emergency Management (ODPEM)
Located directly under the Prime Minister, ODPEM is responsible for developing and implementing policies and programs for the purpose of achieving and maintaining an appropriate state of national preparedness for natural disasters and other emergency events.
Rural Agricultural Development Authority (RADA)
Housed under the Ministry of Industry, Commerce, Agriculture and Fisheries, RADA is responsible for the farm roads network and overseeing maintenance and development of farm roads. It currently manages the JDM1.22 billion National Farm Road Rehabilitation Programme, which is rehabilitating 70 farm roads across 13 parishes.
Private Sector
Kingston Freeport Terminal Limited (KFTL)
This private company has a concession agreement to finance, expand, operate, maintain and transfer the Kingston Container Terminal.
Port Handlers Limited This private company manages and operates Montego Bay Port.
Lannaman & Morris Shipping This private company, manages and operates Ocho Rios Cruise Port.
Bauxite and Alumina Trading Company (BATCo)
This private company owns, manages and operates the Reynolds Bauxite Pier.
Royal Caribbean Cruises International
This private company entered into a joint venture with the GOJ to build and operate the Falmouth Cruise Ship Pier.
National Road Operating & Constructing Company Limited (NROCC)
This government-owned company engages in the construction, operation, management, maintenance and financing of highways in Jamaica. NROCC operates Highway 2000, a tolled highway; oversees the design and construction of the project, provides contingent support, and acquires land necessary for the construction and operation of the highway.
TransJamaican Highway (TJH)
This private company is the developer of Highway 2000; it coordinates the development of the highway network, including its financing and construction.
Jamaican Infrastructure Operator (JIO)
This private company operates Highway 2000.
NMIA Airports Limited This wholly owned subsidiary of Airports Authority of Jamaica (AAJ) is the operator of Norman Manley International Airport.
MBJ Airports Limited This private company engages in the development, construction and operation of Sangster International Airport through a concession agreement.
Civil Society, Academic Institutions and NGOs
University of the West Indies Mona – Geoinformatics Institute (MGI)
MGI serves as the GIS hub for the University of the West Indies Mona Campus. It delivers GIS courses for various departments, participates in campus research activities, and provides GIS services to the public and private sectors.
University of the West Indies Mona – Climate Studies Group (CSGM)
CSGM comprises faculty members, consultants, technical staff and postgraduate students; it conducts research and modeling on climate change and its impacts on Jamaica and the region.
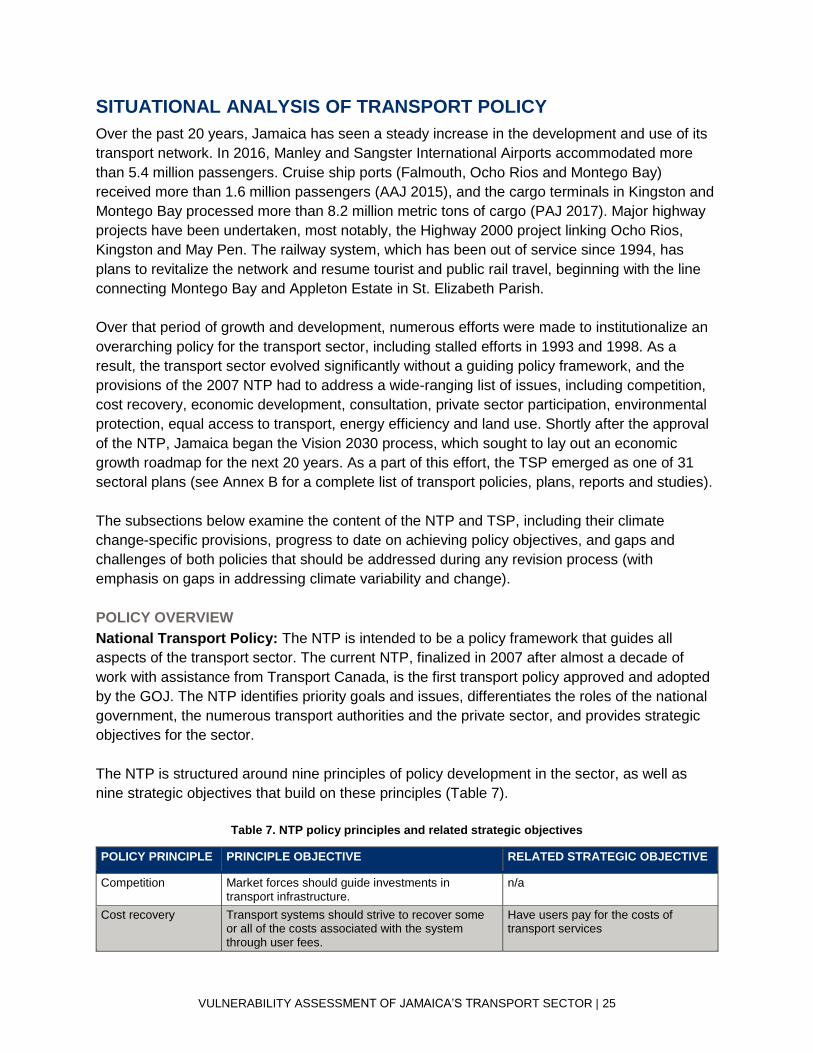
VULNERABILITY ASSESSMENT OF JAMAICA’S TRANSPORT SECTOR | 25
SITUATIONAL ANALYSIS OF TRANSPORT POLICY
Over the past 20 years, Jamaica has seen a steady increase in the development and use of its
transport network. In 2016, Manley and Sangster International Airports accommodated more
than 5.4 million passengers. Cruise ship ports (Falmouth, Ocho Rios and Montego Bay)
received more than 1.6 million passengers (AAJ 2015), and the cargo terminals in Kingston and
Montego Bay processed more than 8.2 million metric tons of cargo (PAJ 2017). Major highway
projects have been undertaken, most notably, the Highway 2000 project linking Ocho Rios,
Kingston and May Pen. The railway system, which has been out of service since 1994, has
plans to revitalize the network and resume tourist and public rail travel, beginning with the line
connecting Montego Bay and Appleton Estate in St. Elizabeth Parish.
Over that period of growth and development, numerous efforts were made to institutionalize an
overarching policy for the transport sector, including stalled efforts in 1993 and 1998. As a
result, the transport sector evolved significantly without a guiding policy framework, and the
provisions of the 2007 NTP had to address a wide-ranging list of issues, including competition,
cost recovery, economic development, consultation, private sector participation, environmental
protection, equal access to transport, energy efficiency and land use. Shortly after the approval
of the NTP, Jamaica began the Vision 2030 process, which sought to lay out an economic
growth roadmap for the next 20 years. As a part of this effort, the TSP emerged as one of 31
sectoral plans (see Annex B for a complete list of transport policies, plans, reports and studies).
The subsections below examine the content of the NTP and TSP, including their climate
change-specific provisions, progress to date on achieving policy objectives, and gaps and
challenges of both policies that should be addressed during any revision process (with
emphasis on gaps in addressing climate variability and change).
POLICY OVERVIEW
National Transport Policy: The NTP is intended to be a policy framework that guides all
aspects of the transport sector. The current NTP, finalized in 2007 after almost a decade of
work with assistance from Transport Canada, is the first transport policy approved and adopted
by the GOJ. The NTP identifies priority goals and issues, differentiates the roles of the national
government, the numerous transport authorities and the private sector, and provides strategic
objectives for the sector.
The NTP is structured around nine principles of policy development in the sector, as well as
nine strategic objectives that build on these principles (Table 7).
Table 7. NTP policy principles and related strategic objectives
POLICY PRINCIPLE PRINCIPLE OBJECTIVE RELATED STRATEGIC OBJECTIVE
Competition Market forces should guide investments in transport infrastructure.
n/a
Cost recovery Transport systems should strive to recover some or all of the costs associated with the system through user fees.
Have users pay for the costs of transport services
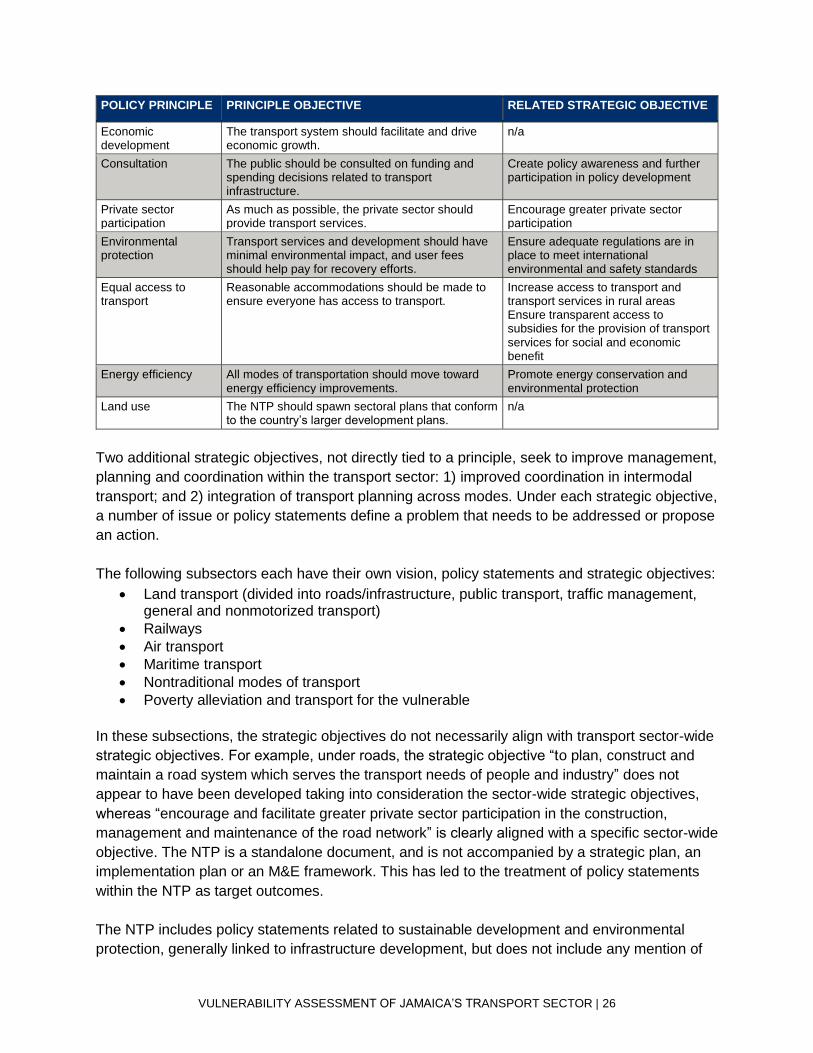
VULNERABILITY ASSESSMENT OF JAMAICA’S TRANSPORT SECTOR | 26
POLICY PRINCIPLE PRINCIPLE OBJECTIVE RELATED STRATEGIC OBJECTIVE
Economic development
The transport system should facilitate and drive economic growth.
n/a
Consultation The public should be consulted on funding and spending decisions related to transport infrastructure.
Create policy awareness and further participation in policy development
Private sector participation
As much as possible, the private sector should provide transport services.
Encourage greater private sector participation
Environmental protection
Transport services and development should have minimal environmental impact, and user fees should help pay for recovery efforts.
Ensure adequate regulations are in place to meet international environmental and safety standards
Equal access to transport
Reasonable accommodations should be made to ensure everyone has access to transport.
Increase access to transport and transport services in rural areas Ensure transparent access to subsidies for the provision of transport services for social and economic benefit
Energy efficiency All modes of transportation should move toward energy efficiency improvements.
Promote energy conservation and environmental protection
Land use The NTP should spawn sectoral plans that conform to the country’s larger development plans.
n/a
Two additional strategic objectives, not directly tied to a principle, seek to improve management,
planning and coordination within the transport sector: 1) improved coordination in intermodal
transport; and 2) integration of transport planning across modes. Under each strategic objective,
a number of issue or policy statements define a problem that needs to be addressed or propose
an action.
The following subsectors each have their own vision, policy statements and strategic objectives:
• Land transport (divided into roads/infrastructure, public transport, traffic management, general and nonmotorized transport)
• Railways
• Air transport
• Maritime transport
• Nontraditional modes of transport
• Poverty alleviation and transport for the vulnerable
In these subsections, the strategic objectives do not necessarily align with transport sector-wide
strategic objectives. For example, under roads, the strategic objective “to plan, construct and
maintain a road system which serves the transport needs of people and industry” does not
appear to have been developed taking into consideration the sector-wide strategic objectives,
whereas “encourage and facilitate greater private sector participation in the construction,
management and maintenance of the road network” is clearly aligned with a specific sector-wide
objective. The NTP is a standalone document, and is not accompanied by a strategic plan, an
implementation plan or an M&E framework. This has led to the treatment of policy statements
within the NTP as target outcomes.
The NTP includes policy statements related to sustainable development and environmental
protection, generally linked to infrastructure development, but does not include any mention of
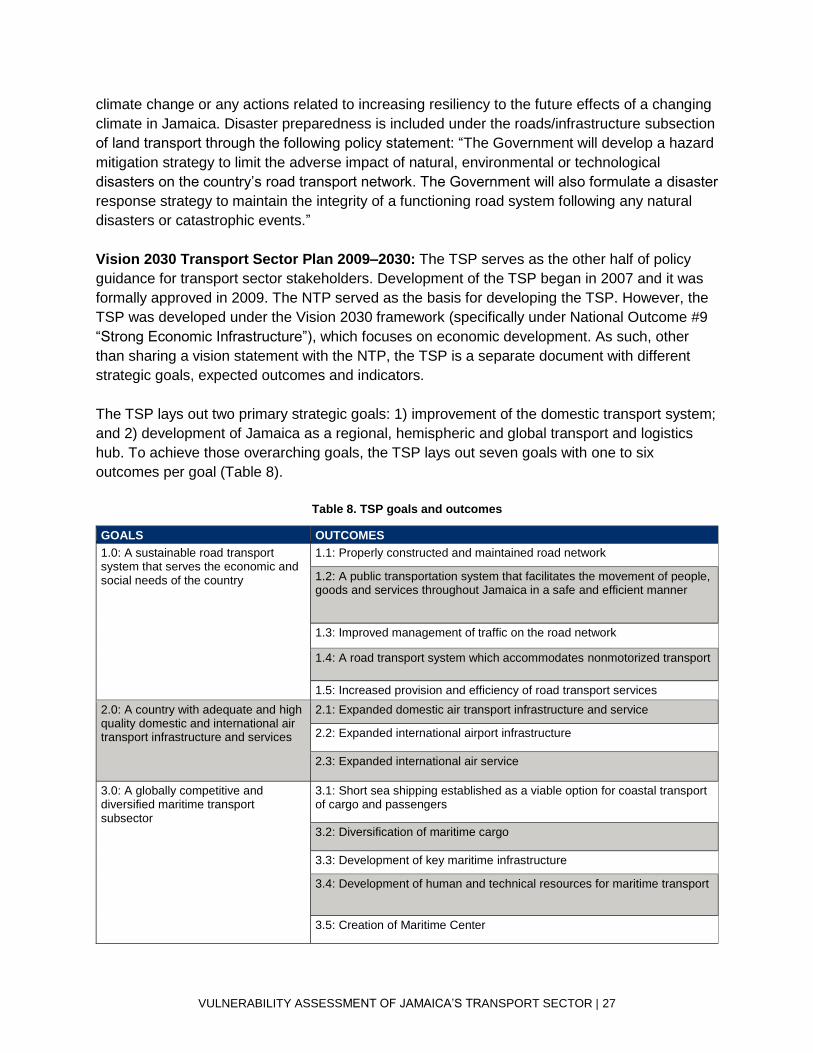
VULNERABILITY ASSESSMENT OF JAMAICA’S TRANSPORT SECTOR | 27
climate change or any actions related to increasing resiliency to the future effects of a changing
climate in Jamaica. Disaster preparedness is included under the roads/infrastructure subsection
of land transport through the following policy statement: “The Government will develop a hazard
mitigation strategy to limit the adverse impact of natural, environmental or technological
disasters on the country’s road transport network. The Government will also formulate a disaster
response strategy to maintain the integrity of a functioning road system following any natural
disasters or catastrophic events.”
Vision 2030 Transport Sector Plan 2009–2030: The TSP serves as the other half of policy
guidance for transport sector stakeholders. Development of the TSP began in 2007 and it was
formally approved in 2009. The NTP served as the basis for developing the TSP. However, the
TSP was developed under the Vision 2030 framework (specifically under National Outcome #9
“Strong Economic Infrastructure”), which focuses on economic development. As such, other
than sharing a vision statement with the NTP, the TSP is a separate document with different
strategic goals, expected outcomes and indicators.
The TSP lays out two primary strategic goals: 1) improvement of the domestic transport system;
and 2) development of Jamaica as a regional, hemispheric and global transport and logistics
hub. To achieve those overarching goals, the TSP lays out seven goals with one to six
outcomes per goal (Table 8).
Table 8. TSP goals and outcomes
GOALS OUTCOMES
1.0: A sustainable road transport system that serves the economic and social needs of the country
1.1: Properly constructed and maintained road network
1.2: A public transportation system that facilitates the movement of people, goods and services throughout Jamaica in a safe and efficient manner
1.3: Improved management of traffic on the road network
1.4: A road transport system which accommodates nonmotorized transport
1.5: Increased provision and efficiency of road transport services
2.0: A country with adequate and high quality domestic and international air transport infrastructure and services
2.1: Expanded domestic air transport infrastructure and service
2.2: Expanded international airport infrastructure
2.3: Expanded international air service
3.0: A globally competitive and diversified maritime transport subsector
3.1: Short sea shipping established as a viable option for coastal transport of cargo and passengers
3.2: Diversification of maritime cargo
3.3: Development of key maritime infrastructure
3.4: Development of human and technical resources for maritime transport
3.5: Creation of Maritime Center

VULNERABILITY ASSESSMENT OF JAMAICA’S TRANSPORT SECTOR | 28
GOALS OUTCOMES
3.6: Growth of shipping fleet
4.0: A viable railway system that supports economic and social development
4.1: Railway system that supports a major logistics hub and movement of passengers and cargo on critical corridors
5.0: Establishment of Jamaica as a major integrated multimodal logistics hub
5.1: Development of efficient and effective institutional framework and supporting services for logistics hub
5.2: Development of efficient and adequate infrastructure for logistics hub
6.0: Comprehensive policy, legislative, regulatory and institutional framework for transport sector
6.1: Development of efficient and effective policy, legislative, regulatory and institutional framework for transport sector
7.0: Environmentally sustainable transport sector
7.1: Environmentally sustainable transport infrastructure and services
7.2: High levels of energy security, conservation and efficiency in the transport sector
Unlike the NTP, the TSP includes an implementation framework that defines which institutions
are accountable for achievement of the goals, as well as requirements for resource allocation.
The TSP also includes an M&E framework that defines indicators and measurable targets for
the plan, assigns data collection responsibilities to specific institutions, and lays out data
sources and reporting requirements. Most importantly, the TSP contains an action plan that
includes 72 strategies consisting of 256 individual actions to achieve the outcomes and,
ultimately, the goals. The action plan assigns a responsible agency (or agencies) to each action,
as well as a timeframe, but does not include any cost estimates or budgetary requirements.
Due in part to the fact that Vision 2030 addresses climate change through National Outcome
#14 – Hazard Risk Reduction and Adaptation to Climate Change, the TSP includes some
acknowledgement of climate change and natural hazards. For example, the Strengths,
Weaknesses, Opportunities, and Threats (SWOT) analysis conducted lists climate change and
natural disasters as an external threat to certain portions of the transport sector. The road
network in particular is mentioned as vulnerable to damage caused by natural hazards,
particularly hurricanes, tropical storms and associated rainfall and flooding, including sediment
floods.
The action plan includes a number of specific actions aimed at addressing climate risk and
natural hazards, including “Incorporate climate change adaptation and mitigation considerations
in the design and construction of transport infrastructure” under strategy 7.1.6, and “Design,
build and retro-fit road infrastructure to meet current and projected hazard events” under
strategy 1.1.5. The action plan also includes a number of more general action items under those
same strategies, such as "Strengthen resilience of transport sector to natural and manmade
hazards.”
PROGRESS TO DATE IN ACHIEVING POLICY OBJECTIVES
National Transport Policy: In 2015, the Ministry of Transport, Works and Housing (MTWH)
(now known as the Ministry of Transport and Mining) conducted a preliminary evaluation of
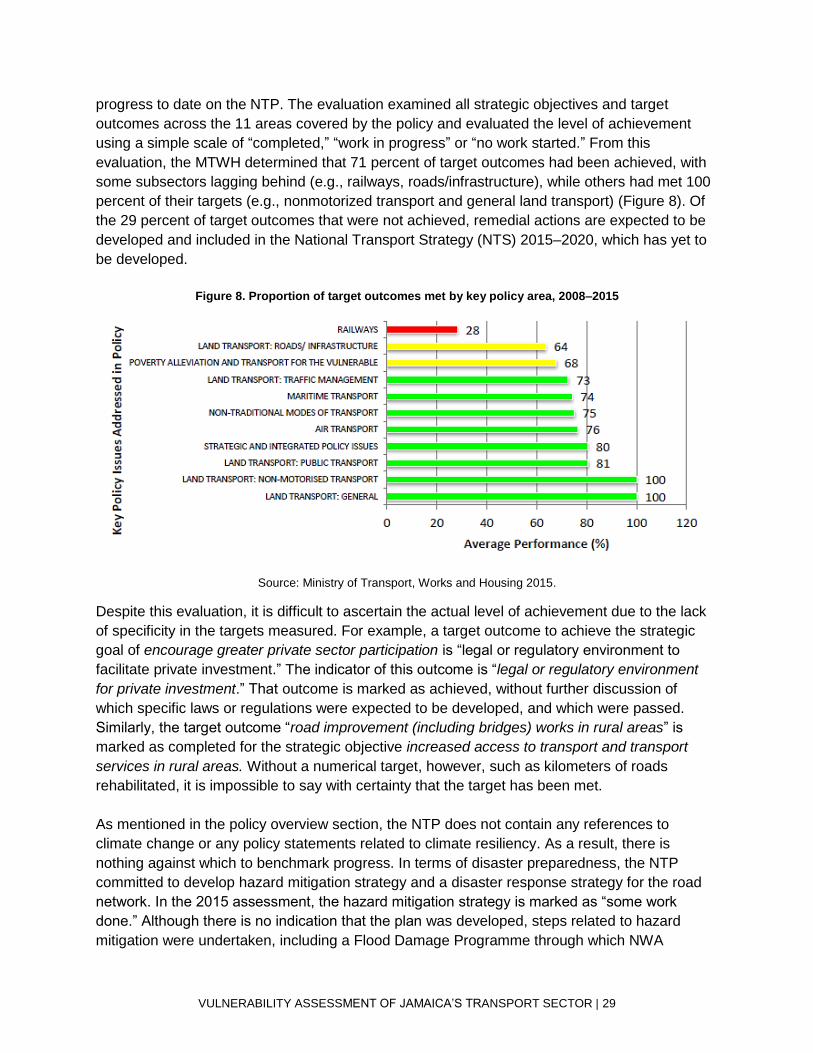
VULNERABILITY ASSESSMENT OF JAMAICA’S TRANSPORT SECTOR | 29
progress to date on the NTP. The evaluation examined all strategic objectives and target
outcomes across the 11 areas covered by the policy and evaluated the level of achievement
using a simple scale of “completed,” “work in progress” or “no work started.” From this
evaluation, the MTWH determined that 71 percent of target outcomes had been achieved, with
some subsectors lagging behind (e.g., railways, roads/infrastructure), while others had met 100
percent of their targets (e.g., nonmotorized transport and general land transport) (Figure 8). Of
the 29 percent of target outcomes that were not achieved, remedial actions are expected to be
developed and included in the National Transport Strategy (NTS) 2015–2020, which has yet to
be developed.
Figure 8. Proportion of target outcomes met by key policy area, 2008–2015
Source: Ministry of Transport, Works and Housing 2015.
Despite this evaluation, it is difficult to ascertain the actual level of achievement due to the lack
of specificity in the targets measured. For example, a target outcome to achieve the strategic
goal of encourage greater private sector participation is “legal or regulatory environment to
facilitate private investment.” The indicator of this outcome is “legal or regulatory environment
for private investment.” That outcome is marked as achieved, without further discussion of
which specific laws or regulations were expected to be developed, and which were passed.
Similarly, the target outcome “road improvement (including bridges) works in rural areas” is
marked as completed for the strategic objective increased access to transport and transport
services in rural areas. Without a numerical target, however, such as kilometers of roads
rehabilitated, it is impossible to say with certainty that the target has been met.
As mentioned in the policy overview section, the NTP does not contain any references to
climate change or any policy statements related to climate resiliency. As a result, there is
nothing against which to benchmark progress. In terms of disaster preparedness, the NTP
committed to develop hazard mitigation strategy and a disaster response strategy for the road
network. In the 2015 assessment, the hazard mitigation strategy is marked as “some work
done.” Although there is no indication that the plan was developed, steps related to hazard
mitigation were undertaken, including a Flood Damage Programme through which NWA
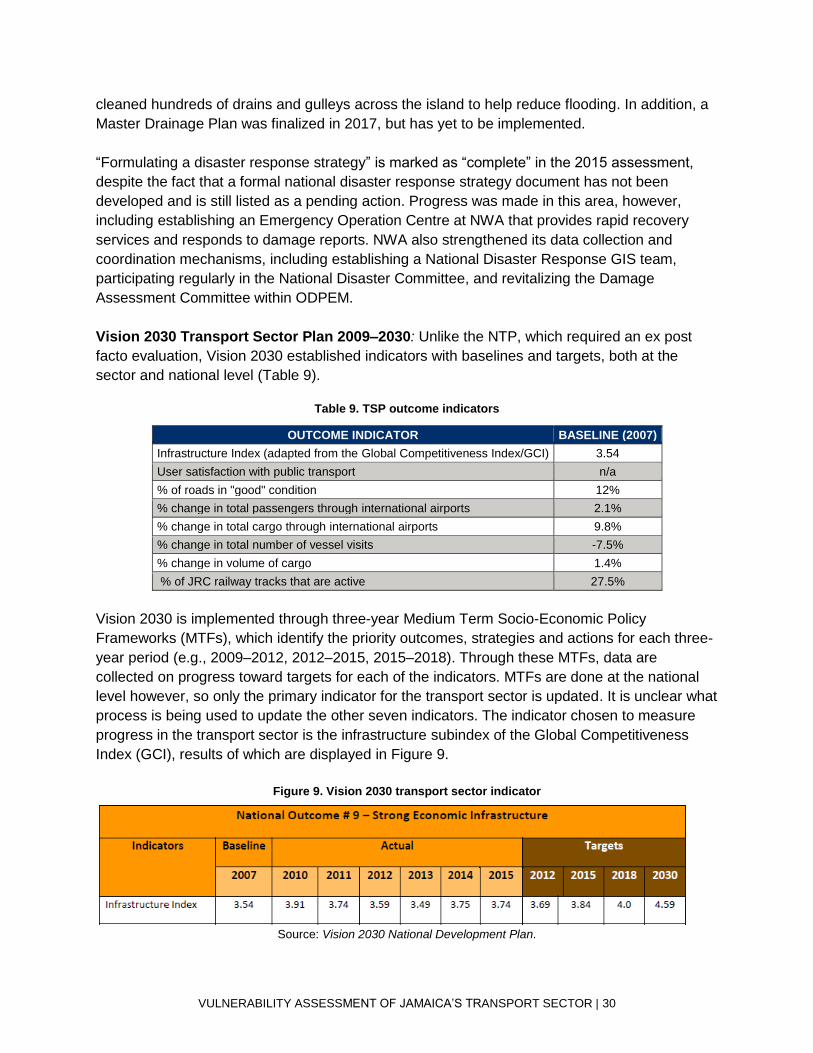
VULNERABILITY ASSESSMENT OF JAMAICA’S TRANSPORT SECTOR | 30
cleaned hundreds of drains and gulleys across the island to help reduce flooding. In addition, a
Master Drainage Plan was finalized in 2017, but has yet to be implemented.
“Formulating a disaster response strategy” is marked as “complete” in the 2015 assessment,
despite the fact that a formal national disaster response strategy document has not been
developed and is still listed as a pending action. Progress was made in this area, however,
including establishing an Emergency Operation Centre at NWA that provides rapid recovery
services and responds to damage reports. NWA also strengthened its data collection and
coordination mechanisms, including establishing a National Disaster Response GIS team,
participating regularly in the National Disaster Committee, and revitalizing the Damage
Assessment Committee within ODPEM.
Vision 2030 Transport Sector Plan 2009–2030: Unlike the NTP, which required an ex post
facto evaluation, Vision 2030 established indicators with baselines and targets, both at the
sector and national level (Table 9).
Table 9. TSP outcome indicators
OUTCOME INDICATOR BASELINE (2007)
Infrastructure Index (adapted from the Global Competitiveness Index/GCI) 3.54
User satisfaction with public transport n/a
% of roads in "good" condition 12%
% change in total passengers through international airports 2.1%
% change in total cargo through international airports 9.8%
% change in total number of vessel visits -7.5%
% change in volume of cargo 1.4%
% of JRC railway tracks that are active 27.5%
Vision 2030 is implemented through three-year Medium Term Socio-Economic Policy
Frameworks (MTFs), which identify the priority outcomes, strategies and actions for each three-
year period (e.g., 2009–2012, 2012–2015, 2015–2018). Through these MTFs, data are
collected on progress toward targets for each of the indicators. MTFs are done at the national
level however, so only the primary indicator for the transport sector is updated. It is unclear what
process is being used to update the other seven indicators. The indicator chosen to measure
progress in the transport sector is the infrastructure subindex of the Global Competitiveness
Index (GCI), results of which are displayed in Figure 9.
Figure 9. Vision 2030 transport sector indicator
Source: Vision 2030 National Development Plan.
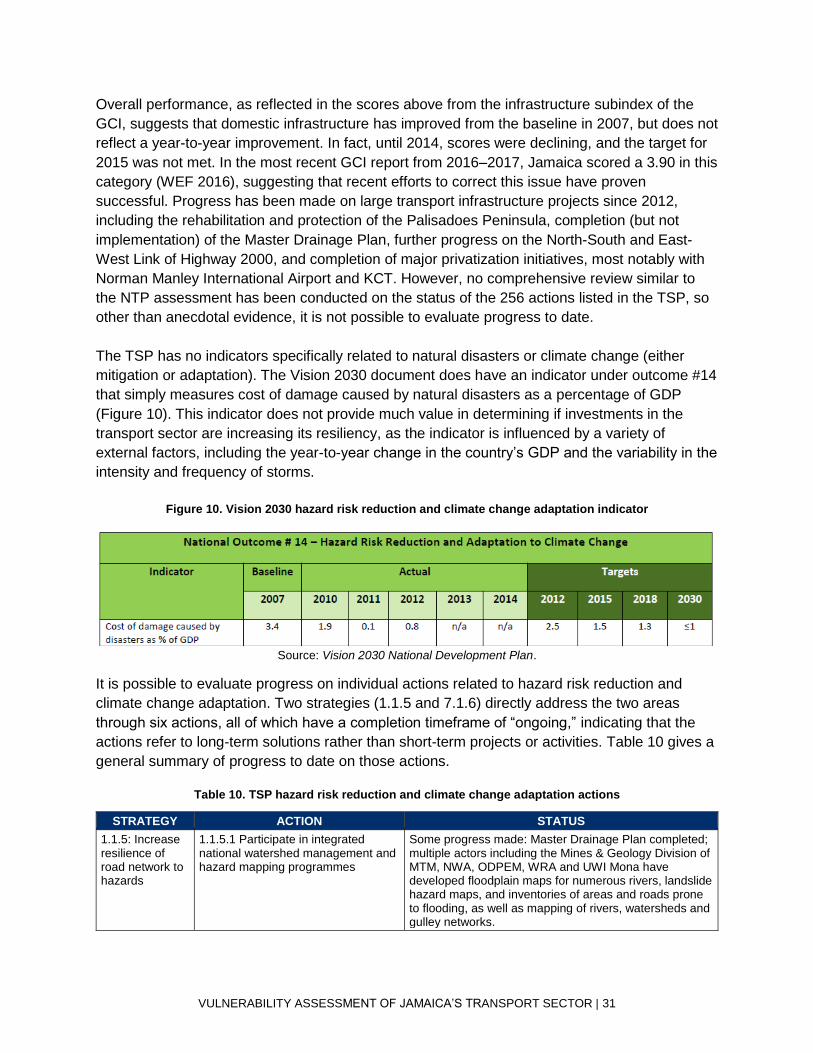
VULNERABILITY ASSESSMENT OF JAMAICA’S TRANSPORT SECTOR | 31
Overall performance, as reflected in the scores above from the infrastructure subindex of the
GCI, suggests that domestic infrastructure has improved from the baseline in 2007, but does not
reflect a year-to-year improvement. In fact, until 2014, scores were declining, and the target for
2015 was not met. In the most recent GCI report from 2016–2017, Jamaica scored a 3.90 in this
category (WEF 2016), suggesting that recent efforts to correct this issue have proven
successful. Progress has been made on large transport infrastructure projects since 2012,
including the rehabilitation and protection of the Palisadoes Peninsula, completion (but not
implementation) of the Master Drainage Plan, further progress on the North-South and East-
West Link of Highway 2000, and completion of major privatization initiatives, most notably with
Norman Manley International Airport and KCT. However, no comprehensive review similar to
the NTP assessment has been conducted on the status of the 256 actions listed in the TSP, so
other than anecdotal evidence, it is not possible to evaluate progress to date.
The TSP has no indicators specifically related to natural disasters or climate change (either
mitigation or adaptation). The Vision 2030 document does have an indicator under outcome #14
that simply measures cost of damage caused by natural disasters as a percentage of GDP
(Figure 10). This indicator does not provide much value in determining if investments in the
transport sector are increasing its resiliency, as the indicator is influenced by a variety of
external factors, including the year-to-year change in the country’s GDP and the variability in the
intensity and frequency of storms.
Figure 10. Vision 2030 hazard risk reduction and climate change adaptation indicator
Source: Vision 2030 National Development Plan.
It is possible to evaluate progress on individual actions related to hazard risk reduction and
climate change adaptation. Two strategies (1.1.5 and 7.1.6) directly address the two areas
through six actions, all of which have a completion timeframe of “ongoing,” indicating that the
actions refer to long-term solutions rather than short-term projects or activities. Table 10 gives a
general summary of progress to date on those actions.
Table 10. TSP hazard risk reduction and climate change adaptation actions
STRATEGY ACTION STATUS
1.1.5: Increase resilience of road network to hazards
1.1.5.1 Participate in integrated national watershed management and hazard mapping programmes
Some progress made: Master Drainage Plan completed; multiple actors including the Mines & Geology Division of MTM, NWA, ODPEM, WRA and UWI Mona have developed floodplain maps for numerous rivers, landslide hazard maps, and inventories of areas and roads prone to flooding, as well as mapping of rivers, watersheds and gulley networks.
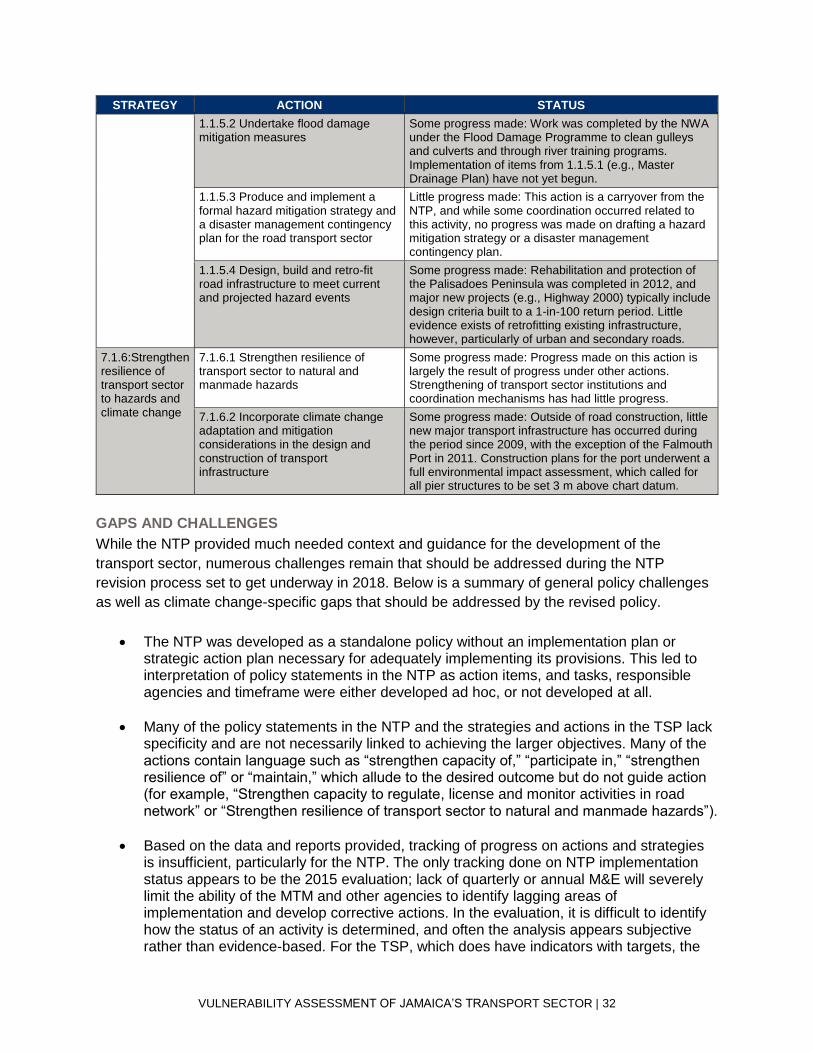
VULNERABILITY ASSESSMENT OF JAMAICA’S TRANSPORT SECTOR | 32
STRATEGY ACTION STATUS
1.1.5.2 Undertake flood damage mitigation measures
Some progress made: Work was completed by the NWA under the Flood Damage Programme to clean gulleys and culverts and through river training programs. Implementation of items from 1.1.5.1 (e.g., Master Drainage Plan) have not yet begun.
1.1.5.3 Produce and implement a formal hazard mitigation strategy and a disaster management contingency plan for the road transport sector
Little progress made: This action is a carryover from the NTP, and while some coordination occurred related to this activity, no progress was made on drafting a hazard mitigation strategy or a disaster management contingency plan.
1.1.5.4 Design, build and retro-fit road infrastructure to meet current and projected hazard events
Some progress made: Rehabilitation and protection of the Palisadoes Peninsula was completed in 2012, and major new projects (e.g., Highway 2000) typically include design criteria built to a 1-in-100 return period. Little evidence exists of retrofitting existing infrastructure, however, particularly of urban and secondary roads.
7.1.6:Strengthen resilience of transport sector to hazards and climate change
7.1.6.1 Strengthen resilience of transport sector to natural and manmade hazards
Some progress made: Progress made on this action is largely the result of progress under other actions. Strengthening of transport sector institutions and coordination mechanisms has had little progress.
7.1.6.2 Incorporate climate change adaptation and mitigation considerations in the design and construction of transport infrastructure
Some progress made: Outside of road construction, little new major transport infrastructure has occurred during the period since 2009, with the exception of the Falmouth Port in 2011. Construction plans for the port underwent a full environmental impact assessment, which called for all pier structures to be set 3 m above chart datum.
GAPS AND CHALLENGES
While the NTP provided much needed context and guidance for the development of the
transport sector, numerous challenges remain that should be addressed during the NTP
revision process set to get underway in 2018. Below is a summary of general policy challenges
as well as climate change-specific gaps that should be addressed by the revised policy.
• The NTP was developed as a standalone policy without an implementation plan or strategic action plan necessary for adequately implementing its provisions. This led to interpretation of policy statements in the NTP as action items, and tasks, responsible agencies and timeframe were either developed ad hoc, or not developed at all.
• Many of the policy statements in the NTP and the strategies and actions in the TSP lack specificity and are not necessarily linked to achieving the larger objectives. Many of the actions contain language such as “strengthen capacity of,” “participate in,” “strengthen resilience of” or “maintain,” which allude to the desired outcome but do not guide action (for example, “Strengthen capacity to regulate, license and monitor activities in road network” or “Strengthen resilience of transport sector to natural and manmade hazards”).
• Based on the data and reports provided, tracking of progress on actions and strategies is insufficient, particularly for the NTP. The only tracking done on NTP implementation status appears to be the 2015 evaluation; lack of quarterly or annual M&E will severely limit the ability of the MTM and other agencies to identify lagging areas of implementation and develop corrective actions. In the evaluation, it is difficult to identify how the status of an activity is determined, and often the analysis appears subjective rather than evidence-based. For the TSP, which does have indicators with targets, the
VULNERABILITY ASSESSMENT OF JAMAICA’S TRANSPORT SECTOR | 33
indicators are not sector-specific, which limits the ability to drill down to transport subsectors. While the infrastructure index indicator provides some level of relevance and rigor, the indicator tracking progress on climate resilience does not adequately capture an increase or decrease in the resilience of the country’s transport network.
• Both the NTP and the TSP lack budget estimates (either at the strategy or action item level) and direct connection to the budget planning process. As a result, overall cost implications of the policy or action plan are unknown; during the annual budget planning process, costs for individual action items are developed separately from the action plan. This results in reactive decision making – for example, maintenance and repair take priority over development and improvement – that impedes budget planning for larger or longer-term initiatives.
• Resources to implement many of the activities included in the NTP and TSP are generally lacking. In the 2016 budget, the budget estimate for road construction and repair across the five ministries or agencies that deal with roads (MEGJC, MTM, MLGCD, NWA and municipal corporations) is JMD2,306,608,000 (USD49,838,900) (MOF 2016). Analysis shows that 92 percent of that expenditure is marked for maintenance, rehabilitation and disaster management, leaving less than 8 percent for new construction or climate-proofing of existing infrastructure.
• As a result of both the need to spend local revenue on maintenance and the large size of the road network, many rehabilitation and development projects are foreign-funded loans. Examples include the USD50 million Transport Infrastructure Rehabilitation Programme and the USD10 million Road Improvement Programme, both funded by the International Development Bank, and the USD300 million Major Infrastructure Development Project funded by China. This limits the ability to implement new projects based on the willingness of development partners to provide grants and loans.
• Responsibility for the transport sector is spread out between three ministries, eight agencies, more than a dozen private sector operators and 14 municipal corporations (Table 6). Coordination between the various actors remains a challenge. With a recent reorganization, resulting in the creation of the MEGJC and the subsequent move of NWA and PAJ from the MTM to the MEGJC, strengthening coordination and cooperation remains a critical area for improvement.
• Many of the transport sector stakeholders were not fully consulted during development of the NTP. While this issue was addressed by a transport task force during the drafting of the TSP, transport does not currently have a TWG under Vision 2030. For the revised NTP to adequately reflect the needs of all transport sector actors, extensive stakeholder consultations should occur before and during the drafting of the policy. A dedicated task force should be created to both draft the policy and liaise with stakeholders. Similarly, a TWG should be created under Vision 2030 to ensure coordination with the NTP task force.
• Over the past decade, the GOJ has pushed to privatize both international airports, all major ports and a number of toll highways, largely through concession agreements. The government maintains ownership of all infrastructure but its role has changed from operator to regulator over a relatively short period of time. A revised transport policy will need to carefully consider this new role and craft regulation that promotes competition,
VULNERABILITY ASSESSMENT OF JAMAICA’S TRANSPORT SECTOR | 34
provides equitable rates and fees, maintains safety standards and ensures that infrastructure is maintained and improved upon.
• Except for one mention of disaster management planning, climate change was not considered in the NTP, nor was natural hazard mitigation. As a result, climate change adaptation and resiliency measures have been incorporated into infrastructure design on a project-by-project basis (e.g., Highway 2000, Falmouth Port), often on the requirements of the developer, private financer or private insurer.
• Availability of climate data for planning purposes is insufficient. For example, return period data (data used to develop a statistically measurement of the likelihood of an event reoccurring) need to be updated, as they are over 30 years old. Ten-, fifty- and one hundred-year events (as currently defined) are occurring more often than predicted, leading to insufficient design standards and infrastructure damage. Meteorological data are also often insufficient to determine weather conditions that lead to flooding, landslides and storm surge damage. MSJ is currently working with the World Bank to increase the number of automated weather stations, but additional work will need to be done to continue to increase the data gathered, as well as data processing, analysis and sharing among multiple agencies and ministries with differing levels of capacity to interpret climate and weather data.
• Climate change policy screening was not available during the development of the NTP and was later introduced during the Vision 2030 planning process. A revised NTP will need to be screened by PIOJ and CCD to ensure climate change resiliency is sufficiently and properly incorporated into the policy, and additional strengthening of NEPA’s climate change screening during the permitting process should also be considered.
EVALUATION OF STAKEHOLDER READINESS TO CLIMATE-PROOF INVESTMENTS
The following section examines the readiness of the key stakeholders – the MTM, NWA, AAJ
and PAJ – to climate-proof their respective infrastructure investments. Readiness in this section
is defined as having the appropriate staff, data and political will to begin to assess and prioritize
investments, and to allocate budget or seek additional external funding to support climate-
proofing activities.
GOVERNMENT OF JAMAICA
As a whole, the GOJ has taken significant steps in the past 15 years to address climate change.
In the past five years alone, the GOJ submitted its second communication to the United Nations
Framework Convention on Climate Change in 2011 and is currently drafting an updated third
communication. The government submitted its Intended Nationally Determined Contribution in
November 2015 and approved the Nationally Determined Contribution in April 2017. The
government is working with USAID, the German development agency GIZ and the
nongovernmental organization NAP Global Network, among other entities, to develop 12 sector
strategies and action plans for key sectors (the combined equivalent of a National Adaptation
Plan) that seek to mainstream climate change into ministerial policies, plans and budgets.

VULNERABILITY ASSESSMENT OF JAMAICA’S TRANSPORT SECTOR | 35
At an institutional level, the GOJ and several ministries have taken steps to ensure the
appropriate resources are in place to address climate change. Most notably, CCD was created
in 2013 with a mandate to oversee the newly approved Climate Change Policy Framework. The
framework has five main objectives, for which CCD holds primary responsibility: 1) to
mainstream climate change considerations into national policies, development plans and
ministerial budgets; 2) to support the national-level institutions responsible for climate change
research, data collection, analysis and projections to facilitate informed decision making; 3) to
coordinate the national response to the impacts of climate change and promote low carbon
development; 4) to communicate climate change impacts and adaptation- and mitigation-related
opportunities to decision makers and the general public; and 5) to mobilize climate financing for
adaptation and mitigation initiatives (MWLECC 2013).
In support of one of the most crucial aspects of the framework – mainstreaming climate change
– CCD also oversees the Climate Change Focal Point Network. Each focal point from relevant
ministries, departments and agencies is responsible for coordinating the development and
implementation of its respective sectoral climate change strategies and actions, and ensuring
climate change considerations are integrated into the ministry’s policies and plans by using
climate risk screening tools and training provided by CCD. A Climate Change Advisory Board
recently approved by Cabinet brings together 14 board members from academia, the private
sector, civil society and the public sector to advise the Prime Minister and the MEGJC on
climate change issues. This Board is a strengthened framework superseding the Climate
Change Advisory Committee, which had the same representation albeit a much larger
membership (at least 50 members).
Outside of CCD, other critical agencies that affect the transport sector have incorporated climate
change into their review processes. PIOJ, which reviews all policies, in the past years began to
screen policies for climate mitigation and adaptation components to ensure sectoral policies
adequately address climate risk and promote low carbon development. NEPA also incorporated
climate screening into its terms of reference for all environmental impact assessments to
provide basic assurances that all new infrastructure development projects that require an
environmental permit take climate risk into consideration. NEPA is one of the few agencies to
have a Climate Change Response Strategy (which expired in 2015) that if fully implemented
would mainstream climate change considerations for the main policies and plans falling within
its responsibility. It is also worth noting that Jamaica has strong support for climate change
projections from CSGM, which developed the State of the Jamaican Climate 2012, and is set to
release the updated report this year.
TRANSPORT SECTOR STAKEHOLDERS
Within the transport sector, overall readiness levels and capacity are low but awareness is high.
The MTM has a climate change focal point and staff that perform certain disaster management
functions, but does not have a full-time staff resource dedicated to climate change issues. As a
result, input on climate change considerations (including this assessment) come almost
exclusively from external sources, which will make incorporating climate change into the NTP a
more difficult and time-consuming process. The TSP, which does mention climate change, did

VULNERABILITY ASSESSMENT OF JAMAICA’S TRANSPORT SECTOR | 36
not have a climate change representative on the task force that developed the document, and
the task force and subcommittees were largely driven by the agencies and not the ministry. The
result of this is a low starting point to now begin incorporating climate resiliency into policies and
planning. Transport was also identified as one of the 12 priority sectors in the Climate Change
Policy Framework for which a sectoral climate change strategy and action plan should be
developed, but the process remains ongoing.
Roads: NWA is the agency best prepared to address climate change, but also faces by far the
greatest challenge in the transport sector due to the size of the road network under its
responsibility. NWA has established numerous disaster management bodies, including the
National Disaster Management Center, the Emergency Operation Center, and the National
Disaster Response GIS Team, all of which boost NWA’s capacity to respond to natural disaster
and collect data. NWA has also taken steps to increase design standards (to a 1-in-100 return
period) and now requires hydrological studies for private sector developers of major road
projects (most notably the Highway 2000 project). NWA has a strong GIS team generating data
(e.g., road network, bridge inventory and condition report, routes prone to flooding) and
regularly incorporating climate information (e.g., meteorological data, floodplain maps, landslide
data, flood return period) into its planning, placement and design. NWA is able to draw on a
small number of major assessments, including the World Bank’s Assessment of the Impact of
Floods and Landslides on the Jamaican Transport Infrastructure and the Master Drainage Plan.
Despite relatively high levels of capacity, NWA continues to suffer from budget constraints and
issues with data availability and quality. Budget constraints in particular limit NWA’s ability to
address climate change; as mentioned above, road and bridge maintenance costs consume
more than 90 percent of the annual budget, often leaving climate-proofing investments to
international donors, development banks or the private sector.
The level of readiness decreases dramatically for parochial roads, which fall under the purview
of municipal corporations, and make up two-thirds of the total road network in the country. As is
often the case at the subnational level, municipal corporations are further constrained by lack of
GIS specialists, insufficient budgets, limited access to spatial and climate data and capacity to
analyze that data, remoteness of the roads, and low quality of roads (i.e., unpaved).
Airports: As an organization, AAJ has limited capacity and limited staff following the
privatization of the two main international airports, and there is no indication that climate-
proofing is occurring at the domestic aerodromes that AAJ directly manages and operates. The
two main international airports have done little investment in climate-proofing to date, but both
are generating data to help guide future investments. Sangster International commissioned a
study to calculate future storm surge flood return periods based on projected changes in sea
level. Norman Manley International is currently preparing a tender for a full vulnerability
assessment that includes collection of primary data. The results of this study will be used to
make investment decisions for the airport.
Seaports: PAJ has limited capacity to address issues arising from climate variability and
change. PAJ’s leadership sees climate change as less of an immediate threat than other
transport subsectors, largely due to a lack of significant natural disaster damage to port

VULNERABILITY ASSESSMENT OF JAMAICA’S TRANSPORT SECTOR | 37
infrastructure over the past 30 years. No climate change policy or specific climate change-
related design criteria are currently in place, but related issues such as hurricane-level winds,
wave conditions, wind conditions and currents are factored into design. At Falmouth, the
developer took the initiative to include future sea level rise into account, designing the port to
accommodate a 3-m rise over 60 years. All five ports owned by PAJ outsourced their operations
and maintenance to private companies. At privately owned ports, PAJ only provides regulatory
(e.g., safety and maintenance) oversight.

VULNERABILITY ASSESSMENT OF JAMAICA’S TRANSPORT SECTOR | 38
VULNERABILITY ASSESSMENT
The country’s transport sector is vulnerable to the vagaries of climate for a number of reasons,
including:
• Geographical: an abundance of rivers and streams traverse the country, with many
steep gullies and canyons (making vast areas prone to flooding) and a long and
vulnerable coastline
• Climatic: heavy rainfall, tropical storms and cyclones
The impact of weather and climate on the transport sector is often exacerbated by
anthropogenic factors, such as poor waste management and inadequate cleaning of gullies and
drainage systems, as well as by poor network integrity, limited resources for maintenance, and
dated design standards that increase the vulnerability of the transport network.
As a starting point, this assessment recognizes that risk in the
transport sector is a function of both direct risk from climate-
related hazards as well as the propensity of transport assets to be
adversely affected by weather and climate events. Vulnerability is
a function of sensitivity, exposure and criticality, where:
• Sensitivity is the predisposition to be adversely affected, defined by an asset’s design criteria and current condition.
• Exposure, a function of location, represents the direct and indirect risk posed by weather- and climate-related hazards.
• Criticality identifies the assets that serve critical functions, such as guaranteeing connectivity to municipalities or communities or providing access during times of emergency.
To carry out a vulnerability assessment, it is fundamental to answer questions such as:
• What parts of the transport network are vulnerable and why? (Sensitivity)
• What are they vulnerable to? (Exposure)
• What assets serve critical economic or social protection functions and should thus be prioritized? (Criticality)
• How will their vulnerability change under a changing climate? (Future risk)
To accomplish analyses specific to vulnerability, a spatial database was established and
analysis tools were implemented within a GIS environment with the use of the GIS and R
statistical software packages. The datasets used in this analysis are listed in Annex A.
The vulnerability indicators evaluated, those that seek to answer the questions posed above,
are defined in Table 11. The analysis was carried out at the national, parish and native
The IPCC (2007) defines
vulnerability as: "The degree to
which a system is susceptible
or unable to cope with the
adverse effects of climate
change, including variability
and climatic extremes."

VULNERABILITY ASSESSMENT OF JAMAICA’S TRANSPORT SECTOR | 39
resolution scales of the underlying data to offer as much geographic specificity as the data
allow.
Table 11. Indicators of vulnerability
CATEGORY RATIONALE DATA AND CALCULATIONS
Sensitivity
Represents the propensity to be adversely affected by weather and climate events; is a function of the condition and design criteria of the asset (road, rails, port and airport
infrastructure).
Main road condition categorization by the NWA based on percentage of patched sections, potholes, cracking and other
criteria
Bridge condition per NWA assessment in 2016, including percentage of defective bridges per parish
Length in km of roads prone to flooding (data from NWA)
JUTC public transport network and bus stop condition assessment
Exposure Represents the direct risk from climate-related hazards to the
asset.
Number of disasters recorded due to floods and storms, hurricanes and surges, and landslides and alluvion
Landslide risk assessment and km of roads located in risk zones
Km of road within 20-, 50- and 100-year floodplains
Selection of parochial and secondary roads located within 100 m of at least 60-degree slope
Overlay onto JUTC public transport network
Future Climate Exposure
Includes variables related to principal risks under a changing climate, such as increased hurricane intensity, sea level rise and associated storm surge, and increased intensity of rainfall events.
Historical occurrence of hurricane impacts and landings, sea
level rise calculations and current trends in intense rainfall
ASSUMPTIONS AND LIMITATIONS
This vulnerability analysis was designed to offer insights on priority vulnerabilities of the
country’s transport sector at a national scale, with the hope of providing information for the new
iteration of Jamaica’s transport policy, specifically in considering climate-proofing the network.
While this analysis offers guidance on priorities and risks, more detailed analyses need to be
conducted at the individual asset scale (for example, as is being done with Norman Manley
International) to define specific engineering investments to safeguard the functional integrity of
critical assets (e.g., an airport). Consultations with key stakeholders in Jamaica suggest that
while some of these studies are in preparation, others are yet to be planned. The studies will be
valuable in setting priorities and appropriately earmarking already limited funds for the tasks that
might best safeguard asset integrity.
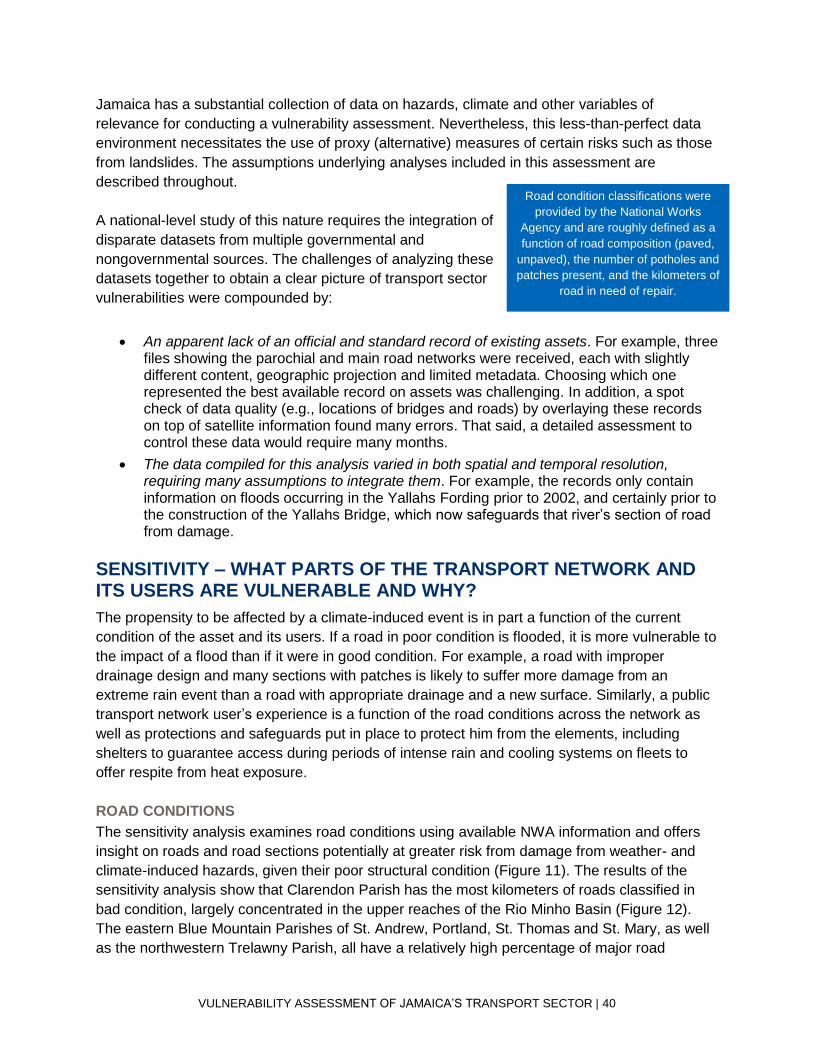
VULNERABILITY ASSESSMENT OF JAMAICA’S TRANSPORT SECTOR | 40
Jamaica has a substantial collection of data on hazards, climate and other variables of
relevance for conducting a vulnerability assessment. Nevertheless, this less-than-perfect data
environment necessitates the use of proxy (alternative) measures of certain risks such as those
from landslides. The assumptions underlying analyses included in this assessment are
described throughout.
A national-level study of this nature requires the integration of
disparate datasets from multiple governmental and
nongovernmental sources. The challenges of analyzing these
datasets together to obtain a clear picture of transport sector
vulnerabilities were compounded by:
• An apparent lack of an official and standard record of existing assets. For example, three files showing the parochial and main road networks were received, each with slightly different content, geographic projection and limited metadata. Choosing which one represented the best available record on assets was challenging. In addition, a spot check of data quality (e.g., locations of bridges and roads) by overlaying these records on top of satellite information found many errors. That said, a detailed assessment to control these data would require many months.
• The data compiled for this analysis varied in both spatial and temporal resolution, requiring many assumptions to integrate them. For example, the records only contain information on floods occurring in the Yallahs Fording prior to 2002, and certainly prior to the construction of the Yallahs Bridge, which now safeguards that river’s section of road from damage.
SENSITIVITY – WHAT PARTS OF THE TRANSPORT NETWORK AND ITS USERS ARE VULNERABLE AND WHY?
The propensity to be affected by a climate-induced event is in part a function of the current
condition of the asset and its users. If a road in poor condition is flooded, it is more vulnerable to
the impact of a flood than if it were in good condition. For example, a road with improper
drainage design and many sections with patches is likely to suffer more damage from an
extreme rain event than a road with appropriate drainage and a new surface. Similarly, a public
transport network user’s experience is a function of the road conditions across the network as
well as protections and safeguards put in place to protect him from the elements, including
shelters to guarantee access during periods of intense rain and cooling systems on fleets to
offer respite from heat exposure.
ROAD CONDITIONS
The sensitivity analysis examines road conditions using available NWA information and offers
insight on roads and road sections potentially at greater risk from damage from weather- and
climate-induced hazards, given their poor structural condition (Figure 11). The results of the
sensitivity analysis show that Clarendon Parish has the most kilometers of roads classified in
bad condition, largely concentrated in the upper reaches of the Rio Minho Basin (Figure 12).
The eastern Blue Mountain Parishes of St. Andrew, Portland, St. Thomas and St. Mary, as well
as the northwestern Trelawny Parish, all have a relatively high percentage of major road
Road condition classifications were
provided by the National Works
Agency and are roughly defined as a
function of road composition (paved,
unpaved), the number of potholes and
patches present, and the kilometers of
road in need of repair.
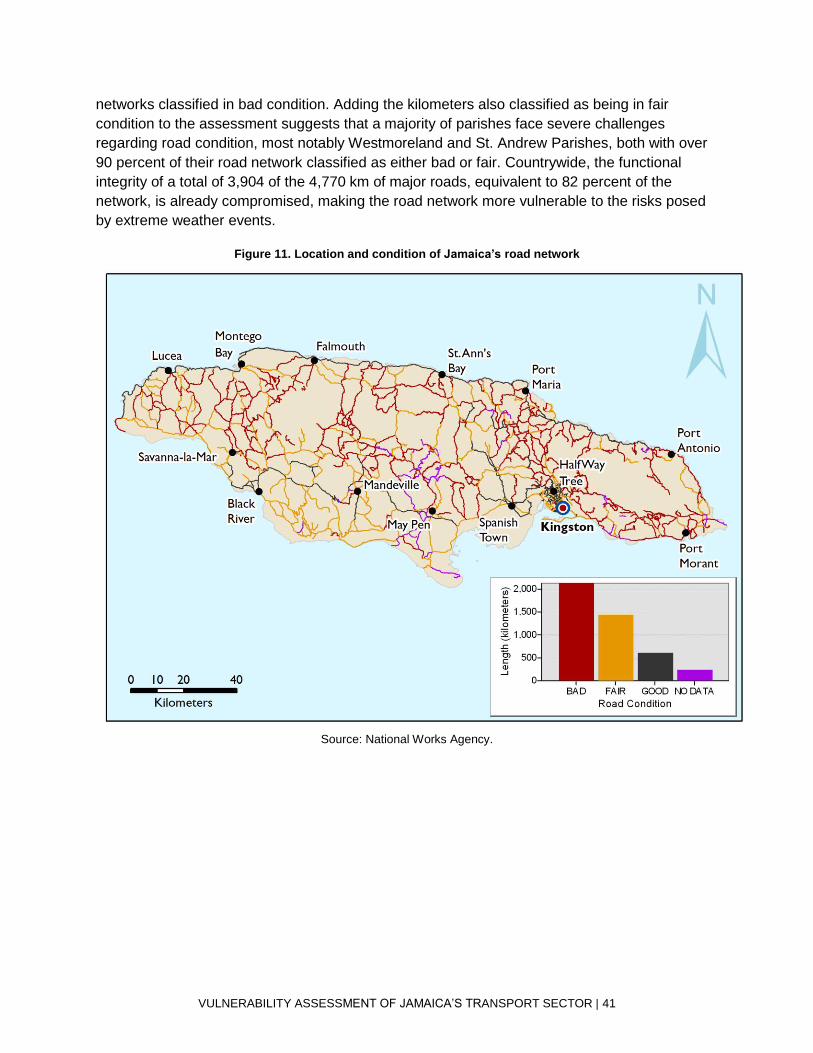
VULNERABILITY ASSESSMENT OF JAMAICA’S TRANSPORT SECTOR | 41
networks classified in bad condition. Adding the kilometers also classified as being in fair
condition to the assessment suggests that a majority of parishes face severe challenges
regarding road condition, most notably Westmoreland and St. Andrew Parishes, both with over
90 percent of their road network classified as either bad or fair. Countrywide, the functional
integrity of a total of 3,904 of the 4,770 km of major roads, equivalent to 82 percent of the
network, is already compromised, making the road network more vulnerable to the risks posed
by extreme weather events.
Figure 11. Location and condition of Jamaica’s road network
Source: National Works Agency.
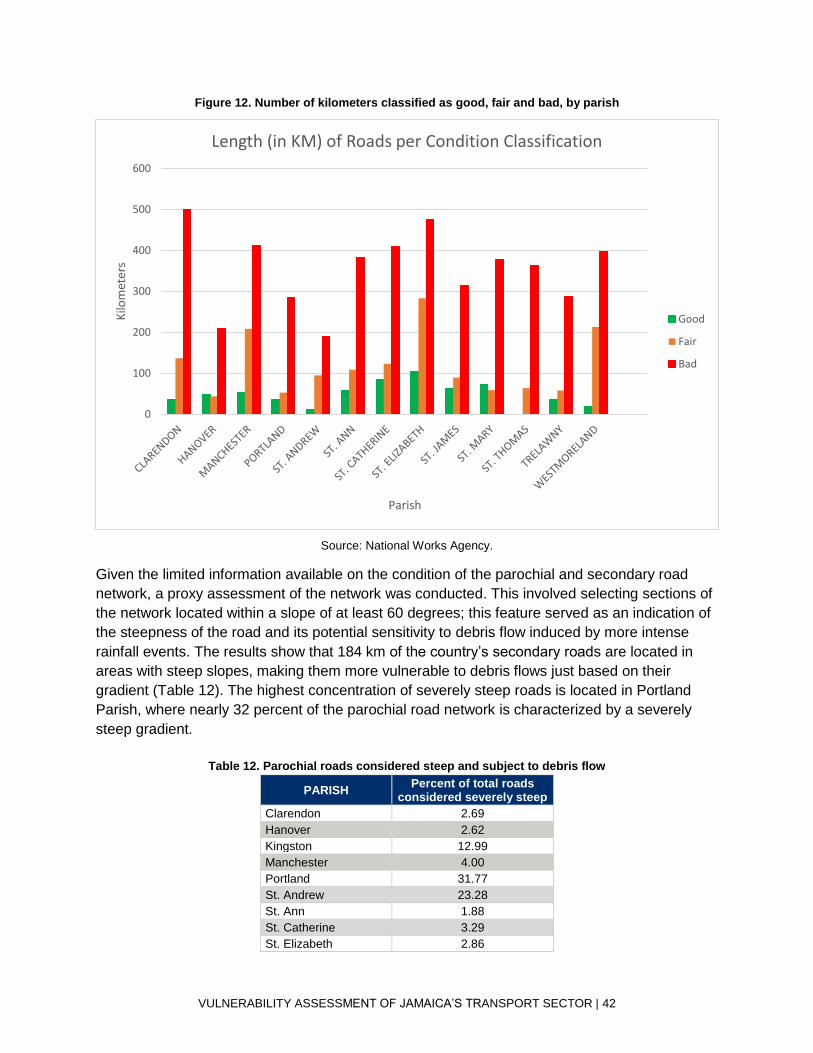
VULNERABILITY ASSESSMENT OF JAMAICA’S TRANSPORT SECTOR | 42
Figure 12. Number of kilometers classified as good, fair and bad, by parish
Source: National Works Agency.
Given the limited information available on the condition of the parochial and secondary road
network, a proxy assessment of the network was conducted. This involved selecting sections of
the network located within a slope of at least 60 degrees; this feature served as an indication of
the steepness of the road and its potential sensitivity to debris flow induced by more intense
rainfall events. The results show that 184 km of the country’s secondary roads are located in
areas with steep slopes, making them more vulnerable to debris flows just based on their
gradient (Table 12). The highest concentration of severely steep roads is located in Portland
Parish, where nearly 32 percent of the parochial road network is characterized by a severely
steep gradient.
Table 12. Parochial roads considered steep and subject to debris flow
PARISH Percent of total roads
considered severely steep
Clarendon 2.69
Hanover 2.62
Kingston 12.99
Manchester 4.00
Portland 31.77
St. Andrew 23.28
St. Ann 1.88
St. Catherine 3.29
St. Elizabeth 2.86
0
100
200
300
400
500
600
Kilo
met
ers
Parish
Length (in KM) of Roads per Condition Classification
Good
Fair
Bad
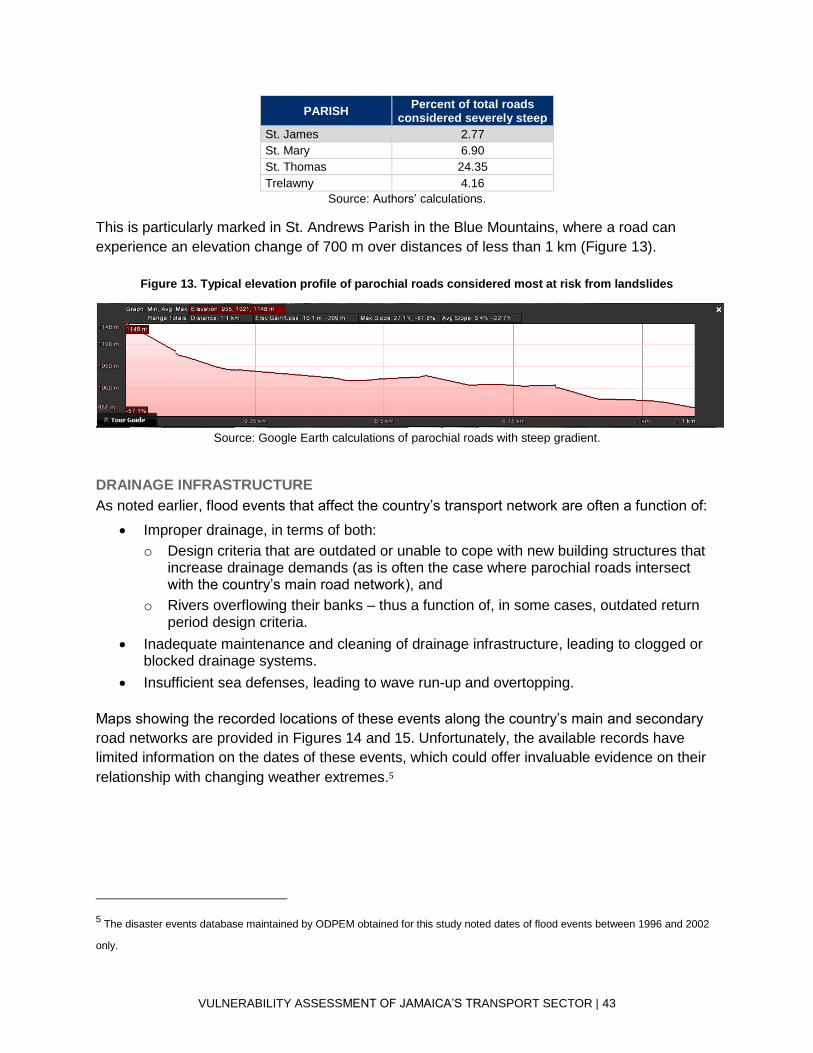
VULNERABILITY ASSESSMENT OF JAMAICA’S TRANSPORT SECTOR | 43
PARISH Percent of total roads
considered severely steep
St. James 2.77
St. Mary 6.90
St. Thomas 24.35
Trelawny 4.16
Source: Authors’ calculations.
This is particularly marked in St. Andrews Parish in the Blue Mountains, where a road can
experience an elevation change of 700 m over distances of less than 1 km (Figure 13).
Figure 13. Typical elevation profile of parochial roads considered most at risk from landslides
Source: Google Earth calculations of parochial roads with steep gradient.
DRAINAGE INFRASTRUCTURE
As noted earlier, flood events that affect the country’s transport network are often a function of:
• Improper drainage, in terms of both:
o Design criteria that are outdated or unable to cope with new building structures that increase drainage demands (as is often the case where parochial roads intersect with the country’s main road network), and
o Rivers overflowing their banks – thus a function of, in some cases, outdated return period design criteria.
• Inadequate maintenance and cleaning of drainage infrastructure, leading to clogged or blocked drainage systems.
• Insufficient sea defenses, leading to wave run-up and overtopping.
Maps showing the recorded locations of these events along the country’s main and secondary
road networks are provided in Figures 14 and 15. Unfortunately, the available records have
limited information on the dates of these events, which could offer invaluable evidence on their
relationship with changing weather extremes.5
5 The disaster events database maintained by ODPEM obtained for this study noted dates of flood events between 1996 and 2002
only.
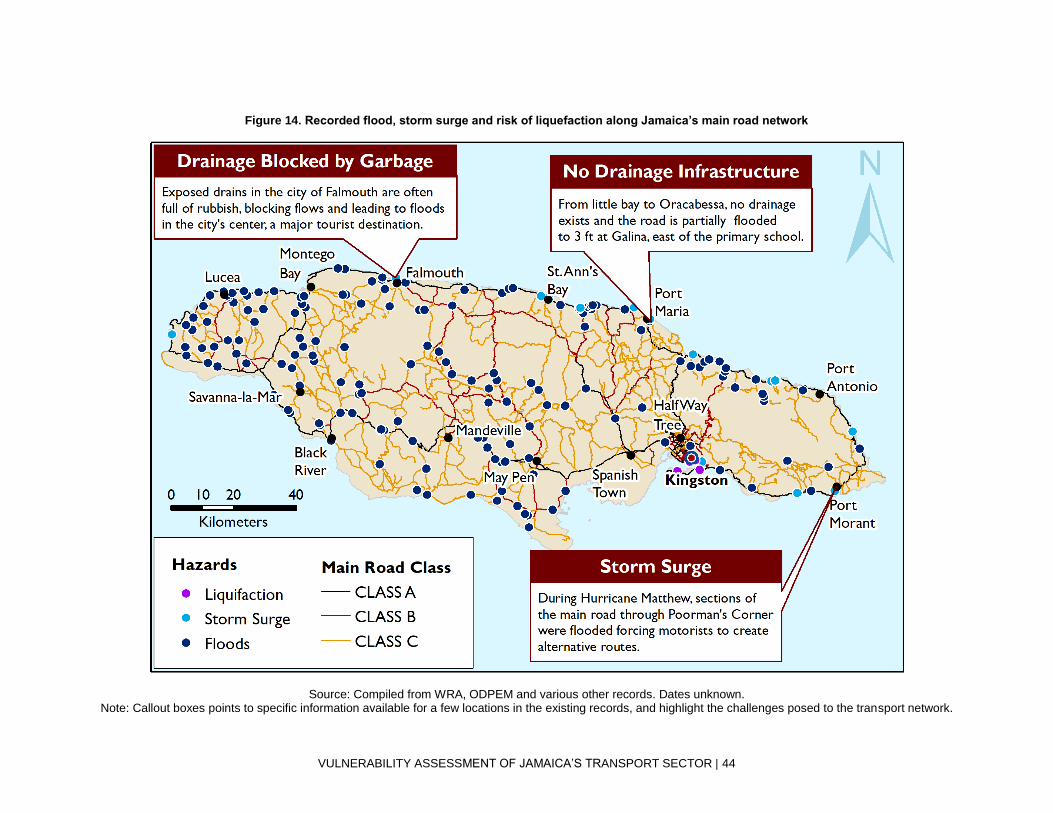
VULNERABILITY ASSESSMENT OF JAMAICA’S TRANSPORT SECTOR | 44
Figure 14. Recorded flood, storm surge and risk of liquefaction along Jamaica’s main road network
Source: Compiled from WRA, ODPEM and various other records. Dates unknown.
Note: Callout boxes points to specific information available for a few locations in the existing records, and highlight the challenges posed to the transport network.
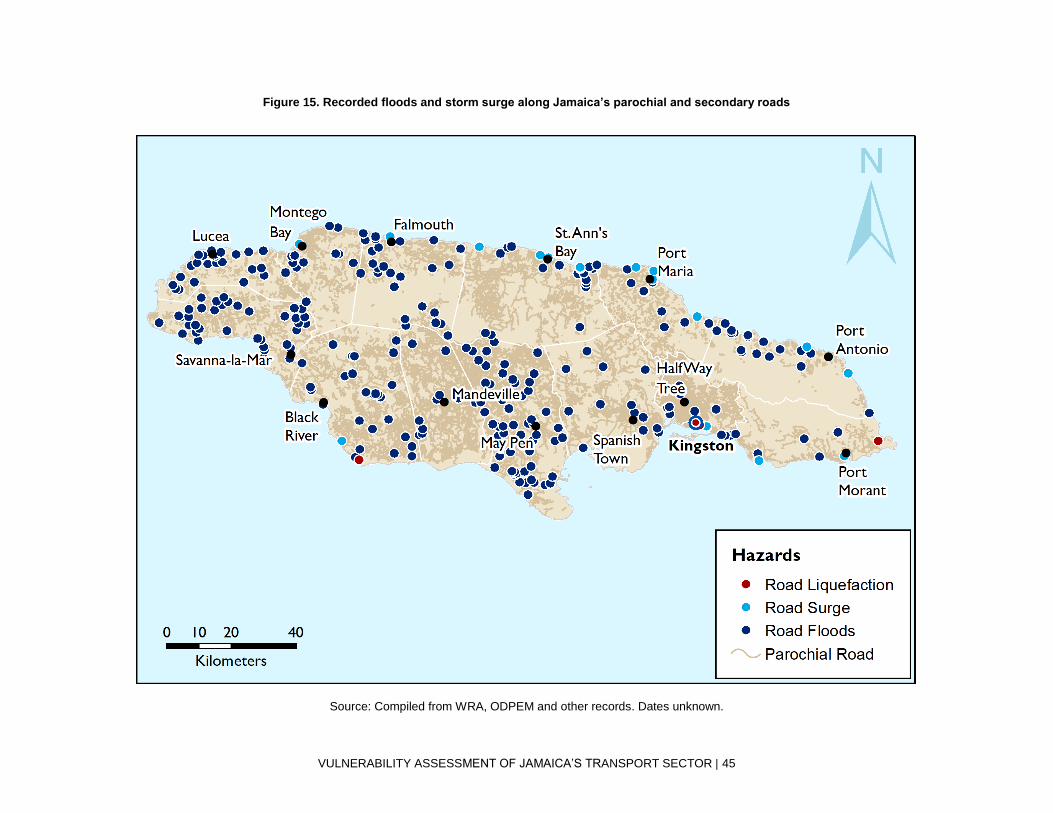
VULNERABILITY ASSESSMENT OF JAMAICA’S TRANSPORT SECTOR | 45
Figure 15. Recorded floods and storm surge along Jamaica’s parochial and secondary roads
Source: Compiled from WRA, ODPEM and other records. Dates unknown.
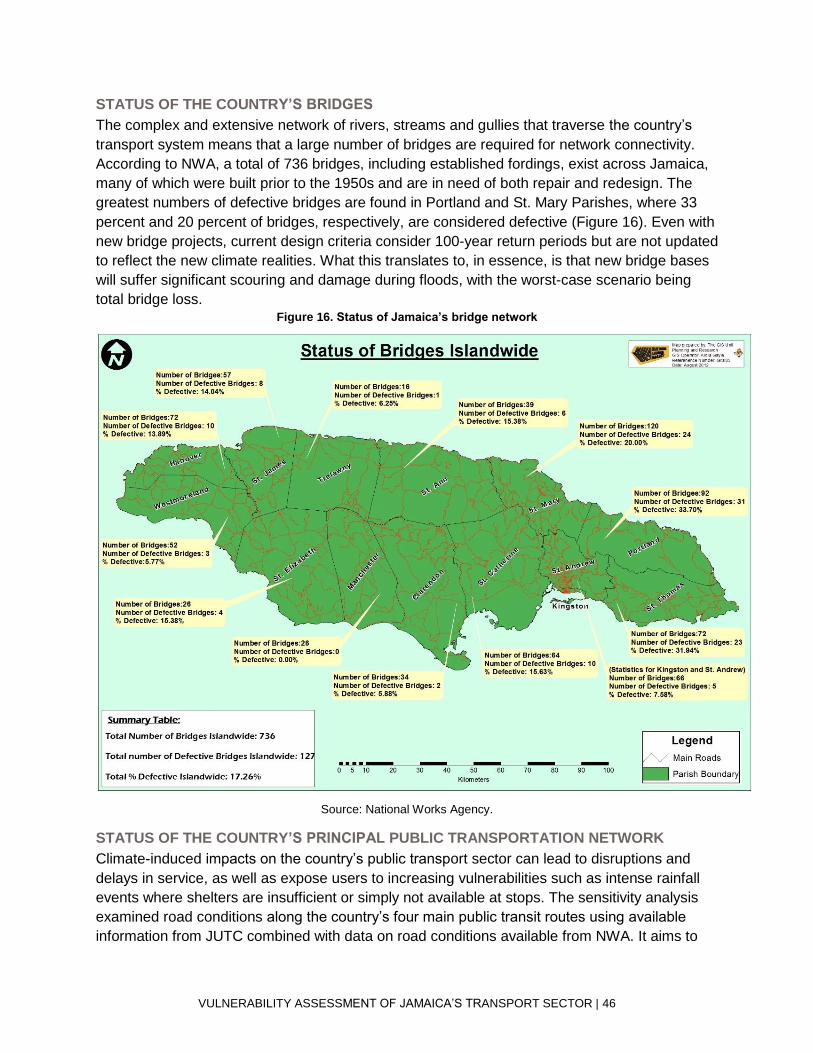
VULNERABILITY ASSESSMENT OF JAMAICA’S TRANSPORT SECTOR | 46
STATUS OF THE COUNTRY’S BRIDGES
The complex and extensive network of rivers, streams and gullies that traverse the country’s
transport system means that a large number of bridges are required for network connectivity.
According to NWA, a total of 736 bridges, including established fordings, exist across Jamaica,
many of which were built prior to the 1950s and are in need of both repair and redesign. The
greatest numbers of defective bridges are found in Portland and St. Mary Parishes, where 33
percent and 20 percent of bridges, respectively, are considered defective (Figure 16). Even with
new bridge projects, current design criteria consider 100-year return periods but are not updated
to reflect the new climate realities. What this translates to, in essence, is that new bridge bases
will suffer significant scouring and damage during floods, with the worst-case scenario being
total bridge loss. Figure 16. Status of Jamaica’s bridge network
Source: National Works Agency.
STATUS OF THE COUNTRY’S PRINCIPAL PUBLIC TRANSPORTATION NETWORK
Climate-induced impacts on the country’s public transport sector can lead to disruptions and
delays in service, as well as expose users to increasing vulnerabilities such as intense rainfall
events where shelters are insufficient or simply not available at stops. The sensitivity analysis
examined road conditions along the country’s four main public transit routes using available
information from JUTC combined with data on road conditions available from NWA. It aims to

VULNERABILITY ASSESSMENT OF JAMAICA’S TRANSPORT SECTOR | 47
offer insight on two fronts: 1) identifying route sections that are potentially at greater risk from
damage from weather- and climate-induced hazards, given their poor structural condition; and
2) evaluating customer experience with respect to these climate hazards. Poor road conditions
can also reduce the lifespan of public bus fleets in operation, increasing operational costs that
must be offset by increasing fees charged to customers and potentially leading to delays and
loss of service to critical areas.
EXPOSURE: WHAT ARE THE ASSETS AND SYSTEM USERS VULNERABLE TO?
Exposure, a function of location and geography, is the extent to which the transport asset or
those using the asset are subject to risks posed by biophysical dynamics as well as weather
and climate extremes. The variables selected to evaluate exposure aim to capture the major
risks to the country’s transport sector and users, including those posed by landslides, floods and
storm surge due to hurricanes. Figures 17 and 18 summarize these spatially.
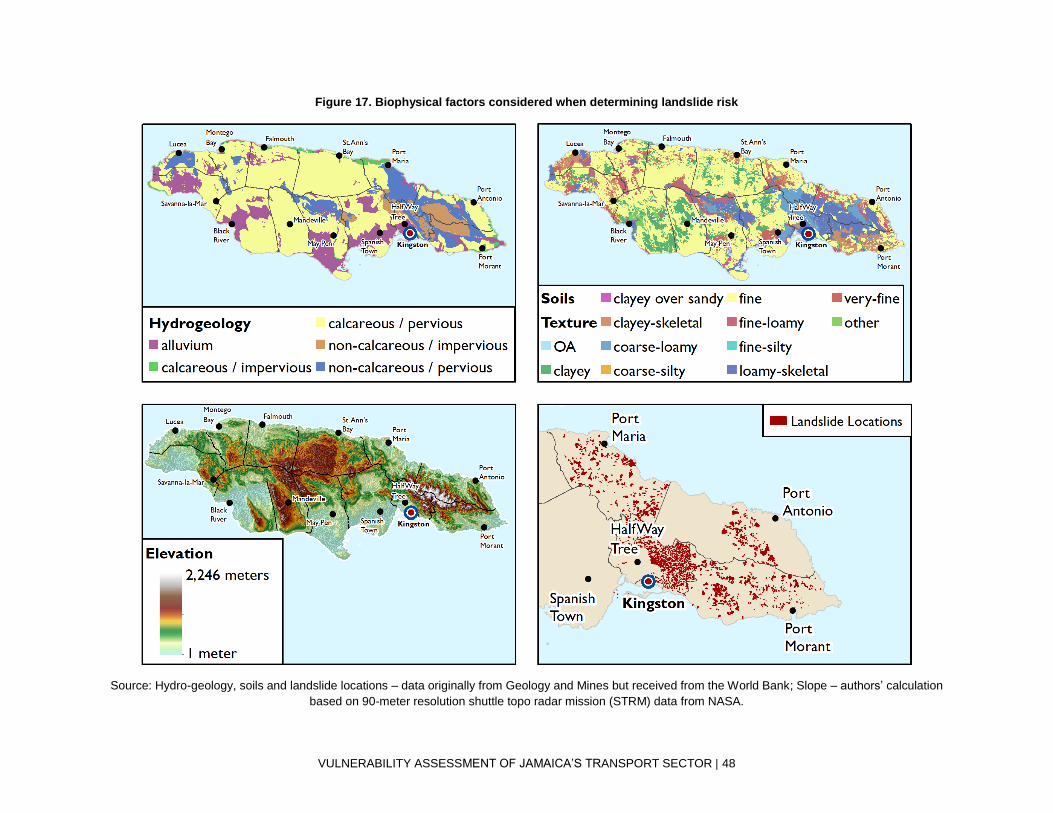
VULNERABILITY ASSESSMENT OF JAMAICA’S TRANSPORT SECTOR | 48
Figure 17. Biophysical factors considered when determining landslide risk
Source: Hydro-geology, soils and landslide locations – data originally from Geology and Mines but received from the World Bank; Slope – authors’ calculation
based on 90-meter resolution shuttle topo radar mission (STRM) data from NASA.

VULNERABILITY ASSESSMENT OF JAMAICA’S TRANSPORT SECTOR | 49
Figure 18. Baseline data layers used to calculate flood risks
Source: Authors’ calculations based on data provided by NWA and WRA.
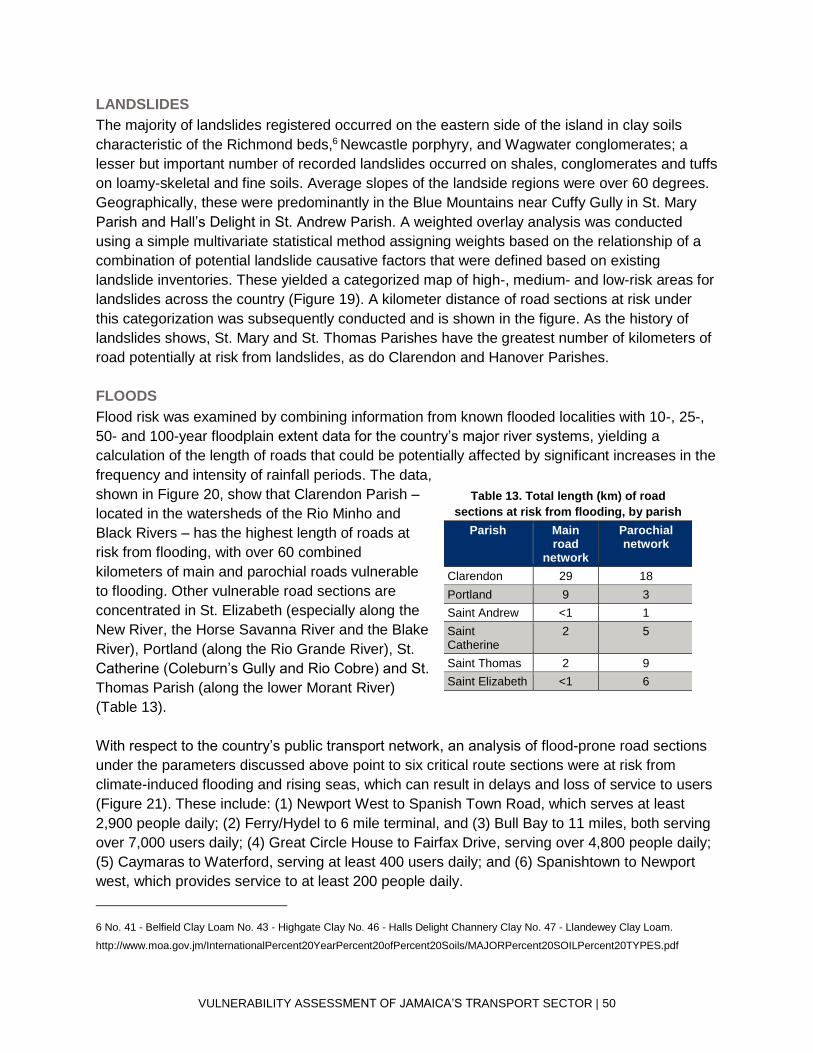
VULNERABILITY ASSESSMENT OF JAMAICA’S TRANSPORT SECTOR | 50
LANDSLIDES
The majority of landslides registered occurred on the eastern side of the island in clay soils
characteristic of the Richmond beds,6 Newcastle porphyry, and Wagwater conglomerates; a
lesser but important number of recorded landslides occurred on shales, conglomerates and tuffs
on loamy-skeletal and fine soils. Average slopes of the landside regions were over 60 degrees.
Geographically, these were predominantly in the Blue Mountains near Cuffy Gully in St. Mary
Parish and Hall’s Delight in St. Andrew Parish. A weighted overlay analysis was conducted
using a simple multivariate statistical method assigning weights based on the relationship of a
combination of potential landslide causative factors that were defined based on existing
landslide inventories. These yielded a categorized map of high-, medium- and low-risk areas for
landslides across the country (Figure 19). A kilometer distance of road sections at risk under
this categorization was subsequently conducted and is shown in the figure. As the history of
landslides shows, St. Mary and St. Thomas Parishes have the greatest number of kilometers of
road potentially at risk from landslides, as do Clarendon and Hanover Parishes.
FLOODS
Flood risk was examined by combining information from known flooded localities with 10-, 25-,
50- and 100-year floodplain extent data for the country’s major river systems, yielding a
calculation of the length of roads that could be potentially affected by significant increases in the
frequency and intensity of rainfall periods. The data,
shown in Figure 20, show that Clarendon Parish –
located in the watersheds of the Rio Minho and
Black Rivers – has the highest length of roads at
risk from flooding, with over 60 combined
kilometers of main and parochial roads vulnerable
to flooding. Other vulnerable road sections are
concentrated in St. Elizabeth (especially along the
New River, the Horse Savanna River and the Blake
River), Portland (along the Rio Grande River), St.
Catherine (Coleburn’s Gully and Rio Cobre) and St.
Thomas Parish (along the lower Morant River)
(Table 13).
With respect to the country’s public transport network, an analysis of flood-prone road sections
under the parameters discussed above point to six critical route sections were at risk from
climate-induced flooding and rising seas, which can result in delays and loss of service to users
(Figure 21). These include: (1) Newport West to Spanish Town Road, which serves at least
2,900 people daily; (2) Ferry/Hydel to 6 mile terminal, and (3) Bull Bay to 11 miles, both serving
over 7,000 users daily; (4) Great Circle House to Fairfax Drive, serving over 4,800 people daily;
(5) Caymaras to Waterford, serving at least 400 users daily; and (6) Spanishtown to Newport
west, which provides service to at least 200 people daily.
6 No. 41 - Belfield Clay Loam No. 43 - Highgate Clay No. 46 - Halls Delight Channery Clay No. 47 - Llandewey Clay Loam.
http://www.moa.gov.jm/InternationalPercent20YearPercent20ofPercent20Soils/MAJORPercent20SOILPercent20TYPES.pdf
Table 13. Total length (km) of road
sections at risk from flooding, by parish
Parish Main road
network
Parochial network
Clarendon 29 18
Portland 9 3
Saint Andrew <1 1
Saint Catherine
2 5
Saint Thomas 2 9
Saint Elizabeth <1 6
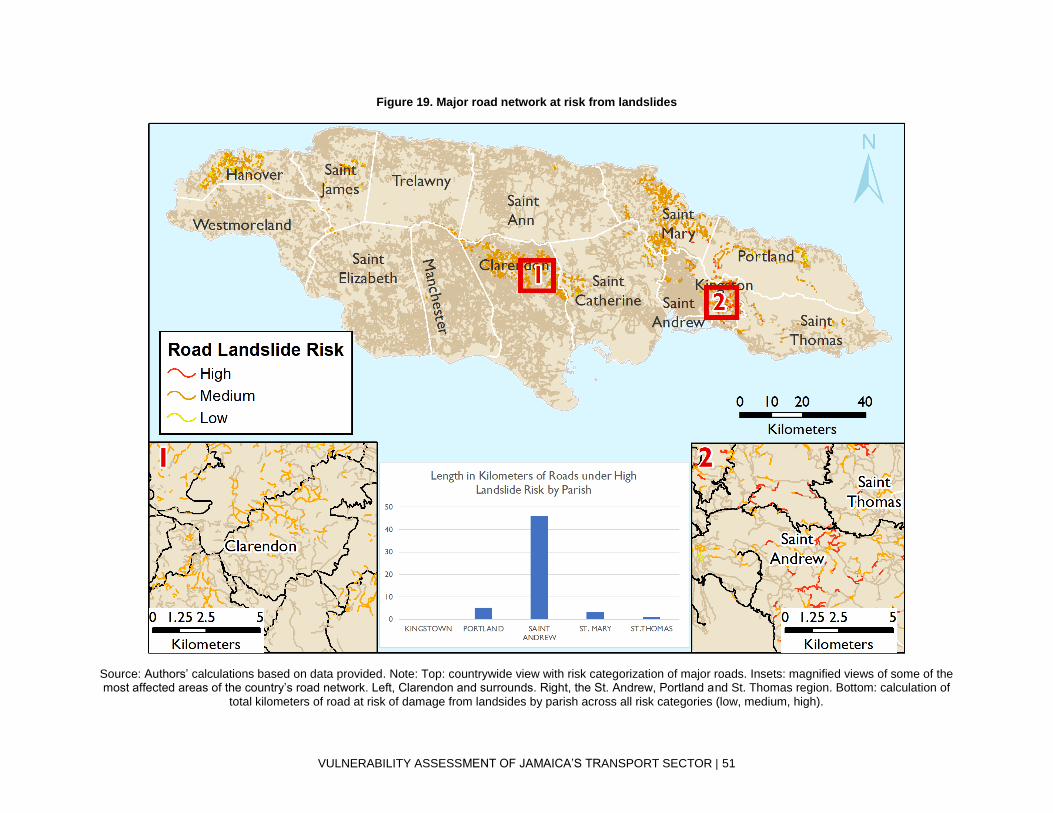
VULNERABILITY ASSESSMENT OF JAMAICA’S TRANSPORT SECTOR | 51
Figure 19. Major road network at risk from landslides
Source: Authors’ calculations based on data provided. Note: Top: countrywide view with risk categorization of major roads. Insets: magnified views of some of the most affected areas of the country’s road network. Left, Clarendon and surrounds. Right, the St. Andrew, Portland and St. Thomas region. Bottom: calculation of
total kilometers of road at risk of damage from landsides by parish across all risk categories (low, medium, high).

VULNERABILITY ASSESSMENT OF JAMAICA’S TRANSPORT SECTOR | 52
Source: Authors’ calculations based on data provided. Note: Top: countrywide view with risk categorization of major roads. Insets: magnified views of selected
most affected areas. Left, St. Catherine Parish, Right, Clarendon Parish).
Figure 20. Road network at risk from floods

VULNERABILITY ASSESSMENT OF JAMAICA’S TRANSPORT SECTOR | 53
Figure 21. Average number of daily passengers on principal JUTC lines, January-March 2017
Source: JUTC user assessment, 3-month average for January–March 2017.
VULNERABILITY ASSESSMENT OF JAMAICA’S TRANSPORT SECTOR | 54
CRITICALITY: BASED ON CRITICAL ECONOMIC OR SOCIAL PROTECTION FUNCTIONS, WHICH ASSETS SHOULD BE PRIORITIZED?
The impacts from transport network malfunctions differ across the different transport modes
discussed in this document (e.g., ports versus roads). This implies that differences arise in
magnitude from the closing of a few kilometers of road due to a flood versus delays caused in a
port from a hurricane, for example. Evaluating overall transport network performance requires
assigning a relatively greater importance to some parts of the network over others, otherwise
known as an evaluation of criticality. The concept of transport network criticality aims to identify
the most critical assets by evaluating the relative importance of the sector assets with respect
to: 1) crises and emergency management; 2) linkage to important economic hubs; and 3)
prominence in the connectivity of vulnerable communities. A countrywide evaluation of criticality
is beyond the scope of this analysis. Nevertheless, two examples, noted below, serve to
illustrate a viable approach, given sufficient resources and time.
Crises and emergency management criticality: The current 74 km of Highway 2000 from
Spanish Town to May Pen provide critical crisis and emergency management functions during
hurricanes and storms. Built with private financing, the Highway 2000 project design standards
are meant to safeguard the investment internationally, surpassing those required by the GOJ.
As such, the highway is less likely to be affected during a hurricane or storm relative to other
assets in the network, and, in fact, serves as safe passage for first responders and evacuees
alike.
Economic value: Historic Falmouth Port is a significant contributor to the country’s economy.
The port receives over 40 percent of Jamaica’s visitors and directly and indirectly employs a
large workforce. Even so, the port is only accessible by a single roadway that crisscrosses the
small town’s narrow, potholed roads, which are susceptible to flooding both due to their poor
design as well as improper maintenance of drainage infrastructure. As a result, aside from the
port itself, the vulnerability of the town’s key roads is also linked to changes in sea level, since
many of Historic Falmouth’s streets are located on low-lying sections susceptible to inundation.
Interruptions to passenger and freight traffic caused by transport delays following damage to
road infrastructure are already a problem and could intensify as climate changes.
FUTURE RISK
Following the discussion provided above on weather- and climate-related impacts and
vulnerabilities to the country’s transport sector, the focus of the future risk analysis is to consider
the impact of three current and future climate stressors on Jamaica’s transportation assets:
• Heavy rain-induced flooding landslides and landslips – captured by evaluating the historical occurrence of landslides and landslide risk categorization described above.
• Hurricanes and associated heavy rains – assumes stability in future hurricane paths and an increase in the number of category 4 and 5 hurricanes in spite of an overall decrease in frequency. These are concentrated to a large extent in the southern regions of the country.
VULNERABILITY ASSESSMENT OF JAMAICA’S TRANSPORT SECTOR | 55
• Sea level rise and coastal storm surge – for areas at or below 1 m of elevation and those with storm surge records, namely the Manchioneal and Morant River Basins (Figure 22).
The results point to priority vulnerabilities concentrated in:
Roads: Vulnerable roads include those in both northern and southern Clarendon Parish, the
coastal region of St. Elizabeth Parish and the Blue Mountain regions of St. Andrew, Portland
and St. Thomas Parishes (Figures 19, 20 & 22). Other vulnerable regions include Hanover
Parish, as well as the south coast roads of St. Thomas Parish, the north coast roads of St. Mary
Parish, and the Junction thoroughfare linking north to south on the eastern end.
Public Transport Network: Six critical route sections were identified as at risk from climate-
induced flooding and rising seas, which can result in delays and loss of service to users (Figure
21). These include: (1) Newport West to Spanish Town Road, which serves at least 2,900
people daily; (2) Ferry/Hydel to 6 mile terminal, and (3) Bull Bay to 11 miles, both serving over
7,000 users daily; (4) Great Circle House to Fairfax Drive, serving over 4,800 people daily; (5)
Caymaras to Waterford, serving at least 400 users daily; and (6) Spanishtown to Newport west,
which provides service to at least 200 people daily.
Airports: At Sangster International the majority of the runway and terminal access is located
below 1 m of elevation, making the airport particularly vulnerable to rising seas (Figure 23).
According to a WRA assessment, the main road access along the airport is characterized as
prone to flooding. The situation is less pronounced for Kingston’s Norman Manley International,
where only a few stretches of the access road and peripheral areas of the main airport are
challenged by elevation (Figure 26). Nevertheless, Norman Manley International is also subject
to more intense wave run-up and storm surge from hurricanes and tropical storms. Seawall
defenses will need reinforcements and, in some cases, redesign to cope with the potentially
more damaging hurricane forces projected in the future.
Ports: Falmouth Cruise Ship Pier (Figure 24), already subject to floods due to increasingly more
intense rainfall events, is significantly vulnerable to rising seas, with the majority of the road
network providing access at risk from flooding, and tourist areas also subject to high flood risks.
A similar risk profile exists for Montego Bay. On the other hand, while the principal access roads
to KCT are less subject to the risks from floods and rising seas, the container storage areas
south of the main port have significant areas located below 1 m of elevation, and its secondary
roads are subject to the risks from rising seas (Figure 25).
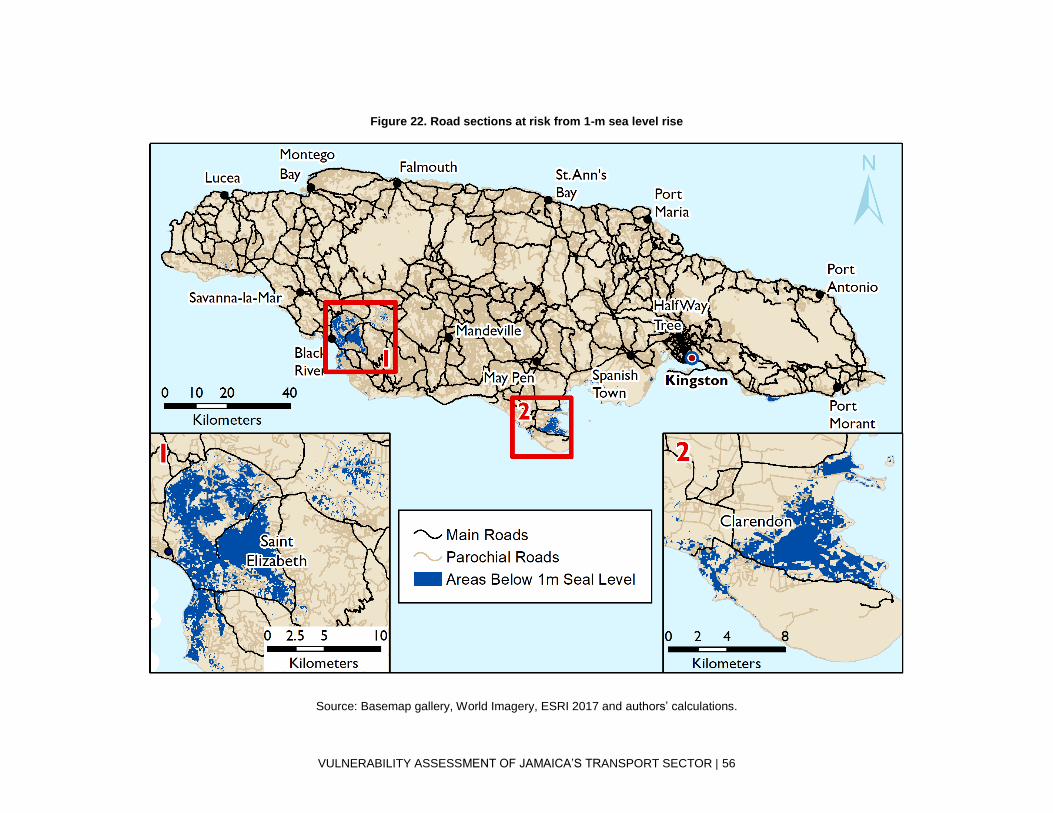
VULNERABILITY ASSESSMENT OF JAMAICA’S TRANSPORT SECTOR | 56
Figure 22. Road sections at risk from 1-m sea level rise
Source: Basemap gallery, World Imagery, ESRI 2017 and authors’ calculations.
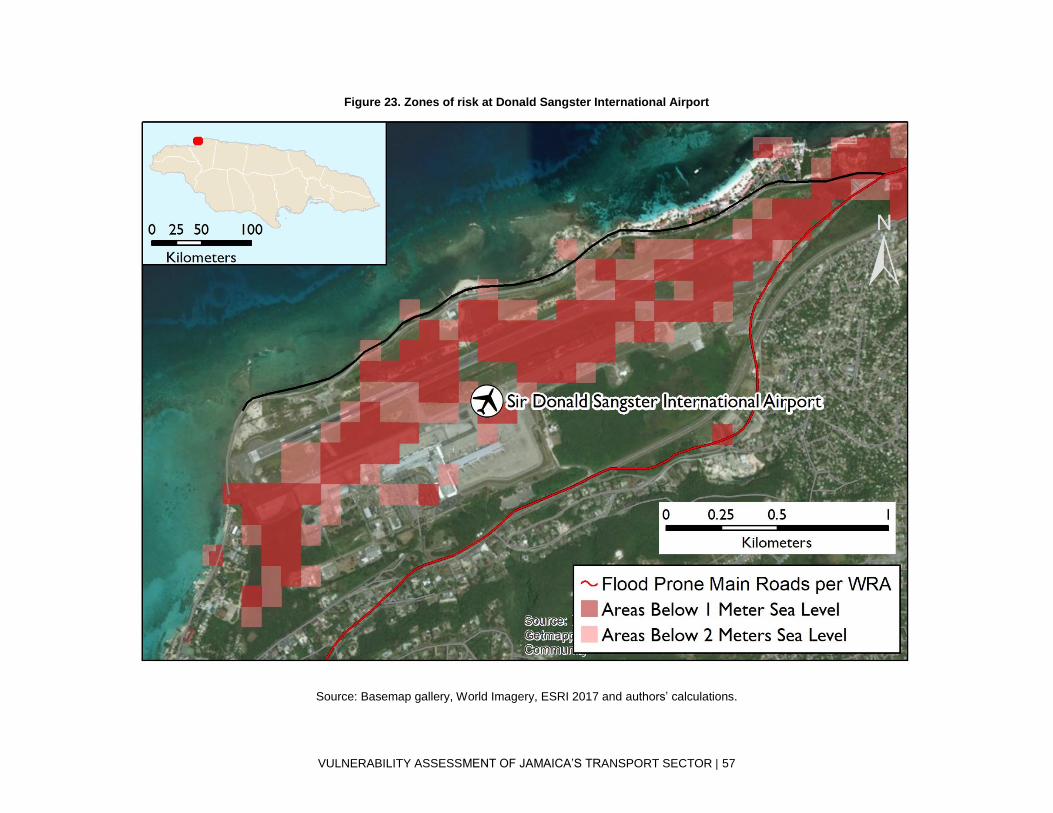
VULNERABILITY ASSESSMENT OF JAMAICA’S TRANSPORT SECTOR | 57
Figure 23. Zones of risk at Donald Sangster International Airport
Source: Basemap gallery, World Imagery, ESRI 2017 and authors’ calculations.
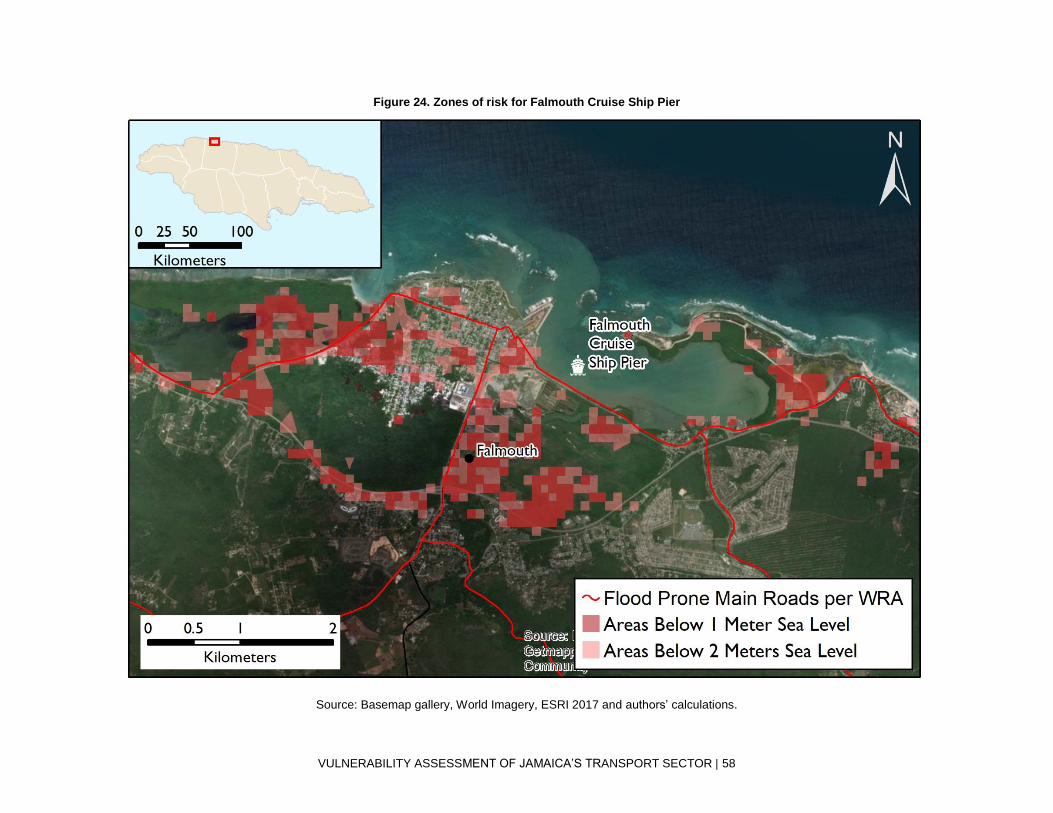
VULNERABILITY ASSESSMENT OF JAMAICA’S TRANSPORT SECTOR | 58
Figure 24. Zones of risk for Falmouth Cruise Ship Pier
Source: Basemap gallery, World Imagery, ESRI 2017 and authors’ calculations.
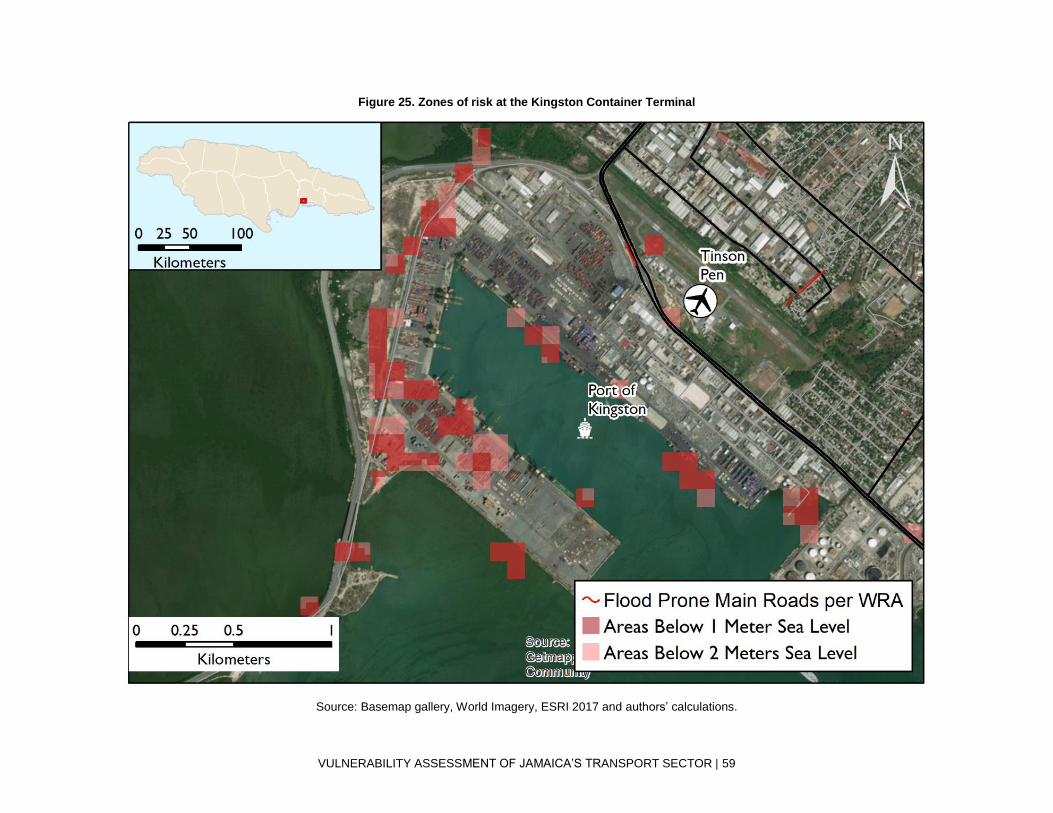
VULNERABILITY ASSESSMENT OF JAMAICA’S TRANSPORT SECTOR | 59
Figure 25. Zones of risk at the Kingston Container Terminal
Source: Basemap gallery, World Imagery, ESRI 2017 and authors’ calculations.
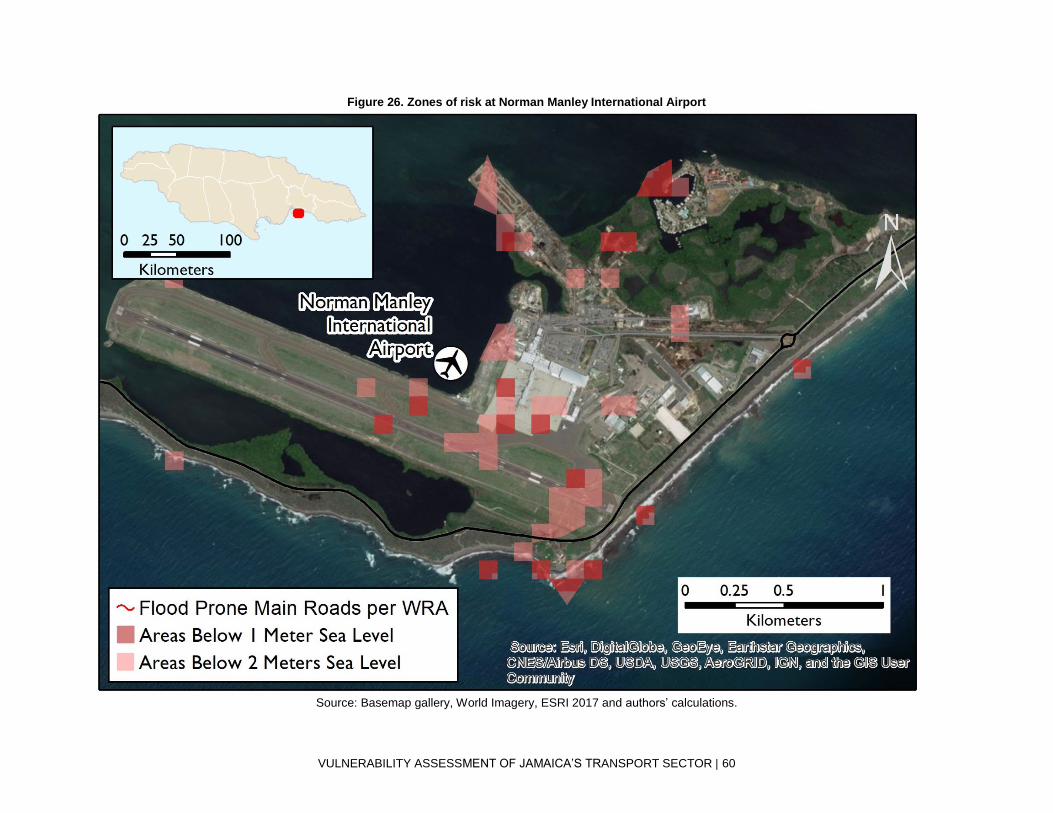
VULNERABILITY ASSESSMENT OF JAMAICA’S TRANSPORT SECTOR | 60
Figure 26. Zones of risk at Norman Manley International Airport
Source: Basemap gallery, World Imagery, ESRI 2017 and authors’ calculations.
VULNERABILITY ASSESSMENT OF JAMAICA’S TRANSPORT SECTOR | 61
RECOMMENDATIONS
This study demonstrates that as the impacts of climate change (i.e., rising temperatures, more
extreme heat events, more intense rainfall events, rising seas) manifest, the burden of risks to
Jamaica’s transport sector is expected to increase unless additional investments are made.
Some projected additional losses, for example from landslides, are potentially preventable if
high-risk areas are identified and design criteria for transport networks take these risks into
account. Reducing transport sector risks will require modifying current policies and programs
and implementing new ones to explicitly consider climate variability and change. Adaptation
actions should focus on building a more climate-resilient transport system, reducing overall
vulnerability and developing specific system capacities. Entry points include: 1) investments and
finance, 2) leadership and governance, specifically regarding institutions and planning
mechanisms, and 3) information systems. Specific actions to align with Jamaica’s Vision 2030
document are detailed below.
INVESTMENTS AND FINANCE
Conduct additional assessment(s) on scope of financing needs. Navigation and port
facilities, roads and drainage infrastructure, and other transport assets have a design lifetime,
after which they may need to be reconstructed to meet the climate and demand realities of the
day. Furthermore, this lifetime is dependent on proper maintenance and repairs to guarantee
asset performance. For example, a typical asphalt road may be designed to last 26 years but
will require resealing sometime during the first 13 years depending on traffic volumes and
vehicle weights. This assessment clearly points to the need to budget for and undertake
consistent maintenance of the country’s transport network to guarantee full functionality,
particularly with respect to drainage, maintenance and cleaning. Additionally, some nearshore
roads, seawalls and bridges will increasingly require repair, and if the sea level rise is
augmented by increased storm activity, the impact will necessitate redesign to new standards.
Further assessment should be undertaken to understand the scope of financing needs by
cataloguing the design lifetime of major infrastructure (e.g., roads, bridges, ports) and costing
out improved maintenance regimes for different types of infrastructure.
LEADERSHIP AND GOVERNANCE
Institutions
Increase capacity for the MTM to coordinate and convene the relevant expertise to build
climate resilience and DRR approaches into plans and operations. The MTM does not
currently have a unit dedicated to DRR under its technical services or planning and research
departments, despite the climate-related impacts on the sector. Nevertheless, several external
agencies (NWA on road design, CCD on climate adaptation, ODPEM on disaster risk
management) do have relevant expertise that could be brought to bear on the subject. CCD or
other external consultants should conduct training for other MTM staff, particularly those
involved in developing policy, action plans, and M&E plans. Topics could include: understanding
climate change impacts on the transport sector; crafting policy to reduce impacts from climate-
VULNERABILITY ASSESSMENT OF JAMAICA’S TRANSPORT SECTOR | 62
related risks; devising strategies and actions to increase the climate resilience of transport
infrastructure; and developing relevant indicators and targets to track performance over time.
Such a training could position and prepare MTM staff to convene and coordinate the analyses
and discussion necessary to climate-proof transport operations.
Establish a task force for NTP revisions and a Transport Sector Thematic Working Group
(TWG) under Vision 2030. A task force similar to the one that leads the TSP process should be
created within the MTM to lead NTP policy revision and coordinate with stakeholders. A
dedicated task force with representatives from multiple agencies will ensure all subsectors are
adequately addressed in the policy and that consultations are conducted with the wide network
of sector stakeholders.
TWGs in other sectors have proven successful as a mechanism to support the implementation
and M&E of Vision 2030 sectoral plans. They provide an important forum that brings in voices
outside of government from civil society, the private sector and development partners, and can
assist with planning, tracking progress, addressing shortfalls, identifying and mobilizing
resources, sharing information and ensuring coordination among stakeholders.
Increase capacity of other transport sector stakeholders to understand and address
climate risks within the context of the expected lifespan of investments. From the
technical personnel in parish councils to government agencies responsible for oversight and
regulation of transport infrastructure, additional capacity is strongly needed to better understand
and cope with climate risks, and to better understand the scientific basis for improved design
and planning, as well as the more important development implications of new investments and
their coordinated operations.
Include tailored climate change adaptation clauses on all new concession agreements,
and review and amend existing concession agreements where possible. With the update
of the NTP, as well as the creation of the Climate Change Policy Framework, all new
agreements (and where possible, existing agreements) should ensure concessionaires’
operations are in compliance with provisions of national transport and climate change policies,
as well as with national environmental laws and international standards.
Planning mechanisms
Develop a strategy, action plan and M&E plan to accompany the revised NTP. Policy must
be accompanied by planning mechanisms such as a medium-term strategic plan, an action plan
with defined tasks, and an M&E plan that assigns responsibility for collecting data and sets clear
indicators and targets. The action plan should consist of discrete tasks that can be
implemented, measured and completed, and should assign responsible parties and timeframe,
along with budget estimates. The M&E plan should establish a methodology for monitoring the
progress of tasks, along with indicators that clearly measure efforts to implement the action
plan, as well as a system to collect indicator data.
VULNERABILITY ASSESSMENT OF JAMAICA’S TRANSPORT SECTOR | 63
Incorporate climate change considerations into the revised NTP. Three main areas, at a
minimum, should be addressed: climate data to be used in analysis; design criteria; and risk
screening requirements. The NTP should set requirements for the use of climate data (including
historical and future projections of rainfall, flooding, storm surge and tropical storms) when
making planning and investment decisions. Design standards for infrastructure and best
practices for operations and maintenance informed by climate information and international best
practice should also be included in the policy. The NTP should also designate the types (in
terms of capital expenditure or extent of construction) of investments that should be screened
for climate risk and define the tool(s) to be used as well as a standard process for screening.
Establish partnerships to help address indirect issues, such as solid waste management,
construction waste and drainage, that cause or exacerbate flooding and infrastructure
deterioration. While aspects of solid waste management and drainage fall under the
responsibility of NSWMA and WRA, the MTM has purview over certain elements. Examples of
issues to incorporate into the revised NTP include: setting requirements for storm drain
cleaning, establishing standards for road drainage, and setting policy and enforcement
mechanisms for road repair and post-repair waste removal, among others. The Vision 2030
TWG for transportation would be a logical entity to liaise with others to guarantee operations
across related sectors.
Develop a hazard mitigation strategy and disaster response strategy for each subsector.
Following on plans from the NTP, the TSP and the Climate Change Policy Framework, the MTM
should follow through on developing formal hazard mitigation and disaster response strategies
for each of the transport subsectors (roads, airports, seaports and possibly railways). These
strategies, developed together with the revised NTP, will guide action to address and respond to
natural disasters. The strategies should also be developed and refined through stakeholder
consultations to ensure broad-based input during the drafting phase.
Update urban development plans. In coordination with the MLGCD, municipal corporations
need to update urban development plans to reflect the changing risk profile for floods and
landslides to the parish road networks. Updated plans also need to be aligned with the Master
Drainage Plan developed by NWA.
INFORMATION SYSTEMS
Conduct analyses to inform revisions to design criteria for all assets, taking into account
a changing climate. For example, bridges and culverts are currently designed using standards
and river flow models developed prior to 1960. Shifting rainfall patterns need to be considered in
new design criteria to safeguard investments. Novel ways of incorporating the large volume of
debris and vegetation being carried into drains, culverts and channels need to be devised, as
the current structural guidelines accommodate only pure water flows. Design criteria, land use
regulations and other related regulations are contained in a variety of documents, including the
National Building Code, the Main Roads Act, the Parochial Roads Act, the Town and Country
Planning Act, the Local Improvements Act, the Beach Control Act, and Volume 3 of NEPA’s
Development and Investment Manual.
VULNERABILITY ASSESSMENT OF JAMAICA’S TRANSPORT SECTOR | 64
Improve quality and maintenance of existing data. Significant data are available on the road
network and road conditions, bridge locations and conditions, airport and seaport infrastructure,
flood- and landslide-prone areas, floodplain maps, river and gulley networks, watersheds, soil
condition and composition, weather and climate, and a host of other relevant information. These
can be used in transport infrastructure management and investment planning. However, these
data are often available only within the ministries or agencies that developed them. In addition,
the quality of data varies across datasets. However, the dispersed and uncoordinated natural
hazards records pose significant challenges for the formulation of plans and projects to deal
with current and emerging risks. Dissemination mechanisms within the key institutions
responsible for risk management currently also impede the use and application of available
studies. A database housed within the National Spatial Data Planning Division that integrates
climatic, geophysical and infrastructure data in a meaningful way, along with a plan and team
dedicated to curating these data, would be useful across the sector.
Develop more detailed hazard assessments for specific assets at finer spatial scales.
According to Brabb (1993) and others, at least 90 percent of the losses due to landslides, for
example, could be avoided if detailed information and responses were available to engineers
and communities. While this assessment begins to unpack these risks, additional information is
required for the regions and assets specified as vulnerable to determine appropriate safeguards
to put in place.
Conduct detailed vulnerability assessments for specific assets. A deeper dive into the
vulnerability of specific investments could offer important information on the need to climate-
proof the assets. For example, AAJ’s planned vulnerability assessment of Norman Manley
International Airport will, over the course of at least nine months, collect and model vulnerability
to storm surges, wave run-up and other risks within the confines of the airport facilities and their
access roads. This information is critical for prioritizing investments. This assessment points to
the need to prioritize such analyses for the country’s parochial road network, for which limited
information is available.
Conduct a public education program that helps to raise awareness of the risks from
floods and other climate changes. A public education program can offer salient advice on
new developments in sensitive areas. In the long term, this may also help to raise awareness of
officials in municipal corporations, which in large part approve construction in high-risk zones.
Leveraging and capitalizing on the collective experiences of CARICOM (Caribbean Community)
countries and the Caribbean Community Climate Change Centre could help to bring island-
appropriate knowledge and insights to the task.
VULNERABILITY ASSESSMENT OF JAMAICA’S TRANSPORT SECTOR | 65
TRANSPORT SECTOR BEST PRACTICE FOR SMALL ISLAND DEVELOPING STATES
Small island developing states (SIDS)7 vary widely, from relatively large volcanic islands such
as Papua New Guinea and Cuba, to extremely small coral atolls such as Tuvalu and the
Maldives. Despite the variation in size, topography, geology and location, SIDS share a similar
and specific set of challenges, including (UNCTAD 2014; UNESCAP 2016):
• Small size, remoteness and insularity
• Large percentage of population and infrastructure within 1 km of coastline
• High vulnerability to the effects of climate change, in particular sea level rise and increased intensity of tropical storms
• Limited financial resources for infrastructure development and maintenance
• Large dependence on imports, with a limited export base and natural resources
• High transport costs (e.g., transport costs of Caribbean trade are at least 30 percent higher than the world average (Pinnock and Ajagunna 2012)
• Heavy reliance on coastal transport infrastructure (seaports and airports), which provides a critical lifeline for external trade, food, energy, and tourism (cruise ships and air transport)
• Little redundancy in the transport network: most countries are only equipped with one airport, one major port, and a few arterial roads.
• Due to the lack of redundancy, transport disruptions can cripple key economic sectors like tourism, fishing, or agriculture, and cut off access to healthcare, education, and other essential services
To respond to these challenges, national governments, regional organizations, development
banks, donor organizations and the private sector have been working together to develop and
implement adaptation solutions that address climate change from multiple angles, including
infrastructure, policy and financing. Below is a summary of best practices for climate change
adaptation in SIDS’ transport sectors.
Enhancing existing infrastructure. In many SIDS, efforts have been made to climate-proof
existing infrastructure (in particular roads, bridges and drainage systems) to withstand increased
7 A total of 58 SIDS exist (38 UN members and 20 Non-UN Members/Associate Members of the Regional Commissions) as defined
by the UN Office of the High Representative for the Least Developed Countries, Landlocked Developing Countries and Small Island Developing States (UN-OHRLLS). See details here: http://unohrlls.org/about-sids/country-profiles/

VULNERABILITY ASSESSMENT OF JAMAICA’S TRANSPORT SECTOR | 66
precipitation intensity, increased heat and sea level rise. Examples of infrastructure
improvements include:
• Raising the height of the roadbed 1–3 additional meters above sea level
• Relocating, rebuilding or building new infrastructure further inland and at a higher elevation
• Installing sea defenses (e.g., breakwaters, seawalls, revetments)
• Installing slope retention structures both below and above roads to prevent landslide damage
• Installing beach erosion controls, including hard engineering solutions (e.g., groynes, breakwaters, increased vegetation) and regulatory measures (e.g., buffers and set-backs)
• Improving drainage and flood management to prevent damage such as scouring, undermining of pavement and washout during heavy precipitation events; this has taken many forms, including:
— Building drainage systems to remove surface water from pavement
— Increasing the capacity and size of side drains
— Increasing the capacity and size of culverts and cross drainage
— Raising the height of embankments in floodplains
— Building diversion canals
— Improving cleaning and maintenance regimes for drainage systems
• Changing composition of building material to safeguard against higher temperatures (e.g., using stiffer bitumen in pavement)
• Increasing bridge clearance above the projected high flood level
• Hardening and protecting bridges against floods and erosion, including increasing the footing depth, increasing the size of the pilings, and installing spur dikes or debris deflectors
• Setting pier structures above chart datum to account for sea level rise
• Hardening critical port infrastructure to resist hurricane-level winds
• Lengthening airport runways to account for longer takeoffs needed with higher temperatures
Improving infrastructure maintenance. Regular infrastructure monitoring and maintenance is
often the weak link in SIDS, and is one of the most crucial aspects of increasing resilience.
Preventative maintenance is significantly more cost-effective than rebuilding or repairing
damaged infrastructure, and can help roads, bridges and ports better resist the effects of
extreme weather. However, it is often not included as part of an international loan agreement or
grant funding for infrastructure development. Various methods can be used to increase
infrastructure maintenance, including: increasing available funding through budget allocation,
additional taxes or user fees; strengthening the supply chain of spare parts and materials
needed for repairs; and developing maintenance plans that codify monitoring frequency, identify
priority infrastructure and allocate resources for specific projects. Another approach employed
by numerous SIDS is privatization, typically through “operate and maintain” concession
agreements, which places the burden of (and incentive for) maintenance on a private sector

VULNERABILITY ASSESSMENT OF JAMAICA’S TRANSPORT SECTOR | 67
operator. This latter arrangement, however, continues to rely on government capacity to
transparently monitor and enforce the concession contact.
Improving data for decision making and updating design standards. Adequate climate and
hydrological information is needed to set appropriate design and construction standards and to
make decisions about where to locate (or relocate) infrastructure. Data availability varies across
SIDS, but a basic set of data, including downscaled climate projections, daily temperature and
precipitation data (current and historical), floodplain maps and landslide data, along with
accurate GPS-located road network maps, road condition reports, bridge inventory and
condition reports, and port locations can improve the quality of decision making. Additionally,
adequate climate data will allow SIDS to calculate or recalculate return periods for major events
such as hurricanes and floods, which can then be incorporated into design and construction
standards for new infrastructure investments, as well as used to guide investments in climate-
proofing existing infrastructure.
Incorporating climate risk screening into infrastructure planning or permitting processes.
Virtually all transport infrastructure projects should require an environmental impact
assessment, and part of that assessment should include the risk to the project from weather
events such as extreme heat, extreme precipitation and flooding, sea level rise, and storm surge
and strong winds, based on the geographic location and topographic attributes of the proposed
investment as well as the physical components of the project (e.g., construction material,
construction techniques). Climate risk screening, when coupled with appropriate design
standards, can help ensure infrastructure is located in a low-risk area, or is designed
appropriately to operate in a higher-risk area.
Incorporating climate change into transport policies, plans, legislation and budgeting. Climate
change adaptation considerations should be included at all levels, from legislation to action
plans. Legislation and policy can address requirements such as data to be used in analysis,
minimum design standards and screening procedures, and can mandate that transport agencies
develop and implement climate change adaptation or natural hazard risk mitigation plans for
their particular subsector. Policies can also identify specific subsectors – such as air and sea
transport infrastructure that are critical lifelines and economic drivers – for increased funding
and action. Climate change adaptation can be included in action plans and budgets by
identifying key assets that are at risk, identifying climate-proofing measures and then including
that additional cost in the development or maintenance budget.
Improving inclusiveness of transport networks. Rural roads are often poorly engineered,
unpaved and only accessible in drier seasons, and once construction is complete, their
maintenance is usually neglected. Rural roads in particular are highly susceptible to extreme
weather, rendering them impassible for long periods of time, further isolating rural communities.
While emphasis should be put on critical infrastructure such as major highways that facilitate
economic development and serve as emergency evacuation routes, it should not be done at the
expense of forgoing proper design and maintenance of rural roads, be they paved or unpaved.
VULNERABILITY ASSESSMENT OF JAMAICA’S TRANSPORT SECTOR | 68
Design standards and maintenance plans (albeit less stringent than for primary roads) should
also be set for rural roads and the agency or municipalities responsible for the network.
Increasing access to international financing to climate-proof infrastructure or mitigate risk. Many
SIDS face budget constraints to fund large infrastructure projects due to the small size of their
tax base (both a small population and lack of large or international businesses) and lack of
natural resources. International financing can help fill this gap, either through loans from
development banks such as the Asian Development Bank (ADB) or the Inter-American
Development Bank (IDB), or through grants from climate funds such as the Green Climate Fund
(GCF), Global Environment Facility or Least Developed Countries Fund or development
agencies such as USAID, Australian Department of Foreign Affairs and Trade (DFAT), the UK’s
Department for International Development (DFID) and GIZ. For example, the GEF-funded
Pacific Adaptation to Climate Change (PACC) program had projects aimed at climate-proofing
and protecting coastlines in 14 countries in the Pacific (e.g., improving a 7-km section of
Kosrae’s coastal road in Federated States of Micronesia), and the ADB-funded project in the
Cook Islands increased the resiliency of Avatiu Port to damage from large waves and effects of
extreme weather. Pooled insurance mechanisms also represent an innovative approach to
disaster risk mitigation, including the Pacific Catastrophe Risk Insurance pilot program through
the World Bank and the Caribbean Catastrophe Risk Insurance Facility.
VULNERABILITY ASSESSMENT OF JAMAICA’S TRANSPORT SECTOR | 69
REFERENCES
Airports Authority of Jamaica. (2015). “Annual Report 2015–2016.” Retrieved from
http://www.airportsauthorityjamaica.aero/pdf/AAJ_Annual_Report_2015-16.pdf.
Bindoff, N.L., J. Willebrand, V. Artale, A, Cazenave, J. Gregory, S. Gulev, K. Hanawa, C. Le
Quéré, S. Levitus, Y. Nojiri, C.K. Shum, L.D. Talley and A. Unnikrishnan. (2007).
Observations: Oceanic Climate Change and Sea Level. In: Climate Change 2007: The
Physical Science Basis. Contribution of Working Group I to the Fourth Assessment Report
of the Intergovernmental Panel on Climate Change [Solomon, S., D. Qin, M. Manning, Z.
Chen, M. Marquis, K.B. Averyt, M. Tignor and H.L. Miller (eds.)]. Cambridge University
Press, Cambridge, United Kingdom and New York, NY, USA.
Brabb E., (1993). Proposal for worldwide landslide hazard maps. Proceedings of 7th
International Conference and field workshop on landslide in Czech and Slovak Republics;
pp. 15–27.
Burgess, C.P., M.A. Taylor, T. Stephenson, A. Mandal, L. Powell, (2015). A macro-scale flood
risk model for Jamaica with impact of climate variability. Natural Hazards 78(1), pp. 231–
256.
Climate Studies Group, Mona (CSGM), (2012). State of the Jamaican Climate 2012: Information
for Resilience Building (Full Report). Produced for the Planning Institute of Jamaica (PIOJ),
Kingston Jamaica.
Climate Studies Group, Mona (CSGM), (2017). State of the Jamaican Climate 2015: Information
for Resilience Building (Full Report). Produced for the Planning Institute of Jamaica (PIOJ),
Kingston Jamaica.
Desinventar – http://www.desinventar.net/DesInventar/profiletab.jsp?countrycode=jam
Hay, C.C., E. Morrow, R.E. Kopp and J.X. Mitrovica, (2015). Probabilistic reanalysis of
twentieth-century sea-level rise. Nature 517: 481–484.
IPCC, (2007). Climate Change 2007: The Physical Science Basis. Contribution of Working
Group I to the Fourth Assessment Report of the Intergovernmental Panel on Climate
Change. [Solomon, S., D. Qin, M. Manning, Z. Chen, M. Marquis, K.B. Averyt, M. Tignor and
H.L. Miller (eds.)]. Cambridge University Press, Cambridge, United Kingdom and New York,
NY, USA, 996pp.
Ministry of Finance. (2016). “2016–2017 Jamaica Budget.” Retrieved from
http://www.mof.gov.jm/downloads/budgets/eoe/Estimates_of_Expenditure_2016-2017.pdf.

VULNERABILITY ASSESSMENT OF JAMAICA’S TRANSPORT SECTOR | 70
Ministry of Transport and Mining. (2017a). “Integrated Strategic Business Plan 2017/2018–
2019/2020.” Retrieved from http://www.mtw.gov.jm/index.php/downloads/send/6-2017-2018-
plans/6-2017-2020-strategic-business-plan.
Ministry of Transport and Mining. (2017b). “Operational Plan 2017–2018.” Retrieved from
http://www.mtw.gov.jm/index.php/downloads/send/6-2017-2018-plans/5-2017-2018-
operational-plan.
Ministry of Transport and Works. (2007). “National Transport Policy.” Retrieved from
http://www.oas.org/en/sedi/dsd/Biodiversity/Sustainable_Cities/Sustainable_Communities/E
vents/SC%20Course%20Jamaica%202016/Module%20III/National%20Transport%20Policy-
%20Jamaica.pdf.
Ministry of Transport, Works and Housing. (2015). “Preliminary Evaluation: National Transport
Policy (2007), National Transport Policy Review Working Group (NTPRWG).”
Ministry of Water, Land, Environment and Climate Change. (2013). “Climate Change Policy
Framework for Jamaica.” Retrieved from
http://www.japarliament.gov.jm/attachments/440_Climate%20Change.pdf.
Neufville, Zadie. (2012). “Working to Cope with Climate Change, Jamaica Calculates Costs.”
Inter Press Service News Agency. Retrieved from http://www.ipsnews.net/2012/04/working-
to-cope-with-climate-change-jamaica-calculates-costs/
Planning Institute of Jamaica (PIOJ). (2009a). “Vision 2030 Jamaica – National Development
Plan.” Retrieved from
http://www.vision2030.gov.jm/Portals/0/NDP/Vision%202030%20Jamaica%20NDP%20Full
%20No%20Cover%20(web).pdf.
PIOJ. (2009b). “Vision 2030 Transport Sector Plan.” Retrieved from
http://www.vision2030.gov.jm/Portals/0/Sector_Plan/Microsoft%20Word%20-
%20Vision%202030%20Jamaica%20-
%20Final%20Draft%20Transport%20Sector%20Plan%20_S%C3%A2%E2%82%AC%C2%
A6.pdf.
PIOJ. (2011). “Assessing the Costs of Disasters on Jamaica’s Infrastructure: Evidence from the
Damage and Loss Assessment.”
PIOJ. (2015). “Vision 2030 Medium Term Socio-Economic Policy Framework 2015–2018.”
Retrieved from http://www.vision2030.gov.jm/Portals/0/MTF/MTF%202015%20-
%202018%20-%20Final%20Draft%20-%20December%2031,%202015%20-
%20Rev%202.pdf.
http://www.mtw.gov.jm/index.php/downloads/send/6-2017-2018-plans/6-2017-2020-strategic-business-plan
VULNERABILITY ASSESSMENT OF JAMAICA’S TRANSPORT SECTOR | 71
Pinnock, Fritz H., Ajagunna, Ibrahim A. (2012). “The Caribbean Maritime Transportation Sector:
Achieving Sustainability Through Efficiency.” Centre for International Governance Innovation
Port Authority of Jamaica (PAJ). (2017). “Statistical Publication, July 2017.” Retrieved from
http://www.portjam.com/docs/MonthlyStatisticalReport.pdf.
Simpson, M.C., Gössling, S., Scott, D., Hall, M., & Gladin, E., (2008). “Climate change
adaptation and mitigation in the tourism sector: Frameworks, tools and practices.” Paris:
UNEP.
Tindigarukayo, Jimmy Kazaara, (2014). “The Impact of Rural-Urban Influx on Jamaican
Society.” International Journal of Humanities and Social Science. Retrieved from:
http://www.ijhssnet.com/journals/Vol_4_No_9_1_July_2014/5.pdf
United Nations Conference on Trade and Development (UNCTAD). (2014). “Small island
developing states: Challenges in transport and trade logistics.” Retrieved from
http://unctad.org/meetings/en/SessionalDocuments/cimem7d8_en.pdf.
United Nations Economic and Social Commission for Asia and the Pacific (UNESCAP). (2016).
“Transport connectivity for least developed countries, landlocked developing countries and
small island developing states.” Retrieved from
http://www.unescap.org/sites/default/files/pre-ods/MCT3_6E.pdf.
World Economic Forum. (2016). “The Global Competitiveness Report 2016–2017.” Retrieved
from https://www.weforum.org/reports/the-global-competitiveness-report-2016-2017-1.

VULNERABILITY ASSESSMENT OF JAMAICA’S TRANSPORT SECTOR | 72
ANNEX A: DATA LIST OF SPATIAL INFORMATION COMPILED AND UTILIZED FOR THIS ASSESMENT
TYPE OVERVIEW SHAPEFILE NAME DATA ORIGINATOR
Transportation Assets
railways JAM_rails Ministry of Transport and Mining
roads overall JAM_roads National Works Agency
Main Roads Condition survey
MainRoadsCondition2011 National Works Agency
bridge inventory Bridges National Works Agency
ports Ports Ministry of Transport and Mining
main JUTC routes Premium outbound, portmore outbound, rockford outbound, Twcikenham
JUTC
airports Airports Ministry of Transport and Mining
Environmental Factors
climate ja_geoclimate
Geology and Mines hydrogelology ja_hydrogeology
soils Jamaica_soil_classification
elevation SRTM NASA
Hydrology and Floodplains
watersheds watersheds
Water Resources Authority
rivers rivers
flood-prone places from WRA
flood_prone_places
flood-prone road sections
wra_flood_prone_main_Roads
location of landslides and floods
disaster_locations
Black River
uppermorass_10yr_flood
uppermorass_25yr_flood
uppermorass_50yr_flood
uppermorass_100yr_flood
Hope River hope_river_100yrboundary
Manchional River 25_yrFlood
100_yrFlood
Morant River
25_yrFlood
100_yrFlood
Morant_25_river_surge
Morant_50_river_surge
Morant_100_river_surge
Manch River
Manch_25_river_surge
Manch_50_river_surge
Manch_100_river_surge
Nightengale_Gove bushypark_10yrFlood
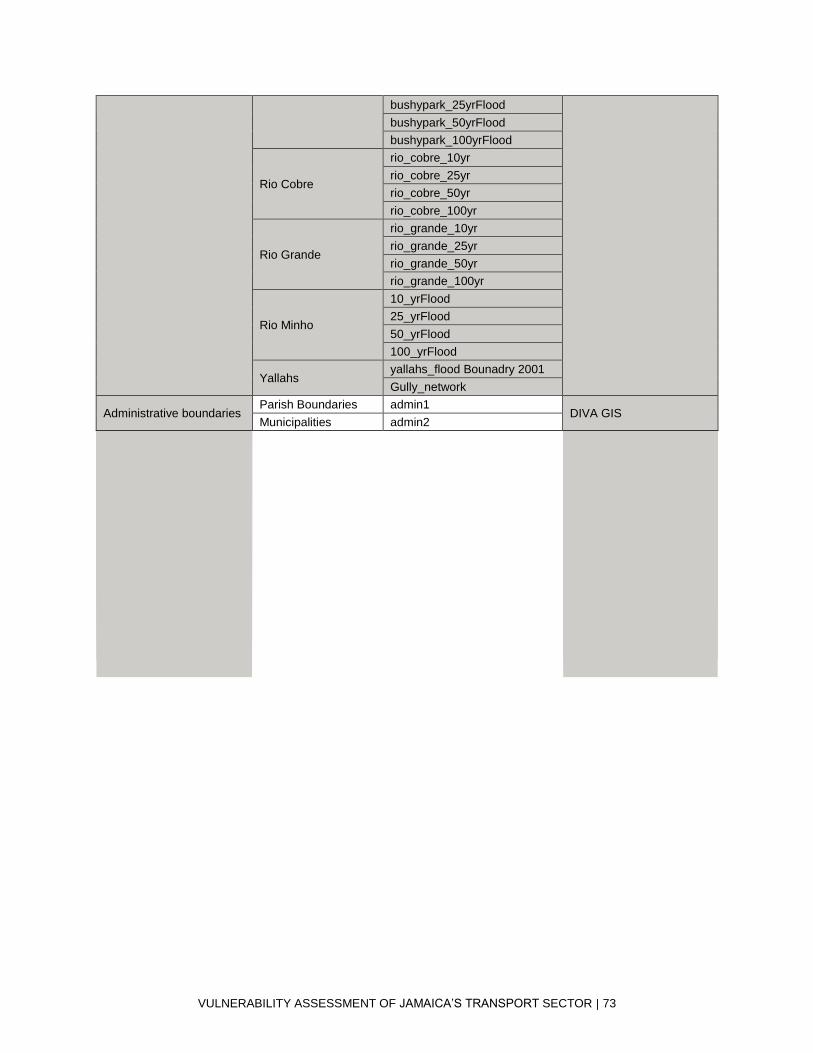
VULNERABILITY ASSESSMENT OF JAMAICA’S TRANSPORT SECTOR | 73
bushypark_25yrFlood
bushypark_50yrFlood
bushypark_100yrFlood
Rio Cobre
rio_cobre_10yr
rio_cobre_25yr
rio_cobre_50yr
rio_cobre_100yr
Rio Grande
rio_grande_10yr
rio_grande_25yr
rio_grande_50yr
rio_grande_100yr
Rio Minho
10_yrFlood
25_yrFlood
50_yrFlood
100_yrFlood
Yallahs yallahs_flood Bounadry 2001
Gully_network
Administrative boundaries Parish Boundaries admin1
DIVA GIS Municipalities admin2
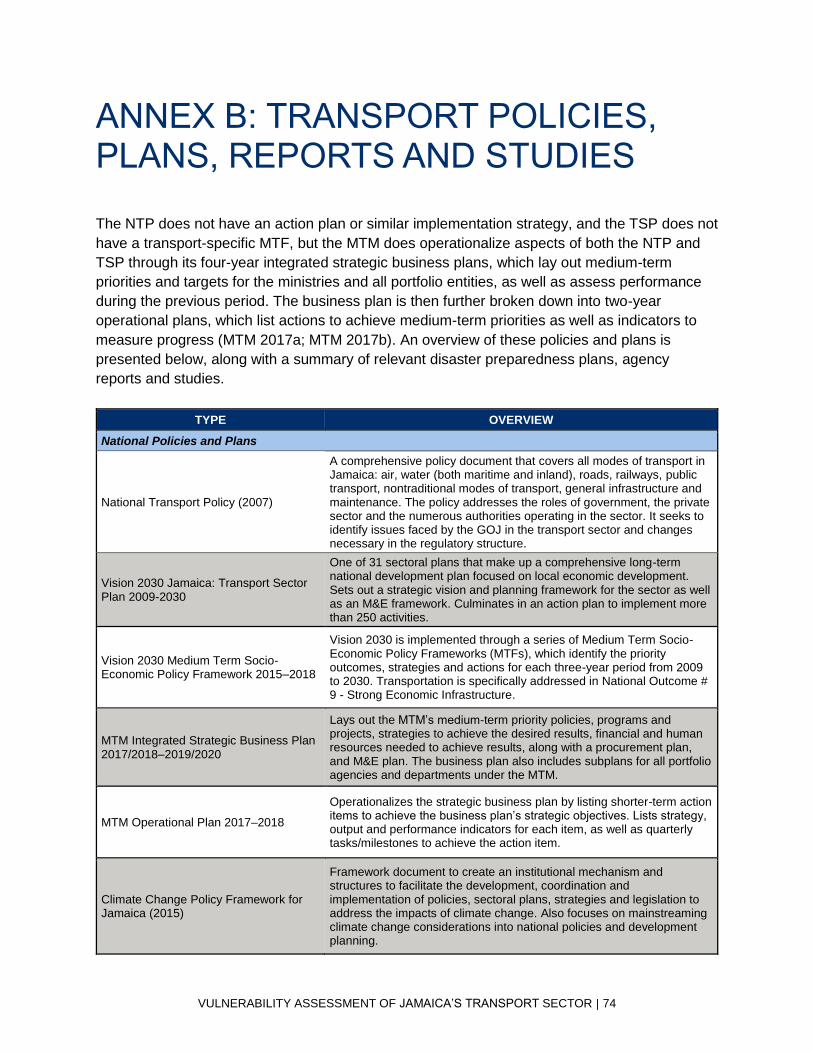
VULNERABILITY ASSESSMENT OF JAMAICA’S TRANSPORT SECTOR | 74
ANNEX B: TRANSPORT POLICIES, PLANS, REPORTS AND STUDIES
The NTP does not have an action plan or similar implementation strategy, and the TSP does not
have a transport-specific MTF, but the MTM does operationalize aspects of both the NTP and
TSP through its four-year integrated strategic business plans, which lay out medium-term
priorities and targets for the ministries and all portfolio entities, as well as assess performance
during the previous period. The business plan is then further broken down into two-year
operational plans, which list actions to achieve medium-term priorities as well as indicators to
measure progress (MTM 2017a; MTM 2017b). An overview of these policies and plans is
presented below, along with a summary of relevant disaster preparedness plans, agency
reports and studies.
TYPE OVERVIEW
National Policies and Plans
National Transport Policy (2007)
A comprehensive policy document that covers all modes of transport in Jamaica: air, water (both maritime and inland), roads, railways, public transport, nontraditional modes of transport, general infrastructure and maintenance. The policy addresses the roles of government, the private sector and the numerous authorities operating in the sector. It seeks to identify issues faced by the GOJ in the transport sector and changes necessary in the regulatory structure.
Vision 2030 Jamaica: Transport Sector Plan 2009-2030
One of 31 sectoral plans that make up a comprehensive long-term national development plan focused on local economic development. Sets out a strategic vision and planning framework for the sector as well as an M&E framework. Culminates in an action plan to implement more than 250 activities.
Vision 2030 Medium Term Socio-Economic Policy Framework 2015–2018
Vision 2030 is implemented through a series of Medium Term Socio-Economic Policy Frameworks (MTFs), which identify the priority outcomes, strategies and actions for each three-year period from 2009 to 2030. Transportation is specifically addressed in National Outcome # 9 - Strong Economic Infrastructure.
MTM Integrated Strategic Business Plan 2017/2018–2019/2020
Lays out the MTM’s medium-term priority policies, programs and projects, strategies to achieve the desired results, financial and human resources needed to achieve results, along with a procurement plan, and M&E plan. The business plan also includes subplans for all portfolio agencies and departments under the MTM.
MTM Operational Plan 2017–2018
Operationalizes the strategic business plan by listing shorter-term action items to achieve the business plan’s strategic objectives. Lists strategy, output and performance indicators for each item, as well as quarterly tasks/milestones to achieve the action item.
Climate Change Policy Framework for Jamaica (2015)
Framework document to create an institutional mechanism and structures to facilitate the development, coordination and implementation of policies, sectoral plans, strategies and legislation to address the impacts of climate change. Also focuses on mainstreaming climate change considerations into national policies and development planning.

VULNERABILITY ASSESSMENT OF JAMAICA’S TRANSPORT SECTOR | 75
TYPE OVERVIEW
Disaster Preparedness, Prevention and Response
National Disaster Action Plan (1997)
Provides detailed administrative and operational information and instructions for disaster preparedness, operations and training. Also details the responsibilities of government agencies and government officers, including the makeup and functions of the National Emergency Operations Centre.
National Hazard Risk Reduction Policy for Jamaica (2005)
Provides a framework for integrating hazard mitigation into policies, programs and plans at the national and community levels. Defines the broad goals and guiding principles for hazard risk reduction to inform the development of national and sectoral hazard mitigation plans.
Transport Sector Hazard Mitigation Strategy
Currently under development by NWA; intended to be a mitigation strategy to limit the adverse impact of natural, environmental or technological disasters on the country’s road transport network.
Transport Sector Disaster Management Contingency Plan
Currently under development by NWA; intended to be a disaster response strategy to maintain the continuing functioning of the country’s main road network following natural disasters or catastrophic events.
Reports
Airports Authority of Jamaica Annual Report 2015–2016
Provides fiscal year report on passenger and cargo movement, airport operations, commercial development and financial performance. Also provides detailed audited financial statement for the year.
National Works Agency Annual Report 2009–2010
Provides fiscal year report on key performance indicators, priority program and project achievements, road and bridge maintenance and status, studies and tests conducted, and human resources development. Also provides detailed audited financial statement for the year.
Port Authority of Jamaica Annual Report 2015–2016
Provides fiscal year report on cargo and cruise ship movement, port operations, financial performance, commercial development and corporate governance. Also provides detailed audited financial statement for the year.
Transportation Authority Annual Report 2014–2015
Provides fiscal year report on corporate governance, major program highlights, financial performance and key performance indicators. Also provides detailed audited financial statement for the year.
Studies
Master Drainage Plan A countrywide drainage plan to relieve flooding problems within identified problem areas. Plan is currently finalized but not yet implemented.
Assessment of the Socio-Economic and Environmental Impact of Natural Disasters
Studies conducted by PIOJ on impacts of numerous storms, including Hurricane Ivan, Hurricane Dennis, Hurricane Emily, Hurricane Wilma, Hurricane Dean, Tropical Storm Gustav and Hurricane Sandy.
Assessment of the Impact of Floods and Landslides on the Jamaican Transport Infrastructure
An assessment commissioned by the World Bank to conduct flood and landslide modeling and assess the effect on road infrastructure, communities and the economy.
Frequency analysis, infilling and trends for extreme precipitation for Jamaica (1895–2100)
A study conducted by UWI Mona faculty to update intensity duration frequency (IDF) curves for Jamaica.
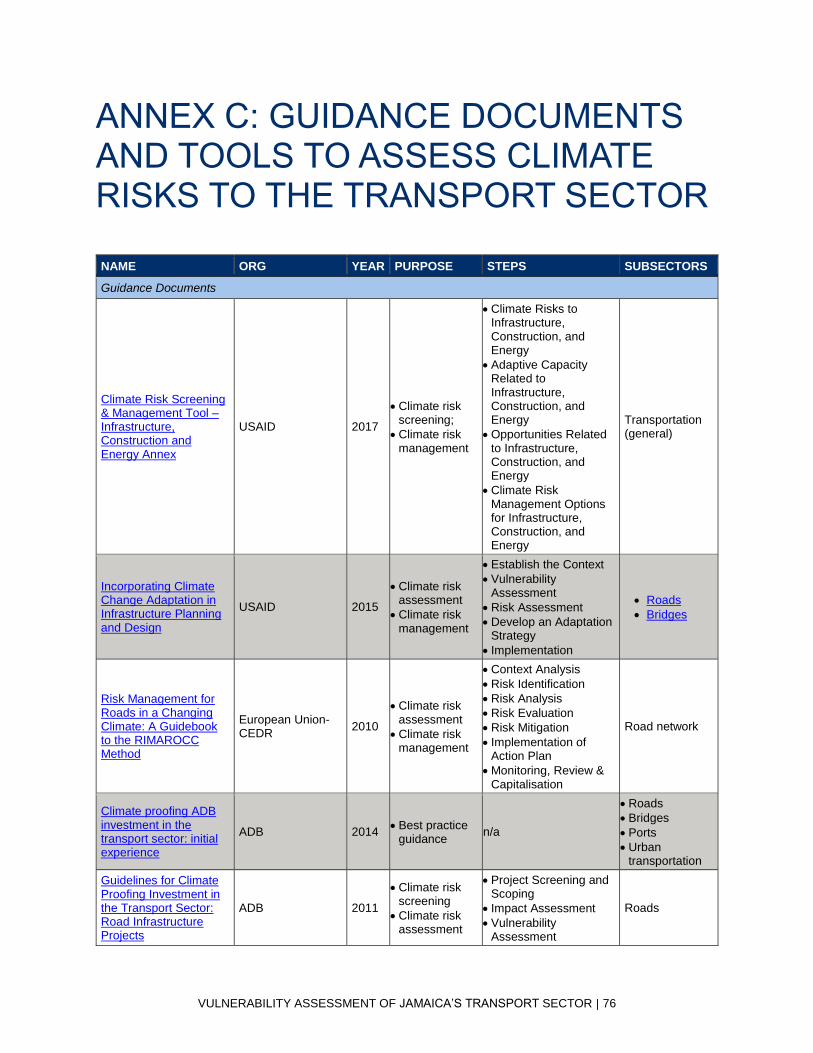
VULNERABILITY ASSESSMENT OF JAMAICA’S TRANSPORT SECTOR | 76
ANNEX C: GUIDANCE DOCUMENTS AND TOOLS TO ASSESS CLIMATE RISKS TO THE TRANSPORT SECTOR
NAME ORG YEAR PURPOSE STEPS SUBSECTORS
Guidance Documents
Climate Risk Screening & Management Tool – Infrastructure, Construction and Energy Annex
USAID 2017
• Climate risk screening;
• Climate risk management
• Climate Risks to Infrastructure, Construction, and Energy
• Adaptive Capacity Related to Infrastructure, Construction, and Energy
• Opportunities Related to Infrastructure, Construction, and Energy
• Climate Risk Management Options for Infrastructure, Construction, and Energy
Transportation (general)
Incorporating Climate Change Adaptation in Infrastructure Planning and Design
USAID 2015
• Climate risk assessment
• Climate risk management
• Establish the Context
• Vulnerability Assessment
• Risk Assessment
• Develop an Adaptation Strategy
• Implementation
• Roads
• Bridges
Risk Management for Roads in a Changing Climate: A Guidebook to the RIMAROCC Method
European Union-CEDR
2010
• Climate risk assessment
• Climate risk management
• Context Analysis
• Risk Identification
• Risk Analysis
• Risk Evaluation
• Risk Mitigation
• Implementation of Action Plan
• Monitoring, Review & Capitalisation
Road network
Climate proofing ADB investment in the transport sector: initial experience
ADB 2014 • Best practice
guidance n/a
• Roads
• Bridges
• Ports
• Urban transportation
Guidelines for Climate Proofing Investment in the Transport Sector: Road Infrastructure Projects
ADB 2011
• Climate risk screening
• Climate risk assessment
• Project Screening and Scoping
• Impact Assessment
• Vulnerability Assessment
Roads
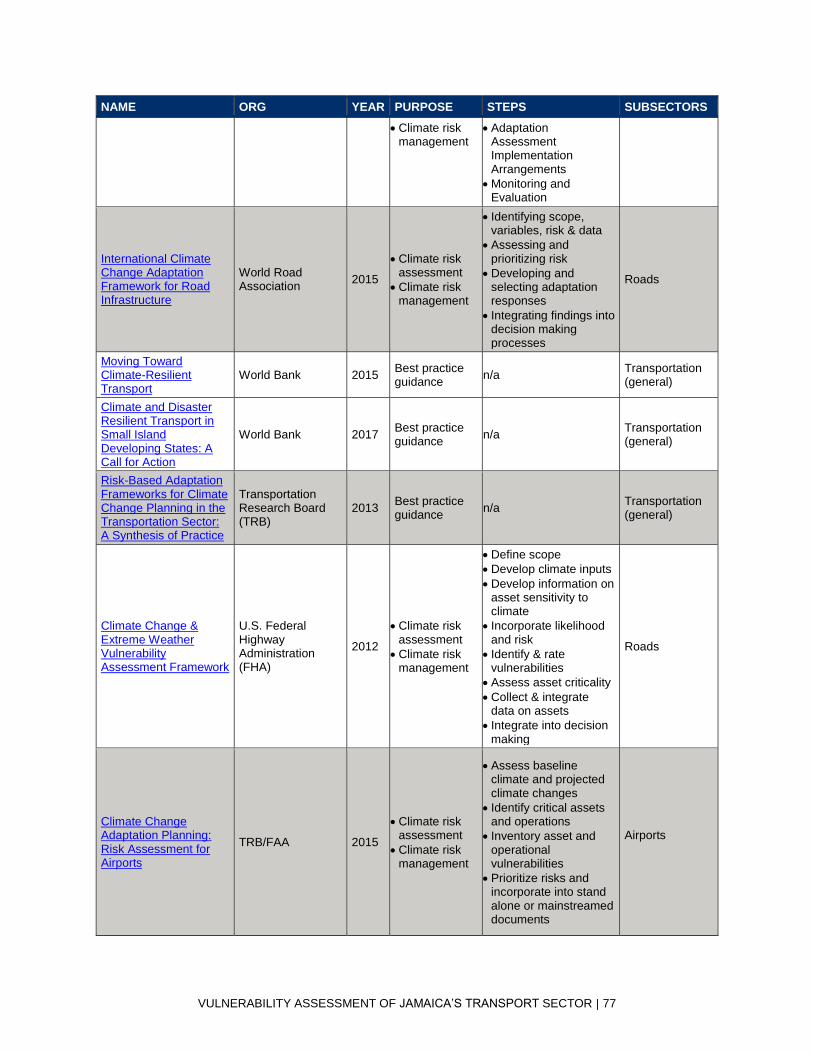
VULNERABILITY ASSESSMENT OF JAMAICA’S TRANSPORT SECTOR | 77
NAME ORG YEAR PURPOSE STEPS SUBSECTORS
• Climate risk management
• Adaptation Assessment Implementation Arrangements
• Monitoring and Evaluation
International Climate Change Adaptation Framework for Road Infrastructure
World Road Association
2015
• Climate risk assessment
• Climate risk management
• Identifying scope, variables, risk & data
• Assessing and prioritizing risk
• Developing and selecting adaptation responses
• Integrating findings into decision making processes
Roads
Moving Toward Climate-Resilient Transport
World Bank 2015 Best practice guidance
n/a Transportation (general)
Climate and Disaster Resilient Transport in Small Island Developing States: A Call for Action
World Bank 2017 Best practice guidance
n/a Transportation (general)
Risk-Based Adaptation Frameworks for Climate Change Planning in the Transportation Sector: A Synthesis of Practice
Transportation Research Board (TRB)
2013 Best practice guidance
n/a Transportation (general)
Climate Change & Extreme Weather Vulnerability Assessment Framework
U.S. Federal Highway Administration (FHA)
2012
• Climate risk assessment
• Climate risk management
• Define scope
• Develop climate inputs
• Develop information on asset sensitivity to climate
• Incorporate likelihood and risk
• Identify & rate vulnerabilities
• Assess asset criticality
• Collect & integrate data on assets
• Integrate into decision making
Roads
Climate Change Adaptation Planning: Risk Assessment for Airports
TRB/FAA 2015
• Climate risk assessment
• Climate risk management
• Assess baseline climate and projected climate changes
• Identify critical assets and operations
• Inventory asset and operational vulnerabilities
• Prioritize risks and incorporate into stand alone or mainstreamed documents
Airports

VULNERABILITY ASSESSMENT OF JAMAICA’S TRANSPORT SECTOR | 78
NAME ORG YEAR PURPOSE STEPS SUBSECTORS
Climate change adaptation guidelines for ports
National Climate Change Adaptation Research Facility
2013
• Climate risk assessment
• Climate risk management
• Establish the port context
• Identify current vulnerabilities and future risks
• Analyse and evaluate risks
• Identify and prioritise adaptation options
• Monitoring and evaluation
Ports
Tools
Climate Risk Screening & Management Tool
USAID 2017 Climate risk screening
Airport Climate Risk Operational Screening (ACROS) tool
TRB 2015 Climate risk screening
Sensitivity Matrix for Modes of Transportation
FHA 2012 Climate risk screening
Climate & Disaster Risk Screening Tools – Roads Projects
World Bank 2017 Climate risk screening
Aware Acclimatise 2017 Climate risk screening
SimCLIM CLIM Systems 2017
• Climate modeling
• Climate risk assessment
Caribbean Climate Online Risk and Adaptation tool (CCORAL)
Caribbean Community Climate Change Centre
2013 Climate risk screening

U.S. Agency for International Development 1300 Pennsylvania Avenue, NW
Washington, DC 20523 Tel: (202) 712-0000 Fax: (202) 216-3524
www.usaid.gov


