VSSLI presentation: Building Guided Pathways
27
BUILDING GUIDED PATHWAYS: MDC’S SHARK PATH VSSLI Meeting November 10, 2015 1
Transcript of VSSLI presentation: Building Guided Pathways

BUILDING GUIDED PATHWAYS: MDC’S SHARK PATH
VSSLI MeetingNovember 10, 2015
1

Agenda• Overview• Getting Started• Strategies andSuccess
Indicators • Lessons Learned
2

Miami Dade College: A Brief OverviewThe challenges of a large, urban and diverse institution
• 7 campuses and 3 centers• ~70K degree seeking students
• 90% minority• 67% low income• 70% employed
• Historically, more than half placed into at least one level of Dev Ed• Completion rates ranging from13-39% when we began
3

Aggressive College-wide Goals
Improve student outcomes • Starting off right• Success in first semester and first year • Increased persistence, retention and completion
Build organizational capacity and flexibility• Drive action and results• Create and sustain cultural change
Our strategy: Shark Path
4

5
Our Strategy: Shark Path Integrated academic and student services support
from high school through graduation and transfer/employment
Course Sequence
Guides
New Advising Model
Early Alerts and
Interven-tions
Co-Curricular Engage-
ment
Commun-ities of Interest

Getting Started
6

Getting Started
From the start, centralized responsibility and accountability under umbrella of Student Achievement Initiatives (SAI)• Structuring the work• Facilitating engagement and output• Infusing data and feedback• Sustaining energy and momentum
Initially, campus teams with broad faculty and staff representation (~120 people)• Analyzed data• Determined common barriers • Identified best practice solutions, internally and nationwide
7

Moving to ImplementationWithin 4 months, evolved to college-wide problem-solving
• Cross campus, discipline and department design teams• Priorities
• Scale• Speed• What we could control
After just a few more months, moved to implementation• Focus: on-boarding and first semester• At scale from the start (~8400 students in first cohort)• Version 1.0—intentionally!
8

Advantages of Early ImplementationStudents benefit
• Orientation• No late registration• Assigned advisors
Solutions get better• Learning what works• Data-informed improvement
Teams get stronger• Empowerment• Smart risk taking• Trust
9

Flexible Organizational StructureTeams change and evolve based on
• Initiative focus• Stage (design, implementation, assessment)• Individual commitment
More than half of all faculty and staff have participated actively in designing and/or delivering new academic and student services
SAI teams set new standards for• Comprehensive, strategic problem-solving• Inclusiveness• Action• Productivity• Effectiveness
10
Strategies and Success IndicatorsAcademic Maps
Three-Tiered Advising
11

Academic Maps: StrategiesSimple and clear description of courses and course sequences
• Required for graduation• Required for admission into baccalaureate programs at most
common transfer institutions• In logical order to build pre-requisite skills and competencies,
including Dev Ed on-rampsDeveloped by faculty-led teams
• Robust discussion of recommended courses• Reviewed by advisors for “user-friendliness”
Translated into individual MAPS by advisors based on• Starting point in math and English• Transfer institution choice• Life issues
12

Academic Maps: Success IndicatorsOperational for programs of study representing ~80% student
populationRevised recently for
• Math tracks (Algebra vs non-Algebra)• New Gen Ed requirements
Enrollment in college-level math, English and first program of study courses up 15-25%• Impact on demand for other courses
Highlight need for more cross-discipline discussions about pathways• Unintended consequences of “recommended electives”
Create foundation for next-level discussions about teaching and learning
13

Tier 1: Pre- College Advising: Strategies
Pro-active outreach and case management• Connecting HS career academies to MDC programs• Target reminders about registration requirements• Scholarship opportunities• Shark Academy summer enrichment program
Relevant on-campus events and workshops• Financial Aid• Program of Study• Career Exploration
Collaboration with academic affairs for recruitment
14

On-site advising at 53 high schools covering 88% enrollmentModel “proven-in”
• Applications increased 22% since 2012• Enrollment increased 10% over same period, offset declining
enrollment in other populations• High schools with PCAs have a 56% conversion rate, compared to
52% overallAdditional resources added recently
• Expand to other populations • Expand career assessment and exploration
15
Pre- College Advising: Success Indicators

Tier 2: First Year Advising: Strategies Before mandatory campus orientation
• Non-cognitive diagnostic• On-line orientation
At Shark Start orientation• Meet assigned advisor• Discuss placement recommendations and course selection• Register for first semester
During first semester advising• Confirm program of study and transfer institution• Complete MAP• Discuss non-cognitive issues
16
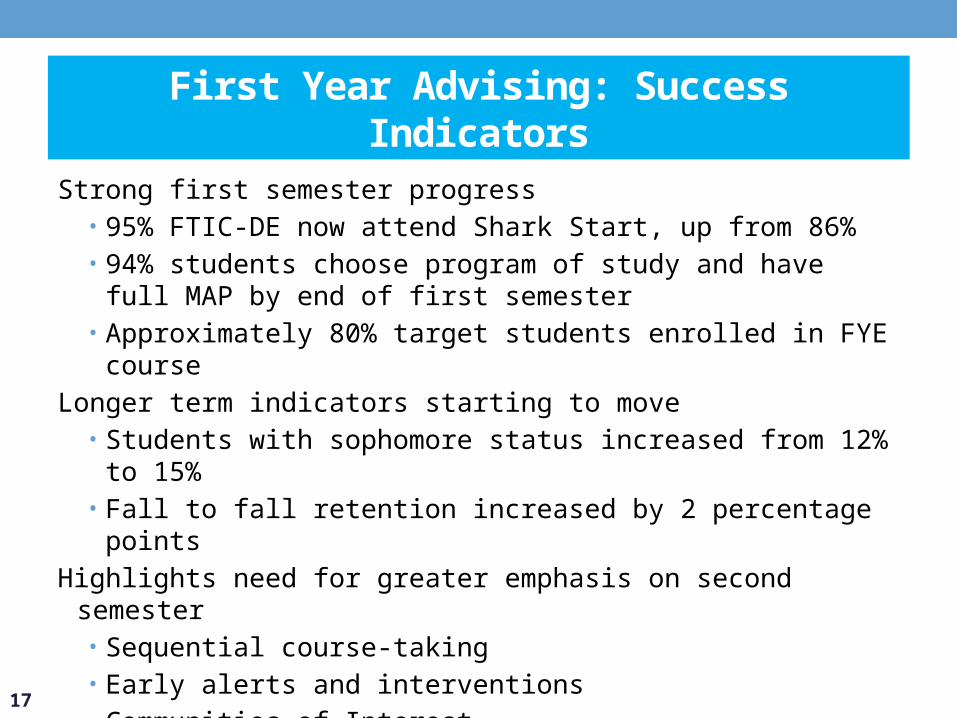
First Year Advising: Success IndicatorsStrong first semester progress
• 95% FTIC-DE now attend Shark Start, up from 86% • 94% students choose program of study and have full MAP by end
of first semester • Approximately 80% target students enrolled in FYE course
Longer term indicators starting to move• Students with sophomore status increased from 12% to 15%• Fall to fall retention increased by 2 percentage points
Highlights need for greater emphasis on second semester• Sequential course-taking• Early alerts and interventions• Communities of Interest
17

Tier 3: College Mentoring Strategies
In-depth career and transfer advising for students at 25%+ benchmark• Progress monitoring and intervention• Internship and community engagement • Career planning and guidance• Transfer institution selection and application
Mentors include faculty, departmental advisors and academic chairs• More than 320 volunteer mentors, including ~45% of full time
faculty • All participate in intensive training and development • “Buddy” relationship and support with Student Services
18

Almost 17,000 students transitioned to date• Strong support and feedback from students
But, student participation is low—not mandatory!• Outreach/awareness campaign rolled out in fall 2015• “Level up to CM status” celebration events college-wide• Registration hold for students in academic difficulty
Supporting faculty enthusiasm• Expanded professional development, especially career
exploration• College Mentoring Fellowship for active research
19
College Mentoring: Success Indicators

Lessons Learned
20

What we learnedLesson 1
Moving the needle on student success takes time• Cumulative impact of a system of strategies, processes,
interventions and structures
After 3 years, most leading indicators moving in the right direction• But no meaningful movement in retention or benchmark
achievement yet
21

What we learned Lesson 2
Improving student success is an on-going, iterative process•There is no perfect solution
We learn best by doing the work• Best practices identified and proven• Broad and deep scale is required • Success is defined by execution: “the devil is in the details”• People own what they create
22

What we learned Lesson 3
Significant progress can be made without a lot of new investment
Re-allocate existing resources strategically• Focus on what we can influence/control• Stop doing low value-add activities• “Prove-in” new models and ways of doing business first—before
adding people or technology
23

What we learnedLesson 4
Measuring progress regularly and routinely drives learning and improvement
• Structured methodologies, tools and templates• Clear metrics/KPIs• Timely assessments and data sharing• Operational decision-making vs reporting data • Data in every discussion
24

What we learnedLesson 5
Success and sustainability require organizational strength• Broad and inclusive engagement, collaboration and learning• Culture of inquiry and innovation• Capacity, flexibility and adaptability• Tolerance for risk, uncertainty and setbacks
Building organizational capacity is also iterative: it requires intentionality, nurturing and time
25

What we learnedLesson 6
Strategic, on-going professional development is necessary to change a culture
• Practical, hands-on strategies for daily interactions• Structured opportunities to leverage discrete strategies into
integrated solutions• Collaborative problem solving
At MDC, 15 minutes of training for every hour of service delivery over first two years
26
Summary
Build the foundation for student success: Just do it!Big
UrgentInclusive
Leadership at all LevelsData-informed
27