vSignalyzer: Efficiently Analyze Your Measured Data · vSignalyzer: Efficiently Analyze Your...
22
V0.1 | 2018-08-20 Dr. Alexander Sundt vSignalyzer: Efficiently Analyze Your Measured Data
Transcript of vSignalyzer: Efficiently Analyze Your Measured Data · vSignalyzer: Efficiently Analyze Your...

V0.1 | 2018-08-20
Dr. Alexander Sundt
vSignalyzer: Efficiently Analyze Your Measured Data
2
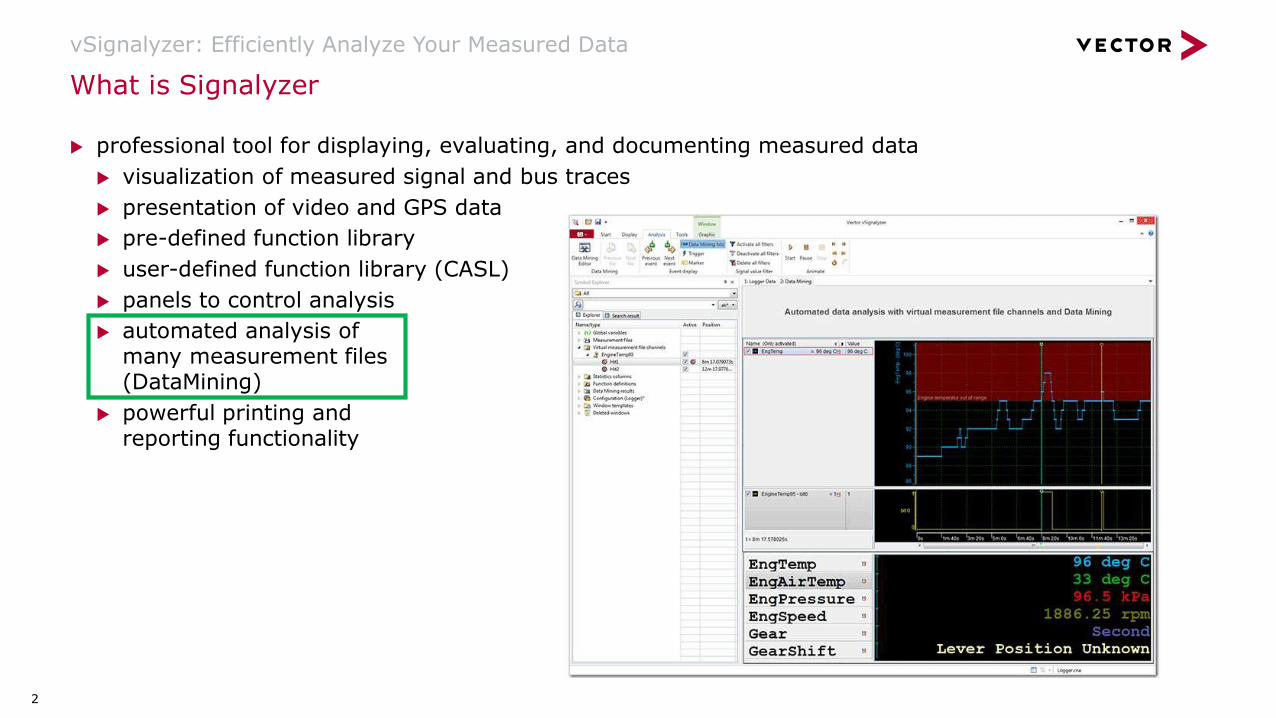
professional tool for displaying, evaluating, and documenting measured data
visualization of measured signal and bus traces
presentation of video and GPS data
pre-defined function library
user-defined function library (CASL)
panels to control analysis
automated analysis of many measurement files (DataMining)
powerful printing and reporting functionality
What is Signalyzer
vSignalyzer: Efficiently Analyze Your Measured Data

3
Re-Use of Visual Configuration
vSignalyzer: Efficiently Analyze Your Measured Data
Re-Use CANape and vMeasure exp configuration with vSignalyzer
Use the measurement project as a starting point for your offline analysis
Same graphic layout, same scripts and calculation algorithm
Your advantage at a glance:
Save time to recreate visual representation of measurement values and signals
Calculation algorithm consistent with measurement
Save money
CANapevMeasure
expvSignalyzer

4
Data Sources
vSignalyzer: Efficiently Analyze Your Measured Data
MDF
vSignalyzer
CSV
BLF ASC
AVI
LOG, ASCII, ATF, CC3, CLF, CSV, GLX, GPX, KME, NMEA 0183, UBX, PCAP, TTL, XLG
MAT 7.3XLSXLSX
INCA DAT
HDF5
Native support of:MDF 3.x, MDF 4.x, INCA dat, XLS, XLSX, MAT 7.3, and HDF5.
Support of large measurement files
Quick loading of measurement files

5
Data Sources
vSignalyzer: Efficiently Analyze Your Measured Data
Native support of:MDF 3.x, MDF 4.x, INCA dat, XLS, XLSX, MAT 7.3, and HDF5.
Support of large measurement files
Quick loading of measurement files
Fast responding preview to configure display window
Calculation of envelope curve complete
Windows stay accessible during background calculations.
Windows can be configured while data is still loaded from the file.
Additional operations can be executed in vSignalyzer, e.g. creatingmore display windows
6
Visualization
vSignalyzer: Efficiently Analyze Your Measured Data
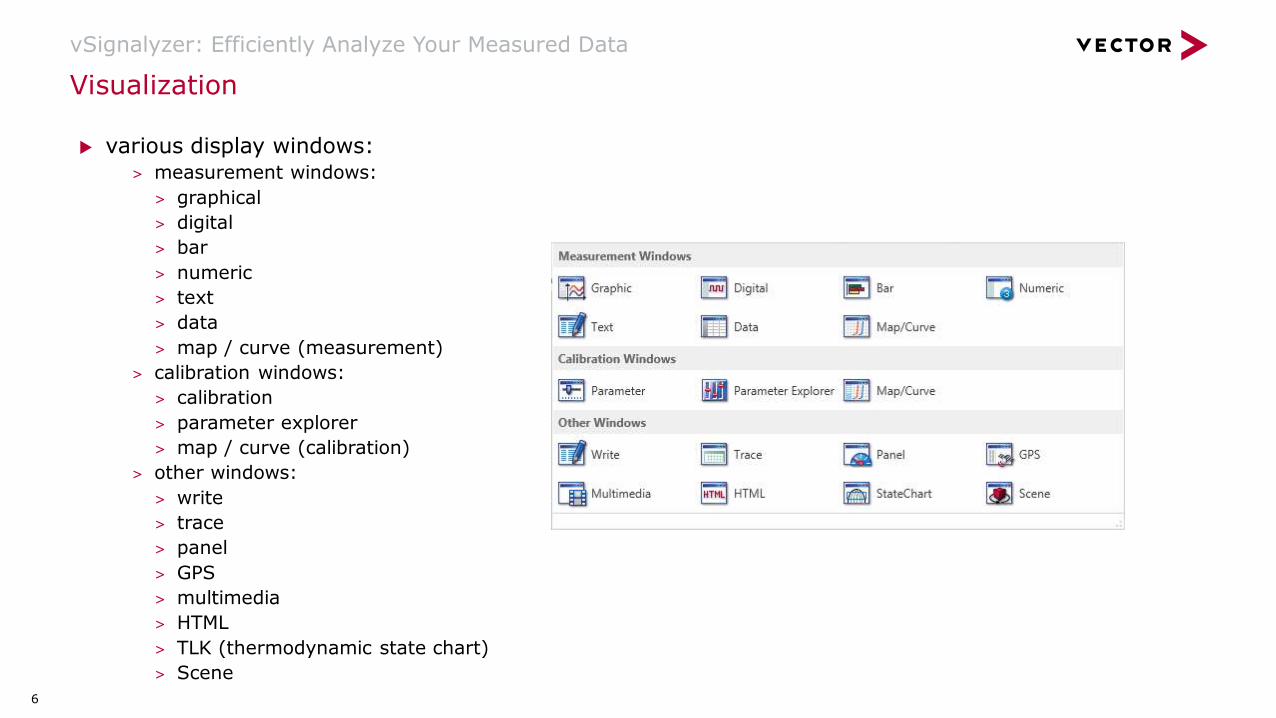
various display windows:> measurement windows:
> graphical
> digital
> bar
> numeric
> text
> data
> map / curve (measurement)
> calibration windows:
> calibration
> parameter explorer
> map / curve (calibration)
> other windows:
> write
> trace
> panel
> GPS
> multimedia
> HTML
> TLK (thermodynamic state chart)
> Scene

7
Visualization
vSignalyzer: Efficiently Analyze Your Measured Data
drag & drop a signal to free space Choose window type for list of supported windows
Only windows supporting the datatype of the signal are suggested

8
Visualization
vSignalyzer: Efficiently Analyze Your Measured Data
vSignalyzer can display multimedia signals, for instance videos.
If the video was recorded with CANape or vMeasure it is automatically synchronized to other measurement signals
If video was recorded with other software you may have to explicitly shift it in time with respect to other measurement data (start time of measurement data and video may differ)
9
Visualization
vSignalyzer: Efficiently Analyze Your Measured Data
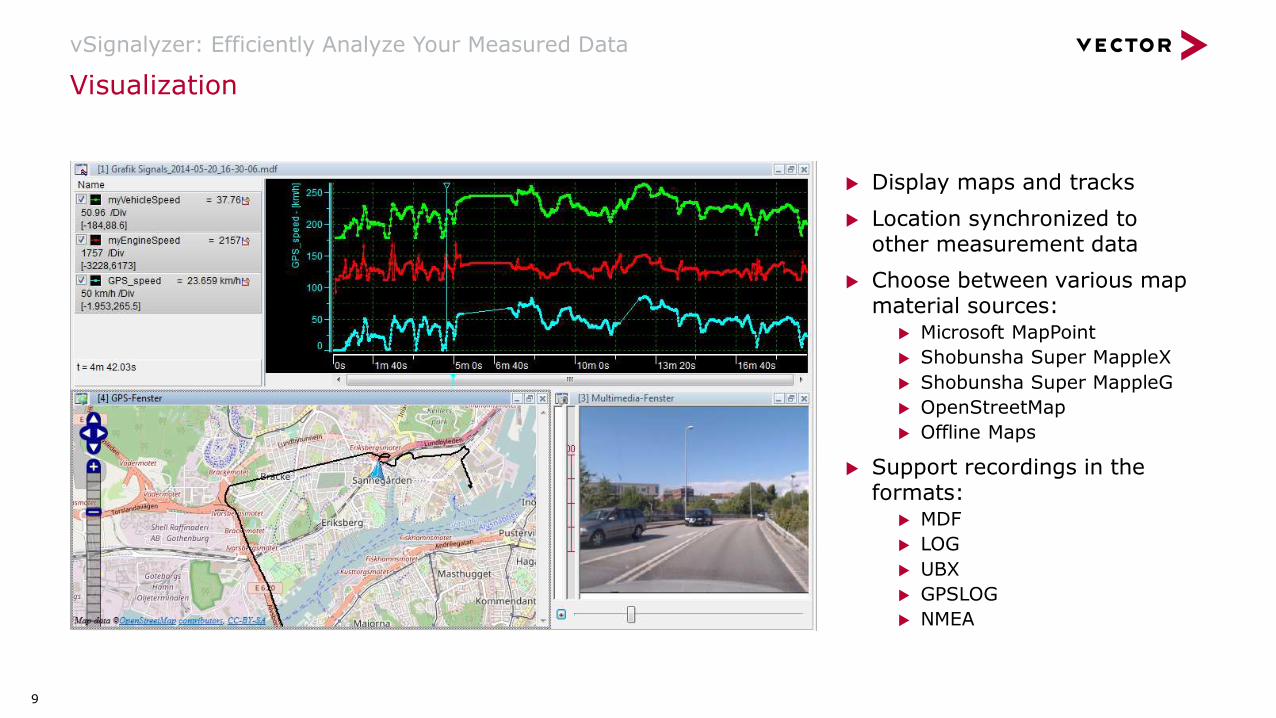
Display maps and tracks
Location synchronized to other measurement data
Choose between various map material sources:
Microsoft MapPoint
Shobunsha Super MappleX
Shobunsha Super MappleG
OpenStreetMap
Offline Maps
Support recordings in the formats:
MDF
LOG
UBX
GPSLOG
NMEA

10
Visualization
vSignalyzer: Efficiently Analyze Your Measured Data
Thermodynamic state charts based on the material library TILMedia for TLK-Thermo GmbH
Various chart types available: Pressure- enthalpy (pH)
Pressure- specific volume (pV)
Pressure- temperature (pT)
Temperature- enthalpy (TH)
Temperature- entropy (TS)

11
Printing and Reporting
vSignalyzer: Efficiently Analyze Your Measured Data
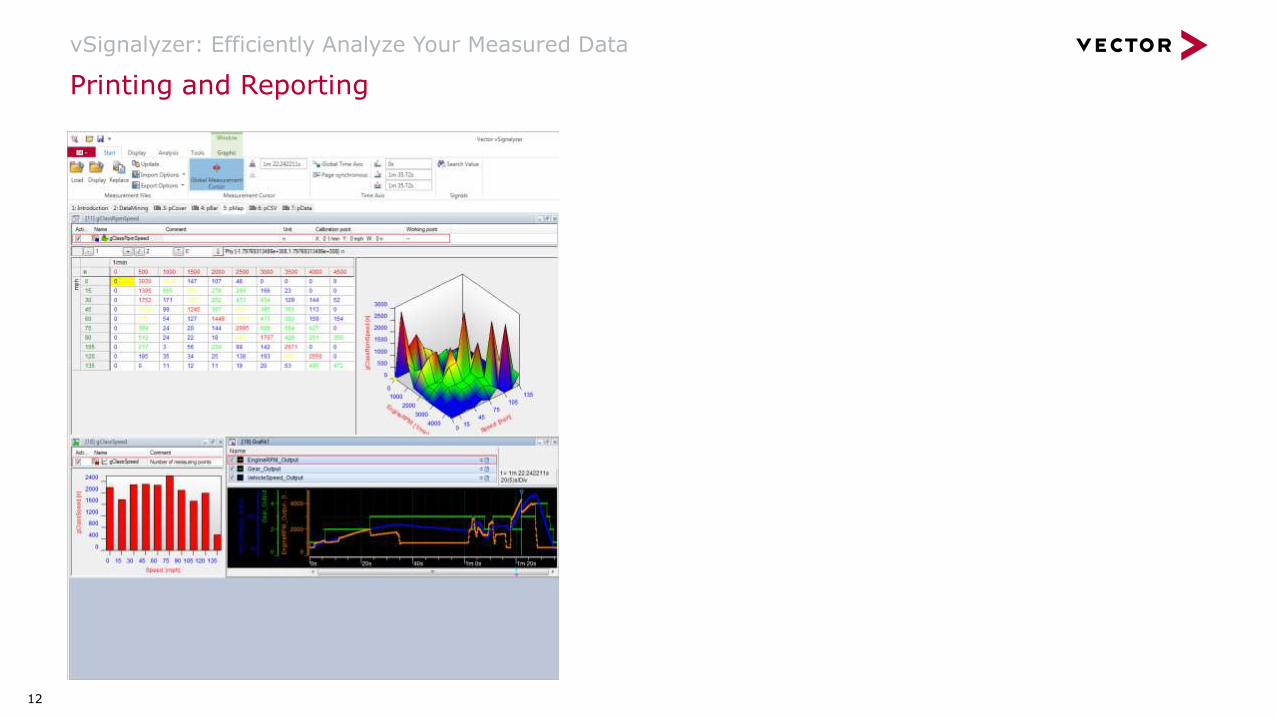
Drag and drop of windows or the complete page directly into office documents (like PowerPoint and Word) or to the desktop ...
Available export formats:
emf, png, jpg, gif, and bmp
Drag and drop, colors are changed automatically
12
Printing and Reporting
vSignalyzer: Efficiently Analyze Your Measured Data
13
Printing and Reporting
vSignalyzer: Efficiently Analyze Your Measured Data
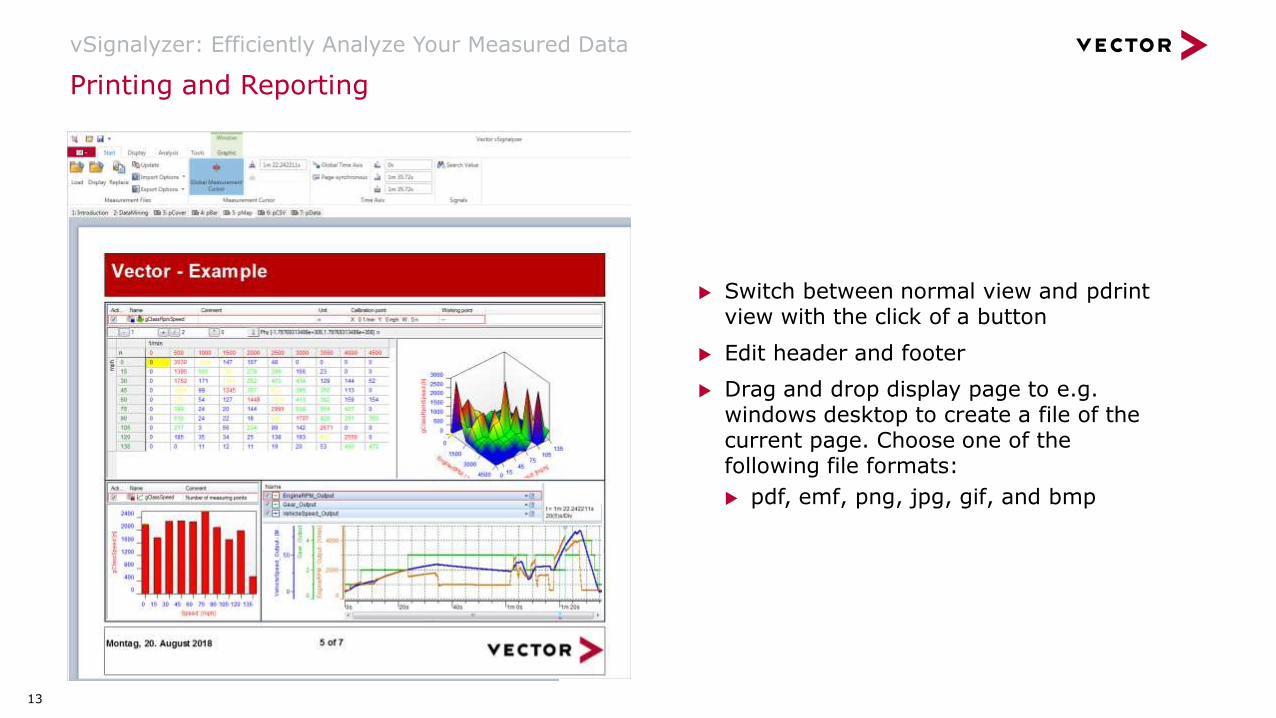
Switch between normal view and pdrintview with the click of a button
Edit header and footer
Drag and drop display page to e.g. windows desktop to create a file of the current page. Choose one of the following file formats:
pdf, emf, png, jpg, gif, and bmp
14
Printing and Reporting
vSignalyzer: Efficiently Analyze Your Measured Data
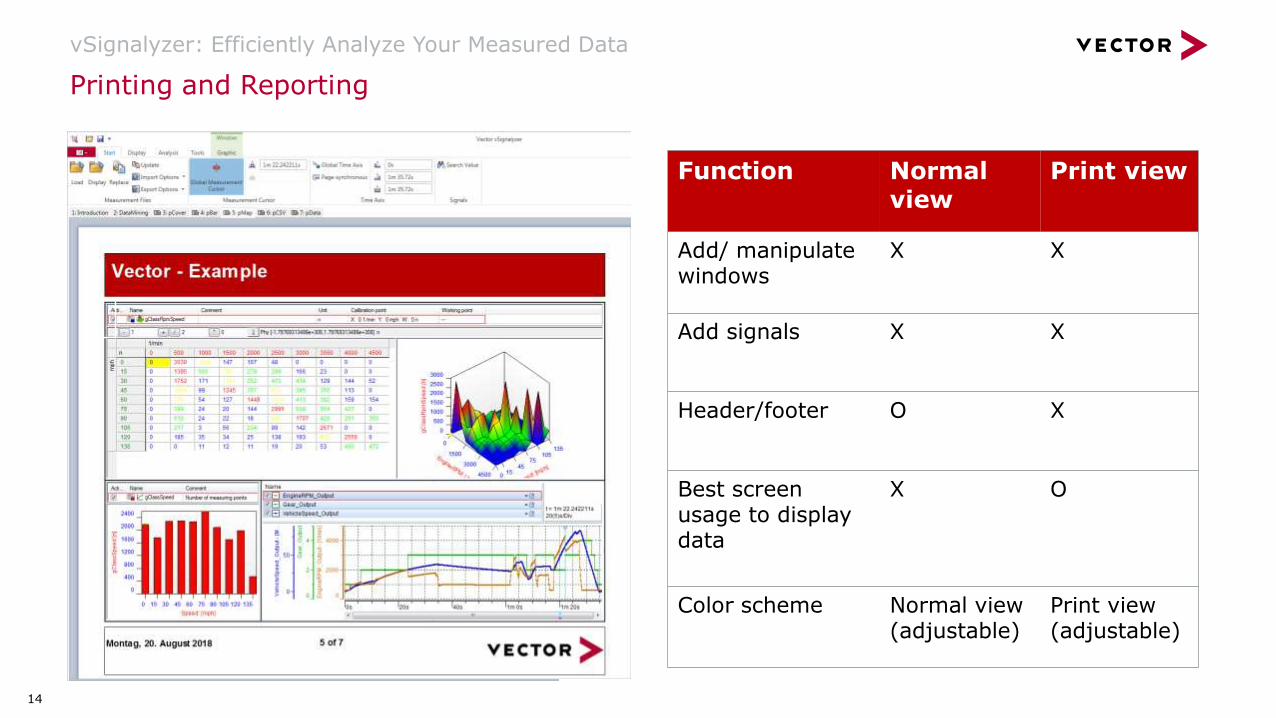
Function Normal view
Print view
Add/ manipulate windows
X X
Add signals X X
Header/footer O X
Best screen usage to display data
X O
Color scheme Normal view (adjustable)
Print view (adjustable)
15
Calculation
vSignalyzer: Efficiently Analyze Your Measured Data
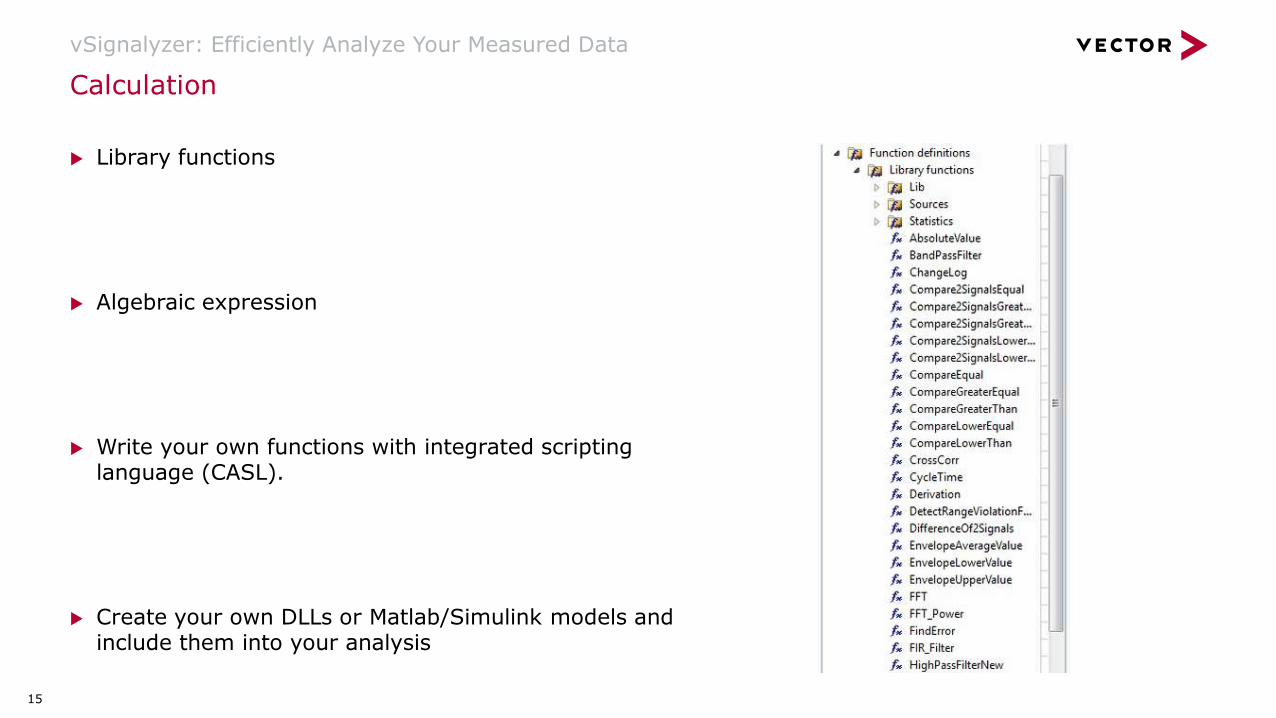
Library functions
Algebraic expression
Write your own functions with integrated scripting language (CASL).
Create your own DLLs or Matlab/Simulink models and include them into your analysis

16
Calculation
vSignalyzer: Efficiently Analyze Your Measured Data
Compute calculation of signals with different sampling rates
User can set the time raster of the calculated signals the way he wants: based on one of the raster of one of the input signals, of all input signal, or based on a fixed given time raster
No need to manually calculate intermediate values for the input signals for the same time stamp
Only actual measured values are used for calculation
Calculated signal (blue) has values for
all time stamp of both input signals (red and yellow).

18
Automatization
vSignalyzer: Efficiently Analyze Your Measured Data
vSignalyzer can be automated using scripts
Some examples for scripting in vSignalyzer:
Accumulate data over a set of file
Repeat an analysis for all files in a directory
Create a PDF report after the analysis has finished
Split measurement files
Repeat an analysis with different parameters
Initialize variables with starting of project
…
Almost all user-interaction with vSignalyzer can be automatized!

19
Automatization
vSignalyzer: Efficiently Analyze Your Measured Data
Scripts may also be executed from a panel

20
Automatization
vSignalyzer: Efficiently Analyze Your Measured Data
Scripts may also be executed from a panel

21
Data Mining
vSignalyzer: Efficiently Analyze Your Measured Data
Measureddata
Hits
C-Functions and Simulink Models
vSignalyzer
Motivation: Finding the needle in the hay
Looking for a certain event in recorded data
Scan through a vast amount of data files
Most data don’t hold this event
Example: find all event where shifting gears took place while the engine revolution was faster than 3300 rpm.
Solution: Data Mining with vSignalyzer
Automatic analysis of many data files (MDF, BLF, …)
Efficient analysis of the data
Identification of “hits”
Direct access to each hit
Generation of a report

22
Conclusion
vSignalyzer: Efficiently Analyze Your Measured Data
Time for a live demonstration
With vSignalyzer you can easily visualize your measurement data
vSignalyzer provides a variety of visualization windows to best suit you needs
The inbuild methods of vSignalyzer allow you to compute even complex and demanding analysis. And if the inbuild methods do not fulfill your needs you may increase the feature scope with your own scripts and functions, external DLLs, and Matlab/Simulink models.
Data Mining allows you to analyze all your recorded data with a single call of you program
The analysis can be automatized
Powerful and easy to use printing and reporting features

23 © 2018. Vector Informatik GmbH. All rights reserved. Any distribution or copying is subject to prior written approval by Vector. V0.1 | 2018-08-20
Author:Sundt, AlexanderVector Germany
For more information about Vectorand our products please visit
www.vector.com