VPPIM1014 Variable annuities and optional living benefits issued by Transamerica Life Insurance...
38
VPPIM1014 Variable annuities and optional living benefits issued by Transamerica Life Insurance Company in Cedar Rapids, Iowa and Transamerica Financial Life Insurance Company in Harrison, New York (Transamerica). Annuities are underwritten and distributed by Transamerica Capital, Inc. Transamerica Financial Life Insurance Company is licensed in New York. Living Benefit
-
Upload
taryn-titmus -
Category
Documents
-
view
217 -
download
0
Transcript of VPPIM1014 Variable annuities and optional living benefits issued by Transamerica Life Insurance...

VPPIM1014
Variable annuities and optional living benefits issued by Transamerica Life Insurance Company in Cedar Rapids, Iowa and Transamerica Financial Life Insurance Company in Harrison, New York (Transamerica). Annuities are underwritten and
distributed by Transamerica Capital, Inc. Transamerica Financial Life Insurance Company is licensed in New York.
Living Benefit

Presented By:
[Registered Representative’s Name]
WITH [FINRA MEMBER FIRM NAME]

3
Retirement
Savings
Separately Managed
Accounts, ETFs,
Mutual Funds
Pensions and
Income Annuities
Deferred Variable Annuity
with Guaranteed Income
(GMWB)
– How Much to Allocate to Annuities?, Moshe A. Milevsky, PhD. Research Magazine, August 2009
Today’s Retiree

4
Challenges to a Successful Retirement
You deserve a strategy that helps you achieve the retirement you’ve worked for. To be financially independent on the first day of retirement, through the final day, you should consider the challenges ahead.

5
Record Amount of Assets in Short-Term Investments
$10.8Trillion
In short-term
liquid investments
Source: Guide to the Markets, JPMorgan, January 2014

6
Interest Rates at Historic Lows
Sources: bankrate.com and federalreserve.gov, as of October 9, 2014.
Generally a higher rate of return involves a higher degree of risk.
Average Savings Account 0.11%
1-Year CD 0.26%
5-Year CD 0.82%
5-Year Treasury 1.58%
10-Year Treasury 2.34%

7
“A long spell of low interest rates has created a windfall worth billions to banks, mortgage borrowers and others it was designed to benefit. But for many people who were counting on their nest eggs, those same low rates can spell trouble. The longer the Central Bank keeps interest rates low to stimulate the economy, the more money it pulls out of the pockets of millions of savers.”
– Fed’s Low Interest Rates Crack Retirees’ Nest Eggs, Wall Street Journal, April 4, 2011
Interest Rates at Historic Lows

8
“Among the most vulnerable are retirees, who have few options to restore lost income on investments built up over entire lifetimes.”
“They’re losing their investment income precisely at the time when they need it most.”
– Fed’s Low Interest Rates Crack Retirees’ Nest Eggs, Wall Street Journal, April 4, 2011
Interest Rates at Historic Lows

9
Interest Rates at Historic Lows
What would the Cost of Income be for investments in order to create $20,000 in annual income?
10
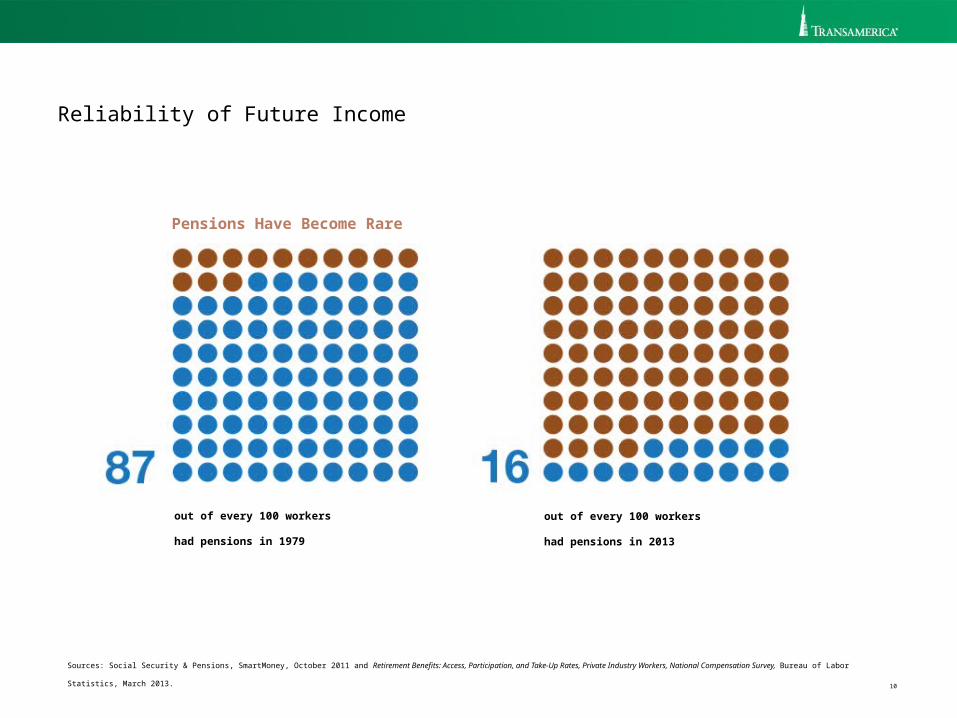
Reliability of Future Income
Sources: Social Security & Pensions, SmartMoney, October 2011 and Retirement Benefits: Access, Participation, and Take-Up Rates, Private Industry Workers, National Compensation Survey, Bureau of Labor Statistics, March
2013.
Pensions Have Become Rare
out of every 100 workers
had pensions in 1979
out of every 100 workers
had pensions in 2013

11
Retirement Income Sources are Eroding
Source: Social Security Announces 1.5 Percent Benefit Increase for 2014, www.ssa.gov, October 30, 2013.
Social Security Cost of Living Adjustment
1.5%
Only Increase in Cost of Living Adjustment
Social Security recipients receive
in 2014

12
Impact of Two Market Downturns
$1.4 trillion lost $3.7 trillion lost
Investment Realities
S&P 500®
chart derived from Yahoo! Finance data. Past performance is no guarantee of future results.
Source: US Retirement Markets and Retirement Assets Total $17 Trillion in Third Quarter 2011, ici.org.

13
Inflation
Sources: Inflation: Fourth Quarter 2013, Survey of Professional Forecasters, November 25, 2013 and www.calculator.net/interest-calculator.html and www.calculator.net/inflation-calculator.html.
But keep in mind, the inflation rate over
the past 30 years has averaged 4.3%
A Conservative
2.3% Inflation Rate
$1.00Today will be worth
$.80In 10 years
$.63In 20 years
$.51In 30 years

14
Future Health Care Expenses
Source: Fidelity Estimates Couples Retiring In 2012 Will Need $240,000 To Pay Medical Expenses Throughout Retirement, fidelity.com,
May 9, 2012 and Fidelity Estimates Couples Retiring In 2013 Will Need $220,000 To Pay Medical Expenses Throughout Retirement, fidelity.com, May 15, 2013.
38% increase in costs since 2002
Medical Expenses Keep Rising
Consider, it is estimated that a 65-year-old couple today will need $220,000 for medical expenses throughout retirement, not including
nursing home care.
2002 2013
$220,000$160,000

15
A Retirement Income Solution
The Opportunity to Create:
Any withdrawals, including those permitted under the living benefit, reduce your variable annuity’s policy value, death benefits and other values. Withdrawals may be subject to surrender charges.
All guarantees, including optional benefits, are backed by the claims-paying ability of the issuing insurance company.
• A guaranteed income stream for life
• The ability to stay invested in equities
• Income protection when the market goes down
• Income growth when the market goes up
• Income stability during periods of low rates
• Flexibility to start and stop income
• Your own personal pension
Here’s How …

16
VA
PensionStocks
and
Bonds
Variable Annuities

17
VA
VAVA
Stocks
and
Bonds
Variable Annuities
How They Work

18
VA
Pension
VAVA
Stocks
and
Bonds
Variable Annuities
How They Work
All guarantees, including optional benefits, are backed by the claims-paying ability of the issuing insurance company.

19
The Retirement Income Max Living Benefit
Maximize Your Retirement Income
Step-Ups
MonthiversarySM
Automatic
Growth
5.5% Annual Compounding
Investments
Multiple Investment Options
Income
For Life*
Single Life Withdrawals
6.30% at age 80+
5.30% at age 65-79
4.30% at age 59-64
Any withdrawals, including those permitted under the living benefit, reduce your variable annuity's policy value, death benefits and other values. Withdrawals may be subject to surrender charges.
*If the living benefit is structured as joint life, the withdrawal percentages are 0.3% lower and are based on the younger of the annuitant or the annuitant’s spouse when withdrawals begin.

20
– Allocation to Deferred Variable Annuities with GMWB for Life, Journal Of Financial Planning, February 2010.
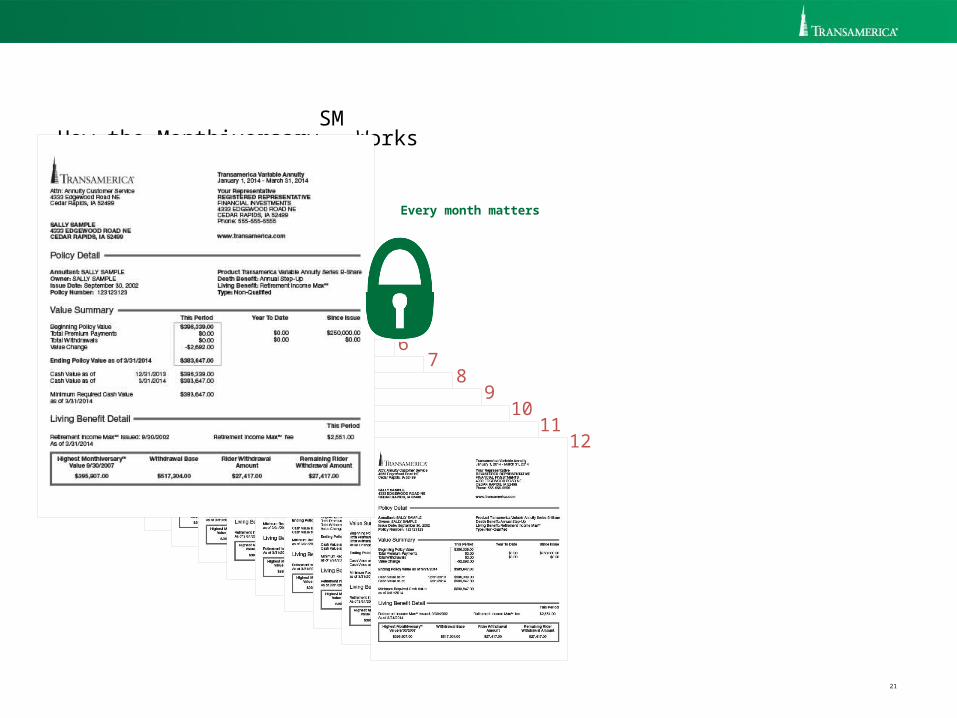
Automatic Step-Ups – Opportunity in Up Markets
“There is no significant difference among daily, weekly, and
monthly step-ups.”
21
Every month matters
12
34
56
78
910
11
How the MonthiversarySM
Works
Opportunity In Up Markets
12

22
“The Dow Jones Industrial Average closed up 7.80
points, or 0.07% at 11,577.51, up 11% from where it began in 2010. The Dow’s gain for the
year represents its second-straight annual increase, with almost half of the 2010 climb
having come this month; it rose 5.20% in December.”
— Stocks Round Out Strong Month, Quarter, CBS MarketWatch.com, December 31, 2010
Every Month Matters

23
“U.S. stocks rose Friday, and posted gains for the week and the month of April, with a climb in shares of Caterpillar Inc. helping push the DJIA up 47.23 points, or 0.4%, higher to 12,810.54. For the week, the Dow rose 2.4% and finished April up 4%, its heftiest monthly rise since December.”
— U.S. stocks rise Friday; Dow Climbs 4% in April, CBS MarketWatch.com
Every Month Matters
April 29, 2011

24
“The Dow soared 9.5% last month, its best month since October 2002. Measured by points, the 1,041.63 point rise was its biggest ever. ”
— A Month to Remember for Markets, The Wall Street Journal
Every Month Matters
October 31, 2011

25
living benefit Year
Withdrawal Base 5.5% Guaranteed Growth Policy Value
5.5% Annual Compounding Growth
Protection in Down Markets
This is a hypothetical illustration intended to illustrate the features of the Retirement Income Max living benefit. This illustration does not guarantee or predict actual performance.
All guarantees, including optional benefits, are backed by the claims-paying ability of the issuing insurance company.
Pol
icy
Val
ue a
nd W
ithdr
awal
Bas
e
0 1 2 3 4 5 6 7 8 9 10

26
This illustration does not guarantee or predict actual performance.
* Assumes no withdrawal is taken in any living benefit year.
Growth on Growth
Benefits of Retirement Income Max

27
If the living benefit is structured as joint life, withdrawals are based on the younger of the annuitant or the annuitant’s spouse
when withdrawals begin and may be changed with an automatic step-up.
Maximize Your Retirement Income
80+
65-79
59-64
6.30%
5.30%
4.30%
6.00%
5.00%
4.00%
Any withdrawals, including those permitted under the living benefit, reduce your variable annuity's policy value, death benefits and other values. Withdrawals may be subject to surrender charges.
All guarantees, including optional benefits, are based on the claims-paying ability of the issuing insurance company.

28
The performance quoted represents past performance and does not guarantee future results; current performance may be lower or higher than the performance quoted. The annuity value will fluctuate
with market conditions so that when surrendered, it may be worth more or less than the total of premium payments. To obtain performance data current to the most recent month-end go to
www.transamerica.com.
Returns reflect performance of the investment option assuming a single premium payment at inception date with the Annual Step-Up Death Benefit and are net of all asset-based fees, including the mortality and
expense risk fee, optional death benefit fee (if any) and administrative charge (collectively “M&E&A”) equal to 1.50% annually, 12b-1 fees (if any) and all other actual portfolio expenses. Standardized returns in
“Subaccount Returns with Surrender Charges & Service Charges Deducted” row include a pro rata deduction of the $50 annual service charge and any surrender charge that would apply if you
terminated the contract at the end of each period indicated. Transamerica Variable Annuity Series B-Share surrender charge is a percentage of amount withdrawn (in excess of any surrender charge free
amount) and declines as follows: 8-8-7-6-5-4-3-0%. Non-standardized returns in “Portfolio Returns without Surrender Charge & Service Charge Deducted” row do not include these charges. IF THEY HAD,
PERFORMANCE WOULD BE LOWER.
Returns do not include charges for other optional riders, or any taxes that may apply at distribution. IF THEY HAD, PERFORMANCE WOULD BE LOWER. The figures in the tables may reflect waiver of advisory fees
and reimbursement of other expenses. IN THE ABSENCE OF SUCH WAIVERS, THE PERFORMANCE WOULD HAVE BEEN LOWER.
TA Asset Allocation – Moderate – Service Class (5/1/02)
1 Year5 Years
Annualized10 Years
Annualized
Portfolio returns without surrender charges and service charges deducted 4.37% 5.74% 4.32%
Subaccount returns with surrender charges and service charges deducted -3.22% 5.06% 4.29%
Important InformationTA Asset Allocation - Moderate Performance Update September 30, 2014
29
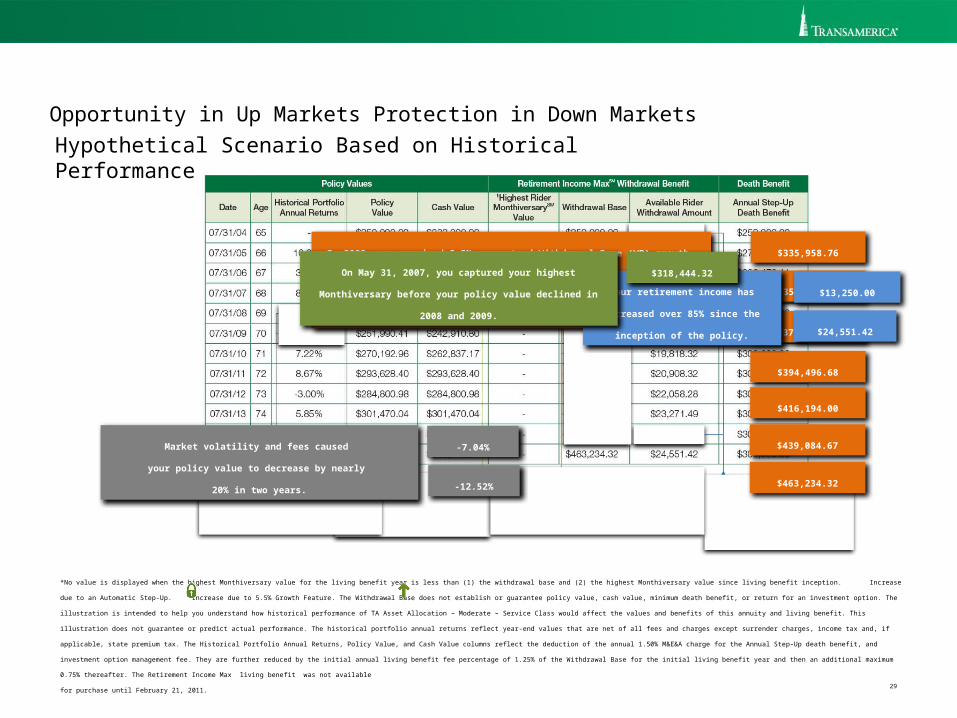
*No value is displayed when the highest Monthiversary value for the living benefit year is less than (1) the withdrawal base and (2) the highest Monthiversary value since living benefit inception. Increase due to an Automatic Step-Up. Increase due to 5.5% Growth Feature. The Withdrawal
Base does not establish or guarantee policy value, cash value, minimum death benefit, or return for an investment option. The illustration is intended to help you understand how historical performance of TA Asset Allocation – Moderate – Service Class would affect the values and benefits of this
annuity and living benefit. This illustration does not guarantee or predict actual performance. The historical portfolio annual returns reflect year-end values that are net of all fees and charges except surrender charges, income tax and, if applicable, state premium tax. The Historical Portfolio
Annual Returns, Policy Value, and Cash Value columns reflect the deduction of the annual 1.50% M&E&A charge for the Annual Step-Up death benefit, and investment option management fee. They are further reduced by the initial annual living benefit fee percentage of 1.25% of the Withdrawal
Base for the initial living benefit year and then an additional maximum 0.75% thereafter. The Retirement Income Max living benefit was not available
for purchase until February 21, 2011.
-7.04%Market volatility and fees caused
your policy value to decrease by nearly
20% in two years.
$335,958.76
$354,436.49
$373,930.50
Hypothetical Scenario Based on Historical Performance
Opportunity in Up Markets Protection in Down Markets
$394,496.68
In 2008, you received 5.5% guaranteed Withdrawal Base (WB) growth, which protected
your retirement income in declining markets.
In 2009, ‘10, ‘11, ‘12, ‘13 and ‘14, you received 5.5% guaranteed WB growth each year.
$416,194.00
-12.52%
$13,250.00
$24,551.42
Your retirement income has increased
over 85% since the inception of the
policy.
$439,084.67
$463,234.32
On May 31, 2007, you captured your highest Monthiversary before
your policy value declined in 2008 and 2009.
$318,444.32
30
12
34
56
78
910
1112
Opportunity in Up Markets Protection in Down Markets
Every month matters
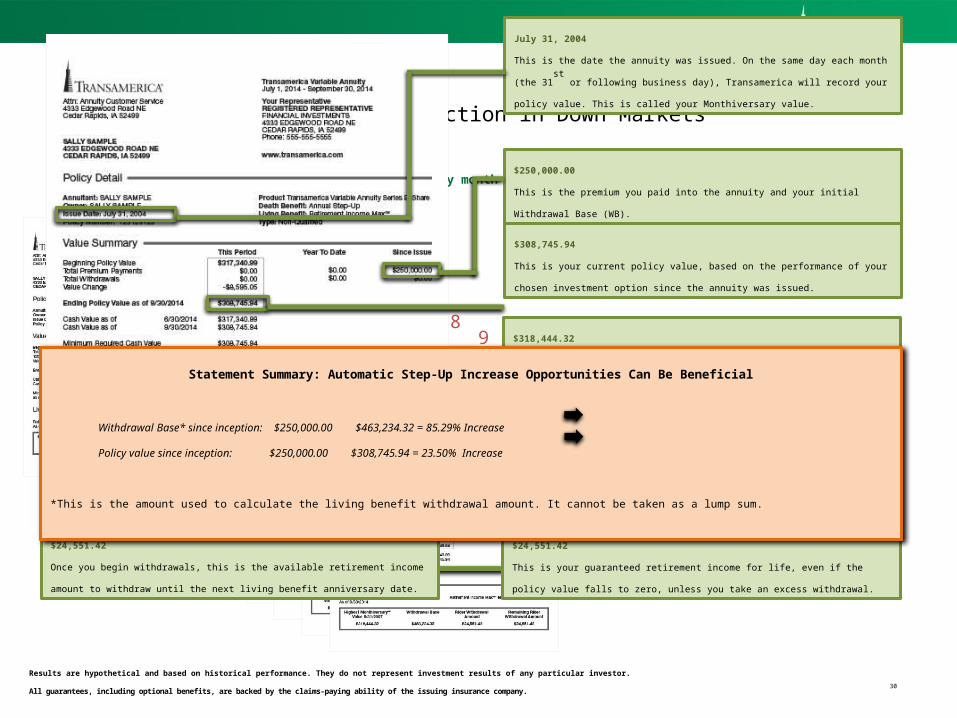
$308,745.94
This is your current policy value, based on the performance of your chosen investment
option since the annuity was issued.
July 31, 2004
This is the date the annuity was issued. On the same day each month (the 31st
or following
business day), Transamerica will record your policy value. This is called your Monthiversary
value.
$250,000.00
This is the premium you paid into the annuity and your initial Withdrawal Base (WB).
$318,444.32
This is your Highest Living Benefit Monthiversary Value since the living benefit inception
which was captured on May 31, 2007.
$24,551.42
This is your guaranteed retirement income for life, even if the policy value falls to zero,
unless you take an excess withdrawal.
$24,551.42
Once you begin withdrawals, this is the available retirement income amount to withdraw until
the next living benefit anniversary date.
Results are hypothetical and based on historical performance. They do not represent investment results of any particular investor.
All guarantees, including optional benefits, are backed by the claims-paying ability of the issuing insurance company.
$463,234.32
This is your WB, which is used to determine your guaranteed retirement income. The WB is
guaranteed to never decrease in value unless you take an excess withdrawal.
Statement Summary: Automatic Step-Up Increase Opportunities Can Be Beneficial
Withdrawal Base* since inception: $250,000.00 $463,234.32 = 85.29% Increase
Policy value since inception: $250,000.00 $308,745.94 = 23.50% Increase
*This is the amount used to calculate the living benefit withdrawal amount. It cannot be taken as a lump sum.

31
Vanguard, the ship logo, and Vanguard ETFs are trademarks of The Vanguard Group. Vanguard is one of the managers of the underlying ETFs.
The investment objectives and policies of certain funds may be similar to those of other funds managed by the same investment advisor. No representation is made, and there can be no assurance given, that any fund’s investment results will be comparable to the investment results of any
other fund, including another fund with the same investment advisor or manager.
The investment options are subject to market fluctuation, investment risk, and possible loss of principal.
Investment Options
Well Known Managers
32
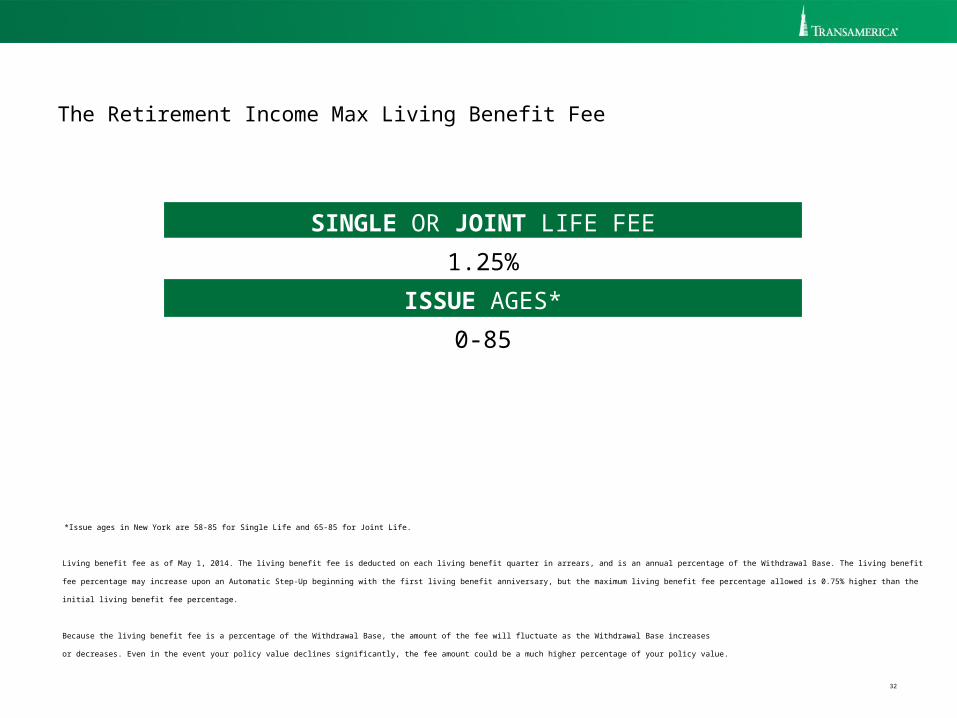
Living benefit fee as of May 1, 2014. The living benefit fee is deducted on each living benefit quarter in arrears, and is an annual percentage of the Withdrawal Base. The living benefit fee percentage may increase upon an Automatic Step-Up beginning with
the first living benefit anniversary, but the maximum living benefit fee percentage allowed is 0.75% higher than the initial living benefit fee percentage.
Because the living benefit fee is a percentage of the Withdrawal Base, the amount of the fee will fluctuate as the Withdrawal Base increases
or decreases. Even in the event your policy value declines significantly, the fee amount could be a much higher percentage of your policy value.
The Retirement Income Max Living Benefit Fee
*Issue ages in New York are 58-85 for Single Life and 65-85 for Joint Life.
SINGLE OR JOINT LIFE FEE
1.25%
ISSUE AGES*
0-85

33
“Also, given the markets’ volatility, look for an annuity that evaluates whether to reset the floor frequently. One Transamerica Corp. product looks at monthly market benchmarks, and uses the month with the best performance each year to calculate a new baseline for an account’s value and payments,” says Jim Otar, engineer and CFP from Thornhill, Ontario.
– Which Way to Retirement?, Wall Street Journal, August 12, 2011
Mainstream Recognition

34
“As insurance companies continue de-risking their annuity products, by effectively reducing guarantees, only a handful of companies marketing guaranteed lifetime withdrawal benefits (GLWBs) offer true protection against longevity, sequence of return and (potentially) inflation risk. I believe one of them is Transamerica.”
– “Transamerica Principium II,” Moshe A. Milevsky, Research Magazine, January 2011
Mainstream Recognition
All guarantees, including optional benefits, are backed by the claims-paying ability of the issuing insurance company.
35
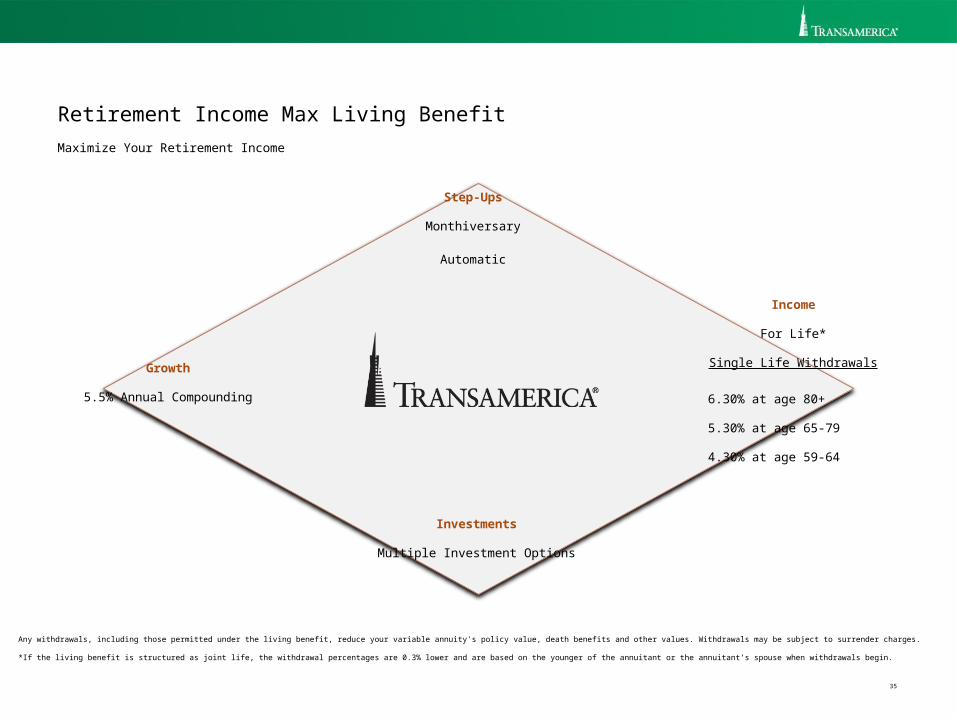
Retirement Income Max Living Benefit
Maximize Your Retirement Income
Step-Ups
Monthiversary
Automatic
Growth
5.5% Annual Compounding
Investments
Multiple Investment Options
Income
For Life*
Single Life Withdrawals
6.30% at age 80+
5.30% at age 65-79
4.30% at age 59-64
Any withdrawals, including those permitted under the living benefit, reduce your variable annuity's policy value, death benefits and other values. Withdrawals may be subject to surrender charges.
*If the living benefit is structured as joint life, the withdrawal percentages are 0.3% lower and are based on the younger of the annuitant or the annuitant’s spouse when withdrawals begin.

36
Before investing, consider a variable annuity's investment objectives, risks, charges, and expenses. Call
1-800-525-6205 for a contract and fund prospectus containing this and other information. Please read it carefully.
Fees
Transamerica variable annuities’ range of fees and charges include 0.45%-1.90% Mortality and Expense Risk fee and Administrative charges (M&E&A),
0%-9% surrender charges, $50 annual service charge, and investment option management fees. A fund facilitation fee of up to 0.30% may apply for certain investment options.
What is a Variable Annuity?
Variable annuities are long-term financial vehicles designed for retirement purposes.
The variable annuity policy value, death benefit, and other values will fluctuate based on the performance of the investment options and may be worth more or less than the total of all premiums paid when surrendered.
Withdrawals
The Automatic Step-Ups and 5.5% growth rate apply only to the Withdrawal Base; they do not apply to policy value, optional death benefits, or other optional benefits. In years when a withdrawal is taken, the 5.5% compounded growth does not apply.
You must wait until the living benefit year after you turn age 59 to begin withdrawals permitted under the living benefit. If the living benefit is purchased prior to age 59, however, the living benefit fee will still apply.
Withdrawals may be subject to surrender charges. Should the variable annuity’s policy value fall to zero, you will receive payments up to the amount allowed under the living benefit for life. If an excess withdrawal causes the policy value to reach zero, the living benefit and policy will
terminate. Withdrawals in excess of the living benefit withdrawal amount will result in a decrease in the dollar amount of future withdrawals available under the living benefit.
Withdrawals of taxable amounts are subject to ordinary income tax and may be subject to a 10% additional federal tax if withdrawn before age 59½.
On the maximum annuity commencement date, the living benefit terminates. By annuitizing the policy, you will have the option to receive lifetime payments that are no less than the withdrawals allowed by the living benefit. Annuitization must generally occur by the annuitant’s age 99.
Additional Information
All contract and living benefit guarantees, including optional benefits and any fixed subaccount crediting rates or annuity payout rates, are backed by the claims-paying ability of the issuing insurance company. They are not backed by the broker/dealer
from which this annuity is purchased, by the insurance agency from which this annuity is purchased, or any affiliates of those entities, and none makes any representations or guarantees regarding the claims-paying ability of the issuing insurance
company.
You have the right to reject an Automatic Step-Up within 30 days following a living benefit anniversary, if the living benefit fee percentage increases. If you reject an Automatic Step-Up, you must notify us in a manner which is acceptable to us, however you are still eligible for the 5.5%
growth feature and future Automatic Step-Ups. Changes as a result of the Automatic Step-Up feature will be reversed. Any increase in the living benefit fee percentage will also be reversed, and the Withdrawal Base will be set to the Withdrawal Base prior to the Automatic Step-Up.
Important Information

37
Additional Information
Financial institutions that sell our products may have their own guidelines to determine suitability of our variable annuity policies and/or living benefits. Some financial institutions may not sell all of our products, may have specific issue ages for our variable annuity policies, and may not have
all living and death benefits available.
The TA Asset Allocation – Moderate – Service Class investment strategy is intended to smooth out investment performance spikes. Performance gains may not be as strong as might by available in benchmark indices or comparable funds not using volatility controls.
The ability of the TA Asset Allocation – Moderate – Service Class fund to achieve its objective depends largely on the performance of the underlying fund in which it invests. Each underlying fund’s performance, in turn, depends on the particular securities in which that underlying funds
invests. Total expenses associated with the fund may be higher than with other mutual funds.
For federal tax purposes, married same sex individuals are recognized as “spouses”. The IRS has adopted a rule providing that the term “spouse” does not include an individual who has entered into a registered domestic partnership, civil union, or other similar relationship. The status of
these relationships for state purposes may vary based on the applicable state law. Transamerica intends to administer variable annuity contracts consistent with the IRS rulings until further notice. Please contact a qualified tax advisor prior to purchasing to discuss how exercising spousal
continuation benefits under this contract or any living benefits will affect you for both federal and state tax purposes. Please see prospectus for more details.
Living benefit is referred to as rider in the contract.
All policies, living benefits, and forms may vary by state, and may not be available in all states. ICC12 VA0513, NIC12 VA0513(FL), NIC12 VA0513(NY), ICC12 RGMD50513, NIC12 RGMD50513, NIC12 RGMD50513(NY), ICC12 RGMB410513(IS), ICC12 RGMB410513(IJ), RGMB 41
0111 (IS) (FL), RGMB 41 0111 (IJ) (FL), RGMB 41 0514R (IS)(NY), RGMB 41 0514R (IJ)(NY)
Transamerica Financial Life Insurance Company is licensed in New York.
Important Information

Questions?
Thank You For Your Time