
VOTING RIGHTS PROGRESS IN GEORGIA - … RIGHTS PROGRESS IN GEORGIA ... 1898 Supreme Court decision...
50
VOTING RIGHTS PROGRESS IN GEORGIA Charles S. Bullock III * Ronald Keith Gaddie †‡ I. Introduction ......................................... 2 R II. History of African-American Voter Registration and Participation in Georgia ............................. 3 R A. African-American Voter Registration and Participation Prior to 1965 ....................... 3 R B. African-American Registration and Turnout from the Passage of the Voting Rights Act of 1965 to the Present ...................................... 5 R 1. The Immediate Impact of the Voting Rights Act ......................................... 5 R 2. Contemporary Voter Registration and Turnout ..................................... 7 R a) Data from the United States Census ...... 10 R (i) Voter Registration ................... 11 R (ii) Voter Turnout ...................... 14 R b) Data from the Georgia Secretary of State ................................... 16 R c) Alternative Explanations for Low African- American Turnout ....................... 19 R III. African Americans Elected to Office ................. 20 R A. African Americans in Congress .................. 22 R 1. African-American Success in the House of Representatives ............................. 22 R 2. Redistricting and Concern About the Need for Majority African-American Districts ......... 25 R B. African Americans in the State Legislature ....... 29 R C. Statewide African-American Officials ............ 32 R IV. Voting Rights Law and Redistricting in Georgia: Causes and Consequences ........................... 35 R * Richard B. Russell Professor of Political Science and Josiah Meigs Distin- guished Teaching Professor, The University of Georgia, Athens, GA. † Professor of Political Science, The University of Oklahoma, Norman, OK. ‡ The authors appreciate the support of the American Enterprise Institute. 1
Transcript of VOTING RIGHTS PROGRESS IN GEORGIA - … RIGHTS PROGRESS IN GEORGIA ... 1898 Supreme Court decision...
\\server05\productn\N\NYL\10-1\NYL101.txt unknown Seq: 1 29-MAY-07 17:22
VOTING RIGHTS PROGRESS IN GEORGIA
Charles S. Bullock III*Ronald Keith Gaddie†‡
I. Introduction . . . . . . . . . . . . . . . . . . . . . . . . . . . . . . . . . . . . . . . . . 2 R
II. History of African-American Voter Registration andParticipation in Georgia . . . . . . . . . . . . . . . . . . . . . . . . . . . . . 3 R
A. African-American Voter Registration andParticipation Prior to 1965 . . . . . . . . . . . . . . . . . . . . . . . 3 R
B. African-American Registration and Turnout fromthe Passage of the Voting Rights Act of 1965 tothe Present . . . . . . . . . . . . . . . . . . . . . . . . . . . . . . . . . . . . . . 5 R
1. The Immediate Impact of the Voting RightsAct . . . . . . . . . . . . . . . . . . . . . . . . . . . . . . . . . . . . . . . . . 5 R
2. Contemporary Voter Registration andTurnout . . . . . . . . . . . . . . . . . . . . . . . . . . . . . . . . . . . . . 7 R
a) Data from the United States Census . . . . . . 10 R
(i) Voter Registration. . . . . . . . . . . . . . . . . . . 11 R
(ii) Voter Turnout . . . . . . . . . . . . . . . . . . . . . . 14 R
b) Data from the Georgia Secretary ofState . . . . . . . . . . . . . . . . . . . . . . . . . . . . . . . . . . . 16 R
c) Alternative Explanations for Low African-American Turnout . . . . . . . . . . . . . . . . . . . . . . . 19 R
III. African Americans Elected to Office . . . . . . . . . . . . . . . . . 20 R
A. African Americans in Congress . . . . . . . . . . . . . . . . . . 22 R
1. African-American Success in the House ofRepresentatives . . . . . . . . . . . . . . . . . . . . . . . . . . . . . 22 R
2. Redistricting and Concern About the Need forMajority African-American Districts . . . . . . . . . 25 R
B. African Americans in the State Legislature . . . . . . . 29 R
C. Statewide African-American Officials . . . . . . . . . . . . 32 R
IV. Voting Rights Law and Redistricting in Georgia:Causes and Consequences . . . . . . . . . . . . . . . . . . . . . . . . . . . 35 R
* Richard B. Russell Professor of Political Science and Josiah Meigs Distin-guished Teaching Professor, The University of Georgia, Athens, GA.
† Professor of Political Science, The University of Oklahoma, Norman, OK.‡ The authors appreciate the support of the American Enterprise Institute.
1
\\server05\productn\N\NYL\10-1\NYL101.txt unknown Seq: 2 29-MAY-07 17:22
2 LEGISLATION AND PUBLIC POLICY [Vol. 10:1
A. Plans to Reduce African-American Concentrationsin Legislative Districts . . . . . . . . . . . . . . . . . . . . . . . . . . . 36 R
B. African-American Leaders’ Support for theRedistricting Plan . . . . . . . . . . . . . . . . . . . . . . . . . . . . . . . 38 R
V. Racial and Party Voting Patterns . . . . . . . . . . . . . . . . . . . . . 40 R
A. African-American and White Support for African-American and White Candidates . . . . . . . . . . . . . . . . . 40 R
B. Race and Voting by Party Affiliation . . . . . . . . . . . . . 43 R
1. The Importance of the African-American Votein the Democratic Primary . . . . . . . . . . . . . . . . . . . 45 R
2. The Impact of Party Affiliation on RacialVoting Patterns . . . . . . . . . . . . . . . . . . . . . . . . . . . . . 46 R
VI. Conclusion . . . . . . . . . . . . . . . . . . . . . . . . . . . . . . . . . . . . . . . . . . 48 R
I.INTRODUCTION
Forty years of effort in implementing the Voting Rights Act of19651 have resulted in significant and lasting changes in access to theballot for African Americans as well as a translation of those ballotsinto government influence. In this article, we explore the evolution ofvoting rights progress in Georgia, a Deep South state that was at theforefront of the civil rights movement, and the implementation andevolution of the Voting Rights Act (VRA). In Part II, we examinechanges in minority registration and voting following the enactment ofthe VRA, which was designed to ensure minority access to the politi-cal process by guaranteeing the franchise, and conclude that the origi-nal access and participation goals of the VRA have been substantiallyattained.
Part III considers the election of African Americans to public of-fice. Georgia has had success in electing minority officeholders to alllevels of government, including major legislative and statewide consti-tutional and judicial offices. African-American candidates are gener-ally elected from majority-black constituencies but have also appealedto white voters. Such crossover appeal facilitates the election of Afri-can Americans statewide and served as an important consideration forthe Supreme Court when it changed the retrogression standard of sec-tion 5 of the VRA in Georgia v. Ashcroft.2
1. Voting Rights Act of 1965, Pub. L. No. 89-110, 79 Stat. 437 (codified asamended at 42 U.S.C. §§ 1973 to 1973bb-1 (2000)).
2. 539 U.S. 461, 479–82 (2003).
\\server05\productn\N\NYL\10-1\NYL101.txt unknown Seq: 3 29-MAY-07 17:22
2006] VOTING RIGHTS PROGRESS IN GEORGIA 3
Part IV addresses the causes and consequences of redistricting inGeorgia, a state that has been at the forefront of redistricting contro-versies for four decades. In the redistricting following the release ofthe 2000 census figures, which became the subject of Georgia v. Ash-croft, African-American leaders supported the redistribution of the Af-rican-American vote in an effort to help Democrats retain majorities inthe general assembly. This strategy reduced African-American con-centrations in some state senate districts to the point that several dis-tricts that had been solidly African-American emerged in the new planwith barely more than a 50% African-American voting age popula-tion. African-American leaders explained that they believed these re-ductions did not endanger the retention of these districts because ofthe willingness of a share of the white electorate to support African-American candidates. As a result of this and other considerations, inGeorgia v. Ashcroft, the U.S. Supreme Court created a new standardfor evaluating the racial effects of redistricting.3
Part V analyzes voting patterns based on race and political party,relying on empirical methods used in voting rights litigation to deter-mine patterns of racial support for African-American and white candi-dates.4 This analysis, which reveals that the pattern of support forAfrican-American Democrats follows the pattern of support for whiteDemocrats, places political access and success into the broader con-text of party politics and suggests that partisan and racial goals con-verge in the new, two-party South.
II.HISTORY OF AFRICAN-AMERICAN VOTER REGISTRATION
AND PARTICIPATION IN GEORGIA
A. African-American Voter Registration andParticipation Prior to 1965
Georgia has a long legacy of taking actions that have impededAfrican-American political participation.5 In 1871, Georgia becamethe first state to enact a poll tax,6 and in 1877, it made the tax cumula-
3. Id. at 490–91.4. Such methods were accepted by the Supreme Court in Thornburg v. Gingles,
478 U.S. 30, 61 (1986).5. V. O. KEY, JR., SOUTHERN POLITICS IN STATE AND NATION 548–49 (Vintage
Books 1949).6. J. MORGAN KOUSSER, THE SHAPING OF SOUTHERN POLITICS: SUFFRAGE RE-
STRICTION AND THE ESTABLISHMENT OF THE ONE-PARTY SOUTH, 1880-1910 239(1974).
\\server05\productn\N\NYL\10-1\NYL101.txt unknown Seq: 4 29-MAY-07 17:22
4 LEGISLATION AND PUBLIC POLICY [Vol. 10:1
tive,7 meaning that past unpaid poll taxes accumulate and that an indi-vidual must pay the back taxes in order to vote.8 In the wake of an1898 Supreme Court decision validating the Mississippi Constitution’srestrictions on African-American political participation,9 Georgiajoined other southern states in adopting additional prerequisites forregistration.10 These requirements included a literacy test, which re-quired voters to demonstrate their ability to read and write; a propertytest; an understanding clause; and a grandfather clause.11 Like manysouthern states, Georgia also adopted provisions limiting participationin the Democratic primary to white voters;12 since no Republicanswon any major offices in the state for almost a hundred years, theDemocratic primary determined who would hold public office inGeorgia, in all but a few mountain counties, until the early 1960s.13
In the twentieth century, Georgia repealed some of its more re-strictive provisions on African-American voting while striving tomaintain others. In 1945, the state legislature abolished the poll tax.14
It was reluctant, however, to give up the white primary, even thoughthe Supreme Court had banned it in Texas in the 1944 case of Smith v.Allwright.15 In his last gubernatorial bid in 1946, three-time governorEugene Talmadge ran on a platform that promised to maintain thewhite primary.16 Despite his efforts, a number of African Americansvoted in that year’s Democratic primary.17 In 1947, the Georgia Gen-eral Assembly sought to maintain an all-white primary by removingthe state from the operation of the Democratic primary, but ActingGovernor Melvin E. Thompson vetoed the legislation.18
7. Laughlin McDonald, Michael B. Binford & Ken Johnson, Georgia, in QUIET
REVOLUTION IN THE SOUTH 101 (Chandler Davidson & Bernard Grofman, eds., 1994)[hereinafter QUIET REVOLUTION] . Georgia was among the last of the southern statesto adopt other restrictions on suffrage. See KOUSSER, supra note 6. R
8. KEY, supra note 5, at 580, 582. R9. Williams v. Mississippi, 170 U.S. 213 (1898).
10. KEY, supra note 5, at 539; KOUSSER, supra note 6, at 239. R11. KEY, supra note 5, at 539, 556–58; KOUSSER, supra note 6, at 239. R12. See KEY, supra note 5, at 620. R13. See Alan Judd, Old Problems Resurface in Legislature’s New Century, AT-
LANTA J.-CONST., Jan. 9, 2000, at A1. See also KEY, supra note 5, at 280–85 (describ- Ring the phenomenon of “Mountain Republicans”).14. ALBERT B. SAYE, GEORGIA: HISTORY AND GOVERNMENT 196 (1957).15. 321 US 649 (1944). In Allright, the Supreme Court rejected the Democratic
Party’s argument that it was a private organization permitted to exclude blacks, hold-ing that because membership was also “the essential qualification for voting in a pri-mary.” Texas made the party an agent of the state, whose conduct is regulated by theFourteenth Amendment. Id. at 664–65.16. WILLIAM ANDERSON, THE WILD MAN FROM SUGAR CREEK 222 (1975).17. KEY, supra note 5, at 635–36. R18. Id. at 636.
\\server05\productn\N\NYL\10-1\NYL101.txt unknown Seq: 5 29-MAY-07 17:22
2006] VOTING RIGHTS PROGRESS IN GEORGIA 5
Even with the elimination of the white primary and the poll tax inthe 1940s, African-American registration rates in Georgia remainedlow into the early 1960s,19 as the literacy test coupled with frequentlyantagonistic local registrars discouraged African-American registra-tion.20 In the period immediately preceding the enactment of the VRAin 1965, only 27.4% of Georgia’s non-white voting age populationwas registered to vote,21 compared with 62.6% of the white voting agepopulation. In thirty Georgia counties with significant African-Ameri-can populations, less than 10% of the age-eligible African Americanswere registered in 1962.22 In four of these counties, the voting listscontained the names of fewer than ten non-whites.23
B. African-American Registration and Turnout from the Passageof the Voting Rights Act of 1965 to the Present
1. The Immediate Impact of the Voting Rights Act
Georgia was one of the states singled out by the VRA in 1965 forcontinued federal oversight of electoral practices. While portions ofthat legislation applied nationwide, the most controversial componentimpacted only those jurisdictions identified by the “trigger mecha-nism” in section 4.24 The trigger mechanism picked up jurisdictionswhich, like Georgia, (a) had a “test or device”25 as a prerequisite forregistering and (b) in which less than half the voting age populationhad registered or voted in the 1964 presidential election.26 The VRArequires that jurisdictions identified by section 4 become subject to
19. U.S. COMM’N ON CIVIL RIGHTS, POLITICAL PARTICIPATION 222–23 (1968)[hereinafter POLITICAL PARTICIPATION].20. See generally HARRELL R. RODGERS, JR. & CHARLES S. BULLOCK III, LAW AND
SOCIAL CHANGE: CIVIL RIGHTS LAWS AND THEIR CONSEQUENCES 21–23 (McGraw-Hill 1972).21. POLITICAL PARTICIPATION, supra note 19, at 238. Figures presented for non- R
whites and whites; almost all Georgia non-whites in 1960s would be African Ameri-can. CAMPBELL GIBSON & KAY JUNG, HISTORICAL CENSUS STATISTICS ON POPULA-
TION TOTALS BY RACE, 1790 TO 1990, AND BY HISPANIC ORIGIN, 1970 TO 1990, FOR
LARGE CITIES AND OTHER URBAN PLACES IN THE UNITED STATES (2005), available athttp://www.census.gov/population/www/documentation/twps0075.html.22. See POLITICAL PARTICIPATION, supra note 19, at 232–39. R23. See id.24. Voting Rights Act of 1965, Pub. L. No. 89-110, § 4(b), 79 Stat. 437, 438 (codi-
fied as amended at 42 U.S.C. § 1973b(b) (2000)).25. “Test or device” is defined in § 4(c) as a requirement that a person “(1) demon-
strate the ability to read, write, understand, or interpret any matter; (2) demonstrateany educational achievement or his knowledge of any particular subject; (3) possessgood moral character; or (4) prove his qualifications by the voucher of registeredvoters or members of any other class.”26. Voting Rights Act § 4(b). See also § 4(c), 79 Stat. at 438–39.
\\server05\productn\N\NYL\10-1\NYL101.txt unknown Seq: 6 29-MAY-07 17:22
6 LEGISLATION AND PUBLIC POLICY [Vol. 10:1
section 5, which requires them to secure approval from a federal au-thority—either the Department of Justice or the District Court for theDistrict of Columbia—before implementing changes in their electionlaws.27 Federal agents could also be sent into the covered jurisdictionto register eligible prospective voters who had been turned away bylocal authorities.28 Although the section 4 trigger mechanism was ini-tially scheduled to expire in 1970, it was renewed for the fourth timein 2006 and will be in place until 2031.29
Even though only 167,663 non-whites had registered to vote inGeorgia in 1962, the number of white registrants was high enough that53.6% of the state’s total voting age population was registered,30 satis-fying that portion of section 4. Despite its registration numbers, Geor-gia’s low voter turnout rate made it subject to section 5. In the 1964presidential election, the vote cast equaled just 43.2% of the state’svoting age population, thus failing to exceed the 50% needed to avoidsection 5 coverage.31
As in other southern states covered by section 5 of the VRA,immediate and dramatic change came quickly in Georgia followingthe VRA’s passage. By 1967, 52.6% of Georgia’s non-white votingage population had registered to vote.32 This increased registrationrate also extended to the white population, of which just over 80% ofthe age-eligible population had registered to vote.33
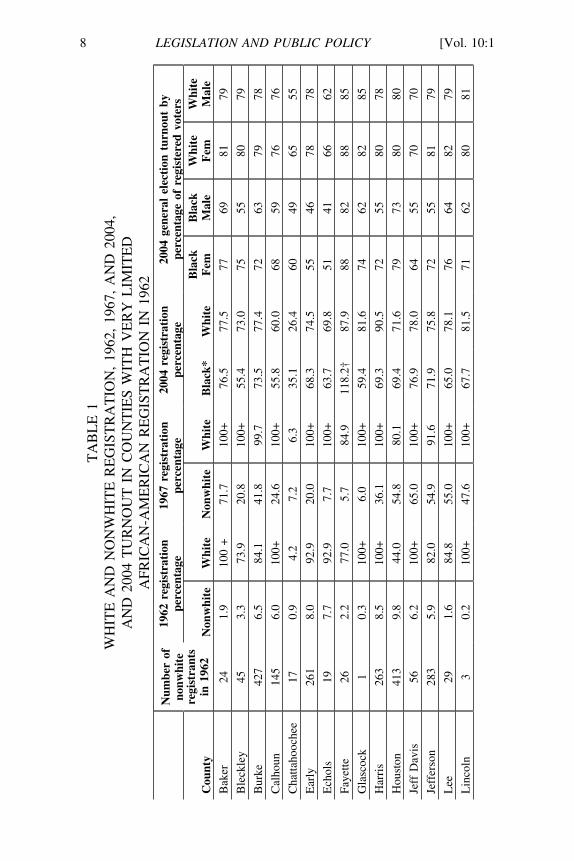
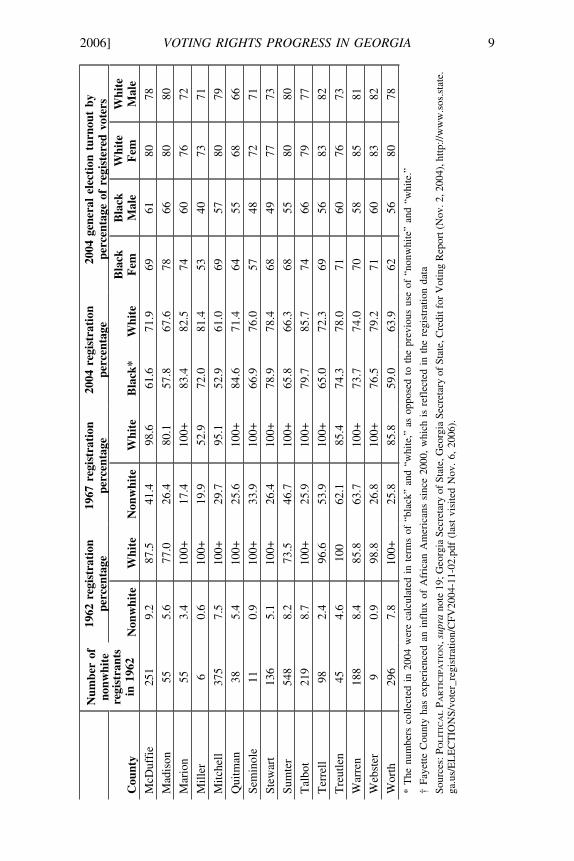
Particularly dramatic increases in African-American registrationoccurred in the thirty Georgia counties that had most consistentlyrebuffed African-American political overtures. Table 1 reports thewhite and non-white registration rates, as of December 1962, for thethirty counties in which fewer than 10% of the age-eligible non-whiteswere registered. In these counties, substantially larger shares of the
27. Voting Rights Act § 5, 79 Stat. at 439 (known as the section 5 preclearancerequirement of the VRA).28. Voting Rights Act §§ 3, 6, 79 Stat. at 437, 439–40.29. Fannie Lou Hamer, Rosa Parks, and Coretta Scott King Voting Rights Act
Reauthorization and Amendments Act of 2006, Pub. L. No. 109-246, § 4, 120 Stat.577, 580.30. POLITICAL PARTICIPATION, supra note 19, at 238. This figure is approximated R
since the voting age population is as of 1960, whereas the registration numbers are asof 1962.31. U.S. CENSUS BUREAU, Series P 23-014, 1960 POPULATION OF VOTING AGE AND
VOTES CAST FOR PRESIDENT, BY STATES: 1964 AND 1960, FOR STATES AND COUNTIES,tbl.1 (Apr. 21, 1965), available at http://www.census.gov/population/socdemo/voting/p23-014/tab01.pdf.32. POLITICAL PARTICIPATION, supra note 19, at 222–23. R33. Id.
\\server05\productn\N\NYL\10-1\NYL101.txt unknown Seq: 7 29-MAY-07 17:22
2006] VOTING RIGHTS PROGRESS IN GEORGIA 7
white population were registered.34 Surprisingly, in a number of thecounties, the registration rolls included more names of whites thanexisted in the age-eligible white population counted in 1960. Suchcounties are denoted in the table as having white registration of“100+”. The evidence is clear that while non-whites found it difficultto register, comparable barriers did not dissuade whites who wished tosign up to vote.
Within two years after passage of the VRA, registration rates fornon-whites increased in almost every one of these thirty counties.35 Inall but four of the counties, more than 10% of the non-white adultshad registered. In eight counties, a majority of non-white adults hadsigned up to vote. Baker County, with 71.7% of its non-white adultson the voting lists, led the way towards enfranchisement. The medianlevel of non-white registration in 1967 was 28.25%, as compared to5.6% in 1962, indicating that while some progress had been made,much remained to be done to extend the suffrage to Georgia’s Afri-can-American population. Notably, in 1967, the median figure forwhite registration exceeded one hundred percent of the voting agepopulation. One of the counties showing relatively little progress,Chattahoochee, has a large concentration of military personnel, suchthat only 7.2% of the adult non-whites and 6.3% of the whites hadregistered.
2. Contemporary Voter Registration and Turnout
As shown in Table 1, in each of the thirty counties with low ratesof African-American registration in 1962, African-American registra-tion had become widespread by 2004. In every county except Chatta-hoochee, the bulk of the voting age population was registered. Themean for the thirty counties was 67.6%, and in eight counties, theregistration rate exceeded 75%. Excluding Fayette County—wherethe 2004 registration figures exceed the 2000 voting age population asa result of African-American in-migration—the average African-American registration figure is 65.9% of the adult population com-pared with a white average of 73.8%.
34. The exception is Chattahoochee County, which contains much of Fort Benning,many of whose soldiers are not Georgia residents. Section 5 can be overinclusivewhen a county contains a large number of military personnel who do not vote locally.See Michelle E. O’Connor-Ratcliff, Note, Colorblind Redistricting: Racial Proxies asa Solution to the Court’s Voting Rights Act Quandary, 29 HASTINGS CONST. L.Q. 61,72 (2001).35. See supra Table 1; POLITICAL PARTICIPATION, supra note 19, at 233–39. R
Echols County saw no change in its pre- and post-VRA rates. Id. at 234–35.
\\server05\productn\N\NYL\10-1\NYL101.txt unknown Seq: 8 29-MAY-07 17:22
8 LEGISLATION AND PUBLIC POLICY [Vol. 10:1
TA
BL
E 1
WH
ITE
AN
D N
ON
WH
ITE
RE
GIS
TR
AT
ION
, 19
62,
1967
, A
ND
200
4,A
ND
200
4 T
UR
NO
UT
IN
CO
UN
TIE
S W
ITH
VE
RY
LIM
ITE
DA
FRIC
AN
-AM
ER
ICA
N R
EG
IST
RA
TIO
N I
N 1
962
Num
ber
of19
62 r
egis
trat
ion
1967
reg
istr
atio
n20
04 r
egis
trat
ion
2004
gen
eral
ele
ctio
n tu
rnou
t by
nonw
hite
perc
enta
gepe
rcen
tage
perc
enta
gepe
rcen
tage
of
regi
ster
ed v
oter
sre
gist
rant
sB
lack
Bla
ckW
hite
Whi
teC
ount
yin
196
2N
onw
hite
Whi
teN
onw
hite
Whi
teB
lack
*W
hite
Fem
Mal
eF
emM
ale
Bak
er24
1.9
100
+71
.710
0+76
.577
.577
6981
79
Ble
ckle
y45
3.3
73.9
20.8
100+
55.4
73.0
7555
8079
Bur
ke42
76.
584
.141
.899
.773
.577
.472
6379
78
Cal
houn
145
6.0
100+
24.6
100+
55.8
60.0
6859
7676
Cha
ttaho
oche
e17
0.9
4.2
7.2
6.3
35.1
26.4
6049
6555
Ear
ly26
18.
092
.920
.010
0+68
.374
.555
4678
78
Ech
ols
197.
792
.97.
710
0+63
.769
.851
4166
62
Faye
tte26
2.2
77.0
5.7
84.9
118.
2†87
.988
8288
85
Gla
scoc
k1
0.3
100+
6.0
100+
59.4
81.6
7462
8285
Har
ris
263
8.5
100+
36.1
100+
69.3
90.5
7255
8078
Hou
ston
413
9.8
44.0
54.8
80.1
69.4
71.6
7973
8080
Jeff
Dav
is56
6.2
100+
65.0
100+
76.9
78.0
6455
7070
Jeff
erso
n28
35.
982
.054
.991
.671
.975
.872
5581
79
Lee
291.
684
.855
.010
0+65
.078
.176
6482
79
Lin
coln
30.
210
0+47
.610
0+67
.781
.571
6280
81
\\server05\productn\N\NYL\10-1\NYL101.txt unknown Seq: 9 29-MAY-07 17:22
2006] VOTING RIGHTS PROGRESS IN GEORGIA 9
Num
ber
of19
62 r
egis
trat
ion
1967
reg
istr
atio
n20
04 r
egis
trat
ion
2004
gen
eral
ele
ctio
n tu
rnou
t by
nonw
hite
perc
enta
gepe
rcen
tage
perc
enta
gepe
rcen
tage
of
regi
ster
ed v
oter
sre
gist
rant
sB
lack
Bla
ckW
hite
Whi
teC
ount
yin
196
2N
onw
hite
Whi
teN
onw
hite
Whi
teB
lack
*W
hite
Fem
Mal
eF
emM
ale
McD
uffi
e25
19.
287
.541
.498
.661
.671
.969
6180
78
Mad
ison
555.
677
.026
.480
.157
.867
.678
6680
80
Mar
ion
553.
410
0+17
.410
0+83
.482
.574
6076
72
Mill
er6
0.6
100+
19.9
52.9
72.0
81.4
5340
7371
Mitc
hell
375
7.5
100+
29.7
95.1
52.9
61.0
6957
8079
Qui
tman
385.
410
0+25
.610
0+84
.671
.464
5568
66
Sem
inol
e11
0.9
100+
33.9
100+
66.9
76.0
5748
7271
Stew
art
136
5.1
100+
26.4
100+
78.9
78.4
6849
7773
Sum
ter
548
8.2
73.5
46.7
100+
65.8
66.3
6855
8080
Tal
bot
219
8.7
100+
25.9
100+
79.7
85.7
7466
7977
Ter
rell
982.
496
.653
.910
0+65
.072
.369
5683
82
Tre
utle
n45
4.6
100
62.1
85.4
74.3
78.0
7160
7673
War
ren
188
8.4
85.8
63.7
100+
73.7
74.0
7058
8581
Web
ster
90.
998
.826
.810
0+76
.579
.271
6083
82
Wor
th29
67.
810
0+25
.885
.859
.063
.962
5680
78*
The
num
bers
col
lect
ed i
n 20
04 w
ere
calc
ulat
ed i
n te
rms
of “
blac
k” a
nd “
whi
te,”
as
oppo
sed
to t
he p
revi
ous
use
of “
nonw
hite
” an
d “w
hite
.”
† Fa
yette
Cou
nty
has
expe
rien
ced
an i
nflu
x of
Afr
ican
Am
eric
ans
sinc
e 20
00,
whi
ch i
s re
flec
ted
in t
he r
egis
trat
ion
data
Sour
ces:
PO
LIT
ICA
L P
AR
TIC
IPA
TIO
N, s
upra
not
e 19
; Geo
rgia
Sec
reta
ry o
f St
ate,
Geo
rgia
Sec
reta
ry o
f St
ate,
Cre
dit f
or V
otin
g R
epor
t (N
ov. 2
, 200
4), h
ttp://
ww
w.s
os.s
tate
.ga
.us/
EL
EC
TIO
NS/
vote
r_re
gist
ratio
n/C
FV20
04-1
1-02
(la
st v
isite
d N
ov.
6, 2
006)
.
\\server05\productn\N\NYL\10-1\NYL101.txt unknown Seq: 10 29-MAY-07 17:22
10 LEGISLATION AND PUBLIC POLICY [Vol. 10:1
In addition to this progress in African-American voter registra-tion, African-American turnout has also increased in the forty yearssince the passage of the VRA. In every one of the thirty counties, atleast a majority of registered African-American women voted in 2004.In the Atlanta suburbs of Fayette County, 88% of registered African-American women and 82% of registered African-American men par-ticipated. A higher proportion of African-American female registrantsthan white male registrants voted in Chattahoochee, Fayette, andMarion counties, and in a number of suburban counties the participa-tion rates of African-American females almost equaled that of whites.Despite this evidence of success, the more common pattern was forAfrican-American turnout rates to lag behind those for whites, espe-cially in rural counties. Participation rates among African-Americanmen also invariably lagged behind those of African-American women,often with a disparity of more than ten percentage points.
a) Data from the United States Census
In addition to the data in Table 1, another source of data on con-temporary voter registration and turnout comes from the United StatesCensus. After each election, the U.S. Bureau of the Census conducts amassive survey to determine registration and turnout rates among thevoting age population of the jurisdiction.36 These figures are self-re-
36. See, e.g., U.S. DEP’T OF COMMERCE, BUREAU OF THE CENSUS, VOTING AND
REGISTRATION IN THE ELECTION OF NOVEMBER 1980 (GPO 1982); U.S. DEP’T OF
COMMERCE, BUREAU OF THE CENSUS, VOTING AND REGISTRATION IN THE ELECTION
OF NOVEMBER 1982 (GPO 1984); U.S. DEP’T OF COMMERCE, BUREAU OF THE CEN-
SUS, VOTING AND REGISTRATION IN THE ELECTION OF NOVEMBER 1984 (GPO 1986);U.S. DEP’T OF COMMERCE, BUREAU OF THE CENSUS, VOTING AND REGISTRATION IN
THE ELECTION OF NOVEMBER 1986 (GPO 1988); U.S. DEP’T OF COMMERCE, BUREAU
OF THE CENSUS, VOTING AND REGISTRATION IN THE ELECTION OF NOVEMBER 1988(GPO 1990); U.S. DEP’T OF COMMERCE, BUREAU OF THE CENSUS, VOTING AND RE-
GISTRATION IN THE ELECTION OF NOVEMBER 1990 (GPO 1992); U.S. DEP’T OF COM-
MERCE, BUREAU OF THE CENSUS, VOTING AND REGISTRATION IN THE ELECTION OF
NOVEMBER 1992 (GPO 1994); U.S. DEP’T OF COMMERCE, BUREAU OF THE CENSUS,VOTING AND REGISTRATION IN THE ELECTION OF NOVEMBER 1994 (GPO 1996); U.S.DEP’T OF COMMERCE, BUREAU OF THE CENSUS, VOTING AND REGISTRATION IN THE
ELECTION OF NOVEMBER 1996 (GPO 1998), available at http://www.census.gov/prod/3/98pubs/p20-504.pdf, http://www.census.gov/prod/3/98pubs/p20-504u.pdf; U.S.DEP’T OF COMMERCE, BUREAU OF THE CENSUS, VOTING AND REGISTRATION IN THE
ELECTION OF NOVEMBER 1998 (GPO 2000); U.S. DEP’T OF COMMERCE, BUREAU OF
THE CENSUS, VOTING AND REGISTRATION IN THE ELECTION OF NOVEMBER 2000 (GPO2002), available at http://www.census.gov/prod/2002pubs/p20-542.pdf; U.S. DEP’T
OF COMMERCE, BUREAU OF THE CENSUS, VOTING AND REGISTRATION IN THE ELEC-
TION OF NOVEMBER 2002 (GPO 2004), available at http://www.census.gov/prod/2004pubs/p20-552.pdf; U.S. DEP’T OF COMMERCE, BUREAU OF THE CENSUS, VOTING AND
REGISTRATION IN THE ELECTION OF NOVEMBER 2004 (2005) http://www.census.gov/population/www/socdemo/voting/cps2004.html.
\\server05\productn\N\NYL\10-1\NYL101.txt unknown Seq: 11 29-MAY-07 17:22
2006] VOTING RIGHTS PROGRESS IN GEORGIA 11
ports, which tend to overestimate actual participation rates37 but canbe used for comparative purposes across time and across states on theassumption that the inflation is of similar magnitude. These surveysare also important in that they provide the basis for the estimates thatthe Census Bureau uses to determine whether registration or turnoutrates for jurisdictions are so low as to subject the jurisdiction to thetrigger mechanisms of the Voting Rights Acts of 1965, 1970, or1975.38
(i) Voter Registration
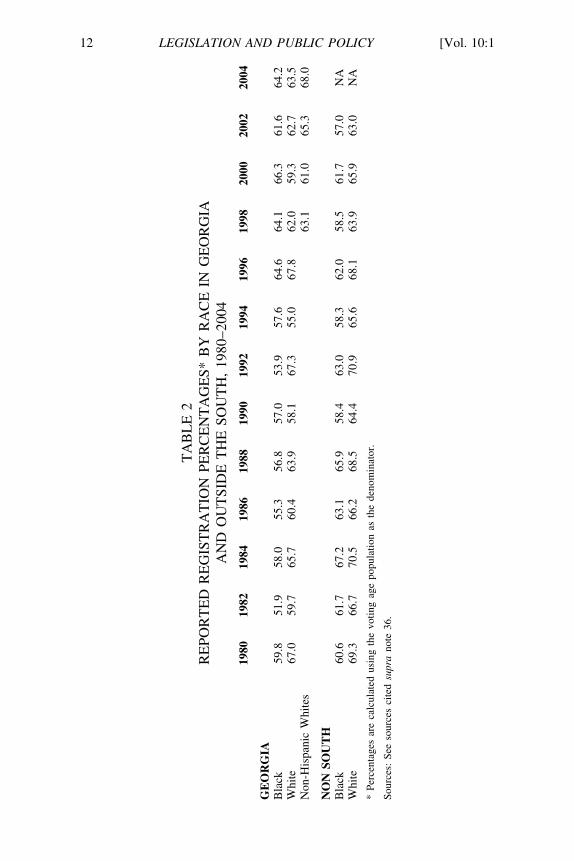
As shown in Table 2 below, by 1980, 59.8% of voting-age Afri-can Americans in Georgia reported having registered. The compara-ble figure for the share of the white voting age population claiming tobe registered was 67%. During the 1980s, approximately 7% morewhites than African Americans were registered. The greatest disparityin white and African-American registration, 7.8 points, occurred in1982.
By 1990, African-American and white Georgians had nearlyidentical registration rates: 57% of African Americans of voting agereported being registered, compared with 58.1% of whites. In 1994, alarger proportion of African Americans (57.6%) than whites (55%)had registered. African Americans have reported registering at higherrates than whites in four of the six most recent national elections, in-cluding the two most recent presidential elections. In the 2002midterm election, when more voting age whites than African Ameri-cans reported registering, the disparity was only 1.1 percentage points,with 61.6% of voting age African Americans and 62.7% of voting agewhites registered.
The figures for whites are comparable across the 24-year period.In recent years, however, Georgia has experienced a large Latino in-flux, and beginning in 1994, the census data reported estimates for
37. See, e.g., Paul R. Abramson & William Claggett, Race-Related Differences inSelf-Reported and Validated Turnout in 1984. 46 J. OF POL. 719, 721 (1984).38. Voting Rights Act of 1965, Pub. L. No. 89-110, § 4(b), 79 Stat. 437, 438 (codi-
fied as amended at 42 U.S.C. § 1973b(b) (2000)) (delegating determination of regis-tration and turnout numbers to the Director of the Census). Each Voting Rights Actrenewal until 1975 updated the trigger to include the most recent election, and the1975 renewal also treated English-only ballots as a form of literacy test, thus broadlyexpanding the scope of the Act to capture Texas, Arizona, and Alaska, for example.Voting Rights Act Amendments of 1970, Pub. L. No. 91-285, § 4. 84 Stat. 314, 315(1970); Voting Rights Act Amendments of 1975, Pub. L. No. 94-73, §§ 202–03, 89Stat. 400, 401 (1975). The 1982 and 2006 renewals of the VRA did not include newor additional triggers. See 42 U.S.C. § 1973b(b) (2000).
\\server05\productn\N\NYL\10-1\NYL101.txt unknown Seq: 12 29-MAY-07 17:22
12 LEGISLATION AND PUBLIC POLICY [Vol. 10:1
TA
BL
E 2
RE
POR
TE
D R
EG
IST
RA
TIO
N P
ER
CE
NT
AG
ES*
BY
RA
CE
IN
GE
OR
GIA
AN
D O
UT
SID
E T
HE
SO
UT
H,
1980
–200
4
1980
1982
1984
1986
1988
1990
1992
1994
1996
1998
2000
2002
2004
GE
OR
GIA
Bla
ck59
.851
.958
.055
.356
.857
.053
.957
.664
.664
.166
.361
.664
.2W
hite
67.0
59.7
65.7
60.4
63.9
58.1
67.3
55.0
67.8
62.0
59.3
62.7
63.5
Non
-His
pani
c W
hite
s63
.161
.065
.368
.0
NO
N S
OU
TH
Bla
ck60
.661
.767
.263
.165
.958
.463
.058
.362
.058
.561
.757
.0N
AW
hite
69.3
66.7
70.5
66.2
68.5
64.4
70.9
65.6
68.1
63.9
65.9
63.0
NA
* Pe
rcen
tage
s ar
e ca
lcul
ated
usi
ng t
he v
otin
g ag
e po
pula
tion
as t
he d
enom
inat
or.
Sour
ces:
See
sou
rces
cite
d su
pra
not
e 36
.
\\server05\productn\N\NYL\10-1\NYL101.txt unknown Seq: 13 29-MAY-07 17:22
2006] VOTING RIGHTS PROGRESS IN GEORGIA 13
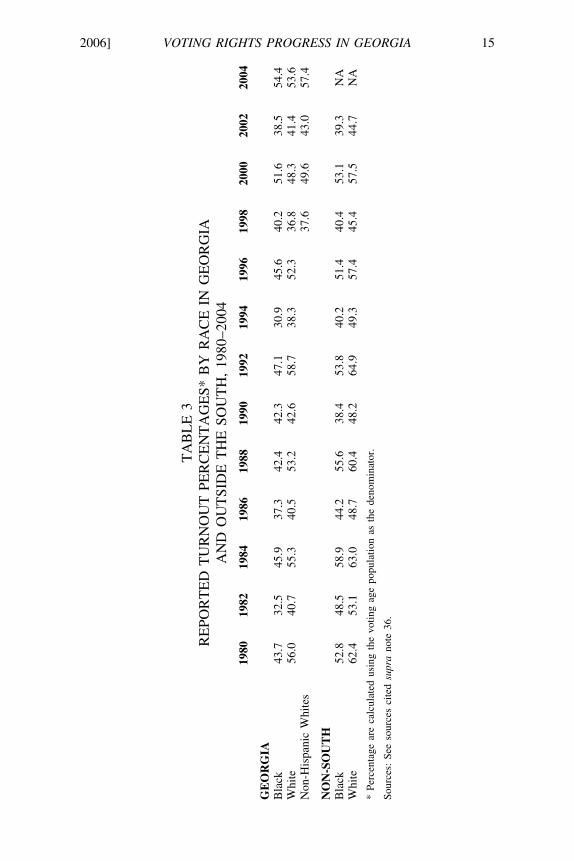
whites that excluded Latinos.39 Although the 2000 Census reportedalmost a half million Latinos in Georgia, as of 2004 barely 30,000—approximately 27% of Latinos eligible to vote—had registered tovote, suggesting that limiting voting data to non-Hispanic whites willresult in a higher percentage of the white voting age population beingregistered.40 Indeed, in the two most recent elections, once Latinosare excluded, the registration rate for whites exceeded that for AfricanAmericans. In 2004, for example, 64.2% of African Americans and68.0% of non-Hispanic whites reporting registering, as compared toonly 63.5% of all whites. Even after removing Latinos from the esti-mates, however, higher proportions of African Americans than whitesreported registering in 1998 and 2000.
Another method of evaluating registration rates in Georgia is tocompare the reported registration rates of Georgians and non-southerners, as shown in Table 2.41 From 1980 through 1994, AfricanAmericans living outside the South invariably reported higher rates ofregistration than did African Americans in Georgia. In 1982, 1984,1988, and 1992, the difference was approximately ten percentagepoints. Beginning with 1996, however, self-reported registration ratesamong African Americans in Georgia have exceeded those for AfricanAmericans outside the region. In the three most recent elections forwhich comparisons are available, registration for African Americansin Georgia is approximately five percentage points higher than fornon-southern African Americans.
These data show that even before the implementation of the “Mo-tor Voter Act” in 199342 and the Help America Vote Act of 2002,43
39. See, e.g., VOTING AND REGISTRATION IN THE ELECTION OF NOVEMBER 1998,supra note 36, at tbl.B (providing registration rates for whites, blacks, and people of RHispanic origin). The word “Latino” first appeared on census forms in 2000. U.S.DEP’T OF COMMERCE, BUREAU OF THE CENSUS, CENSUS 2000 BRIEF: THE HISPANIC
POPULATION 1 (2001), available at http://www.census.gov/prod/2001pubs/c2kbr01-3.pdf.40. VOTING AND REGISTRATION IN THE ELECTION OF NOVEMBER 2004, supra note
36, at tbl.4a. Figures on non-Hispanic white participation have been available from Rthe Census Bureau only since 1994. See, e.g., VOTING AND REGISTRATION IN THE
ELECTION OF NOVEMBER 1994, supra note 36, at tbl.A. R41. A non-southerner is anyone who lives outside the South, defined as the eleven
secession states. See H.D. PRICE, THE NEGRO IN SOUTHERN POLITICS 7 (1957).42. National Voter Registration Act of 1993, Pub. L. No. 103-31, 107 Stat. 77
(codified as amended at 42 U.S.C. §§ 1973gg et seq. (2000)). The Act is more com-monly known as the “Motor Voter Act.” See, e.g., Mitchell F. Crusto, The SupremeCourt’s “New” Federalism: an Anti-Rights Agenda? 16 GA. ST. U. L. REV. 517,530–31 (2000).43. Help America Vote Act of 2002, Pub. L. No. 107-252, 116 Stat. 1666 (codified
as amended at 42 U.S.C. § 15301 (2000)).
\\server05\productn\N\NYL\10-1\NYL101.txt unknown Seq: 14 29-MAY-07 17:22
14 LEGISLATION AND PUBLIC POLICY [Vol. 10:1
both of which were designed to facilitate participation in elections,44
the disparity in African American and white registration rates hadlargely been eliminated. In 2004, African Americans constituted27.4% of all registered voters in Georgia and 27.2% of the state’scitizen voting age population, according to the U.S. Census.45
(ii) Voter Turnout
The racial disparity in voter turnout has also diminished. Asshown in Table 3, in 1980 the Census Bureau estimated that 43.7% ofage-eligible African Americans voted in the general election, com-pared with 56% of whites. In the midterm election of 1982, the racialdisparity dropped to 8.2 percentage points. Voting trends indicategreater racial disparity in presidential than in midterm elections. Until1996, at least 10% more whites than African Americans voted in pres-idential elections, and even in 1996, white turnout exceeded the Afri-can-American figure by almost seven percentage points. In contrast,in midterm elections, the greatest racial differences—which occurredin 1982 and 1994—have been approximately eight percentage points.In 1990, almost identical percentages of African-American and whiteGeorgians went to the polls.
African-American voter turnout has continued to rise in thetwenty-first century, particularly in presidential elections. ReportedAfrican-American turnout rates remained around 40–45% until 2000,when 51.6% of age-eligible African Americans reported voting. Inthe same election, only 48.3% of age-eligible whites reported voting.In the most recent presidential election, African-American participa-tion rates again slightly exceeded those for whites. In midterm elec-tions, which traditionally have lower turnout among both AfricanAmericans and whites, African-American voter participation has notbeen so strong. The proportion of age-eligible African Americanswho reported voting in midterm elections peaked in 1990 at 42.3%;after 1990, the number seesawed, dropping to 30.9% in 1994, rising tojust over 40% in 1998, and then ebbing to 38.5% in 2002. African-American turnout in a midterm election has exceeded white turnoutonly once, in 1998.
Excluding data for Hispanic whites results in a higher turnoutrate for non-Hispanic whites, although from 1998 to 2002, the in-crease was less than two percentage points. Even excluding data for
44. See 42 U.S.C. § 1973gg(b); Pub. L. No. 107-252, 116 Stat. 1666 (2002).45. See VOTING AND REGISTRATION IN THE ELECTION OF NOVEMBER 2004, supra
note 36 at tbl.4a. R
\\server05\productn\N\NYL\10-1\NYL101.txt unknown Seq: 15 29-MAY-07 17:22
2006] VOTING RIGHTS PROGRESS IN GEORGIA 15
TA
BL
E 3
RE
POR
TE
D T
UR
NO
UT
PE
RC
EN
TA
GE
S* B
Y R
AC
E I
N G
EO
RG
IAA
ND
OU
TSI
DE
TH
E S
OU
TH
, 19
80–2
004
1980
1982
1984
1986
1988
1990
1992
1994
1996
1998
2000
2002
2004
GE
OR
GIA
Bla
ck43
.732
.545
.937
.342
.442
.347
.130
.945
.640
.251
.638
.554
.4W
hite
56.0
40.7
55.3
40.5
53.2
42.6
58.7
38.3
52.3
36.8
48.3
41.4
53.6
Non
-His
pani
c W
hite
s37
.649
.643
.057
.4
NO
N-S
OU
TH
Bla
ck52
.848
.558
.944
.255
.638
.453
.840
.251
.440
.453
.139
.3N
AW
hite
62.4
53.1
63.0
48.7
60.4
48.2
64.9
49.3
57.4
45.4
57.5
44.7
NA
* Pe
rcen
tage
are
cal
cula
ted
usin
g th
e vo
ting
age
popu
latio
n as
the
den
omin
ator
.
Sour
ces:
See
sou
rces
cite
d su
pra
not
e 36
.
\\server05\productn\N\NYL\10-1\NYL101.txt unknown Seq: 16 29-MAY-07 17:22
16 LEGISLATION AND PUBLIC POLICY [Vol. 10:1
Hispanic whites, since 1998, turnout rates for African Americans andnon-Hispanic whites in Georgia have differed by fewer than five per-centage points. In 1998 and 2000, African-American turnout ex-ceeded the non-Hispanic white figure by at least two percentagepoints. In 2002, the non-Hispanic white turnout rate was 4.5 percent-age points above the African-American rate, and in 2004 it was threepercentage points higher than the African-American rate.
As was the case with registration rates, progress in voter turnoutcan also be evaluated by comparing Georgia to states outside theSouth, as shown in the bottom half of Table 3. In the 1980s, non-southern African Americans voted at much higher rates than those inGeorgia. In 1982, for example, the difference between non-southernAfrican Americans and African Americans in Georgia reached sixteenpercentage points, and it declined only slightly, to thirteen percentagepoints, in the next presidential election. In the three most recent elec-tions for which non-southern figures are available, however, the re-ported participation rates for African Americans in Georgia and non-southern states have been essentially equal. In 1998, just over 40% ofAfrican Americans, both non-southern and in Georgia, reported vot-ing, while in 2002, the figure for both was approximately 39%. In2000, African-Americans outside the South reported participating at arate 1.5 percentage points higher than those in Georgia. These datasuggest that much of the disparity in voter turnout of twenty years agohas been eliminated. In particular, in two of the four most recent elec-tion years, the reported African-American participation rate in Georgiaexceeded that for non-Hispanic whites. While African-American par-ticipation rates are slightly higher outside the South than in Georgia,since 1998 the differences have been minimal.
b) Data from the Georgia Secretary of State
A problem with self-reported political participation data, such asthat compiled by the U.S. Census, is that respondents tend to givesocially approved answers46—some individuals who were unregis-tered will tell a pollster that they had registered,47 and because of theheavy emphasis placed upon the civic duty of voting, a number ofnon-voters will report that they went to the polls.48 Georgia, however,
46. William T. Harbaugh, If People Vote Because They Like To, Then Why Do SoMany of Them Lie?, PUB. CHOICE, Oct. 1996, at 64.47. Id. at 63 & n.2.48. Id. at 63.
\\server05\productn\N\NYL\10-1\NYL101.txt unknown Seq: 17 29-MAY-07 17:22
2006] VOTING RIGHTS PROGRESS IN GEORGIA 17
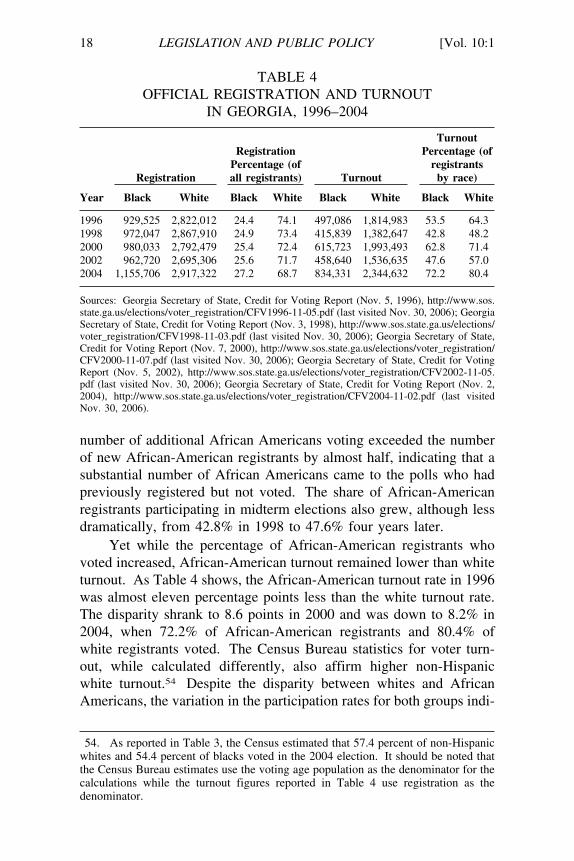
is one of five states that maintains voter registration data by race,49
making it possible to have more accurate registration data concerningrace.50 Additionally, since 1996, Georgia’s Secretary of State hasconducted a post-election audit of voter turnout by going throughvoter sign-in sheets at poll sites and cross-checking that informationagainst the registration data showing the voter’s race.51 Unlike thefigures provided by the Census Bureau, these are not estimates butactual counts.52 As shown in Table 4, the number of African-Ameri-can registrants increased by more than 225,000 between 1996 and2004. In 1996, African Americans constituted 24.4% of all regis-trants, but by 2004 they accounted for 27.2% of registrants. The 2004figure almost exactly equals the Census Bureau’s estimate of the Afri-can-American share of Georgia’s registered voters for the same year.53
The Georgia Secretary of State data demonstrate that African-American turnout has also increased. As shown in Table 4, slightlyfewer than 500,000 African Americans in Georgia voted in the 1996presidential election. Eight years later, the number of African Ameri-cans voting for president increased by 337,000. During the sameeight-year span, the share of all African-American registrants going tothe polls in presidential elections grew from 53.5% to 72.2%. The
49. GA. CODE ANN. § 21-2-217(a) (1994); Application for Voter Registration,available at http://www.sos.state.ga.us/elections/voter_registration/vra_2003_update.pdf. See also Ga. Sec. of State, Voter Registration Statistics, http://www.sos.state.ga.us/elections/voter_registration/statistics.htm (last visited Feb. 5, 2007). The others areFlorida, Louisiana, North Carolina, and South Carolina. See FLA. STAT. ANN.§ 97.052(2)(f) (2006); LA. REV. STAT. ANN. § 18:104(A)-(B) (2006); N.C. GEN.STAT. § 163-82.10(b) (2006); S.C. CODE ANN. § 7-5-170 (2006). All five states arecovered in whole or in part by section 5 of the Voting Rights Act. Voting Rights Actof 1965 § 4, 42 U.S.C. § 247(a) (1965). Because only five states maintain this kind ofdata, Georgia’s Secretary of State data cannot easily be compared to data from theother forty-five states.50. This information is likely to be more accurate even though individuals may not
accurately report their race or opt for the “other” category. See, for example, theregistration rules for Florida, which observe that “the Florida Voter Registration Ap-plication Form does not require the applicant to include sex or race/ethnicity on theapplication.” Florida Division of Elections, http://election.dos.state.fl.us/voterreg/index.shtml (last visited Sept. 12, 2006).51. See Georgia Secretary of State, Credit for Voting Reports, http://www.sos.state.
ga.us/ELECTIONS/voter_registration/credit_for_voting_reports.htm (last visited Nov.6, 2006).52. Id. The Secretary of State’s website cautions that these numbers do not always
match the number of ballots cast. See also CHARLES STEWART III, MEASURING THE
IMPROVEMENT (OR LACK OF IMPROVEMENT) IN VOTING SINCE 2000 IN THE U.S. 22 &n.28 (2006), http://web.mit.edu/cstewart/www/papers/measuring_2.pdf (questioningthe accuracy of the Credit for Voting Reports).53. See VOTING AND REGISTRATION IN THE ELECTION OF NOVEMBER 2004, supra
note 36, at tbl.4a. R
\\server05\productn\N\NYL\10-1\NYL101.txt unknown Seq: 18 29-MAY-07 17:22
18 LEGISLATION AND PUBLIC POLICY [Vol. 10:1
TABLE 4OFFICIAL REGISTRATION AND TURNOUT
IN GEORGIA, 1996–2004
TurnoutRegistration Percentage (of
Percentage (of registrantsRegistration all registrants) Turnout by race)
Year Black White Black White Black White Black White
1996 929,525 2,822,012 24.4 74.1 497,086 1,814,983 53.5 64.31998 972,047 2,867,910 24.9 73.4 415,839 1,382,647 42.8 48.22000 980,033 2,792,479 25.4 72.4 615,723 1,993,493 62.8 71.42002 962,720 2,695,306 25.6 71.7 458,640 1,536,635 47.6 57.02004 1,155,706 2,917,322 27.2 68.7 834,331 2,344,632 72.2 80.4
Sources: Georgia Secretary of State, Credit for Voting Report (Nov. 5, 1996), http://www.sos.state.ga.us/elections/voter_registration/CFV1996-11-05.pdf (last visited Nov. 30, 2006); GeorgiaSecretary of State, Credit for Voting Report (Nov. 3, 1998), http://www.sos.state.ga.us/elections/voter_registration/CFV1998-11-03.pdf (last visited Nov. 30, 2006); Georgia Secretary of State,Credit for Voting Report (Nov. 7, 2000), http://www.sos.state.ga.us/elections/voter_registration/CFV2000-11-07.pdf (last visited Nov. 30, 2006); Georgia Secretary of State, Credit for VotingReport (Nov. 5, 2002), http://www.sos.state.ga.us/elections/voter_registration/CFV2002-11-05.pdf (last visited Nov. 30, 2006); Georgia Secretary of State, Credit for Voting Report (Nov. 2,2004), http://www.sos.state.ga.us/elections/voter_registration/CFV2004-11-02.pdf (last visitedNov. 30, 2006).
number of additional African Americans voting exceeded the numberof new African-American registrants by almost half, indicating that asubstantial number of African Americans came to the polls who hadpreviously registered but not voted. The share of African-Americanregistrants participating in midterm elections also grew, although lessdramatically, from 42.8% in 1998 to 47.6% four years later.
Yet while the percentage of African-American registrants whovoted increased, African-American turnout remained lower than whiteturnout. As Table 4 shows, the African-American turnout rate in 1996was almost eleven percentage points less than the white turnout rate.The disparity shrank to 8.6 points in 2000 and was down to 8.2% in2004, when 72.2% of African-American registrants and 80.4% ofwhite registrants voted. The Census Bureau statistics for voter turn-out, while calculated differently, also affirm higher non-Hispanicwhite turnout.54 Despite the disparity between whites and AfricanAmericans, the variation in the participation rates for both groups indi-
54. As reported in Table 3, the Census estimated that 57.4 percent of non-Hispanicwhites and 54.4 percent of blacks voted in the 2004 election. It should be noted thatthe Census Bureau estimates use the voting age population as the denominator for thecalculations while the turnout figures reported in Table 4 use registration as thedenominator.
\\server05\productn\N\NYL\10-1\NYL101.txt unknown Seq: 19 29-MAY-07 17:22
2006] VOTING RIGHTS PROGRESS IN GEORGIA 19
cates that African Americans are not subject to systematic discrimina-tion at the polling place; in fact, the African-American turnout rate in2004 exceeds the white turnout rate in previous years.
c) Alternative Explanations for Low African-AmericanTurnout
The totality of the data thus suggest that African Americans inGeorgia no longer face serious obstacles that prevent them from regis-tering or voting, even though African-American turnout remains lowerthan white turnout. Political science research suggests another expla-nation: lingering disparities in participation rates among ethnic groupsmay be due more to differences in socioeconomic characteristics thanobstacles to registration.55 Indeed, the literature on American politicalparticipation consistently finds that socioeconomic status (SES) is themost important determinant of political involvement across ethnic andracial groups.56 Additional research has found “excess participation”among African Americans after controlling for SES.57 The research,however, is not wholly consistent. One study found that African-American voter participation lags behind white participation evenwhen controls for socio-demographic influences, such as education,were introduced.58 Other researchers have found that once they con-trol for SES, there is little difference in the participation rates of dif-ferent racial and ethnic groups.59
Socioeconomic status matters, but so does political effort. Kathe-rine Tate argues that participation by African Americans is associatedwith education, political interest, and partisanship.60 She also ob-serves that unlike participation in churches or political organizations,intensity of racial identity does not drive participation.61 Tate notes
55. RAYMOND E. WOLFINGER & STEVEN J. ROSENSTONE, WHO VOTES 90 (1980).56. See, e.g., SIDNEY VERBA, KAY LEHMAN SCHLOZMAN & HENRY E. BRADY,
VOICE AND EQUALITY: CIVIC VOLUNTEERISM IN AMERICAN POLITICS 19, 522–23(1995); WOLFINGER & ROSENSTONE, supra note 55, at 13–36; Jan E. Leighley & RJonathan Nagler, Socioeconomic Class Bias in Turnout, 1964–88, 86 AM. POL. SCI.REV. 725, 725 (1992); Jan E. Leighley & Jonathan Nagler, Individual and SystemicInfluences on Turnout: Who Votes? 1984, 54 J. POL. 718, 720–21 (1992).57. See, e.g., Thomas M. Guterbock & Bruce London, Race, Political Organiza-
tion, and Participation: An Empirical Test of Four Competing Theories, 48 AM. SOC.REV. 439, 450 (1983).58. Abramson & Claggett, supra note 37, at 416–19. R59. Jan E. Leighley & Arnold Vedlitz, Race, Ethnicity, and Political Participation:
Competing Models and Contrasting Explanations, 61 J. POL. 1092, 1108 (1999).60. Katherine Tate, Black Political Participation in the 1984 and 1988 Presidential
Elections, 85 AM. POL. SCI. REV. 1159, 1168 (1991).61. Id. at 1159.
\\server05\productn\N\NYL\10-1\NYL101.txt unknown Seq: 20 29-MAY-07 17:22
20 LEGISLATION AND PUBLIC POLICY [Vol. 10:1
that registration without mobilization is insufficient to promote turn-out.62 Similarly, Arnold Vedlitz finds that while intensive voter regis-tration drives do increase turnout over the short term for presidentialelections, without additional efforts, such as turnout campaigns, long-term voting among all newer registrants trails off.63 In political par-ties’ key mobilization efforts, African Americans are contacted lessoften than whites, which primarily arises from a lack of contact by theRepublican Party.64 Those who are contacted belong to civic cultureorganizations that possess strong social networks.65 While educationstill matters, it is one of several factors—including party contact, par-tisanship, and church mobilization—that can increase the probabilityof voting.66
III.AFRICAN-AMERICANS ELECTED TO OFFICE
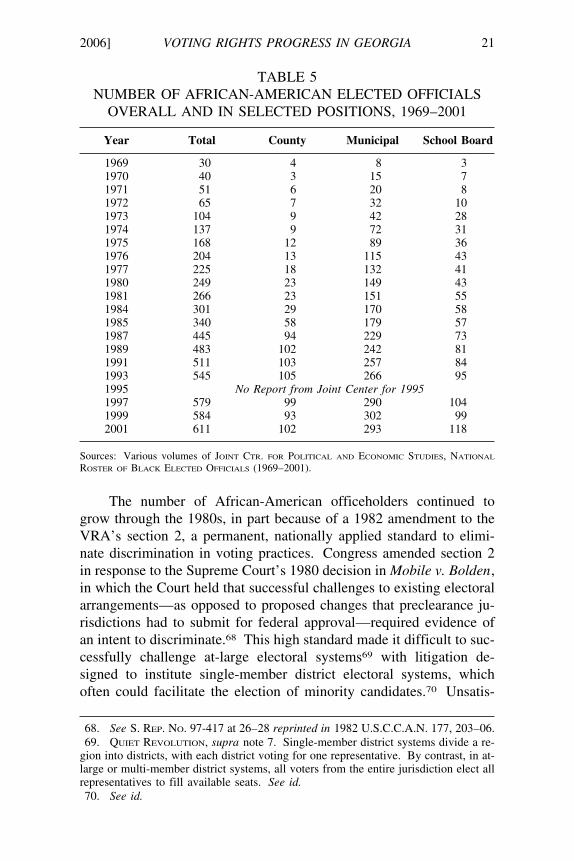
Since the passage of the VRA, African Americans have becomemuch more successful at winning elected offices in Georgia. In 1969,thirty African Americans held office in Georgia, fourteen of whomserved in the state legislature.67 As Table 5 shows, another eight saton city councils, and three served on school boards. By 1973, thenumber of African-American officials in Georgia had risen to overone hundred, and three years later it topped two hundred. By 1984,just over three hundred African Americans held public office in Geor-gia, with 170 serving on city councils and another 58 serving onschool boards.
62. Id. at 1173.63. Arnold Vedlitz, Voter Registration Drives and Black Voting in the South, 47 J.
POL. 643, 650 (1985).64. See, e.g., Peter W. Wielhouwer, Releasing the Fetters: Parties and the Mobili-
zation of the African-American Electorate, 62 J. POL. 206, 210–12 (2000).65. See id. at 213–14.66. See id. at 217–18.67. JOINT CTR. FOR POLITICAL AND ECONOMIC STUDIES, NATIONAL ROSTER OF
BLACK ELECTED OFFICIALS (1969). By comparison, in 1965 only three AfricanAmericans held public office in Georgia. See Bob Kemper & Carlos Campos, VoterLaw a Divisive Issue for Georgians: But All Acknowledge Progress, ATLANTA J.-CONST., July 21, 2006, at A4.
\\server05\productn\N\NYL\10-1\NYL101.txt unknown Seq: 21 29-MAY-07 17:22
2006] VOTING RIGHTS PROGRESS IN GEORGIA 21
TABLE 5NUMBER OF AFRICAN-AMERICAN ELECTED OFFICIALS
OVERALL AND IN SELECTED POSITIONS, 1969–2001
Year Total County Municipal School Board
1969 30 4 8 31970 40 3 15 71971 51 6 20 81972 65 7 32 101973 104 9 42 281974 137 9 72 311975 168 12 89 361976 204 13 115 431977 225 18 132 411980 249 23 149 431981 266 23 151 551984 301 29 170 581985 340 58 179 571987 445 94 229 731989 483 102 242 811991 511 103 257 841993 545 105 266 951995 No Report from Joint Center for 19951997 579 99 290 1041999 584 93 302 992001 611 102 293 118
Sources: Various volumes of JOINT CTR. FOR POLITICAL AND ECONOMIC STUDIES, NATIONAL
ROSTER OF BLACK ELECTED OFFICIALS (1969–2001).
The number of African-American officeholders continued togrow through the 1980s, in part because of a 1982 amendment to theVRA’s section 2, a permanent, nationally applied standard to elimi-nate discrimination in voting practices. Congress amended section 2in response to the Supreme Court’s 1980 decision in Mobile v. Bolden,in which the Court held that successful challenges to existing electoralarrangements—as opposed to proposed changes that preclearance ju-risdictions had to submit for federal approval—required evidence ofan intent to discriminate.68 This high standard made it difficult to suc-cessfully challenge at-large electoral systems69 with litigation de-signed to institute single-member district electoral systems, whichoften could facilitate the election of minority candidates.70 Unsatis-
68. See S. REP. NO. 97-417 at 26–28 reprinted in 1982 U.S.C.C.A.N. 177, 203–06.69. QUIET REVOLUTION, supra note 7. Single-member district systems divide a re- R
gion into districts, with each district voting for one representative. By contrast, in at-large or multi-member district systems, all voters from the entire jurisdiction elect allrepresentatives to fill available seats. See id.70. See id.
\\server05\productn\N\NYL\10-1\NYL101.txt unknown Seq: 22 29-MAY-07 17:22
22 LEGISLATION AND PUBLIC POLICY [Vol. 10:1
fied with the Bolden holding, Congress rewrote section 2 to changethe standard from discriminatory intent to discriminatory effect.71
This lower evidentiary burden resulted in hundreds of challenges to at-large electoral systems and dramatically increased the use of single-member districts across the nation.
As a consequence of this change, single-member district systemsreplaced many at-large systems, and the number of African-Americanofficeholders continued to grow.72 By 1987, the total number of Afri-can Americans holding public office in Georgia was almost 150%higher than the 1984 figure. By 1991, more than five hundred AfricanAmericans were serving in Georgia. After 1991, however, the growthrate slowed; in 2001, 611 African Americans held office in Georgia.As in previous years, approximately half of African-American officeholders in 2001 served at the municipal level, with another hundredserving in county offices and a slightly larger number sitting on schoolboards. Today the number of African-American officeholders mayexceed eight hundred.73 The next sections will review the growth inthe number of African Americans in Congress, the state legislature,and statewide offices.
A. African Americans in Congress
1. African-American Success in the House of Representatives
Since 1972, when Georgia and Texas became the first southernstates to elect an African American to Congress since the earliest yearsof the twentieth century,74 African-American congresspersons inGeorgia have occasionally won their seats by fashioning biracial coali-tions in majority-white districts.75 The first to do so was civil rightsactivist Andrew Young,76 who won a seat in the House of Representa-tives two years after he won the Democratic nomination but lost in the
71. Voting Rights Act Amendments of 1982, Pub. L. No. 97-205, § 3(b), 96 Stat.131, 134 (1982).72. See supra Table 5.73. See Kemper & Campos, supra note 67. The Joint Center for Political and Eco- R
nomic Studies ceased performing annual surveys of the numbers of black elected offi-cials in 2001, so the number of black elected officials after the 2006 election cannotbe stated with certainty. See Joint Center Publications: Black Elected Officials, http://www.jointcenter.org/publications1/BEO.php.74. MICHAEL BARONE, GRANT UJIFUSA & DOUGLAS MATTHEWS, THE ALMANAC OF
AMERICAN POLITICS 1976, at 198 (1975) [hereinafter 1976 ALMANAC] ; Timeline, ST.PETERSBURG TIMES, Feb. 1, 1991, at 2X.75. See infra Table 6 (listing African American members of Congress from Georgia
who represented majority white districts).76. See 1976 ALMANAC, supra note 74. R
\\server05\productn\N\NYL\10-1\NYL101.txt unknown Seq: 23 29-MAY-07 17:22
2006] VOTING RIGHTS PROGRESS IN GEORGIA 23
general election to a Republican incumbent.77 Young triumphed inthe Fifth Congressional District, which was 44% African American,by building a biracial coalition that included substantial backing fromthe white community.78 Young won reelection in 1974 and 1976, tak-ing two-thirds of the vote in the latter general election.79 After histhird victory, Young resigned from Congress when President JimmyCarter appointed him as U.S. Ambassador to the United Nations.80
In the special election to fill the vacancy created by Young’s res-ignation, white liberal Wyche Fowler led a field of twelve candidateswith 40% of the vote,81 and in the subsequent runoff, Fowler easilydefeated civil rights hero John Lewis with 62% of the vote.82 Fowlerheld the Fifth Congressional District seat for a decade,83 during whichtime he defeated a number of African-American challengers. Fowlercontinued to win reelections even after the district became 65% Afri-can American following the 1982 redrawing of congressional districtsusing population data from the 1980 Census.84 As had been the casewith his predecessor, Fowler succeeded by appealing to a biracial coa-lition, as shown in Table 6.85
When Fowler decided to seek a U.S. Senate seat in 1986, a largefield of candidates—all but one of whom was African American—entered the Fifth District Democratic primary.86 In the primary, statesenator Julian Bond led with 47% of the vote while John Lewis, mak-
77. Paul Delaney, Blacks Reassess Political Role After Atlanta Loss, N.Y. TIMES,Nov. 9, 1970, at 31.78. 1976 ALMANAC, supra note 74. R79. See B. Drummond Ayres Jr., Southern Blacks Make Major Gains, N.Y. TIMES,
Nov. 11, 1974, at 30; CONGRESSIONAL QUARTERLY’S GUIDE TO U.S. ELECTIONS 1279(3d ed. 1994).80. MICHAEL BARONE, GRANT UJIFUSA & DOUGLAS MATTHEWS, THE ALMANAC OF
AMERICAN POLITICS 1978, at 198 (1977).81. MICHAEL BARONE, GRANT UJIFUSA & DOUGLAS MATTHEWS, THE ALMANAC OF
AMERICAN POLITICS 1980, at 211–12 (1979).82. Id. See infra note 178 and accompanying text. R83. RICHARD F. FENNO, JR., SENATORS ON THE CAMPAIGN TRAIL 160 (Univ. of
Okla. Press 1996).84. See 2 Incumbents in Georgia Win Re-election to Seats in House, N.Y. TIMES,
Dec. 1, 1982, at A18.85. See id. (reporting that although Fowler’s district was only 35 percent white, he
won over 79 percent of the vote); Editorial, Securing Voting Rights, BOSTON GLOBE,Aug. 31, 1982, editorial Page 1 (explaining Fowler’s appeal to black voters).86. Julian Bond to Seek Congressional Seat, N.Y. TIMES, Feb. 1, 1986, at 1.8;
William E. Schmidt, Fowler Takes Strong Lead in Senate Race in Georgia, N.Y.TIMES, Aug. 13, 1986, at A.16.
\\server05\productn\N\NYL\10-1\NYL101.txt unknown Seq: 24 29-MAY-07 17:22
24 LEGISLATION AND PUBLIC POLICY [Vol. 10:1
ing another bid for the House, polled 35% of the vote.87 In the crucialrunoff, Lewis prevailed, in part by winning more than 80% of thewhite vote.88 While Bond had attracted the bulk of the African-Amer-ican vote,89 Lewis’s biracial coalition produced a 52% majority.90
After the 1992 elections, two other African Americans joinedLewis in Congress: Sanford Bishop, from the Second District in south-west Georgia, and Cynthia McKinney, who won the Eleventh District,which stretched from Atlanta’s eastern suburbs to Augusta and Savan-nah.91 With three African Americans in the eleven-person delegation,African Americans had achieved a level of representation in the Houseequal to their share of Georgia’s 1990 population.92
In 2002, following redistricting after the 2000 Census,93 DavidScott became the fourth African American in Georgia’s House delega-tion.94 With four African Americans in Congress, Georgia equaledthe largest number of African-American members ever to represent
87. See Art Harris, Political Upset Spells New Era for Atlanta’s Blacks, SEATTLE
TIMES, Sept. 7, 1986, at A.7; MICHAEL BARONE & GRANT UJIFUSA, THE ALMANAC OF
AMERICAN POLITICS 1988, at 299 (1987) [hereinafter 1988 ALMANAC] .88. See Robert A. Jordan, ‘Biracial Appeal’ the Secret at Polls; Black Candidates
Building Coalitions with White Minorities to Produce Election-Day Victories, BOS-
TON GLOBE, Sept. 14, 1986, at A14.89. Id.90. 1988 ALAMANAC, supra note 87, at 300. John Lewis continues to represent the R
Fifth District and is the dean of Georgia’s House delegation. See Colleagues StayMum on McKinney’s Defeat, AUGUSTA CHRONICLE, Aug. 12, 2006, at B2. Lewis waselected to the House in 1986, making him the most senior congressional representa-tive from Georgia. See MICHAEL BARONE & RICHARD E. COHEN, THE ALMANAC OF
AMERICAN POLITICS 2006, at 483–513 (2005) [hereinafter 2006 ALMANAC] .91. MICHAEL BARONE & GRANT UJIFUSA, THE ALMANAC OF AMERICAN POLITICS
1994, at 334–57 (1993).92. See JESSE MCKINNON, C2KBR/01-5, U.S. CENSUS BUREAU, THE BLACK POPU-
LATION: 2000, CENSUS 2000 BRIEF 4 tbl.2 (2001), available at http://www.census.gov/prod/2001pubs/c2kbr01-5.pdf (indicating African Americans constituted 27 per-cent of Georgia’s population in 1990).93. David Pendered, Senate Passes Redrawn Districts, ATLANTA J.-CONST., Aug.
11, 2001, at A6. The 2001 Georgia redistricting was a concerted partisan effort tomaximize Democratic opportunities through the efficient use of black votes. See JimGalloway, Redistricting Expands White Base, ATLANTA J.-CONST., Aug. 16, 2001, atA1; Jim Wooten, Editorial, Secret Deals Silence Voices of Many Voters, ATLANTA J.-CONST., Aug. 12, 2001, at C8. The redistricting created a fourth congressional districtthat elected a black candidate in suburban Atlanta (the 13th), and another, the 12thdistrict that ran from Athens, east through Augusta and then south to Savannah, thathad the potential to elect a black member. See infra notes 106–20 and accompanying Rtext. These districts were challenged but survived scrutiny in Larios v. Perdue, 306 F.Supp. 2d 1190 (N.D. Ga. 2003).94. In the 2002 general election, Scott garnered 59.6 percent of the vote, handily
winning the newly created District 13 House seat. See 2006 ALMANAC, supra note90, at 511–13; Electing the New Congress: Races for the House, N.Y. TIMES, Nov. 7, R2002, at B10.
\\server05\productn\N\NYL\10-1\NYL101.txt unknown Seq: 25 29-MAY-07 17:22
2006] VOTING RIGHTS PROGRESS IN GEORGIA 25
any state in Congress at one time. Notably, the other states that havehad four African Americans serving in the House have much largerdelegations than Georgia.95 When Scott joined the Georgia delega-tion, which then included thirteen members, African Americans’ shareof Georgia House seats (31%) exceeded the percentage of AfricanAmericans in Georgia’s 2000 population (29.5%).96
2. Redistricting and Concern About the Need for Majority African-American Districts
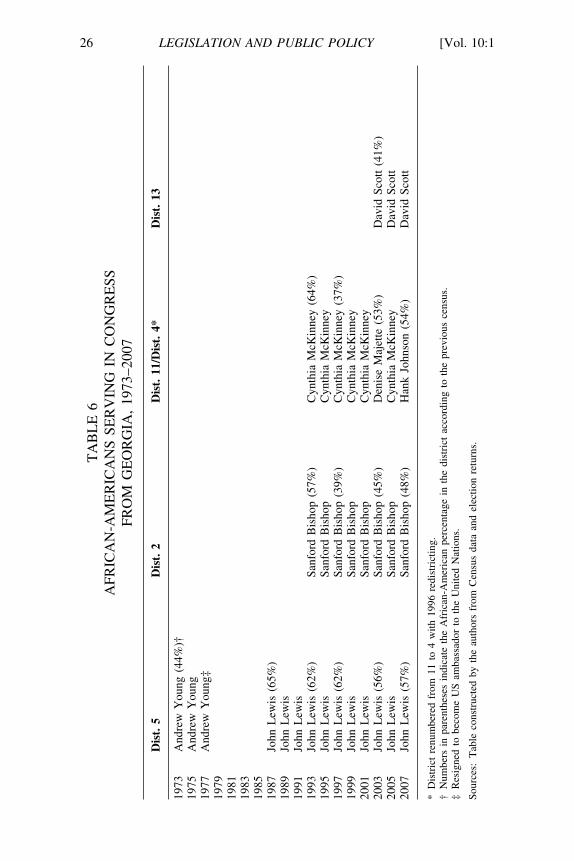
As recent electoral history has shown, an African-American ma-jority in the population—to say nothing of an African-American ma-jority among registrants—is not necessary for African Americans towin Georgia congressional seats. Table 6 shows African-Americansfrom Georgia serving in Congress and indicates the percentage of Af-rican Americans in the population of the district at the time.
The data demonstrate that, of thirty-three congressional electionswon by African Americans, fifteen occurred in districts in which lessthan half of the population was African American. Of the eighteencontests won by African Americans in majority-black districts, elevenoccurred in the Fifth District. Sanford Bishop has won six of his eightelections when his district had a white majority.97 David Scott hasalso won in a district where African Americans did not constitute amajority of either the population or the registrants. Three of CynthiaMcKinney’s six victories came in a district in which whites outnum-bered African Americans,98 and when she lost her 2002 reelectionbid,99 the winner was another African-American woman, state courtjudge Denise Majette.100 McKinney regained the seat in 2004 but lost
95. Currently the 29-member New York delegation and the 53-member Californiadelegation each has four African-American representatives. See 2006 ALMANAC,supra note 90, at 167–311, 1158–236. R96. See MCKINNON, supra note 92. R97. Bishop’s district was altered by the district court in Georgia in Johnson v.
Miller, 922 F. Supp. 1552 (S.D. Ga. 1995) (finding the Second District to be improp-erly redrawn after remand from the Supreme Court). The Miller litigation is dis-cussed infra at notes 101–05 and accompanying text. R98. See Ellen Katz, Resurrecting the White Primary, 153 U. PA. L. REV. 325,
382–84 (2004); BIOGRAPHICAL DIRECTORY OF THE UNITED STATES CONGRESS:CYNTHIA ANN MCKINNEY, available at http://bioguide.congress.gov/scripts/biodis-play.pl?index=M000523 (last visited Feb. 11, 2007).99. See Katz, supra note 98 at 384–86. R100. Id. See also Ben Smith & David A. Milliron, Vote Analysis: GOP Not Key in
McKinney Loss, ATLANTA J.-CONST., Oct. 15, 2002, at A1. Prior to the election,prominent blacks had distanced themselves from McKinney after she suggested thatPresident Bush ignored advanced warnings of the Sept. 11th attacks in order to profitfrom the subsequent wars. These comments played a role in her subsequent defeat.
\\server05\productn\N\NYL\10-1\NYL101.txt unknown Seq: 26 29-MAY-07 17:22
26 LEGISLATION AND PUBLIC POLICY [Vol. 10:1
TA
BL
E 6
AFR
ICA
N-A
ME
RIC
AN
S SE
RV
ING
IN
CO
NG
RE
SSFR
OM
GE
OR
GIA
, 19
73–2
007
Dis
t. 5
Dis
t. 2
Dis
t. 1
1/D
ist.
4*
Dis
t. 1
3
1973
And
rew
You
ng (
44%
)†19
75A
ndre
w Y
oung
1977
And
rew
You
ng‡
1979
1981
1983
1985
1987
John
Lew
is (
65%
)19
89Jo
hn L
ewis
1991
John
Lew
is19
93Jo
hn L
ewis
(62
%)
Sanf
ord
Bis
hop
(57%
)C
ynth
ia M
cKin
ney
(64%
)19
95Jo
hn L
ewis
Sanf
ord
Bis
hop
Cyn
thia
McK
inne
y19
97Jo
hn L
ewis
(62
%)
Sanf
ord
Bis
hop
(39%
)C
ynth
ia M
cKin
ney
(37%
)19
99Jo
hn L
ewis
Sanf
ord
Bis
hop
Cyn
thia
McK
inne
y20
01Jo
hn L
ewis
Sanf
ord
Bis
hop
Cyn
thia
McK
inne
y20
03Jo
hn L
ewis
(56
%)
Sanf
ord
Bis
hop
(45%
)D
enis
e M
ajet
te (
53%
)D
avid
Sco
tt (4
1%)
2005
John
Lew
isSa
nfor
d B
isho
pC
ynth
ia M
cKin
ney
Dav
id S
cott
2007
John
Lew
is (
57%
)Sa
nfor
d B
isho
p (4
8%)
Han
k Jo
hnso
n (5
4%)
Dav
id S
cott
*D
istr
ict
renu
mbe
red
from
11
to 4
with
199
6 re
dist
rict
ing.
†N
umbe
rs i
n pa
rent
hese
s in
dica
te t
he A
fric
an-A
mer
ican
per
cent
age
in t
he d
istr
ict
acco
rdin
g to
the
pre
viou
s ce
nsus
.‡
Res
igne
d to
bec
ome
US
amba
ssad
or t
o th
e U
nite
d N
atio
ns.
Sour
ces:
Tab
le c
onst
ruct
ed b
y th
e au
thor
s fr
om C
ensu
s da
ta a
nd e
lect
ion
retu
rns.
\\server05\productn\N\NYL\10-1\NYL101.txt unknown Seq: 27 29-MAY-07 17:22
2006] VOTING RIGHTS PROGRESS IN GEORGIA 27
again in the 2006 Democratic primary, this time to an African-Ameri-can male. The ability of African Americans to win congressional seatsin districts in which most voters are white provides evidence that atleast a share of the white electorate is quite willing to have an African-American representative.
When the Department of Justice (DOJ) reviewed Georgia’s con-gressional districting plans in the early 1990s, however, it seemed toassume that African Americans could be elected only from majority-black districts: in rejecting the state’s first two districting plans, theDOJ pushed the state to create three majority-black districts.101 Thisassumption was put to the test after the Supreme Court struck downGeorgia’s Eleventh District for violating the Equal Protection Clauseof the Fourteenth Amendment to the U.S. Constitution.102 The Courtconcluded that, in drawing this district, the Georgia General Assemblyviolated the U.S. Constitution by relying predominately on race in de-termining the district’s boundaries; the district’s irregular shape, withseveral appendages drawn as a “deliberate attempt to bring blackpopulations into the district,” subordinated traditional districting prin-ciples such as “compactness, contiguity, and respect for political sub-divisions.”103 This case, Miller v. Johnson, touched off widespreadconcern, especially in the minority community, that redrawing the ma-jority black districts to increase their white populations would end thecareers of African-American legislators.104 The 1996 election provedthose fears to be unfounded, as both Bishop and McKinney easily wonreelection in their new majority-white districts, defeating white chal-lengers in both the Democratic primary and the general election.105
Some sought to discount these victories by attributing them toincumbency, asserting that had the seats been open, whites wouldhave won.106 The 2002 election provided a partial test of that proposi-
See Lynette Clemetson, For Black Politicians, 2 Races Suggest a Rise of New Tactics,N.Y. TIMES, Aug. 22, 2002, at A1.101. See Miller v. Johnson, 515 U.S. 900, 917–22 (1995); Letters from John R.
Dunne, Assistant Attorney General, to Mark M. Cohen, Senior Assistant AttorneyGeneral (Jan. 21, 1992 & Mar. 20, 1992).102. See Miller v. Johnson, 515 U.S. 900, 903, 924–28 (1995).103. See id. at 916–17.104. David G. Savage, Despite Redistricting Dispute, Black Lawmakers Win Reelec-
tion, L.A. TIMES, Nov. 9, 1996, at 10.105. Id.; MICHAEL BARONE & GRANT UJIFUSA, ALMANAC OF AMERICAN POLITICS
1998, at 410–16 (1997).106. Cynthia A. McKinney, Op-Ed., A Product of The Voting Rights Act, WASH.
POST, Nov. 26, 1996, at A15.
\\server05\productn\N\NYL\10-1\NYL101.txt unknown Seq: 28 29-MAY-07 17:22
28 LEGISLATION AND PUBLIC POLICY [Vol. 10:1
tion on an open seat in the majority-white Thirteenth District.107
There, African-American state senator David Scott faced three exper-ienced challengers, including another African-American state senator,a white state senator, and a former white congressional candidate whohad most recently served as executive director of Georgia’s Demo-cratic Party.108 Not only did Scott defeat these qualified opponents,he managed to win a majority of the vote in the Democratic primary,thus avoiding a runoff.109
African-American candidates were not uniformly successful in2002, however. While Scott won his majority-white district, an Afri-can-American nominee lost in the Twelfth District, which had approx-imately the same racial composition. In that race, African-AmericanChamp Walker, a political novice, won the Democratic nomination ina runoff against another African-American contender.110 Walker,however, proved to be a deeply flawed candidate. He had been ar-rested multiple times, although never convicted,111 and he ran an ineptcampaign in which he performed poorly in some debates and avoidedothers.112 Walker’s greatest strength—his father, Charles Walker—may have also proven to be his greatest liability. The elder Walkerserved as the majority leader in the state senate when the GeorgiaGeneral Assembly drew the district in which his son ran,113 but suspi-cions of corruption had surrounded him, and he ultimately was con-victed on more than 125 federal charges and suspended from his
107. An African American, David Scott, won in a 40.7 percent black district. SeeMICHAEL BARONE WITH RICHARD E. COHEN, ALMANAC OF AMERICAN POLITICS 2004,at 491–92 (2003).108. Id.109. Id.110. See Jim Tharpe & Bryan Long, Election 2002: Congress: Gingrey, Walker
Gain Nominations, ATLANTA J.-CONST., Sept. 11, 2002, at B1. The runoff pittedWalker against African-American state representative Ben Allen. The year prior, Al-len broke from the state Democratic leadership and, with Republican support, pro-posed a redistricting map designed to boost the chances of black candidates. Thismap was eventually rejected. See David Pendered, Black Democrats Revolt OverMurphy’s Districts, ATLANTA J.-CONST., Sept. 6, 2001, at C8.111. See James Salzer, Walker Faces Challenge to Reign: Race “A Little Tighter
Than It Should Be,” He Admits, ATLANTA J.-CONST., Nov. 1, 2002, at D1; CandidateHas Had Brushes with Police, FLA. TIMES UNION, Oct. 15, 2002, at B4.112. Tom Barton, Voters Lose When Walker Cuts and Runs From Debating Burns,
SAVANNAH MORNING NEWS, Oct. 6, 2002, at 12A.113. Id.; David E. Rosenbaum, In Georgia, a Shot at Congress for 5 Blacks, N.Y.
TIMES, Sept. 24, 2002, at A25. See also infra notes 166–71 and accompanying text. R
\\server05\productn\N\NYL\10-1\NYL101.txt unknown Seq: 29 29-MAY-07 17:22
2006] VOTING RIGHTS PROGRESS IN GEORGIA 29
office.114 Champ Walker lost the general election, taking only 45% ofthe vote.115
The 2001 redistricting following the 2000 Census created anothercongressional district with a substantial African-American minority—the Georgia Third.116 The population of this district, centered on Ma-con and including much of the middle portion of the state, was justunder 40% African American.117 The African American who ran inthe district’s Democratic primary finished third, winning only 11% ofthe vote.118 His low vote count suggests that he failed to unify thesupport of the African-American population, which constituted 35%of the district’s registered voters.119 At least a partial explanation forhis lack of success may be that the most powerful African-Americanpolitician in the district, Robert Brown—who had been the vice-chairof the Senate Reapportionment Committee—managed the campaignof the successful white Democrat Jim Marshall.120
B. African Americans in the State Legislature
In 1962, Georgia elected an African-American state senator,making Leroy Johnson the first black southern legislator in moderntimes.121 By the time of the passage of the VRA in 1965, Johnson hadbeen joined by a second African American in the fifty-four memberstate senate.122 African Americans thus constituted approximately 4%of the senate. As Table 7 shows, increases in the number of seats heldby African Americans in the senate came slowly. The senate had onlytwo African-American members until after the redistricting followingthe 1980 Census, when the number doubled to four. By 1985, AfricanAmericans held more than a tenth of the seats in the senate. Gradual
114. James Salzer, Federal Prison Awaits Walker: Ex-legislator Gets 10 Years forFraud, ATLANTA J.-CONST., Nov. 30, 2005, at A1.115. See Electing the New Congress: Races for the House, supra note 94. R116. See 2006 ALMANAC, supra note 90. R117. See id.118. See id.; United States Representative—3rd District, Georgia Election Results:
Official Results of the August 20, 2002 Primary Election, http://www.sos.state.ga.us/elections/election_results/2002_0820/0001410.htm (last visited Sept. 27, 2006).119. See Georgia Secretary of State, Credit for Voting Report (Aug. 20, 2002), http:/
/www.sos.state.ga.us/elections/voter_registration/CFV2002-08-20Precinct.pdf (lastvisited Nov. 30, 2006).120. Duane D. Stanford, Georgians Develop the Touch for Voting: Leery Electorate
Gets Test Run on Machines, ATLANTA J.-CONST., Sept. 22, 2002, at C1.121. See G.O.P. Hails Gain in Legislatures, N.Y. TIMES, Dec. 27, 1962, at 8 (men-
tioning the historic election of Johnson, a Democratic attorney); Robert A. Holmes,The Georgia Legislative Black Caucus: An Analysis of a Racial Legislative Subgroup,J. OF BLACK STUDIES, July 2000, at 770.122. Holmes, supra note 121. R
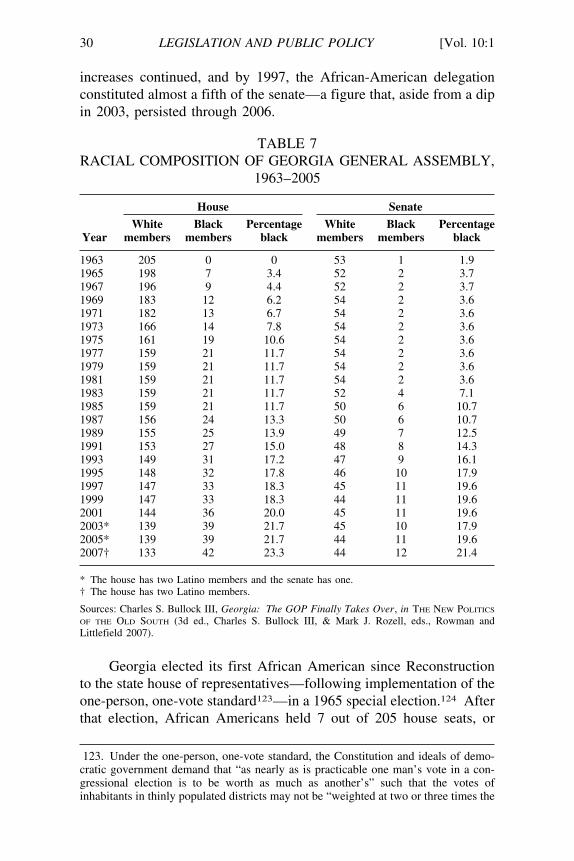
\\server05\productn\N\NYL\10-1\NYL101.txt unknown Seq: 30 29-MAY-07 17:22
30 LEGISLATION AND PUBLIC POLICY [Vol. 10:1
increases continued, and by 1997, the African-American delegationconstituted almost a fifth of the senate—a figure that, aside from a dipin 2003, persisted through 2006.
TABLE 7RACIAL COMPOSITION OF GEORGIA GENERAL ASSEMBLY,
1963–2005
House Senate
White Black Percentage White Black PercentageYear members members black members members black
1963 205 0 0 53 1 1.91965 198 7 3.4 52 2 3.71967 196 9 4.4 52 2 3.71969 183 12 6.2 54 2 3.61971 182 13 6.7 54 2 3.61973 166 14 7.8 54 2 3.61975 161 19 10.6 54 2 3.61977 159 21 11.7 54 2 3.61979 159 21 11.7 54 2 3.61981 159 21 11.7 54 2 3.61983 159 21 11.7 52 4 7.11985 159 21 11.7 50 6 10.71987 156 24 13.3 50 6 10.71989 155 25 13.9 49 7 12.51991 153 27 15.0 48 8 14.31993 149 31 17.2 47 9 16.11995 148 32 17.8 46 10 17.91997 147 33 18.3 45 11 19.61999 147 33 18.3 44 11 19.62001 144 36 20.0 45 11 19.62003* 139 39 21.7 45 10 17.92005* 139 39 21.7 44 11 19.62007† 133 42 23.3 44 12 21.4
* The house has two Latino members and the senate has one.† The house has two Latino members.
Sources: Charles S. Bullock III, Georgia: The GOP Finally Takes Over, in THE NEW POLITICS
OF THE OLD SOUTH (3d ed., Charles S. Bullock III, & Mark J. Rozell, eds., Rowman andLittlefield 2007).
Georgia elected its first African American since Reconstructionto the state house of representatives—following implementation of theone-person, one-vote standard123—in a 1965 special election.124 Afterthat election, African Americans held 7 out of 205 house seats, or
123. Under the one-person, one-vote standard, the Constitution and ideals of demo-cratic government demand that “as nearly as is practicable one man’s vote in a con-gressional election is to be worth as much as another’s” such that the votes ofinhabitants in thinly populated districts may not be “weighted at two or three times the
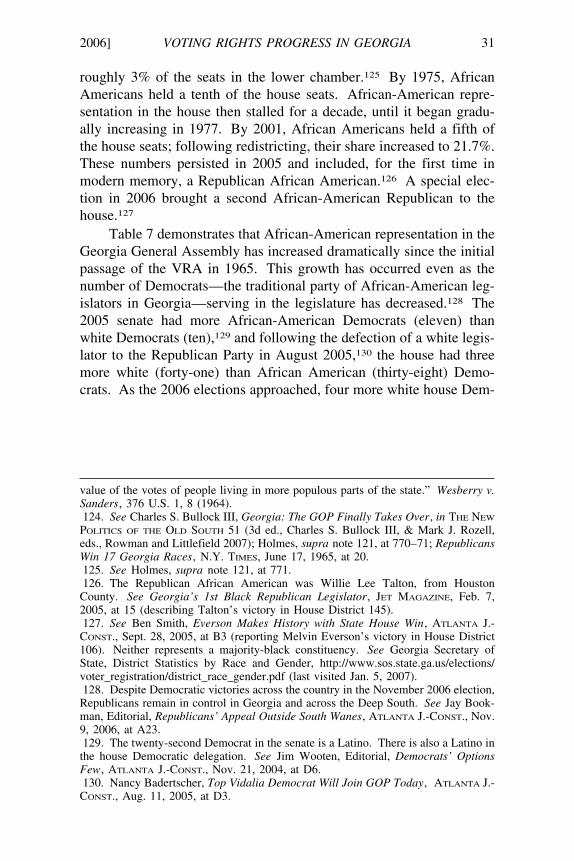
\\server05\productn\N\NYL\10-1\NYL101.txt unknown Seq: 31 29-MAY-07 17:22
2006] VOTING RIGHTS PROGRESS IN GEORGIA 31
roughly 3% of the seats in the lower chamber.125 By 1975, AfricanAmericans held a tenth of the house seats. African-American repre-sentation in the house then stalled for a decade, until it began gradu-ally increasing in 1977. By 2001, African Americans held a fifth ofthe house seats; following redistricting, their share increased to 21.7%.These numbers persisted in 2005 and included, for the first time inmodern memory, a Republican African American.126 A special elec-tion in 2006 brought a second African-American Republican to thehouse.127
Table 7 demonstrates that African-American representation in theGeorgia General Assembly has increased dramatically since the initialpassage of the VRA in 1965. This growth has occurred even as thenumber of Democrats—the traditional party of African-American leg-islators in Georgia—serving in the legislature has decreased.128 The2005 senate had more African-American Democrats (eleven) thanwhite Democrats (ten),129 and following the defection of a white legis-lator to the Republican Party in August 2005,130 the house had threemore white (forty-one) than African American (thirty-eight) Demo-crats. As the 2006 elections approached, four more white house Dem-
value of the votes of people living in more populous parts of the state.” Wesberry v.Sanders, 376 U.S. 1, 8 (1964).124. See Charles S. Bullock III, Georgia: The GOP Finally Takes Over, in THE NEW
POLITICS OF THE OLD SOUTH 51 (3d ed., Charles S. Bullock III, & Mark J. Rozell,eds., Rowman and Littlefield 2007); Holmes, supra note 121, at 770–71; Republicans RWin 17 Georgia Races, N.Y. TIMES, June 17, 1965, at 20.125. See Holmes, supra note 121, at 771. R126. The Republican African American was Willie Lee Talton, from Houston
County. See Georgia’s 1st Black Republican Legislator, JET MAGAZINE, Feb. 7,2005, at 15 (describing Talton’s victory in House District 145).127. See Ben Smith, Everson Makes History with State House Win, ATLANTA J.-
CONST., Sept. 28, 2005, at B3 (reporting Melvin Everson’s victory in House District106). Neither represents a majority-black constituency. See Georgia Secretary ofState, District Statistics by Race and Gender, http://www.sos.state.ga.us/elections/voter_registration/district_race_gender.pdf (last visited Jan. 5, 2007).128. Despite Democratic victories across the country in the November 2006 election,
Republicans remain in control in Georgia and across the Deep South. See Jay Book-man, Editorial, Republicans’ Appeal Outside South Wanes, ATLANTA J.-CONST., Nov.9, 2006, at A23.129. The twenty-second Democrat in the senate is a Latino. There is also a Latino in
the house Democratic delegation. See Jim Wooten, Editorial, Democrats’ OptionsFew, ATLANTA J.-CONST., Nov. 21, 2004, at D6.130. Nancy Badertscher, Top Vidalia Democrat Will Join GOP Today, ATLANTA J.-
CONST., Aug. 11, 2005, at D3.
\\server05\productn\N\NYL\10-1\NYL101.txt unknown Seq: 32 29-MAY-07 17:22
32 LEGISLATION AND PUBLIC POLICY [Vol. 10:1
ocrats defected to the Republican Party,131 and several other whiteDemocrats opted not to file for reelection.132
When the Georgia General Assembly convened in January 2007,the senate had twelve African-American members, the highest numberever.133 The African-American membership in the house also in-creased to a total of forty-two.134 African Americans now constitute23.3% of house membership, and 54% of the Democratic Caucus inthat chamber.
C. Statewide African-American Officials
Georgia elected its first African American state legislator in 1962and its first African-American member of Congress in 1972. An Afri-can American first won a statewide office in 1984, when Robert Ben-ham was appointed to the state court of appeals, the state’s secondhighest tribunal.135 Since then, African Americans have had a sub-stantial measure of electoral success in statewide offices, particularlythe state judiciary.
In the summer of 1984, Benham defeated three white challengersin a non-partisan primary.136 When Benham was appointed to theGeorgia Supreme Court, he was succeeded on the court of appeals byClarence Cooper, an African-American superior court judge.137 Ap-proximately six months after his appointment, Cooper defeated awhite challenger to win a full term.138 When Cooper was appointed tothe federal district bench, John Ruffin, another African American, suc-ceeded him.139 Ruffin has subsequently twice returned to the bench
131. See Jim Galloway, 2 Democrats Switch to GOP, ATLANTA J.-CONST., Apr. 27,2006, at C7.132. See Jim Wooten, Editorial, Seismic Shift in Political Landscape, ATLANTA J.-
CONST., Apr. 23, 2006, at B6.133. See Georgia State Senate, http://www.legis.ga.gov/legis/2007_08/senate/senate
list.php (last visited Feb. 12, 2007). Almost all of them were incumbents. GeorgiaSecretary of State: Elections Division, Qualifying Candidate Database, http://www.sos.state.ga.us/cgi-bin/qualifyingindex.asp (last visited Oct. 13, 2006).134. See Georgia House of Representatives, http://www.legis.ga.gov/legis/2007_08/
house/07alpha.html (last visited Jan. 2, 2007); Interview by Charles Bullock withJames Salzer, Georgia Capitol Reporter, Atlanta Journal-Constitution (Jan. 5, 2007).135. See Black Judge Wins Georgia Election, N.Y. TIMES, Aug. 16, 1984, at B28.136. See QUIET REVOLUTION, supra note 7, at 85. R137. See id. at 262.138. See DONALD L. GRANT, THE WAY IT WAS IN THE SOUTH: THE BLACK EXPERI-
ENCE IN GEORGIA 458 (1993).139. See Judges of the United States Courts, http://www.fjc.gov/servlet/tGetInfo?jid
=505 (last visited Feb. 12, 2007) (Cooper was appointed by President Clinton onMarch 9, 1994); Court of Appeals of The State of Georgia, Biography of Chief JudgeJohn H. Ruffin, Jr., http://www.gaappeals.us/biography/bio_judges.php?jname=John
\\server05\productn\N\NYL\10-1\NYL101.txt unknown Seq: 33 29-MAY-07 17:22
2006] VOTING RIGHTS PROGRESS IN GEORGIA 33
without opposition.140 In 1999, Governor Roy Barnes appointed twoAfrican Americans, Yvette Miller and Herbert Phipps, to newly cre-ated seats on the court of appeals,141 and both Miller and Phipps havesubsequently won reelection to the court of appeals with noopposition.142
Benham again led the way for African Americans in the Georgiajudiciary when, in 1989, he became the first African American toserve on the state’s highest court after being appointed to fill an in-terim vacancy on the state supreme court.143 He won reelection in1990 by defeating a white challenger,144 ran unopposed in 1996, anddefeated a challenger again in 2002.145 In 1992, Leah Ward Searsbecame the first African-American woman to serve on the GeorgiaSupreme Court when Governor Zell Miller appointed her to a va-cancy.146 A few months later, Sears won election to the remainder of
%20H.%20Ruffin,%20Jr (last visited Nov. 6, 2006) (Ruffin joined the bench on Au-gust 24, 1994).140. See Georgia Election Results, Official Results of the November 5, 1996 Gen-
eral Election, http://www.sos.state.ga.us/elections/election_results/1996_1105/ (lastvisited Nov. 6, 2006); Georgia Election Results, Official Results of the August 20,2002 General Primary Election, http://www.sos.state.ga.us/elections/election_results/2002_0820/ (last visited Nov. 6, 2006).141. See Peter Mantius, Governor Names New Judges, Other Appointees, ATLANTA
J.-CONST., June 30, 1999, at B3; Court of Appeals of The State of Georgia, Biographyof Judge M. Yvette Miller, http://www.gaappeals.us/biography/bio_judges.php?jname=M.%20Yvette%20Miller (last visited Nov. 6, 2006); Court of Appeals of The Stateof Georgia, Biography of Judge Herbert E. Phipps, http://www.gaappeals.us/biogra-phy/bio_judges.php?jname=Herbert%20E.%20Phipps (last visited Nov. 6, 2006).142. Georgia Election Results, Official Results of the November 7, 2000 General
Election, Judicial, http://www.sos.state.ga.us/elections/election&5Fresults/2000_1107/judicial.htm#ca (last visited Nov. 6, 2006).143. Tuskegee University: Distinguished Alumni, http://www.tuskegee.edu/Global/
story.asp?S=1362985 (last visited Feb. 12, 2007). Judgeships in Georgia are electedpositions. However, about two-thirds of the state’s judges initially come to the benchvia a gubernatorial appointment to a vacancy. See, e.g., AMERICAN JUDICATURE
SOC’Y, JUDICIAL SELECTION IN GEORGIA: AN INTRODUCTION, http://www.ajs.org/js/GA.htm (last visited Feb. 13, 2007) (“Judges are chosen in nonpartisan elections, butmid-term vacancies are filled through gubernatorial appointment. . . . The vast major-ity of Georgia judges are initially appointed to the bench and compete in contestedelections to retain their seats.”). The new appointee must run in the “next generalelection which is more than six months after” the appointment. GA. CONST. art. VI,§ 7, ¶¶ 1, 3–4.144. See The Results from State’s Other Contests, USA TODAY, Jul. 18, 1990, at A3;
Campaign Digest: Candidate for No. 2 Spot Vows He’ll Raffle Car, ATLANTA J.-CONST., June 26, 1990, at D3.145. Project Vote Smart, Justice Robert Benham, http://www.vote-smart.org/bio.php
?can_id=MGA51471 (last visited Feb. 12, 2007).146. The Supreme Court of Georgia, Justices’ Biographies, http://www2.state.ga.us/
Courts/Supreme/justices_bios.html#sears (last visited Feb. 12, 2007).
\\server05\productn\N\NYL\10-1\NYL101.txt unknown Seq: 34 29-MAY-07 17:22
34 LEGISLATION AND PUBLIC POLICY [Vol. 10:1
the term, defeating a white challenger.147 When Sears won a secondsix-year term in 1998, she did so by defeating two white challengers inthe non-partisan primary.148 In her third victory, in 2004, Sears de-feated a white conservative who had strong support from Georgia’sRepublican governor, Sonny Perdue, and from other leading Republi-cans.149 In June 2005, Governor Perdue tapped a third African Ameri-can, Harold Melton, for the seven-person supreme court.150 Melton,who had been the governor’s executive counsel, won election to theremainder of the term without opposition in 2006.151
In 1998, an African American won election to a constitutionaloffice for the first time.152 Former state representative Thurbert Bakerhad previously been appointed to an interim vacancy as attorney gen-eral of Georgia,153 and in 1998, he won a full term against a strongchallenge from a Republican senator.154 He won a second term in2002 and a third in 2006.155 The second African American to win aconstitutional office was Michael Thurmond, a former state legislator,who was elected as the state labor commissioner.156 Thurmond’s vic-tory came after he won the nomination in a Democratic runoff andthen turned back a Republican opponent.157 Like Baker, Thurmond
147. See id.; Mark Sherman & David Beasley, Incumbents Stung by GOP Surge,ATLANTA J.-CONST., July 22, 1992, at A1.148. Georgia Election Results, Official Results of the July 21, 1998 Primary Elec-
tion, Judicial, http://www.sos.state.ga.us/elections/election%5Fresults/1998_0721/(last visited Nov. 6, 2006).149. See Editorial, Sears Endures to Blaze New Trail, ATLANTA J.-CONST., Mar. 4,
2002, at A12; Georgia Election Results, Official Results of the July 20, 2004 PrimaryElection, Judicial, http://www.sos.state.ga.us/elections/election%5Fresults/2004_0720/judicial.htm#sc (last visited Nov. 6, 2006).150. See Randy Evans, Newest Justice Sure to Make a Difference, ATLANTA J.-
CONST., Jun. 13, 2005, at A9.151. See Justice at Stake Campaign, 2006 State Supreme Court Election Results,
http://www.justiceatstake.org/files/2006ElectionResults.pdf.152. “Constitutional office” describes executive positions that are established by the
state constitution. See GA. CONST. art. V § 3 (designating as constitutional offices theSecretary of State, Attorney General, State School Superintendent, Commissioner ofInsurance, Commissioner of Agriculture, and Commissioner of Labor).153. Incumbent Attorney General Michael Bowers resigned to run for governor, and
Baker was appointed by Governor Zell Miller. Office of Attorney General of Geor-gia, http://www.state.ga.us/ago/biography.html.154. Georgia Election Results, 1998 Election Results, http://www.sos.state.ga.us/
ELECTIONS/election_results/1998_1103/summary.htm (last visited Feb. 12, 2007).155. Id.; Georgia Election Results, 2006 Election Results http://www.sos.state.ga.us/
elections/election_results/2006_1107/swfed.htm (last visited Feb. 12, 2007).156. Michael L. Thurmond, How We Did It, BLUEPRINT MAGAZINE, July–Aug. 2001,
available at http://www.ndol.org/ndol_ci.cfm?kaid=127&subid=173&contentid=3545.157. Id.
\\server05\productn\N\NYL\10-1\NYL101.txt unknown Seq: 35 29-MAY-07 17:22
2006] VOTING RIGHTS PROGRESS IN GEORGIA 35
won reelections in 2002 and 2006.158 In 2000, another African Amer-ican, David Burgess, became the first African American to hold one ofthe five seats on the state Public Service Commission.159 Burgesswon an election for the remainder of the term in 2002, but when hesought reelection in 2006, he fell in a general election runoff afterpolling a plurality in the November general election.160 With Bur-gess’s defeat, Republicans controlled all five Public Service Commis-sion seats.
Georgia has a total of thirty-four officials who are elected state-wide: two U.S. senators, eight constitutional officers, seven membersof the supreme court, twelve members of the court of appeals, and fivemembers of the Public Service Commission.161 In 2007, eight ofthese thirty-four statewide officials (23.5%) were African American,at a time when blacks constituted 27.2% of Georgia’s voting age pop-ulation.162 All of these officials have won election at least once, andseveral have multiple statewide victories under their belts.163
All of these African Americans who have won statewide elec-tions have done so with substantial white support. As Table 4 shows,whites cast approximately three-fourths of the votes in a typical gen-eral election, making it impossible for an African American to win amajority by mobilizing only black support.
IV.VOTING RIGHTS LAW AND REDISTRICTING IN GEORGIA:
CAUSES AND CONSEQUENCES
As the previous section demonstrates, African Americans seekingoffice in Georgia have enjoyed substantial success in winning electo-ral office and in attracting the support of white voters. It was thus not
158. Georgia Election Results, 2002 Election Results, http://www.sos.state.ga.us/elections/election%5Fresults/2002_1105/federal.htm (last visited Feb. 12, 2007);Georgia Election Results, 2006 Election Results, http://www.sos.state.ga.us/elections/election%5Fresults/2006_1107/swfed.htm (last visited Feb. 12, 2007).159. See Georgia Public Service Commission, http://www.psc.state.ga.us/pscinfo/psc
intro.asp#commissioners (last visited Nov. 6, 2006). The Public Service Commission,which regulates electricity and natural gas rates, was constitutionalized by Article 1,section 4 of the Georgia state constitution.160. See Georgia Election Results, Official Results of the December 5, 2006 General
Election Runoff, http://www.sos.state.ga.us/elections/election_results/2006_1105/(last visited Dec. 27, 2006).161. See COUNCIL OF STATE GOVERNMENTS, THE BOOK OF THE STATES 309–12,
350–51 (2005).162. See VOTING AND REGISTRATION IN THE ELECTION OF NOVEMBER 2004, supra
note 36, at tbl.4a. R163. See, e.g., Georgia Election Results, 1998 Election Results, supra note 130;
Georgia Election Results, 2002 Election Results, supra note 130.
\\server05\productn\N\NYL\10-1\NYL101.txt unknown Seq: 36 29-MAY-07 17:22
36 LEGISLATION AND PUBLIC POLICY [Vol. 10:1
surprising that in 2001, many of the state’s African-American senatorsand representatives agreed to reduce black concentrations in some leg-islative districts.164
A. Plans to Reduce African-American Concentrationsin Legislative Districts
The redistricting plan adopted by the state senate reduced theblack voting age population (BVAP) in majority-black districts by anaverage of 10.3 percentage points, as shown in Table 8.165 Addition-ally, three districts that formerly had a substantial BVAP—over60%—emerged from the new plan with a BVAP of less than 51%.This plan was supported by three African-American legislative lead-ers—Majority Leader Charles Walker, Rules Committee Chair DavidScott, and Robert Brown, Vice-Chair of the Reapportionment Com-mittee166—who could have stopped the plan had they been concernedthat retrogression would reduce the likelihood that African Americanscould win seats. The BVAP in Walker’s own district went from63.5% to 51.2%,167 and Brown strongly supported the plan that re-duced the BVAP in his district from 62.3% to 50.8%.168
In agreeing to these reductions in minority concentrations, themembers of the Legislative Black Caucus seemed to accept the analy-sis prepared by David Epstein, the expert employed by Attorney Gen-eral Thurbert Baker in anticipation of court challenges to the state’sredistricting plans. Epstein concluded that African Americans had areasonable chance of being elected even in districts where AfricanAmericans constituted less than half of the voting age population.169
Specifically, he estimated that a legislative district without an incum-bent needed an African-American concentration of 44% of the voting-age population for African Americans to have a 50% chance of elect-ing their preferred candidate.170 Charles Walker almost adopted Ep-stein’s analysis word-for-word; when asked what level of BVAP wasneeded for African Americans to have an equal chance of winning in
164. See Georgia v. Ashcroft, 539 U.S. 461, 471 (2003).165. See also Georgia v. Ashcroft, 195 F. Supp. 2d 25, 81–82 (D.D.C. 2002).166. See David Pendered, GOP Vows to Challenge Map Plan, ATLANTA J.-CONST.,
Aug. 7, 2001, at B1; David Pendered, Race Linked to Redistricting Battle, Black VoteKey to Democrats’ Overall Strategy, ATLANTA J.-CONST., Aug. 4, 2001, at 8H; JimGalloway, Redistricting Expands White Base, Racial Strategy Key to Democrats’Push to Retain Capitol, ATLANTA J.-CONST., Aug. 16, 2001, at A1.167. Georgia v. Ashcroft, 195 F. Supp. 2d 25, 63–64, 107 (D.D.C. 2002).168. See id. at 61-62, 101, 106–07.169. Plaintiff’s Exhibit 25 at 16–17, Georgia v. Ashcroft, 195 F. Supp. 2d 25
(D.D.C. 2002) (No. 01-2111).170. Id.
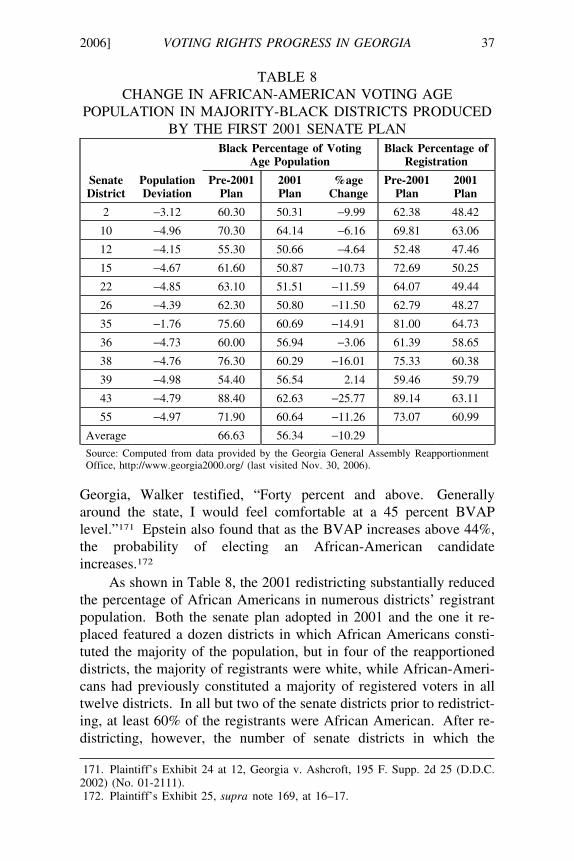
\\server05\productn\N\NYL\10-1\NYL101.txt unknown Seq: 37 29-MAY-07 17:22
2006] VOTING RIGHTS PROGRESS IN GEORGIA 37
TABLE 8CHANGE IN AFRICAN-AMERICAN VOTING AGE
POPULATION IN MAJORITY-BLACK DISTRICTS PRODUCEDBY THE FIRST 2001 SENATE PLAN
Black Percentage of Voting Black Percentage ofAge Population Registration
Senate Population Pre-2001 2001 %age Pre-2001 2001District Deviation Plan Plan Change Plan Plan
2 −3.12 60.30 50.31 −9.99 62.38 48.42
10 −4.96 70.30 64.14 −6.16 69.81 63.06
12 −4.15 55.30 50.66 −4.64 52.48 47.46
15 −4.67 61.60 50.87 −10.73 72.69 50.25
22 −4.85 63.10 51.51 −11.59 64.07 49.44
26 −4.39 62.30 50.80 −11.50 62.79 48.27
35 −1.76 75.60 60.69 −14.91 81.00 64.73
36 −4.73 60.00 56.94 −3.06 61.39 58.65
38 −4.76 76.30 60.29 −16.01 75.33 60.38
39 −4.98 54.40 56.54 2.14 59.46 59.79
43 −4.79 88.40 62.63 −25.77 89.14 63.11
55 −4.97 71.90 60.64 −11.26 73.07 60.99
Average 66.63 56.34 −10.29
Source: Computed from data provided by the Georgia General Assembly ReapportionmentOffice, http://www.georgia2000.org/ (last visited Nov. 30, 2006).
Georgia, Walker testified, “Forty percent and above. Generallyaround the state, I would feel comfortable at a 45 percent BVAPlevel.”171 Epstein also found that as the BVAP increases above 44%,the probability of electing an African-American candidateincreases.172
As shown in Table 8, the 2001 redistricting substantially reducedthe percentage of African Americans in numerous districts’ registrantpopulation. Both the senate plan adopted in 2001 and the one it re-placed featured a dozen districts in which African Americans consti-tuted the majority of the population, but in four of the reapportioneddistricts, the majority of registrants were white, while African-Ameri-cans had previously constituted a majority of registered voters in alltwelve districts. In all but two of the senate districts prior to redistrict-ing, at least 60% of the registrants were African American. After re-districting, however, the number of senate districts in which the
171. Plaintiff’s Exhibit 24 at 12, Georgia v. Ashcroft, 195 F. Supp. 2d 25 (D.D.C.2002) (No. 01-2111).172. Plaintiff’s Exhibit 25, supra note 169, at 16–17. R
\\server05\productn\N\NYL\10-1\NYL101.txt unknown Seq: 38 29-MAY-07 17:22
38 LEGISLATION AND PUBLIC POLICY [Vol. 10:1
African-American registration rate exceeded 55% dropped fromeleven to seven.
In the section 5 hearing conducted by the District Court for theDistrict of Columbia on Georgia’s 2001 redistricting plans,173 the DOJvoiced no concerns about any federal congressional or state house dis-tricts and accepted the reductions in African-American concentrationin all but three of the state senate districts.174 The DOJ even acceptedSenate District 15, in which the BVAP fell from 62.1% to 50.9%, andDistrict 22, in which the BVAP fell from 63.5% to 51.5%.175 In bothof these districts, more than 64% of the registrants had been AfricanAmerican, while under the new plan, African Americans accountedfor only 50% of registrants. Even the three senate districts (2, 12 and26) to which the DOJ objected were subsequently approved followingthe U.S. Supreme Court’s decision in Georgia v. Ashcroft that the dis-trict court did not consider the correct factors in determining that the2001 Georgia districting plans violated section 5.176
B. African-American Leaders’ Support for the Redistricting Plan
In Georgia v. Ashcroft, a number of Georgia’s African-Americanleaders testified in support of the redistricting plan. At the forefrontwas Thurbert Baker, Georgia’s African-American attorney general.Baker pursued the appeal to the Supreme Court, challenging the dis-trict court’s finding that three senate districts violated the VRA byreducing African-American concentrations, and he persisted in his ap-peal even when Georgia’s new governor, Republican Sonny Perdue,ordered him to abandon it.177
Another leading supporter of the effort to reduce minority con-centrations in legislative districts was African-American congressmanJohn Lewis, whose severe beating during his efforts to secure votingrights for African Americans in Selma, Alabama, helped mobilize sup-
173. Section 5 of the Voting Rights Act requires that states subject to it, like Geor-gia, must secure federal approval before implementing any change in their electionlaws, including new districting plans. Voting Rights Act § 5, 42 U.S.C.A. § 1973(c)(2006). Jurisdictions usually seek preclearance from the Department of Justice, al-though they can seek a declaratory judgment from the Federal District Court for theDistrict of Columbia. Id. See also Georgia v. Ashcroft, 195 F. Supp. 2d at 71. Geor-gia opted to pursue judicial preclearance for its 2001 plan. Id.174. Georgia v. Ashcroft, 195 F. Supp. 2d at 72.175. See id. at 56, 72.176. See Georgia v. Ashcroft, 539 U.S. 461, 472, 490 (2003); Rhonda Cook, Attor-
ney General’s Authority Upheld, ATLANTA J.-CONST., Sept. 5, 2003, at A1.177. Cook, supra note 176. R
\\server05\productn\N\NYL\10-1\NYL101.txt unknown Seq: 39 29-MAY-07 17:22
2006] VOTING RIGHTS PROGRESS IN GEORGIA 39
port critical for the passage of the Voting Rights Act of 1965.178 Ex-plaining why he did not object to the reduction in minorityconcentrations, even though the African-American percentage in hisdistrict dropped from 62% to 56%, Lewis said,
[Georgia] is not the same state it was. It’s not the same state that itwas in 1965 or in 1975, or even in 1980 or 1990. We havechanged. We’ve come a great distance . . . . [I]t’s not just in Geor-gia, but in the American South, I think people are preparing to laydown the burden of race.179
Elsewhere in his testimony, Lewis elaborated,I think many voters, white and black voters, in metro Atlanta andelsewhere in Georgia, have been able to see black candidates getout and campaign and work hard for all voters. And they have seenpeople deal with issues, as I said before, that transcend race: Eco-nomic issues, environmental issues, issues of war and peace . . . .So there has been a transformation. It’s a different state, it’s a dif-ferent political climate, it’s a different political environment. It’saltogether a different world that we live in, really.180
Robert Brown, an African-American state senator who served asvice-chair of the Senate Reapportionment Committee, also agreed thatmajor changes have taken place in Georgia in recent years. He testi-fied that “[t]here has been some change from that rigid, if there’s anAfrican-American on the ticket, there’s an automatic no vote forwhites.”181 Senator Brown also testified that his fellow African-American senators strongly supported the redistricting plan.182 As hepointed out, “[t]he Senate Plan would not have passed without [Afri-can-American] support.”183 Brown opined that a district with a 50%BVAP could likely be won by an African American even if the candi-date was competing for an open seat and lacked the advantages ofincumbency.184
Because the rate of white registration tends to exceed that of Af-rican-American registration and white registrants vote at higher ratesthan African-American registrants,185 it was likely that whites would
178. JOHN LEWIS, WALKING WITH THE WIND: A MEMOIR OF THE MOVEMENT
330–32, 338–47 (1999).179. Plaintiff’s Exhibit 21 at 18, Georgia v. Ashcroft, 195 F. Supp. 2d 25 (D.D.C.
2002) (No. 01-2111).180. Id. at 15–16.181. Plaintiff’s Exhibit 20 at 8, Georgia v. Ashcroft, 195 F. Supp. 2d 25 (D.D.C.
2002) (No. 01-2111).182. Id. at 26–27.183. Id. at 27.184. Id. at 29–30.185. See supra Tables 2–4.
\\server05\productn\N\NYL\10-1\NYL101.txt unknown Seq: 40 29-MAY-07 17:22
40 LEGISLATION AND PUBLIC POLICY [Vol. 10:1
constitute most of the voters in at least five of the previously majority-black districts in the 2001 plan.186 Therefore, the implication of theEpstein analysis, which was accepted by the Georgia LegislativeBlack Caucus, is that African-American candidates can attract a suffi-cient share of the white vote to win in these districts.187 Indeed, evi-dence from both statewide elections and some congressional electionsindicates that African Americans now enjoy a degree of success inGeorgia even when the majority of the electorate is white. The Afri-can Americans who have won statewide contests have succeeded at atime when African Americans cast a quarter or less of all votes, indi-cating a substantial white crossover vote for the African-Americancandidate.188
V.RACIAL AND PARTY VOTING PATTERNS
A. African-American and White Support for African-Americanand White Candidates
The willingness of the Department of Justice and the SupremeCourt to accept a Georgia redistricting plan that in the past might havebeen found to be flawed by retrogression underscores the changes inracial voting patterns in the state. While in the past, African Ameri-cans may have been more willing to support a white candidate thanwhite voters were to cast ballots for an African-American candidate,that situation has changed dramatically. Today, African-Americancandidates can count on more support from the white electorate thanwhite candidates receive from the African-American electorate, as willbe shown in Tables 9 and 10.
Table 9 contains estimates of African-American and white sup-port for African-American candidates who ran for Congress in theFifth Congressional District from 1970 through 1982. AndrewYoung, an African American, won the Democratic nomination in thispredominantly white (44% African American) district in 1970, al-though he lost the general election. From 1972 to 1976, Young wonthe seat and garnered a substantial number of white votes. Neverthe-less, except for the 1974 general election, white support for African-American candidates never reached 50%. In contrast, African Ameri-cans gave near-unanimous support to an African-American candidate
186. The five previously majority-black districts that would be likely to have major-ity-white voters are Districts 2, 12, 15, 22, and 26.187. Plaintiff’s Exhibit 25 at 16-17, Georgia v. Ashcroft, 195 F. Supp. 2d 25 (D.D.C.
2002) (No. 01-2111).188. See supra Part III.
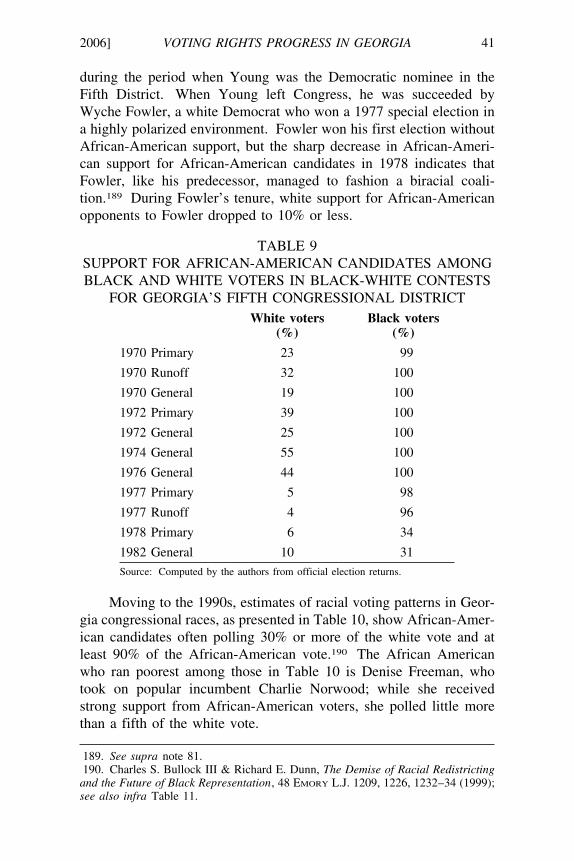
\\server05\productn\N\NYL\10-1\NYL101.txt unknown Seq: 41 29-MAY-07 17:22
2006] VOTING RIGHTS PROGRESS IN GEORGIA 41
during the period when Young was the Democratic nominee in theFifth District. When Young left Congress, he was succeeded byWyche Fowler, a white Democrat who won a 1977 special election ina highly polarized environment. Fowler won his first election withoutAfrican-American support, but the sharp decrease in African-Ameri-can support for African-American candidates in 1978 indicates thatFowler, like his predecessor, managed to fashion a biracial coali-tion.189 During Fowler’s tenure, white support for African-Americanopponents to Fowler dropped to 10% or less.
TABLE 9SUPPORT FOR AFRICAN-AMERICAN CANDIDATES AMONGBLACK AND WHITE VOTERS IN BLACK-WHITE CONTESTS
FOR GEORGIA’S FIFTH CONGRESSIONAL DISTRICTWhite voters Black voters
(%) (%)
1970 Primary 23 99
1970 Runoff 32 100
1970 General 19 100
1972 Primary 39 100
1972 General 25 100
1974 General 55 100
1976 General 44 100
1977 Primary 5 98
1977 Runoff 4 96
1978 Primary 6 34
1982 General 10 31
Source: Computed by the authors from official election returns.
Moving to the 1990s, estimates of racial voting patterns in Geor-gia congressional races, as presented in Table 10, show African-Amer-ican candidates often polling 30% or more of the white vote and atleast 90% of the African-American vote.190 The African Americanwho ran poorest among those in Table 10 is Denise Freeman, whotook on popular incumbent Charlie Norwood; while she receivedstrong support from African-American voters, she polled little morethan a fifth of the white vote.
189. See supra note 81. R190. Charles S. Bullock III & Richard E. Dunn, The Demise of Racial Redistricting
and the Future of Black Representation, 48 EMORY L.J. 1209, 1226, 1232–34 (1999);see also infra Table 11.
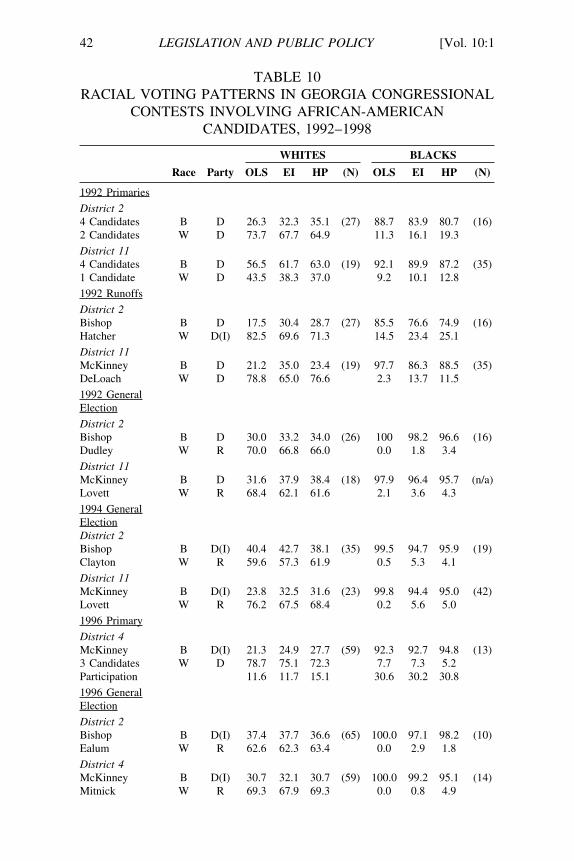
\\server05\productn\N\NYL\10-1\NYL101.txt unknown Seq: 42 29-MAY-07 17:22
42 LEGISLATION AND PUBLIC POLICY [Vol. 10:1
TABLE 10RACIAL VOTING PATTERNS IN GEORGIA CONGRESSIONAL
CONTESTS INVOLVING AFRICAN-AMERICANCANDIDATES, 1992–1998
WHITES BLACKS
Race Party OLS EI HP (N) OLS EI HP (N)
1992 Primaries
District 24 Candidates B D 26.3 32.3 35.1 (27) 88.7 83.9 80.7 (16)2 Candidates W D 73.7 67.7 64.9 11.3 16.1 19.3
District 114 Candidates B D 56.5 61.7 63.0 (19) 92.1 89.9 87.2 (35)1 Candidate W D 43.5 38.3 37.0 9.2 10.1 12.8
1992 Runoffs
District 2Bishop B D 17.5 30.4 28.7 (27) 85.5 76.6 74.9 (16)Hatcher W D(I) 82.5 69.6 71.3 14.5 23.4 25.1
District 11McKinney B D 21.2 35.0 23.4 (19) 97.7 86.3 88.5 (35)DeLoach W D 78.8 65.0 76.6 2.3 13.7 11.5
1992 GeneralElection
District 2Bishop B D 30.0 33.2 34.0 (26) 100 98.2 96.6 (16)Dudley W R 70.0 66.8 66.0 0.0 1.8 3.4
District 11McKinney B D 31.6 37.9 38.4 (18) 97.9 96.4 95.7 (n/a)Lovett W R 68.4 62.1 61.6 2.1 3.6 4.3
1994 GeneralElectionDistrict 2Bishop B D(I) 40.4 42.7 38.1 (35) 99.5 94.7 95.9 (19)Clayton W R 59.6 57.3 61.9 0.5 5.3 4.1
District 11McKinney B D(I) 23.8 32.5 31.6 (23) 99.8 94.4 95.0 (42)Lovett W R 76.2 67.5 68.4 0.2 5.6 5.0
1996 Primary
District 4McKinney B D(I) 21.3 24.9 27.7 (59) 92.3 92.7 94.8 (13)3 Candidates W D 78.7 75.1 72.3 7.7 7.3 5.2Participation 11.6 11.7 15.1 30.6 30.2 30.8
1996 GeneralElection
District 2Bishop B D(I) 37.4 37.7 36.6 (65) 100.0 97.1 98.2 (10)Ealum W R 62.6 62.3 63.4 0.0 2.9 1.8
District 4McKinney B D(I) 30.7 32.1 30.7 (59) 100.0 99.2 95.1 (14)Mitnick W R 69.3 67.9 69.3 0.0 0.8 4.9
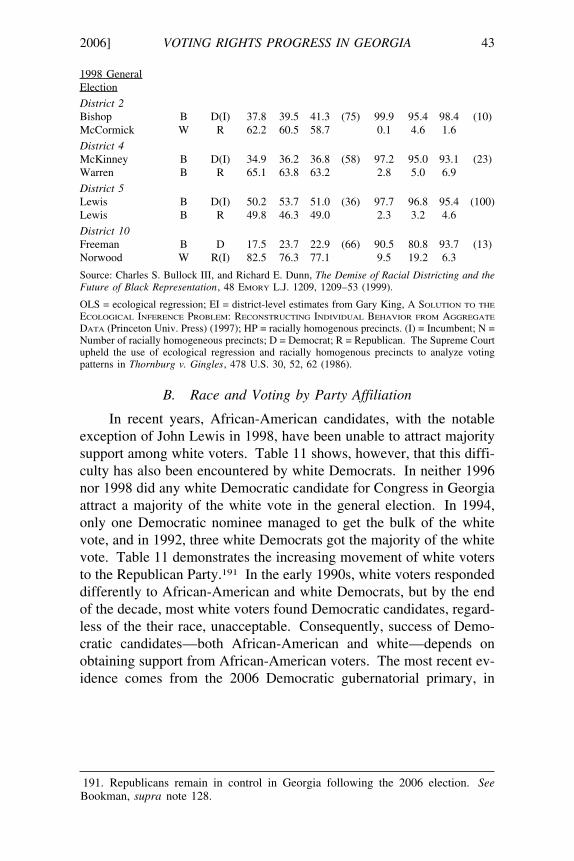
\\server05\productn\N\NYL\10-1\NYL101.txt unknown Seq: 43 29-MAY-07 17:22
2006] VOTING RIGHTS PROGRESS IN GEORGIA 43
1998 GeneralElection
District 2Bishop B D(I) 37.8 39.5 41.3 (75) 99.9 95.4 98.4 (10)McCormick W R 62.2 60.5 58.7 0.1 4.6 1.6
District 4McKinney B D(I) 34.9 36.2 36.8 (58) 97.2 95.0 93.1 (23)Warren B R 65.1 63.8 63.2 2.8 5.0 6.9
District 5Lewis B D(I) 50.2 53.7 51.0 (36) 97.7 96.8 95.4 (100)Lewis B R 49.8 46.3 49.0 2.3 3.2 4.6
District 10Freeman B D 17.5 23.7 22.9 (66) 90.5 80.8 93.7 (13)Norwood W R(I) 82.5 76.3 77.1 9.5 19.2 6.3
Source: Charles S. Bullock III, and Richard E. Dunn, The Demise of Racial Districting and theFuture of Black Representation, 48 EMORY L.J. 1209, 1209–53 (1999).
OLS = ecological regression; EI = district-level estimates from Gary King, A SOLUTION TO THE
ECOLOGICAL INFERENCE PROBLEM: RECONSTRUCTING INDIVIDUAL BEHAVIOR FROM AGGREGATE
DATA (Princeton Univ. Press) (1997); HP = racially homogenous precincts. (I) = Incumbent; N =Number of racially homogeneous precincts; D = Democrat; R = Republican. The Supreme Courtupheld the use of ecological regression and racially homogenous precincts to analyze votingpatterns in Thornburg v. Gingles, 478 U.S. 30, 52, 62 (1986).
B. Race and Voting by Party Affiliation
In recent years, African-American candidates, with the notableexception of John Lewis in 1998, have been unable to attract majoritysupport among white voters. Table 11 shows, however, that this diffi-culty has also been encountered by white Democrats. In neither 1996nor 1998 did any white Democratic candidate for Congress in Georgiaattract a majority of the white vote in the general election. In 1994,only one Democratic nominee managed to get the bulk of the whitevote, and in 1992, three white Democrats got the majority of the whitevote. Table 11 demonstrates the increasing movement of white votersto the Republican Party.191 In the early 1990s, white voters respondeddifferently to African-American and white Democrats, but by the endof the decade, most white voters found Democratic candidates, regard-less of the their race, unacceptable. Consequently, success of Demo-cratic candidates—both African-American and white—depends onobtaining support from African-American voters. The most recent ev-idence comes from the 2006 Democratic gubernatorial primary, in
191. Republicans remain in control in Georgia following the 2006 election. SeeBookman, supra note 128. R
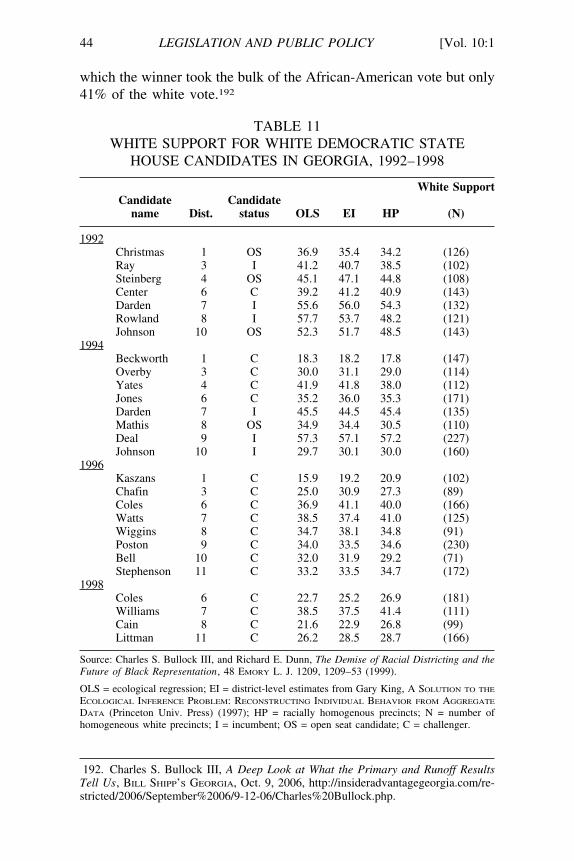
\\server05\productn\N\NYL\10-1\NYL101.txt unknown Seq: 44 29-MAY-07 17:22
44 LEGISLATION AND PUBLIC POLICY [Vol. 10:1
which the winner took the bulk of the African-American vote but only41% of the white vote.192
TABLE 11WHITE SUPPORT FOR WHITE DEMOCRATIC STATE
HOUSE CANDIDATES IN GEORGIA, 1992–1998
White SupportCandidate Candidate
name Dist. status OLS EI HP (N)
1992Christmas 1 OS 36.9 35.4 34.2 (126)Ray 3 I 41.2 40.7 38.5 (102)Steinberg 4 OS 45.1 47.1 44.8 (108)Center 6 C 39.2 41.2 40.9 (143)Darden 7 I 55.6 56.0 54.3 (132)Rowland 8 I 57.7 53.7 48.2 (121)Johnson 10 OS 52.3 51.7 48.5 (143)
1994Beckworth 1 C 18.3 18.2 17.8 (147)Overby 3 C 30.0 31.1 29.0 (114)Yates 4 C 41.9 41.8 38.0 (112)Jones 6 C 35.2 36.0 35.3 (171)Darden 7 I 45.5 44.5 45.4 (135)Mathis 8 OS 34.9 34.4 30.5 (110)Deal 9 I 57.3 57.1 57.2 (227)Johnson 10 I 29.7 30.1 30.0 (160)
1996Kaszans 1 C 15.9 19.2 20.9 (102)Chafin 3 C 25.0 30.9 27.3 (89)Coles 6 C 36.9 41.1 40.0 (166)Watts 7 C 38.5 37.4 41.0 (125)Wiggins 8 C 34.7 38.1 34.8 (91)Poston 9 C 34.0 33.5 34.6 (230)Bell 10 C 32.0 31.9 29.2 (71)Stephenson 11 C 33.2 33.5 34.7 (172)
1998Coles 6 C 22.7 25.2 26.9 (181)Williams 7 C 38.5 37.5 41.4 (111)Cain 8 C 21.6 22.9 26.8 (99)Littman 11 C 26.2 28.5 28.7 (166)
Source: Charles S. Bullock III, and Richard E. Dunn, The Demise of Racial Districting and theFuture of Black Representation, 48 EMORY L. J. 1209, 1209–53 (1999).
OLS = ecological regression; EI = district-level estimates from Gary King, A SOLUTION TO THE
ECOLOGICAL INFERENCE PROBLEM: RECONSTRUCTING INDIVIDUAL BEHAVIOR FROM AGGREGATE
DATA (Princeton Univ. Press) (1997); HP = racially homogenous precincts; N = number ofhomogeneous white precincts; I = incumbent; OS = open seat candidate; C = challenger.
192. Charles S. Bullock III, A Deep Look at What the Primary and Runoff ResultsTell Us, BILL SHIPP’S GEORGIA, Oct. 9, 2006, http://insideradvantagegeorgia.com/re-stricted/2006/September%2006/9-12-06/Charles%20Bullock.php.
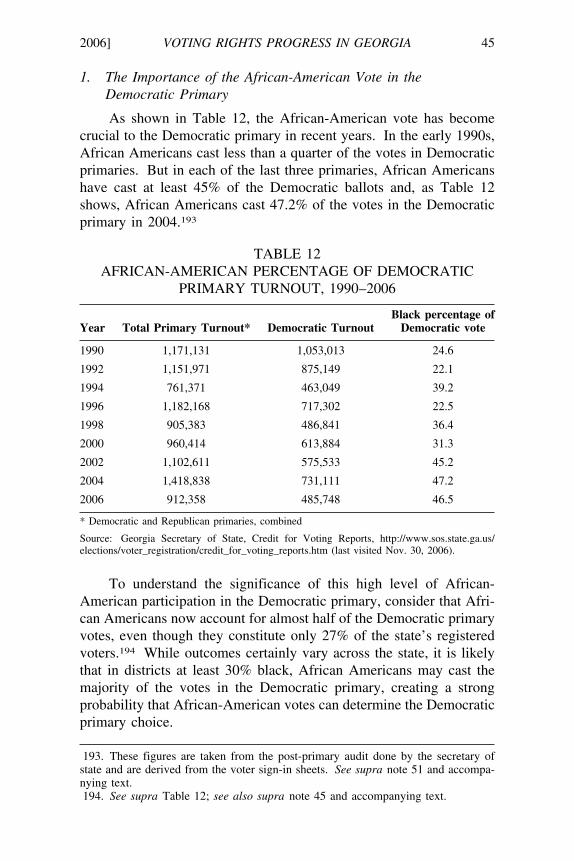
\\server05\productn\N\NYL\10-1\NYL101.txt unknown Seq: 45 29-MAY-07 17:22
2006] VOTING RIGHTS PROGRESS IN GEORGIA 45
1. The Importance of the African-American Vote in theDemocratic Primary
As shown in Table 12, the African-American vote has becomecrucial to the Democratic primary in recent years. In the early 1990s,African Americans cast less than a quarter of the votes in Democraticprimaries. But in each of the last three primaries, African Americanshave cast at least 45% of the Democratic ballots and, as Table 12shows, African Americans cast 47.2% of the votes in the Democraticprimary in 2004.193
TABLE 12AFRICAN-AMERICAN PERCENTAGE OF DEMOCRATIC
PRIMARY TURNOUT, 1990–2006
Black percentage ofYear Total Primary Turnout* Democratic Turnout Democratic vote
1990 1,171,131 1,053,013 24.6
1992 1,151,971 875,149 22.1
1994 761,371 463,049 39.2
1996 1,182,168 717,302 22.5
1998 905,383 486,841 36.4
2000 960,414 613,884 31.3
2002 1,102,611 575,533 45.2
2004 1,418,838 731,111 47.2
2006 912,358 485,748 46.5
* Democratic and Republican primaries, combined
Source: Georgia Secretary of State, Credit for Voting Reports, http://www.sos.state.ga.us/elections/voter_registration/credit_for_voting_reports.htm (last visited Nov. 30, 2006).
To understand the significance of this high level of African-American participation in the Democratic primary, consider that Afri-can Americans now account for almost half of the Democratic primaryvotes, even though they constitute only 27% of the state’s registeredvoters.194 While outcomes certainly vary across the state, it is likelythat in districts at least 30% black, African Americans may cast themajority of the votes in the Democratic primary, creating a strongprobability that African-American votes can determine the Democraticprimary choice.
193. These figures are taken from the post-primary audit done by the secretary ofstate and are derived from the voter sign-in sheets. See supra note 51 and accompa- Rnying text.194. See supra Table 12; see also supra note 45 and accompanying text. R
\\server05\productn\N\NYL\10-1\NYL101.txt unknown Seq: 46 29-MAY-07 17:22
46 LEGISLATION AND PUBLIC POLICY [Vol. 10:1
2. The Impact of Party Affiliation on Racial Voting Patterns
Table 13 presents another perspective on how Georgia voterstreat Democratic candidates regardless of their race: combined data forthe past five elections demonstrate greater overall success for African-American Democratic candidates than for white candidates. Thewhite Democrats, shown in Table 13, won 36% of their contests,while African American Democrats won nearly two-thirds of theirs.195
In the 2006 election, Republicans made further gains in Georgiaby winning the open posts of lieutenant governor and secretary ofstate, which had previously been held by Democrats. Incumbent Afri-can Americans won reelection as attorney general and labor commis-sioner and accounted for two of the three Democrats successful instatewide contests. An African American lost in her bid to unseat thestate school superintendent. White Democratic challengers came upshort against the sitting governor, insurance commissioner, and one ofthe Public Service Commission seats. In the end, Agriculture Com-missioner Tommy Irvin was the only white Democrat to win a state-wide victory.
The 2004 Georgia ballot contained three statewide races: the U.S.presidency, a U.S. Senate seat, and one seat on the Public ServiceCommission. Two of the races, for president and the Public ServiceCommission, had a white Democratic nominee; the Democratic Senatenominee was African-American U.S. Representative Denise Majette.The results in Table 13 show that the three Democrats, all of whomlost, polled remarkably similar vote shares, with John Kerry attracting41.4% of the vote, Majette 40.0% of the vote, and the Democraticnominee for the Public Service Commission, Mac Barber, 39.5%.
In 2002, Democrats split the statewide results, winning five con-tests and losing six. A different pattern emerges, however, once wefactor in the race of the Democratic nominee. The white Democraticnominees won only three of nine contests in which they competed,while both of the African-American Democratic nominees won. Bothof the African Americans were incumbents, but incumbency cannotexplain this result, as all but two of the white Democratic nomineeswere also incumbents. White Democratic incumbents won three con-tests and lost four, including the two at the top of the ticket for senatorand governor.
195. African-American Democrats would have had an ever-greater rate of successbut for one unusual race. David Burgess, an African-American member of the PublicService Commission, faced a runoff for his seat on December 5, 2006. As Table 13shows, despite having led the field in the general election, Burgess lost the runoff in acontest that stimulated very little participation.
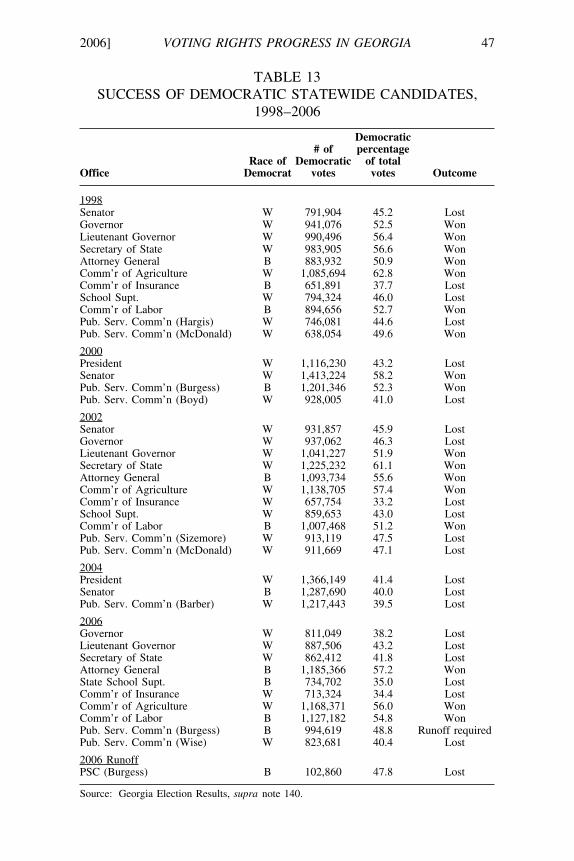
\\server05\productn\N\NYL\10-1\NYL101.txt unknown Seq: 47 29-MAY-07 17:22
2006] VOTING RIGHTS PROGRESS IN GEORGIA 47
TABLE 13SUCCESS OF DEMOCRATIC STATEWIDE CANDIDATES,
1998–2006
Democratic# of percentage
Race of Democratic of totalOffice Democrat votes votes Outcome
1998Senator W 791,904 45.2 LostGovernor W 941,076 52.5 WonLieutenant Governor W 990,496 56.4 WonSecretary of State W 983,905 56.6 WonAttorney General B 883,932 50.9 WonComm’r of Agriculture W 1,085,694 62.8 WonComm’r of Insurance B 651,891 37.7 LostSchool Supt. W 794,324 46.0 LostComm’r of Labor B 894,656 52.7 WonPub. Serv. Comm’n (Hargis) W 746,081 44.6 LostPub. Serv. Comm’n (McDonald) W 638,054 49.6 Won
2000President W 1,116,230 43.2 LostSenator W 1,413,224 58.2 WonPub. Serv. Comm’n (Burgess) B 1,201,346 52.3 WonPub. Serv. Comm’n (Boyd) W 928,005 41.0 Lost
2002Senator W 931,857 45.9 LostGovernor W 937,062 46.3 LostLieutenant Governor W 1,041,227 51.9 WonSecretary of State W 1,225,232 61.1 WonAttorney General B 1,093,734 55.6 WonComm’r of Agriculture W 1,138,705 57.4 WonComm’r of Insurance W 657,754 33.2 LostSchool Supt. W 859,653 43.0 LostComm’r of Labor B 1,007,468 51.2 WonPub. Serv. Comm’n (Sizemore) W 913,119 47.5 LostPub. Serv. Comm’n (McDonald) W 911,669 47.1 Lost
2004President W 1,366,149 41.4 LostSenator B 1,287,690 40.0 LostPub. Serv. Comm’n (Barber) W 1,217,443 39.5 Lost
2006Governor W 811,049 38.2 LostLieutenant Governor W 887,506 43.2 LostSecretary of State W 862,412 41.8 LostAttorney General B 1,185,366 57.2 WonState School Supt. B 734,702 35.0 LostComm’r of Insurance W 713,324 34.4 LostComm’r of Agriculture W 1,168,371 56.0 WonComm’r of Labor B 1,127,182 54.8 WonPub. Serv. Comm’n (Burgess) B 994,619 48.8 Runoff requiredPub. Serv. Comm’n (Wise) W 823,681 40.4 Lost
2006 RunoffPSC (Burgess) B 102,860 47.8 Lost
Source: Georgia Election Results, supra note 140.
\\server05\productn\N\NYL\10-1\NYL101.txt unknown Seq: 48 29-MAY-07 17:22
48 LEGISLATION AND PUBLIC POLICY [Vol. 10:1
In 2000, Democrats won two of the four contests in which allGeorgians could vote, and one of the winners was the only African-American nominee. White Democrats, vying for the three other spots,won only one. In 1998, African-American Democrats won two ofthree contests, and white Democrats did approximately the same, win-ning five of eight contests. The Insurance Commissioner race, thesole 1998 contest that was lost by an African-American candidate, issomewhat anomalous. Not only did the candidate have to run againsta Republican incumbent, but some questioned the seriousness of hercampaign.196
In sum, it appears that the politics of Georgia have undergone adramatic transformation in all aspects of minority participation. Afri-can-Americans have won hundreds of offices elected from constituen-cies of various sizes. In recent general elections, African-Americanstatewide Democratic candidates have fared better than their whitecolleagues. And while Georgia’s electorate as a whole supportsRepublicans,197 African-American Democrats are doing about as wellin attracting white voters as are white Democratic candidates, and thatsupport has been crucial to the success of African-American candi-dates. Without the support of white voters, African-American candi-dates could not have achieved the notable success that they haveenjoyed in statewide and congressional contests in recent years. Asstated in the post-trial brief filed by Georgia’s African-American At-torney General, Thurbert Baker, in Georgia v. Ashcroft:
The [s]tate[’s] racial and political experience in recent years is radi-cally different than it was ten or twenty years ago, and that is exem-plified on every level of politics from statewide elections on down.The election history for legislative offices in Georgia—House, Sen-ate and Congress—reflect a high level of success by African-Amer-ican candidates.198
VI.CONCLUSION
In the years since the enactment of the VRA, African-Americanparticipation in Georgia elections has reached unprecedented levels,
196. Plaintiff’s Exhibit 24 at 22–23, Georgia v. Ashcroft, 195 F. Supp. 2d 25(D.D.C. 2002) (No. 01-2111) (statement by Charles Walker, the African-Americanmajority leader of the state senate at the time, that she “did not have the support of theblack community nor did she have a credible campaign. No one took her seri-ously. . . . [S]he never even campaigned. She never even put signs up. She didn’t doanything.”).197. See Bookman, supra note 128. R198. Post-Trial Brief for the State of Georgia at 2, Georgia v. Ashcroft, 195 F. Supp.
2d 25 (D.D.C. 2002) (Civ. A. No. 01-2111).
\\server05\productn\N\NYL\10-1\NYL101.txt unknown Seq: 49 29-MAY-07 17:22
2006] VOTING RIGHTS PROGRESS IN GEORGIA 49
suggesting that the institutionalized racism that necessitated the VRAhas been largely eliminated. In some recent years, the Census Bureauhas estimated that African Americans and whites have registered andvoted in elections at roughly comparable rates, although figures re-ported by Georgia’s Secretary of State show that white registrantscontinue to go to the polls at higher rates than African-American reg-istrants. Nonetheless, the state figures also show growing African-American participation; African-American registration in 2004equaled the proportion of African Americans in Georgia’s citizenadult population. From 1996 to 2004, the Secretary of State’s datashow an increase in African-American registration of almost 25% andin 2004, 72% of this enlarged African-American electorate went to thepolls.
African Americans have also made impressive gains in gettingelected to office. Currently the state has four African Americans inCongress and, after the 2006 election, fifty-four in the state legislature.More than a quarter of the statewide officials are African American,including two constitutional officers. As the success in winning state-wide posts suggests, African Americans are now winning races in dis-tricts in which African Americans are not a majority of the population.Additionally, in a number of majority-white districts, African-Ameri-can voters can determine the Democratic nominee. Finally, anotherfactor facilitating the election of African-American candidates frommajority-white districts has been the greater willingness of whites tovote for African-American candidates than vice versa.
Future prospects for African-American candidates depend in parton the future of the Democratic Party. White voters increasingly iden-tify with the Republican Party,199 and Republicans are at historichighs in terms of the offices they control.200 African Americans nowhold more statewide, state legislative, and congressional offices thando white Democrats, but Democratic candidates, both African-Ameri-can and white, are increasingly failing to win elections statewide andin most congressional and state legislative districts. If these trendscontinue, African Americans may lose some of the statewide poststhey currently have, but they seem unlikely to lose congressional orstate legislative seats in districts that have substantial African-Ameri-can populations.
199. Bullock, 2007, supra note 124, at 60–63. R200. Id. at 51.

\\server05\productn\N\NYL\10-1\NYL101.txt unknown Seq: 50 29-MAY-07 17:22


