Vote 32 Telecommunications and Postal Services budget/2017/ene...601 Vote 32 Telecommunications and...
20
601 Vote 32 Telecommunications and Postal Services Budget summary 2017/18 2018/19 2019/20 R million Total Current payments Transfers and subsidies Payments for capital assets Total Total MTEF allocation Administration 194.2 186.7 – 7.6 206.3 219.2 International Affairs and Trade 47.8 21.9 25.5 0.4 50.2 53.2 Policy, Research and Capacity Development 90.4 89.8 – 0.6 95.2 101.7 ICT Enterprise Development and Oversight 251.1 33.8 216.1 1.3 265.2 280.5 ICT Infrastructure Support 1 030.7 463.4 565.1 2.2 1 110.7 1 174.1 Total expenditure estimates 1 614.2 795.5 806.7 12.0 1 727.5 1 828.8 Executive authority Minister of Telecommunications and Postal Services Accounting officer Director General of Telecommunications and Postal Services Website address www.doc.gov.za The Estimates of National Expenditure e-publications for individual votes are available on www.treasury.gov.za. These publications provide more comprehensive coverage of vote specific information, particularly about goods and services, transfers and subsidies, personnel, entities, donor funding, public private partnerships, conditional grants to provinces and municipalities, and expenditure information at the level of site service delivery, where appropriate. Vote purpose Develop information and communication technology (ICT) policies and legislation that create favourable conditions for accelerated and shared sustainable economic growth that positively impacts on the wellbeing of all South Africans. Mandate The Department of Telecommunications and Postal Services is mandated to develop ICT policies and to ensure the development of robust, reliable, secure and affordable ICT infrastructure. This contributes to the development of an inclusive information society in which information and ICT tools are key drivers of accelerated and sustained shared economic growth and societal development. The Electronic Communications Act (2005) allows the Minister of Telecommunications and Postal Services to draft policies to fulfil South Africa’s obligations under bilateral, multilateral, and international treaties and conventions; set guidelines for the determination of certain licence fees by the Independent Communications Authority of South Africa; and promote universal service and electronic communications services in underserviced areas. The act also allows the minister to promote the participation of small businesses in the ICT sector, and oversee and strengthen the capacity of state-owned enterprises. The department also contributes to building an ICT skills base in the country to ensure equitable prosperity and global competitiveness. In addition to the Electronic Communications Act (2005), the department’s mandate is derived from the following legislation: • the Electronic Communications and Transactions Act (2002) • the Sentech Act (1996) • the Postal Services Act (1998) • the South Africa Post Office SOC Ltd Act (2011) • the South African Postbank Limited Act (2010) • the State Information Technology Agency Act (1998) • the Broadband Infraco Act (2007).
-
Upload
nguyenkhanh -
Category
Documents
-
view
217 -
download
3
Transcript of Vote 32 Telecommunications and Postal Services budget/2017/ene...601 Vote 32 Telecommunications and...

601
Vote 32 Telecommunications and Postal Services Budget summary
2017/18 2018/19 2019/20
R million Total Current
payments Transfers and
subsidies Payments for capital assets Total Total
MTEF allocation Administration 194.2 186.7 – 7.6 206.3 219.2International Affairs and Trade 47.8 21.9 25.5 0.4 50.2 53.2Policy, Research and Capacity Development 90.4 89.8 – 0.6 95.2 101.7ICT Enterprise Development and Oversight 251.1 33.8 216.1 1.3 265.2 280.5ICT Infrastructure Support 1 030.7 463.4 565.1 2.2 1 110.7 1 174.1Total expenditure estimates 1 614.2 795.5 806.7 12.0 1 727.5 1 828.8Executive authority Minister of Telecommunications and Postal Services Accounting officer Director General of Telecommunications and Postal Services Website address www.doc.gov.za The Estimates of National Expenditure e-publications for individual votes are available on www.treasury.gov.za. These publications provide more comprehensive coverage of vote specific information, particularly about goods and services, transfers and subsidies, personnel, entities, donor funding, public private partnerships, conditional grants to provinces and municipalities, and expenditure information at the level of site service delivery, where appropriate.
Vote purpose Develop information and communication technology (ICT) policies and legislation that create favourable conditions for accelerated and shared sustainable economic growth that positively impacts on the wellbeing of all South Africans.
Mandate The Department of Telecommunications and Postal Services is mandated to develop ICT policies and to ensure the development of robust, reliable, secure and affordable ICT infrastructure. This contributes to the development of an inclusive information society in which information and ICT tools are key drivers of accelerated and sustained shared economic growth and societal development. The Electronic Communications Act (2005) allows the Minister of Telecommunications and Postal Services to draft policies to fulfil South Africa’s obligations under bilateral, multilateral, and international treaties and conventions; set guidelines for the determination of certain licence fees by the Independent Communications Authority of South Africa; and promote universal service and electronic communications services in underserviced areas. The act also allows the minister to promote the participation of small businesses in the ICT sector, and oversee and strengthen the capacity of state-owned enterprises. The department also contributes to building an ICT skills base in the country to ensure equitable prosperity and global competitiveness.
In addition to the Electronic Communications Act (2005), the department’s mandate is derived from the following legislation:
• the Electronic Communications and Transactions Act (2002) • the Sentech Act (1996) • the Postal Services Act (1998) • the South Africa Post Office SOC Ltd Act (2011) • the South African Postbank Limited Act (2010) • the State Information Technology Agency Act (1998) • the Broadband Infraco Act (2007).

2017 Estimates of National Expenditure
602
Selected performance indicators Table 32.1 Performance indicators by programme and related outcome Indicator Programme Outcome Past Current Projections
2013/14 2014/15 2015/16 2016/17 2017/18 2018/19 2019/20 Number of ICT position papers developed for international engagements per year
International Affairs and Trade
Outcome 6: An efficient, competitive and responsive economic infrastructure network
3 5 5 5 4 4 4
Number of identified government institutions connected as part of the national broadband plan: digital development (phase 1) per year
ICT Infrastructure Support
–1 –1 0 1 293 2 700 1 718 1 717
Number of identified schools connected as part of the national broadband plan: digital development (phase 1) per year
ICT Infrastructure Support
–1 –1 0 1 507 887 2 048 2 048
1. No historical data available.
Expenditure analysis The National Development Plan (NDP) envisages that by 2030, the ICT sector will underpin the development of a dynamic and connected information society, and a vibrant knowledge economy that is inclusive and prosperous. Drawing from this vision, the Department of Telecommunications and Postal Services contributes to outcome 6 (an efficient, competitive and responsive economic infrastructure network) of government’s 2014-2019 medium-term strategic framework by ensuring that ICT infrastructure and services are accessible, affordable, robust, reliable and secure. Over the medium term, the department will expand and modernise ICT infrastructure by implementing the South Africa Connect broadband policy, coordinating the migration to digital broadcasting, and implementing the legislative framework stemming from the 2016 National Integrated ICT Policy White Paper.
The department oversees state-owned companies within its portfolio to ensure that they grow sustainably, fulfil their mandates and are aligned with broader government objectives. An estimated 41 per cent of the department’s total budget will be transferred to these entities over the medium term to cater for operational expenditure and specific projects such as digital migration. Spending in the Public Entity Oversight subprogramme in the ICT Enterprise Development and Oversight programme is expected to amount to R757 million over the medium term. A once-off sum of R650 million in 2016/17 for the recapitalisation of the South African Post Office resulted in spending in this programme increasing to R886.6 million in that year.
The department will focus on completing a review of its organisational structure over the medium term, in line with its revised mandate, strategic goals and objectives. This review will take into account Cabinet-approved reductions in the budget for compensation of employees over the period.
Connecting South Africa The department’s broadband policy places emphasis on ensuring connectivity in underserviced areas, prioritising schools, health facilities and other government institutions. A key focus of the department over the medium term will be on project managing and coordinating the implementation of the first phase of South Africa Connect broadband policy by rolling out broadband services to an estimated 6 135 government institutions and 4 983 schools. An amount of R1.9 billion is allocated for this in the ICT Infrastructure Support programme over the medium term on account of the increased budget for consultants and agency support.
Coordinating digital migration South Africa was given until June 2015 to meet the International Telecommunications Union’s deadline to switch off analogue transmitters as part of the broadcasting digital migration project. However, the project has been delayed following a court ruling that declared part of the digital migration policy unlawful and invalid, and effectively placed the manufacture of digital terrestrial television set-top boxes on hold. As a result of the delay, Sentech will continue to maintain both the analogue and digital platforms until the issue is resolved. An amount of R193 million has been reprioritised in 2017/18 from the allocation for subsidies for set-top boxes to Sentech to cover dual illumination costs. The South African Post Office is set to receive R240 million in 2017/18 for the distribution of approximately 1.8 million set-top boxes, including registering households qualifying for the subsidy. An amount of R176.4 million is allocated to Sentech for expenditure related to the migration of digital

Vote 32: Telecommunication and Postal Services
603
signals over the medium term. Spending on these activities is expected to amount to R1.3 billion over the medium term in the Digital Terrestrial Television subprogramme in the Infrastructure Support programme.
Implementing ICT policy Following Cabinet’s approval of the 2016 White Paper National Integrated ICT Policy, the department will focus on the ongoing legislative processes to implement the recommendations of the white paper. The department will also facilitate and coordinate the implementation of the national e-strategy to realise the e-services programme. Finalising a national e-strategy will plan for the digital transformation of South Africa to achieve the ideals of the NDP by prioritising sectoral electronic services such as e-health, e-agriculture and e-education. To give effect to these activities, spending in the Policy, Research and Capacity Development programme is expected to amount to R287.2 million over the medium term.
Expenditure trends Table 32.2 Vote expenditure trends by programme and economic classificationProgrammes 1. Administration 2. International Affairs and Trade 3. Policy, Research and Capacity Development 4. ICT Enterprise Development and Oversight 5. ICT Infrastructure Support Programme
Ann
ual b
udge
t
Adj
uste
d
appr
opria
tion
Aud
ited
ou
tcom
e
Ann
ual b
udge
t
Adj
uste
d
appr
opria
tion
Aud
ited
ou
tcom
e
Ann
ual b
udge
t
Adj
uste
d
appr
opria
tion
Aud
ited
ou
tcom
e
Ann
ual b
udge
t
Adj
uste
d
appr
opria
tion
Rev
ised
es
timat
e
Aver
age:
Ou
tcom
e/Ann
ual
budg
et
(%)
Aver
age:
Ou
tcom
e/Adj
uste
d
appr
opria
tion
(%)
R million 2013/14 2014/15 2015/16 2016/17 2013/14 - 2016/17 Programme 1 216.1 216.1 201.2 216.4 230.4 225.3 173.7 180.3 221.9 193.3 207.9 205.8 106.8% 102.3%Programme 2 33.3 33.3 38.5 36.8 36.8 42.5 43.4 43.4 41.5 44.7 45.7 45.5 106.2% 105.6%Programme 3 84.4 89.4 88.3 98.0 121.0 72.9 105.6 105.6 74.0 95.6 88.8 86.8 83.9% 79.5%Programme 4 708.1 761.1 176.5 719.2 742.4 247.6 447.9 447.9 489.0 891.8 886.6 886.1 65.0% 63.4%Programme 5 1 002.0 1 272.2 1 196.9 523.0 1 106.0 979.8 642.8 628.0 473.8 1 191.9 1 188.5 920.6 106.3% 85.1%Total 2 043.9 2 372.1 1 701.5 1 593.4 2 236.7 1 568.1 1 413.3 1 405.3 1 300.1 2 417.4 2 417.4 2 144.8 89.9% 79.6%Change to 2016 Budget estimate
Economic classification Current payments 484.8 760.0 744.9 503.4 524.7 398.9 679.7 671.6 412.1 708.3 698.6 426.1 83.4% 74.7%Compensation of employees
195.0 195.0 158.5 204.6 204.6 175.5 191.8 198.5 181.7 213.7 213.7 209.1 90.0% 89.3%
Goods and services 289.8 565.0 586.4 298.8 320.1 223.4 487.9 473.1 230.4 494.6 484.9 216.9 80.0% 68.2%Transfers and subsidies 1 554.0 1 607.0 953.5 1 084.5 1 704.5 1 158.5 728.6 728.6 882.0 1 054.1 1 054.1 1 054.1 91.6% 79.5%Departmental agencies and accounts
773.4 788.4 395.9 771.4 1 322.4 945.4 597.4 597.4 532.6 790.8 790.8 790.8 – –
Foreign governments and international organisations
16.2 16.2 21.0 16.2 16.2 23.7 22.2 22.2 24.6 23.4 23.4 23.4 119.0% 119.0%
Public corporations and private enterprises
764.4 802.4 535.4 297.0 366.0 188.8 109.0 109.0 324.1 240.0 240.0 240.0 91.3% 84.9%
Non-profit institutions – – 0.4 – – 0.1 – – – – – – – –Households – – 0.9 – – 0.4 – – 0.7 – – – – –Payments for capital assets
5.2 5.2 2.5 5.5 7.5 10.3 5.1 5.1 5.5 5.0 14.6 14.6 159.1% 101.7%
Machinery and equipment 5.2 5.2 2.4 5.5 5.5 10.1 5.1 5.1 3.4 4.6 7.7 7.7 116.6% 101.0%Software and other intangible assets
– – 0.1 – 2.0 0.2 – – 2.1 0.4 6.9 6.9 2 308.0% 103.7%
Payments for financial assets
– – 0.6 – – 0.4 – – 0.4 650.0 650.0 650.0 100.2% 100.2%
Total 2 043.9 2 372.1 1 701.5 1 593.4 2 236.7 1 568.1 1 413.3 1 405.3 1 300.1 2 417.4 2 417.4 2 144.8 89.9% 79.6%

2017 Estimates of National Expenditure
604
Expenditure estimates Table 32.3 Vote expenditure estimates by programme and economic classificationProgrammes 1. Administration 2. International Affairs and Trade 3. Policy, Research and Capacity Development 4. ICT Enterprise Development and Oversight 5. ICT Infrastructure Support Programme
Revised estimate
Average growth
rate (%)
Average:Expenditure/
Total(%) Medium-term expenditure estimate
Averagegrowth
rate(%)
Average:Expenditure/
Total(%)
R million 2016/17 2013/14 - 2016/17 2017/18 2018/19 2019/20 2016/17 - 2019/20 Programme 1 205.8 -1.6% 12.7% 194.2 206.3 219.2 2.1% 11.3%Programme 2 45.5 11.0% 2.5% 47.8 50.2 53.2 5.3% 2.7%Programme 3 86.8 -1.0% 4.8% 90.4 95.2 101.7 5.4% 5.1%Programme 4 886.1 5.2% 26.8% 251.1 265.2 280.5 -31.8% 23.0%Programme 5 920.6 -10.2% 53.2% 1 030.7 1 110.7 1 174.1 8.4% 57.9%Total 2 144.8 -3.3% 100.0% 1 614.2 1 727.5 1 828.8 -5.2% 100.0%Change to 2016 Budget estimate
(22.1) (23.6) (24.9)
Economic classification Current payments 426.1 -17.5% 29.5% 795.5 1 114.8 1 182.1 40.5% 48.1%Compensation of employees 209.1 2.4% 10.8% 214.7 224.3 241.4 4.9% 12.2%Goods and services 216.9 -27.3% 18.7% 580.8 890.5 940.7 63.1% 35.9%Transfers and subsidies 1 054.1 -13.1% 60.3% 806.7 603.5 637.2 -15.4% 42.4%Departmental agencies and accounts 790.8 0.1% 39.7% 295.2 516.5 545.4 -11.6% 29.4%Foreign governments and international organisations
23.4 13.1% 1.4% 25.5 27.0 28.4 6.7% 1.4%
Public corporations and private enterprises 240.0 -33.1% 19.2% 486.0 60.0 63.4 -35.8% 11.6%Payments for capital assets 14.6 41.5% 0.5% 12.0 9.3 9.6 -13.2% 0.6%Machinery and equipment 7.7 14.3% 0.4% 10.6 8.4 8.5 3.2% 0.5%Software and other intangible assets 6.9 – 0.1% 1.4 0.9 1.1 -46.1% 0.1%Payments for financial assets 650.0 – 9.7% – – – -100.0% 8.9%Total 2 144.8 -3.3% 100.0% 1 614.2 1 727.5 1 828.8 -5.2% 100.0%
Goods and services expenditure trends and estimates Table 32.4 Vote goods and services expenditure trends and estimates
Audited outcome Adjusted
appropriation
Averagegrowth
rate(%)
Average: Expen-diture/
Total(%)
Medium-term expenditure estimate
Averagegrowth
rate(%)
Average:Expen-diture/
Total(%)
R thousand 2013/14 2014/15 2015/16 2016/17 2013/14 - 2016/17 2017/18 2018/19 2019/20 2016/17 - 2019/20 Administrative fees 2 089 1 492 1 627 2 094 0.1% 0.5% 1 346 1 478 1 620 -8.2% 0.2%Advertising 49 614 1 468 3 198 2 594 -62.6% 3.7% 2 368 4 268 3 948 15.0% 0.5%Minor assets 444 266 479 2 779 84.3% 0.3% 1 269 1 427 1 147 -25.5% 0.2%Audit costs: External 10 458 14 591 28 067 5 335 -20.1% 3.8% 3 857 3 625 3 906 -9.9% 0.6%Bursaries: Employees 382 636 513 845 30.3% 0.2% 2 276 2 488 2 477 43.1% 0.3%Catering: Departmental activities 3 423 1 120 1 969 2 084 -15.2% 0.6% 1 626 1 507 2 047 -0.6% 0.3%Communication 5 349 5 190 5 182 6 158 4.8% 1.4% 5 566 6 254 6 776 3.2% 0.9%Computer services 3 416 9 466 5 117 2 525 -9.6% 1.3% 15 587 10 127 10 045 58.5% 1.3%Consultants: Business and advisory services 410 057 49 055 75 146 21 784 -62.4% 36.5% 435 956 736 800 749 465 225.2% 67.1%Infrastructure and planning services – – – 128 – – – – – -100.0% –Legal services 2 071 8 603 6 155 2 998 13.1% 1.3% 4 100 5 855 6 429 29.0% 0.7%Contractors 3 987 2 336 2 060 4 017 0.3% 0.8% 1 764 2 057 2 572 -13.8% 0.4%Agency and support/outsourced services 125 23 233 144 317 037 1263.7% 22.3% 6 114 7 363 35 832 -51.7% 12.6%Entertainment 371 297 494 500 10.5% 0.1% 326 297 355 -10.8% 0.1%Fleet services (including government motor transport)
1 948 1 471 999 777 -26.4% 0.3% 661 528 568 -9.9% 0.1%
Inventory: Clothing material and accessories 17 119 – – -100.0% – – – – – –Inventory: Fuel, oil and gas 4 5 – 20 71.0% – 21 – – -100.0% –Inventory: Materials and supplies 60 10 12 25 -25.3% – 27 44 31 7.4% –Inventory: Medical supplies 3 – – 27 108.0% – – – – -100.0% –Inventory: Other supplies 2 – – 234 389.1% – 23 – 2 -79.6% –Consumable supplies 119 136 208 203 19.5% – 204 245 231 4.4% –Consumables: Stationery, printing and office supplies
4 538 5 534 5 186 6 160 10.7% 1.4% 6 603 7 531 7 388 6.2% 1.0%
Operating leases 38 031 46 395 43 180 44 119 5.1% 11.3% 36 352 39 976 41 830 -1.8% 5.6%Rental and hiring 2 098 740 1 364 510 -37.6% 0.3% 655 576 583 4.6% 0.1%Property payments 9 813 11 703 10 152 10 725 3.0% 2.8% 13 733 13 538 14 342 10.2% 1.8%Transport provided: Departmental activity – – – 590 – – 140 – – -100.0% –Travel and subsistence 28 566 27 910 33 140 25 342 -3.9% 7.5% 23 758 21 889 28 696 4.2% 3.4%Training and development 2 185 6 840 2 433 15 708 93.0% 1.8% 9 261 10 424 12 683 -6.9% 1.7%Operating payments 1 349 2 399 1 325 4 580 50.3% 0.6% 995 2 907 3 171 -11.5% 0.4%Venues and facilities 5 850 2 402 2 277 5 035 -4.9% 1.0% 6 248 9 271 4 512 -3.6% 0.9%Total 586 369 223 417 230 427 484 933 -6.1% 100.0% 580 836 890 475 940 656 24.7% 100.0%

Vote 32: Telecommunication and Postal Services
605
Transfers and subsidies expenditure trends and estimates Table 32.5 Vote transfers and subsidies trends and estimates
Audited outcome Adjusted
appropriation
Averagegrowth
rate(%)
Average: Expen-diture/
Total(%)
Medium-term expenditure estimate
Averagegrowth
rate(%)
Average: Expen-diture/
Total(%)
R thousand 2013/14 2014/15 2015/16 2016/17 2013/14 - 2016/17 2017/18 2018/19 2019/20 2016/17 - 2019/20 Provinces and municipalities Provincial agencies and funds Current – – 13 – – – – – – – –Provincial and local governments – – 13 – – – – – – – –Provinces and municipalities Municipal agencies and funds Current 9 9 – – -100.0% – – – – – –Provinces and municipalities 9 9 – – -100.0% – – – – – –Departmental agencies and accounts Departmental agencies (non-business entities) Current 395 886 945 422 532 574 790 785 25.9% 65.8% 295 181 516 496 545 420 -11.6% 69.3%Information Systems, Electronics and Telecommunication Technologies Education and Training Authority
– 1 199 – – – – – – – – –
Departmental agencies and accounts 4 – 4 – -100.0% – – – – – –National Electronic Media Institute of South Africa 50 746 37 859 36 601 77 200 15.0% 5.0% 85 785 90 761 95 844 7.5% 11.3%Universal Service and Access Agency of South Africa 60 090 65 376 262 429 69 045 4.7% 11.3% 75 684 80 074 84 558 7.0% 10.0%Universal Service and Access Fund 45 046 49 988 52 380 55 156 7.0% 5.0% 54 614 57 781 61 017 3.4% 7.4%Universal Service and Access Fund: Broadcasting digital migration
240 000 791 000 181 160 589 384 34.9% 44.5% 79 098 287 880 304 001 -19.8% 40.6%
Foreign governments and international organisations Current 20 968 23 724 24 629 23 363 3.7% 2.3% 25 532 26 954 28 408 6.7% 3.4%Households 66 – – – -100.0% – – – – – –Universal Postal Union 4 667 5 314 5 446 4 979 2.2% 0.5% 5 228 5 531 5 841 5.5% 0.7%International Telecommunications Union 14 212 16 204 16 545 15 535 3.0% 1.5% 16 312 17 258 18 224 5.5% 2.2%African Telecommunications Union 853 927 940 1 039 6.8% 0.1% 1 091 1 154 1 219 5.5% 0.1%Pan-African Postal Union 754 861 1 071 955 8.2% 0.1% 1 003 1 061 1 120 5.5% 0.1%Organisation for Economic Cooperation and Development 416 – 185 459 3.3% – 482 510 539 5.5% 0.1%Commonwealth Telecommunications Organisation – 418 442 396 – – 416 440 465 5.5% 0.1%Dona Foundation – – – – – – 1 000 1 000 1 000 – 0.1%Public corporations and private enterprises Other transfers to public corporations Current – 50 014 115 104 240 000 – 10.0% 240 000 – – -100.0% 15.5%Public corporations and private enterprises – 14 12 – – – – – – – –South African Post Office – 50 000 115 092 – – 4.1% – – – – –South African Post Office: Broadcasting digital migration – – – 240 000 – 5.9% 240 000 – – -100.0% 15.5%Capital 535 304 138 807 209 000 – -100.0% 21.8% 246 000 60 000 63 360 – 11.9%Household – 2 – – – – – – – – –Sentech 423 304 69 805 – – -100.0% 12.2% – – – – –Sentech: African Nations Championship 6 000 – – – -100.0% 0.1% – – – – –Sentech: Dual illumination costs relating to the digital migration project
106 000 69 000 209 000 – -100.0% 9.5% 193 000 – – – 6.2%
Sentech: Migration of digital signals – – – – – – 53 000 60 000 63 360 – 5.7%Public corporations and private enterprises Other transfers to private enterprises Current 47 13 – – -100.0% – – – – – –Public corporations and private enterprises 47 13 – – -100.0% – – – – – –Non-profit institutions Current 399 110 – – -100.0% – – – – – –Non-profit institution 399 110 – – -100.0% – – – – – –Households Social benefits Current 793 – 438 – -100.0% – – – – – –Households 793 – 438 – -100.0% – – – – – –Households Other transfers to households Current 139 421 291 – -100.0% – – – – – –Employee ex-gratia payment 44 – – – -100.0% – – – – – –Households 95 421 291 – -100.0% – – – – – –Total 953 545 1 158 520 882 049 1 054 148 3.4% 100.0% 806 713 603 450 637 188 -15.4% 100.0%

2017 Estimates of National Expenditure
606
Personnel information Table 32.6 Vote personnel numbers and cost by salary level and programme¹Programmes 1. Administration 2. International Affairs and Trade 3. Policy, Research and Capacity Development 4. ICT Enterprise Development and Oversight 5. ICT Infrastructure Support
Number of posts estimated for 31 March 2017 Number and cost2 of personnel posts filled / planned for on funded establishment Number
Number of
funded posts
Number of posts
additional to the
establishment Actual Revised estimate Medium-term expenditure estimate
Average growth
rate(%)
Average: Salary
level/Total(%)
2015/16 2016/17 2017/18 2018/19 2019/20 2016/17 - 2019/20 Telecommunications and Postal Services
Number Cost
Unit cost
Number Cost
Unit cost
Number Cost
Unit cost Number Cost
Unit cost
Number Cost
Unit cost
Salary level 316 1 278 181.7 0.7 311 209.1 0.7 296 214.7 0.7 284 224.3 0.8 285 241.4 0.8 -2.9% 100.0%1 – 6 24 – 25 6.3 0.3 24 6.2 0.3 23 5.9 0.3 23 6.4 0.3 23 6.9 0.3 -1.4% 7.9%7 – 10 109 – 104 40.8 0.4 109 42.8 0.4 101 40.7 0.4 93 40.4 0.4 94 43.8 0.5 -4.8% 33.8%11 – 12 64 – 58 41.4 0.7 64 45.3 0.7 58 44.6 0.8 54 44.9 0.8 54 48.6 0.9 -5.5% 19.6%13 – 16 104 1 86 87.4 1.0 105 110.0 1.0 105 118.2 1.1 105 127.0 1.2 105 136.2 1.3 – 35.7%Other 15 – 5 5.8 1.2 9 4.9 0.5 9 5.2 0.6 9 5.6 0.6 9 5.9 0.7 – 3.1%Programme 316 1 278 181.7 0.7 311 209.1 0.7 296 214.7 0.7 284 224.3 0.8 285 241.4 0.8 -2.9% 100.0%Programme 1 151 1 141 86.2 0.6 150 94.2 0.6 138 93.4 0.7 134 98.6 0.7 135 106.2 0.8 -3.5% 47.4%Programme 2 20 – 15 10.6 0.7 19 13.8 0.7 19 14.5 0.8 18 15.1 0.8 18 16.2 0.9 -1.8% 6.3%Programme 3 80 – 76 49.4 0.7 80 53.7 0.7 78 56.2 0.7 75 58.8 0.8 75 63.2 0.8 -2.1% 26.2%Programme 4 37 – 25 17.8 0.7 34 25.6 0.8 33 27.2 0.8 31 28.0 0.9 31 30.1 1.0 -3.0% 11.0%Programme 5 28 – 21 17.7 0.8 28 21.8 0.8 28 23.4 0.8 26 23.9 0.9 26 25.7 1.0 -2.4% 9.2%1. Data has been provided by the department and may not necessarily reconcile with official government personnel data. 2. Rand million.
Departmental receipts Table 32.7 Departmental receipts by economic classification
Audited outcome Adjusted estimate
Revised estimate
Averagegrowth
rate (%)
Average: Receipt
item/Total
(%) Medium-term receipts estimate
Averagegrowth
rate(%)
Average:Receipt
item/Total
(%)R thousand 2013/14 2014/15 2015/16 2016/17 2013/14 - 2016/17 2017/18 2018/19 2019/20 2016/17 - 2019/20 Departmental receipts 1 710 048 1 670 224 26 804 435 559 537 559 537 -31.1% 100.0% 508 090 508 100 508 098 -3.2% 100.0%Sales of goods and services produced by department
123 57 52 37 37 -33.0% – 47 49 49 9.8% –
Sales by market establishments
65 – – – – -100.0% – – – – – –
of which: Market establishment: Non-residential buildings
65 – – – – -100.0% – – – – – –
Administrative fees 8 6 5 3 3 -27.9% – 7 7 7 32.6% – of which: Cryptography fees 8 6 5 3 3 -27.9% – 7 7 7 32.6% – Other sales 50 51 47 34 34 -12.1% – 40 42 42 7.3% – of which: Commission on insurance 50 51 47 34 34 -12.1% – 40 42 42 7.3% – Transfers received – 728 – – – – – – – – – – Interest, dividends and rent on land
1 708 937 1 667 734 1 335 925 559 240 559 240 -31.1% 17.1% 507 384 507 385 507 383 -3.2% 99.9%
Interest 807 1 013 446 183 183 -39.0% – 121 122 120 -13.1% – Dividends 1 708 130 1 666 721 1 335 479 559 057 559 057 -31.1% 17.1% 507 263 507 263 507 263 -3.2% 99.9%of which: Vodacom shares 1 708 130 1 666 721 828 216 32 32 -97.3% 13.7% – – – -100.0% – Telkom shares – – 507 263 559 025 559 025 – 3.5% 507 263 507 263 507 263 -3.2% 99.9%Sales of capital assets – – – 100 100 – – – – – -100.0% – Transactions in financial assets and liabilities
988 1 705 25 468 458 160 160 -45.5% 82.8% 659 666 666 60.9% 0.1%
Total 1 710 048 1 670 224 26 804 435 559 537 559 537 -31.1% 100.0% 508 090 508 100 508 098 -3.2% 100.0%
Programme 1: Administration Programme purpose Provide strategic leadership, management and support services to the department.

Vote 32: Telecommunication and Postal Services
607
Expenditure trends and estimates Table 32.8 Administration expenditure trends and estimates by subprogramme and economic classification Subprogramme
Audited outcome Adjusted
appropriation
Averagegrowth
rate(%)
Average: Expen-diture/
Total(%)
Medium-term expenditure estimate
Averagegrowth
rate(%)
Average:Expen-diture/
Total(%)
R million 2013/14 2014/15 2015/16 2016/17 2013/14 - 2016/17 2017/18 2018/19 2019/20 2016/17 - 2019/20 Ministry 3.7 4.1 4.2 4.4 5.9% 1.9% 4.2 4.4 5.2 5.9% 2.2%Departmental Management 35.3 65.8 73.3 45.8 9.1% 25.7% 37.3 39.2 42.0 -2.9% 19.8%Internal Audit 3.8 5.7 5.2 8.1 28.5% 2.7% 5.3 5.7 6.0 -9.5% 3.0%Corporate Services 89.1 70.2 62.6 69.2 -8.1% 34.0% 66.8 71.8 77.1 3.7% 34.4%Financial Management 63.3 73.6 70.4 70.8 3.8% 32.5% 70.5 74.6 77.6 3.1% 35.5%Office Accommodation 6.0 6.0 6.1 9.6 16.8% 3.2% 10.1 10.7 11.3 5.5% 5.0%Total 201.2 225.3 221.9 207.9 1.1% 100.0% 194.2 206.3 219.2 1.8% 100.0%Change to 2016 Budget estimate
14.6 (11.4) (10.9) (12.2)
Economic classification Current payments 199.0 214.3 217.2 196.6 -0.4% 96.6% 186.7 199.1 212.1 2.6% 96.0%Compensation of employees 64.0 85.4 86.2 96.4 14.6% 38.8% 93.4 98.6 106.2 3.3% 47.7%Goods and services1 135.1 129.0 131.0 100.3 -9.5% 57.8% 93.3 100.5 105.9 1.8% 48.3%of which: Computer services 0.7 9.5 5.0 1.6 34.5% 2.0% 8.4 6.9 6.6 60.3% 2.8%Legal services 2.1 8.6 6.2 2.2 1.5% 2.2% 4.1 5.9 6.4 43.7% 2.2%Consumables: Stationery, printing and office supplies
2.8 3.8 4.2 4.3 14.9% 1.8% 4.4 5.1 5.4 8.0% 2.3%
Operating leases 36.8 45.4 42.4 41.2 3.8% 19.4% 35.2 39.0 40.7 -0.4% 18.9%Property payments 9.5 11.7 10.1 10.7 4.1% 4.9% 12.6 12.3 13.0 6.6% 5.9%Travel and subsistence 13.2 16.9 16.9 10.9 -6.4% 6.8% 8.5 9.9 11.2 1.1% 4.9%Transfers and subsidies1 0.4 1.7 0.3 – -100.0% 0.3% – – – – – Departmental agencies and accounts
– 1.2 – – -100.0% 0.1% – – – – –
Non-profit institutions 0.3 0.1 – – -100.0% – – – – – – Households 0.1 0.3 0.2 – -100.0% 0.1% – – – – – Payments for capital assets 1.2 8.9 3.9 11.3 108.8% 3.0% 7.6 7.2 7.1 -14.4% 4.0%Machinery and equipment 1.2 8.7 1.9 4.4 55.4% 1.9% 7.2 6.8 6.6 14.7% 3.0%Software and other intangible assets
0.1 0.2 2.1 6.9 357.6% 1.1% 0.4 0.5 0.5 -59.0% 1.0%
Payments for financial assets 0.6 0.4 0.4 – -100.0% 0.2% – – – – – Total 201.2 225.3 221.9 207.9 1.1% 100.0% 194.2 206.3 219.2 1.8% 100.0%Proportion of total programme expenditure to vote expenditure
11.8% 14.4% 17.1% 8.6% – – 12.0% 11.9% 12.0% – –
1. Estimates of National Expenditure data tables are available and can be downloaded from www.treasury.gov.za. These data tables contain detailed information by goods and services, and transfers and subsidies item by programme.
Programme 2: International Affairs and Trade Programme purpose Ensure alignment between South Africa’s international activities and agreement in the field of ICT and South Africa’s foreign policy.
Objective • Advance South Africa’s national ICT interests in regional and international forums to attain partnerships for
economic growth and development by: – developing a country position on the establishment of the Brazil-Russia-India-China-South Africa group
of countries institute for future networks by March 2018 – developing a country position for the Southern African Development Community focused on the
reduction of the cost to communicate for affordable, reliable, accessible and secure ICT infrastructure by March 2018
– developing a country position for the World Telecommunication Development Conference focused on the development of the internet and digital economy by March 2018
– developing a country position for the Universal Postal Union focused on postal reform, by March 2018 – securing two partnerships for the digital economy towards ICT enterprise development, and small,
medium and micro enterprise growth and innovation by March 2018.

2017 Estimates of National Expenditure
608
Subprogrammes • International Affairs coordinates the functions and responsibilities of the department to meet South Africa’s
international ICT obligations. • ICT Trade/Partnership develops and advances the country’s interests in international trade forums through
participation in the World Trade Organisation’s ICT-related initiatives, and other international trade agreements such as the South Africa-European Union trade agreement, and bilateral agreements with counterpart countries.
Expenditure trends and estimates Table 32.9 International Affairs and Trade expenditure trends and estimates by subprogramme and economic classification Subprogramme
Audited outcome Adjusted
appropriation
Averagegrowth
rate(%)
Average: Expen-diture/
Total(%)
Medium-term expenditure estimate
Averagegrowth
rate(%)
Average:Expen-diture/
Total(%)
R million 2013/14 2014/15 2015/16 2016/17 2013/14 - 2016/17 2017/18 2018/19 2019/20 2016/17 - 2019/20 International Affairs 11.5 13.1 10.5 14.5 7.9% 29.5% 14.5 17.1 18.3 8.1% 32.7%ICT Trade/Partnership 27.0 29.4 31.0 31.2 4.9% 70.5% 33.3 33.1 34.9 3.9% 67.3%Total 38.5 42.5 41.5 45.7 5.8% 100.0% 47.8 50.2 53.2 5.2% 100.0%Change to 2016 Budget estimate
0.9 1.0 0.7 0.6
Economic classification Current payments 17.3 18.7 16.5 21.6 7.6% 44.1% 21.9 22.9 24.4 4.2% 46.2%Compensation of employees 10.3 12.6 10.6 13.9 10.7% 28.2% 14.5 15.1 16.2 5.0% 30.3%Goods and services1 7.0 6.2 5.9 7.6 2.8% 15.9% 7.4 7.9 8.3 2.7% 15.8%of which: Administrative fees 0.3 0.2 0.1 0.1 -25.9% 0.4% 0.4 0.3 0.3 39.8% 0.5%Communication 0.4 0.4 0.3 0.8 28.8% 1.1% 0.5 0.9 1.0 7.0% 1.6%Travel and subsistence 4.9 3.8 5.0 2.5 -19.5% 9.6% 3.8 2.6 2.8 3.4% 6.0%Training and development 0.1 0.2 – 0.1 -3.1% 0.2% 0.3 0.3 0.3 49.0% 0.5%Operating payments – 0.1 – 1.6 832.4% 1.0% – 1.8 1.9 5.6% 2.7%Venues and facilities 0.6 0.2 0.2 0.4 -12.5% 0.9% 0.8 0.5 0.2 -21.3% 1.0%Transfers and subsidies1 20.9 23.8 24.7 23.4 3.8% 55.1% 25.5 27.0 28.4 6.7% 53.0%Foreign governments and international organisations
20.9 23.7 24.6 23.4 3.8% 55.1% 25.5 27.0 28.4 6.7% 53.0%
Payments for capital assets 0.3 – 0.4 0.7 28.9% 0.8% 0.4 0.3 0.4 -19.5% 0.9%Machinery and equipment 0.3 – 0.4 0.7 28.9% 0.8% 0.4 0.3 0.4 -19.5% 0.9%Total 38.5 42.5 41.5 45.7 5.8% 100.0% 47.8 50.2 53.2 5.2% 100.0%Proportion of total programme expenditure to vote expenditure
2.3% 2.7% 3.2% 1.9% – – 3.0% 2.9% 2.9% – –
Details of selected transfers and subsidies Foreign governments and international organisations
Current 20.9 23.7 24.6 23.4 3.8% 55.1% 25.5 27.0 28.4 6.7% 53.0%Universal Postal Union 4.7 5.3 5.4 5.0 2.2% 12.1% 5.2 5.5 5.8 5.5% 11.0%International Telecommunications Union
14.2 16.2 16.5 15.5 3.0% 37.2% 16.3 17.3 18.2 5.5% 34.2%
African Telecommunications Union 0.9 0.9 0.9 1.0 6.8% 2.2% 1.1 1.2 1.2 5.5% 2.3%Pan-African Postal Union 0.8 0.9 1.1 1.0 8.2% 2.2% 1.0 1.1 1.1 5.5% 2.1%Organisation for Economic Cooperation and Development
0.4 – 0.2 0.5 3.3% 0.6% 0.5 0.5 0.5 5.5% 1.0%
Commonwealth Telecommunications Organisation
– 0.4 0.4 0.4 – 0.7% 0.4 0.4 0.5 5.5% 0.9%
Dona Foundation – – – – – – 1.0 1.0 1.0 – 1.5%1. Estimates of National Expenditure data tables are available and can be downloaded from www.treasury.gov.za. These data tables contain detailed information by goods and services, and
transfers and subsidies item by programme.
Programme 3: Policy, Research and Capacity Development Programme purpose Develop ICT policies and legislation that support the development of an ICT sector that creates favourable conditions for accelerated and shared economic growth. Develop strategies that increase the adoption and use of ICT by the majority of the South African population to bridge the digital divide.

Vote 32: Telecommunication and Postal Services
609
Objectives • Develop and implement ICT Policy and legislation aimed at improving access to and the affordability of ICT
by: – developing, amending and implementing draft ICT legislation in line with the 2016 White Paper on
National Integrated ICT Policy by March 2020 – implementing, monitoring and reviewing the cost to communicate programme implementation plan by
March 2020. • Develop a national e-strategy that will give priority to e-government services by:
– establishing a national e-skills council by March 2019 – establishing the rapid deployment coordinating committee by March 2019 – launching the national ICT forum by March 2018 – facilitating, monitoring and reviewing the implementation of the national e-strategy by March 2020 – facilitating, monitoring and evaluating the implementation of the integrated e-services programme by
March 2020.
Subprogrammes • ICT Policy Development drafts legislation, regulations, policy and guidelines that govern the
telecommunications, postal and IT sectors, to ensure broad-based economic development within the ICT sector.
• Economic and Market Analysis conducts economic analyses of the telecommunications, postal and IT sectors to determine trends and make growth projections. This subprogramme also undertakes market research to explore areas that require policy intervention, and is responsible for the reduction of the cost to communicate.
• Research is responsible for understanding the ICT landscape and delivering a national ICT strategy. • Information Society Development supports the effective and efficient functioning of the information society;
and the development of institutional mechanisms such as the interministerial committee on information society and development, the information society and development intergovernmental relations forum, the forum of South African directors general for information society and development, and the intergovernmental relations forum technical committee.
• Capacity Development provides direction for the advancement of e-skills graduates and society in general to function effectively in the emerging information society.
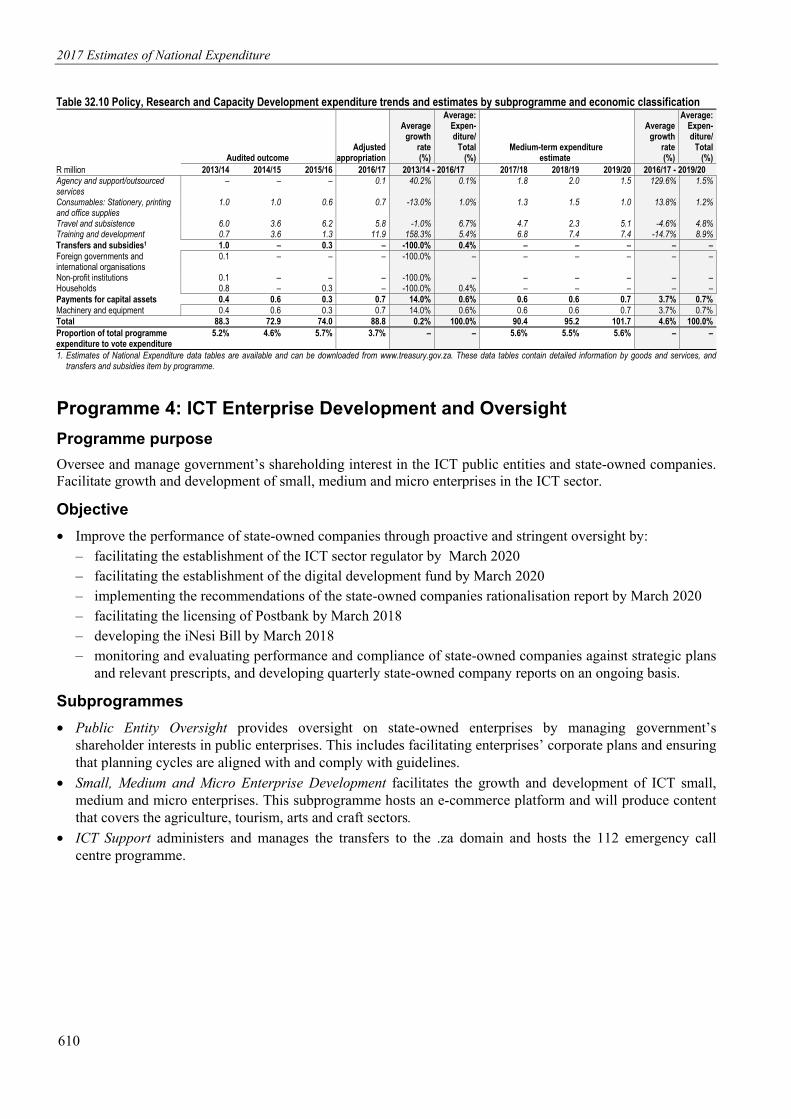
Expenditure trends and estimates Table 32.10 Policy, Research and Capacity Development expenditure trends and estimates by subprogramme and economic classificationSubprogramme
Audited outcome Adjusted
appropriation
Averagegrowth
rate(%)
Average: Expen-diture/
Total(%)
Medium-term expenditure estimate
Averagegrowth
rate(%)
Average:Expen-diture/
Total(%)
R million 2013/14 2014/15 2015/16 2016/17 2013/14 - 2016/17 2017/18 2018/19 2019/20 2016/17 - 2019/20 ICT Policy Development 21.8 15.0 14.4 15.5 -10.8% 20.6% 15.3 16.3 17.3 3.7% 17.1%Economic and Market Analysis 8.3 6.2 4.4 4.9 -16.4% 7.3% 5.4 5.7 6.1 7.9% 5.9%Research 6.0 4.0 4.2 6.9 4.7% 6.5% 8.4 8.9 9.4 11.1% 8.9%Information Society Development 43.3 35.1 41.4 51.7 6.0% 52.9% 53.4 55.5 58.6 4.3% 58.3%Capacity Development 8.8 12.6 9.6 9.9 4.0% 12.6% 8.0 8.8 10.2 1.1% 9.8%Total 88.3 72.9 74.0 88.8 0.2% 100.0% 90.4 95.2 101.7 4.6% 100.0%Change to 2016 Budget estimate
(6.8) (3.6) (1.2) (1.2)
Economic classification Current payments 86.8 72.2 73.4 88.1 0.5% 99.0% 89.8 94.6 100.9 4.6% 99.3%Compensation of employees 52.1 45.3 49.4 55.7 2.3% 62.5% 56.2 58.8 63.2 4.3% 62.2%Goods and services1 34.7 26.9 24.0 32.4 -2.3% 36.4% 33.5 35.9 37.7 5.2% 37.1%of which: Communication 1.5 1.3 1.3 1.7 2.7% 1.8% 2.3 2.2 2.4 13.8% 2.3%Consultants: Business and advisory services
20.3 13.2 10.1 5.4 -35.6% 15.1% 13.3 17.0 17.1 46.7% 14.0%
2017 Estimates of National Expenditure
610
Table 32.10 Policy, Research and Capacity Development expenditure trends and estimates by subprogramme and economic classification
Audited outcome Adjusted
appropriation
Averagegrowth
rate(%)
Average: Expen-diture/
Total(%)
Medium-term expenditure estimate
Averagegrowth
rate(%)
Average:Expen-diture/
Total(%)
R million 2013/14 2014/15 2015/16 2016/17 2013/14 - 2016/17 2017/18 2018/19 2019/20 2016/17 - 2019/20 Agency and support/outsourced services
– – – 0.1 40.2% 0.1% 1.8 2.0 1.5 129.6% 1.5%
Consumables: Stationery, printing and office supplies
1.0 1.0 0.6 0.7 -13.0% 1.0% 1.3 1.5 1.0 13.8% 1.2%
Travel and subsistence 6.0 3.6 6.2 5.8 -1.0% 6.7% 4.7 2.3 5.1 -4.6% 4.8%Training and development 0.7 3.6 1.3 11.9 158.3% 5.4% 6.8 7.4 7.4 -14.7% 8.9%Transfers and subsidies1 1.0 – 0.3 – -100.0% 0.4% – – – – – Foreign governments and international organisations
0.1 – – – -100.0% – – – – – –
Non-profit institutions 0.1 – – – -100.0% – – – – – – Households 0.8 – 0.3 – -100.0% 0.4% – – – – – Payments for capital assets 0.4 0.6 0.3 0.7 14.0% 0.6% 0.6 0.6 0.7 3.7% 0.7%Machinery and equipment 0.4 0.6 0.3 0.7 14.0% 0.6% 0.6 0.6 0.7 3.7% 0.7%Total 88.3 72.9 74.0 88.8 0.2% 100.0% 90.4 95.2 101.7 4.6% 100.0%Proportion of total programme expenditure to vote expenditure
5.2% 4.6% 5.7% 3.7% – – 5.6% 5.5% 5.6% – –
1. Estimates of National Expenditure data tables are available and can be downloaded from www.treasury.gov.za. These data tables contain detailed information by goods and services, and transfers and subsidies item by programme.
Programme 4: ICT Enterprise Development and Oversight Programme purpose Oversee and manage government’s shareholding interest in the ICT public entities and state-owned companies. Facilitate growth and development of small, medium and micro enterprises in the ICT sector.
Objective • Improve the performance of state-owned companies through proactive and stringent oversight by:
– facilitating the establishment of the ICT sector regulator by March 2020 – facilitating the establishment of the digital development fund by March 2020 – implementing the recommendations of the state-owned companies rationalisation report by March 2020 – facilitating the licensing of Postbank by March 2018 – developing the iNesi Bill by March 2018 – monitoring and evaluating performance and compliance of state-owned companies against strategic plans
and relevant prescripts, and developing quarterly state-owned company reports on an ongoing basis.
Subprogrammes • Public Entity Oversight provides oversight on state-owned enterprises by managing government’s
shareholder interests in public enterprises. This includes facilitating enterprises’ corporate plans and ensuring that planning cycles are aligned with and comply with guidelines.
• Small, Medium and Micro Enterprise Development facilitates the growth and development of ICT small, medium and micro enterprises. This subprogramme hosts an e-commerce platform and will produce content that covers the agriculture, tourism, arts and craft sectors.
• ICT Support administers and manages the transfers to the .za domain and hosts the 112 emergency call centre programme.

Vote 32: Telecommunication and Postal Services
611
Expenditure trends and estimates Table 32.11 ICT Enterprise Development and Oversight expenditure trends and estimates by subprogramme and economic classificationSubprogramme
Audited outcome Adjusted
appropriation
Averagegrowth
rate(%)
Average: Expen-diture/
Total(%)
Medium-term expenditure estimate
Averagegrowth
rate(%)
Average:Expen-diture/
Total(%)
R million 2013/14 2014/15 2015/16 2016/17 2013/14 - 2016/17 2017/18 2018/19 2019/20 2016/17 - 2019/20 Public Entity Oversight 163.0 239.5 480.1 873.0 74.9% 97.6% 238.6 251.9 266.5 -32.7% 96.8%Small, Medium and Micro Enterprise Development 7.1 2.1 2.5 5.8 -6.8% 1.0% 4.8 5.1 5.3 -2.4% 1.2%ICT Support 6.4 6.0 6.3 7.8 7.1% 1.5% 7.7 8.2 8.7 3.5% 1.9%Total 176.5 247.6 489.0 886.6 71.3% 100.0% 251.1 265.2 280.5 -31.9% 100.0%Change to 2016 Budget estimate
(5.2) (9.1) (14.4) (15.4)
Economic classification Current payments 20.6 43.8 21.9 34.1 18.3% 6.7% 33.8 35.9 38.5 4.1% 8.4%Compensation of employees 9.5 16.9 17.8 26.1 40.1% 3.9% 27.2 28.0 30.1 4.9% 6.6%Goods and services1 11.1 26.9 4.0 8.0 -10.3% 2.8% 6.6 7.9 8.4 1.5% 1.8%of which: Bursaries: Employees – – 0.1 – -100.0% – 0.4 0.4 0.3 – 0.1%Communication 0.3 0.3 0.4 0.4 12.6% 0.1% 0.6 0.6 0.7 15.8% 0.1%Consultants: Business and advisory services
1.9 1.0 0.8 2.3 6.3% 0.3% 2.1 2.5 2.8 8.1% 0.6%
Consumables: Stationery, printing and office supplies
0.3 0.3 0.2 0.5 18.8% 0.1% 0.3 0.3 0.3 -14.6% 0.1%
Travel and subsistence 1.3 1.5 1.5 2.5 24.6% 0.4% 1.8 1.9 1.8 -9.9% 0.5%Training and development 0.1 0.1 – 0.4 76.6% – 0.7 0.8 0.9 34.3% 0.2%Transfers and subsidies1 155.9 203.2 466.6 201.4 8.9% 57.1% 216.1 228.6 241.4 6.2% 52.7%Departmental agencies and accounts
155.9 153.2 351.4 201.4 8.9% 47.9% 216.1 228.6 241.4 6.2% 52.7%
Public corporations and private enterprises
– 50.0 115.1 – – 9.2% – – – – –
Households – – 0.1 – -100.0% – – – – – – Payments for capital assets 0.1 0.6 0.4 1.1 154.3% 0.1% 1.3 0.6 0.7 -16.7% 0.2%Machinery and equipment 0.1 0.6 0.4 1.1 154.3% 0.1% 1.3 0.6 0.7 -16.7% 0.2%Payments for financial assets – – 0.0 650.0 – 36.1% – – – -100.0% 38.6%Total 176.5 247.6 489.0 886.6 71.3% 100.0% 251.1 265.2 280.5 -31.9% 100.0%Proportion of total programme expenditure to vote expenditure
10.4% 15.8% 37.6% 36.7% – – 15.6% 15.3% 15.3% – –
Details of selected transfers and subsidies Departmental agencies and accounts
Departmental agencies (non-business entities)
Current 155.9 153.2 351.4 201.4 8.9% 47.9% 216.1 228.6 241.4 6.2% 52.7%National Electronic Media Institute of South Africa
50.7 37.9 36.6 77.2 15.0% 11.2% 85.8 90.8 95.8 7.5% 20.8%
Universal Service and Access Agency of South Africa
60.1 65.4 262.4 69.0 4.7% 25.4% 75.7 80.1 84.6 7.0% 18.4%
Universal Service and Access Fund 45.0 50.0 52.4 55.2 7.0% 11.3% 54.6 57.8 61.0 3.4% 13.6%Public corporations and private enterprises Public corporations Other transfers to public corporations Current – 50.0 115.1 – – 9.2% – – – – – South African Post Office – 50.0 115.1 – – 9.2% – – – – – 1. Estimates of National Expenditure data tables are available and can be downloaded from www.treasury.gov.za. These data tables contain detailed information by goods and services, and
transfers and subsidies item by programme.
Programme 5: ICT Infrastructure Support Programme purpose Promote investment in robust, reliable, secure and affordable ICT infrastructure that supports the provision of a multiplicity of applications and services.
Objective • Coordinate broadband connectivity through contributing to the achievement of 100 per cent population
coverage by: – managing the rollout of phase 1 of the broadband connectivity implementation plan towards connecting
2 700 identified sites by March 2018
2017 Estimates of National Expenditure
612
– establishing a cybersecurity hub by March 2020.
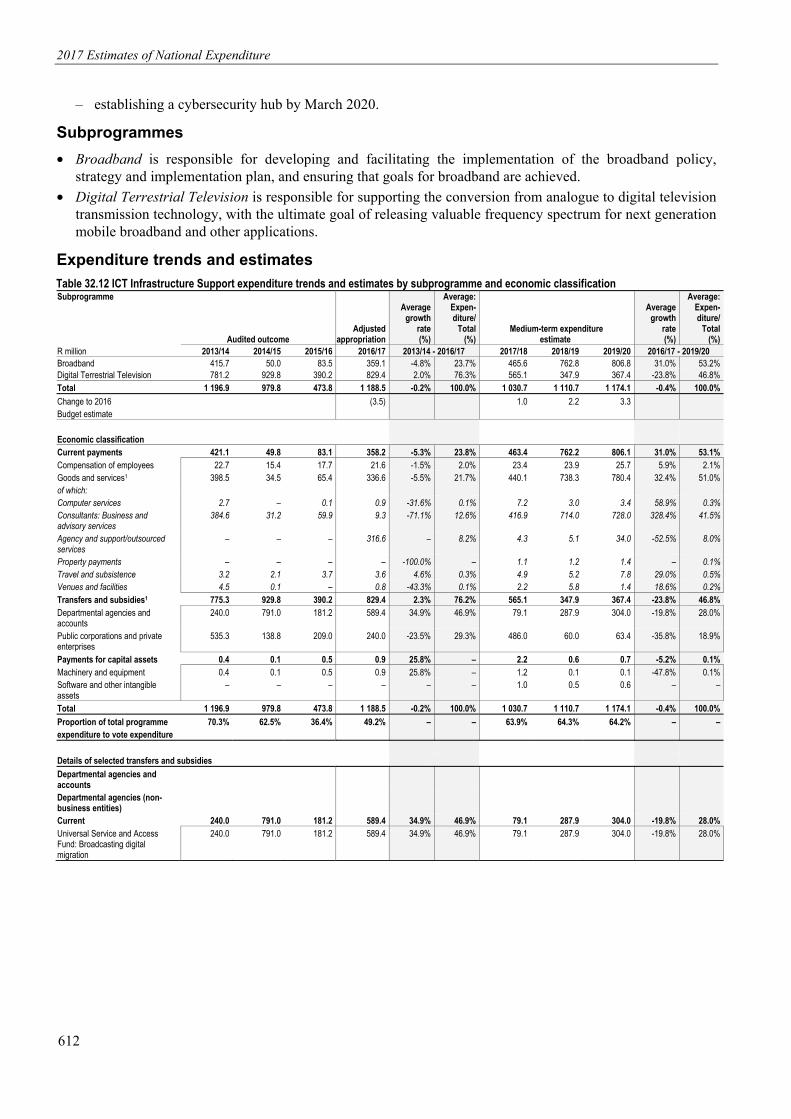
Subprogrammes • Broadband is responsible for developing and facilitating the implementation of the broadband policy,
strategy and implementation plan, and ensuring that goals for broadband are achieved. • Digital Terrestrial Television is responsible for supporting the conversion from analogue to digital television
transmission technology, with the ultimate goal of releasing valuable frequency spectrum for next generation mobile broadband and other applications.
Expenditure trends and estimates Table 32.12 ICT Infrastructure Support expenditure trends and estimates by subprogramme and economic classification Subprogramme
Audited outcome Adjusted
appropriation
Averagegrowth
rate(%)
Average: Expen-diture/
Total(%)
Medium-term expenditure estimate
Averagegrowth
rate(%)
Average:Expen-diture/
Total(%)
R million 2013/14 2014/15 2015/16 2016/17 2013/14 - 2016/17 2017/18 2018/19 2019/20 2016/17 - 2019/20 Broadband 415.7 50.0 83.5 359.1 -4.8% 23.7% 465.6 762.8 806.8 31.0% 53.2%Digital Terrestrial Television 781.2 929.8 390.2 829.4 2.0% 76.3% 565.1 347.9 367.4 -23.8% 46.8%Total 1 196.9 979.8 473.8 1 188.5 -0.2% 100.0% 1 030.7 1 110.7 1 174.1 -0.4% 100.0%Change to 2016 Budget estimate
(3.5) 1.0 2.2 3.3
Economic classification Current payments 421.1 49.8 83.1 358.2 -5.3% 23.8% 463.4 762.2 806.1 31.0% 53.1%Compensation of employees 22.7 15.4 17.7 21.6 -1.5% 2.0% 23.4 23.9 25.7 5.9% 2.1%Goods and services1 398.5 34.5 65.4 336.6 -5.5% 21.7% 440.1 738.3 780.4 32.4% 51.0%of which: Computer services 2.7 – 0.1 0.9 -31.6% 0.1% 7.2 3.0 3.4 58.9% 0.3%Consultants: Business and advisory services
384.6 31.2 59.9 9.3 -71.1% 12.6% 416.9 714.0 728.0 328.4% 41.5%
Agency and support/outsourced services
– – – 316.6 – 8.2% 4.3 5.1 34.0 -52.5% 8.0%
Property payments – – – – -100.0% – 1.1 1.2 1.4 – 0.1%Travel and subsistence 3.2 2.1 3.7 3.6 4.6% 0.3% 4.9 5.2 7.8 29.0% 0.5%Venues and facilities 4.5 0.1 – 0.8 -43.3% 0.1% 2.2 5.8 1.4 18.6% 0.2%Transfers and subsidies1 775.3 929.8 390.2 829.4 2.3% 76.2% 565.1 347.9 367.4 -23.8% 46.8%Departmental agencies and accounts
240.0 791.0 181.2 589.4 34.9% 46.9% 79.1 287.9 304.0 -19.8% 28.0%
Public corporations and private enterprises
535.3 138.8 209.0 240.0 -23.5% 29.3% 486.0 60.0 63.4 -35.8% 18.9%
Payments for capital assets 0.4 0.1 0.5 0.9 25.8% – 2.2 0.6 0.7 -5.2% 0.1%Machinery and equipment 0.4 0.1 0.5 0.9 25.8% – 1.2 0.1 0.1 -47.8% 0.1%Software and other intangible assets
– – – – – – 1.0 0.5 0.6 – –
Total 1 196.9 979.8 473.8 1 188.5 -0.2% 100.0% 1 030.7 1 110.7 1 174.1 -0.4% 100.0%Proportion of total programme expenditure to vote expenditure
70.3% 62.5% 36.4% 49.2% – – 63.9% 64.3% 64.2% – –
Details of selected transfers and subsidies Departmental agencies and accounts
Departmental agencies (non-business entities)
Current 240.0 791.0 181.2 589.4 34.9% 46.9% 79.1 287.9 304.0 -19.8% 28.0%Universal Service and Access Fund: Broadcasting digital migration
240.0 791.0 181.2 589.4 34.9% 46.9% 79.1 287.9 304.0 -19.8% 28.0%
Vote 32: Telecommunication and Postal Services
613
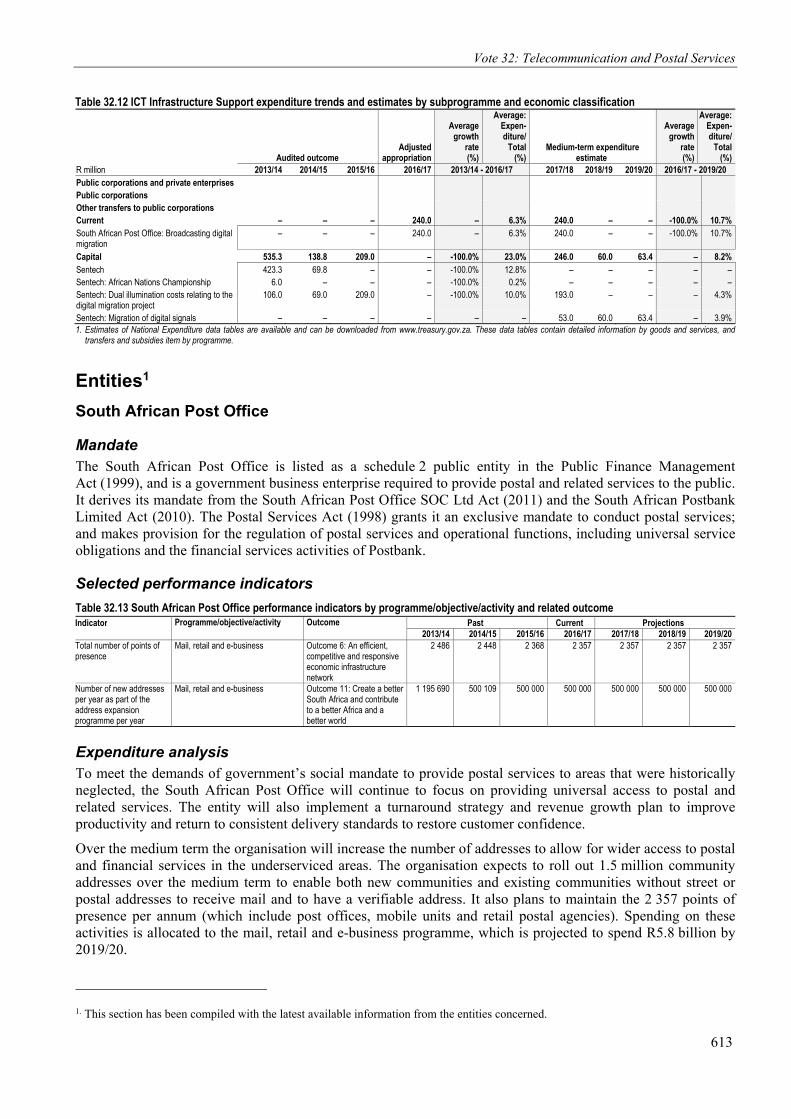
Table 32.12 ICT Infrastructure Support expenditure trends and estimates by subprogramme and economic classification
Audited outcome Adjusted
appropriation
Averagegrowth
rate(%)
Average: Expen-diture/
Total(%)
Medium-term expenditure estimate
Averagegrowth
rate(%)
Average:Expen-diture/
Total(%)
R million 2013/14 2014/15 2015/16 2016/17 2013/14 - 2016/17 2017/18 2018/19 2019/20 2016/17 - 2019/20 Public corporations and private enterprises Public corporations Other transfers to public corporations Current – – – 240.0 – 6.3% 240.0 – – -100.0% 10.7%South African Post Office: Broadcasting digital migration
– – – 240.0 – 6.3% 240.0 – – -100.0% 10.7%
Capital 535.3 138.8 209.0 – -100.0% 23.0% 246.0 60.0 63.4 – 8.2%Sentech 423.3 69.8 – – -100.0% 12.8% – – – – – Sentech: African Nations Championship 6.0 – – – -100.0% 0.2% – – – – – Sentech: Dual illumination costs relating to the digital migration project
106.0 69.0 209.0 – -100.0% 10.0% 193.0 – – – 4.3%
Sentech: Migration of digital signals – – – – – – 53.0 60.0 63.4 – 3.9%1. Estimates of National Expenditure data tables are available and can be downloaded from www.treasury.gov.za. These data tables contain detailed information by goods and services, and
transfers and subsidies item by programme.
Entities1 South African Post Office
Mandate The South African Post Office is listed as a schedule 2 public entity in the Public Finance Management Act (1999), and is a government business enterprise required to provide postal and related services to the public. It derives its mandate from the South African Post Office SOC Ltd Act (2011) and the South African Postbank Limited Act (2010). The Postal Services Act (1998) grants it an exclusive mandate to conduct postal services; and makes provision for the regulation of postal services and operational functions, including universal service obligations and the financial services activities of Postbank.
Selected performance indicators Table 32.13 South African Post Office performance indicators by programme/objective/activity and related outcome Indicator Programme/objective/activity Outcome Past Current Projections
2013/14 2014/15 2015/16 2016/17 2017/18 2018/19 2019/20Total number of points of presence
Mail, retail and e-business Outcome 6: An efficient, competitive and responsive economic infrastructure network
2 486 2 448 2 368 2 357 2 357 2 357 2 357
Number of new addresses per year as part of the address expansion programme per year
Mail, retail and e-business Outcome 11: Create a better South Africa and contribute to a better Africa and a better world
1 195 690 500 109 500 000 500 000 500 000 500 000 500 000
Expenditure analysis To meet the demands of government’s social mandate to provide postal services to areas that were historically neglected, the South African Post Office will continue to focus on providing universal access to postal and related services. The entity will also implement a turnaround strategy and revenue growth plan to improve productivity and return to consistent delivery standards to restore customer confidence.
Over the medium term the organisation will increase the number of addresses to allow for wider access to postal and financial services in the underserviced areas. The organisation expects to roll out 1.5 million community addresses over the medium term to enable both new communities and existing communities without street or postal addresses to receive mail and to have a verifiable address. It also plans to maintain the 2 357 points of presence per annum (which include post offices, mobile units and retail postal agencies). Spending on these activities is allocated to the mail, retail and e-business programme, which is projected to spend R5.8 billion by 2019/20.
1. This section has been compiled with the latest available information from the entities concerned.
2017 Estimates of National Expenditure
614
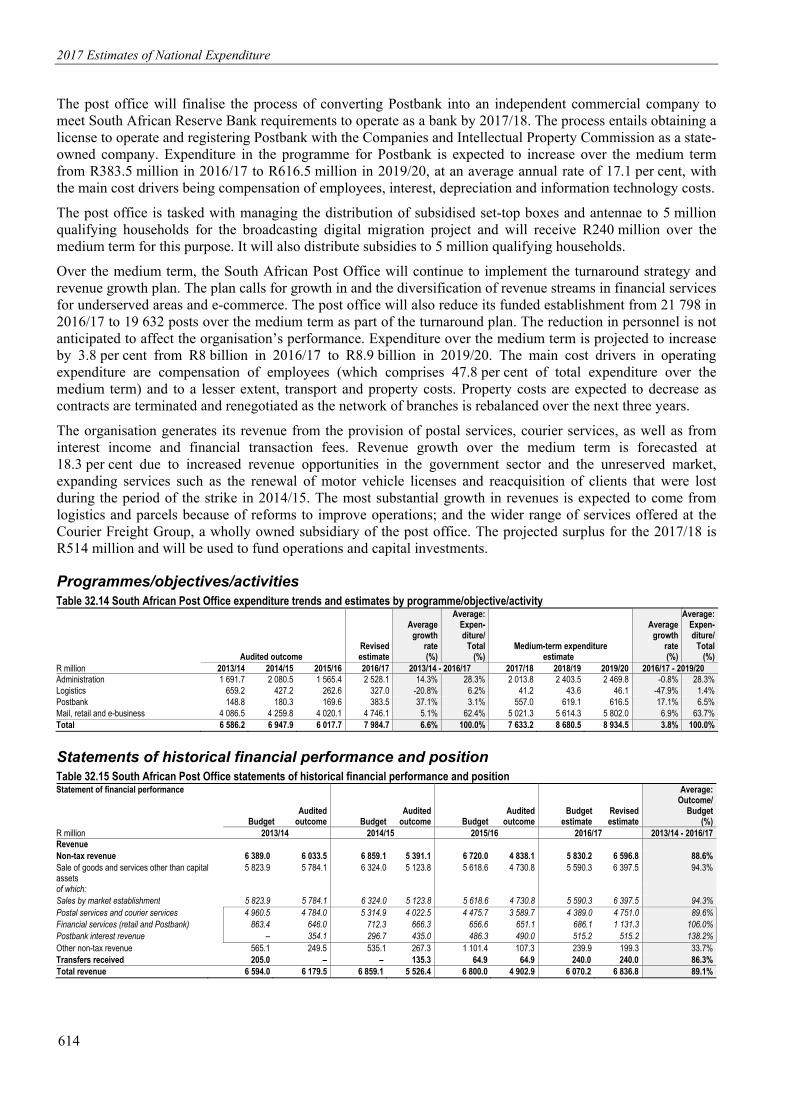
The post office will finalise the process of converting Postbank into an independent commercial company to meet South African Reserve Bank requirements to operate as a bank by 2017/18. The process entails obtaining a license to operate and registering Postbank with the Companies and Intellectual Property Commission as a state-owned company. Expenditure in the programme for Postbank is expected to increase over the medium term from R383.5 million in 2016/17 to R616.5 million in 2019/20, at an average annual rate of 17.1 per cent, with the main cost drivers being compensation of employees, interest, depreciation and information technology costs.
The post office is tasked with managing the distribution of subsidised set-top boxes and antennae to 5 million qualifying households for the broadcasting digital migration project and will receive R240 million over the medium term for this purpose. It will also distribute subsidies to 5 million qualifying households.
Over the medium term, the South African Post Office will continue to implement the turnaround strategy and revenue growth plan. The plan calls for growth in and the diversification of revenue streams in financial services for underserved areas and e-commerce. The post office will also reduce its funded establishment from 21 798 in 2016/17 to 19 632 posts over the medium term as part of the turnaround plan. The reduction in personnel is not anticipated to affect the organisation’s performance. Expenditure over the medium term is projected to increase by 3.8 per cent from R8 billion in 2016/17 to R8.9 billion in 2019/20. The main cost drivers in operating expenditure are compensation of employees (which comprises 47.8 per cent of total expenditure over the medium term) and to a lesser extent, transport and property costs. Property costs are expected to decrease as contracts are terminated and renegotiated as the network of branches is rebalanced over the next three years.
The organisation generates its revenue from the provision of postal services, courier services, as well as from interest income and financial transaction fees. Revenue growth over the medium term is forecasted at 18.3 per cent due to increased revenue opportunities in the government sector and the unreserved market, expanding services such as the renewal of motor vehicle licenses and reacquisition of clients that were lost during the period of the strike in 2014/15. The most substantial growth in revenues is expected to come from logistics and parcels because of reforms to improve operations; and the wider range of services offered at the Courier Freight Group, a wholly owned subsidiary of the post office. The projected surplus for the 2017/18 is R514 million and will be used to fund operations and capital investments.
Programmes/objectives/activities Table 32.14 South African Post Office expenditure trends and estimates by programme/objective/activity
Audited outcome Revisedestimate
Averagegrowth
rate(%)
Average:Expen-diture/
Total(%)
Medium-term expenditure estimate
Averagegrowth
rate(%)
Average:Expen-diture/
Total(%)
R million 2013/14 2014/15 2015/16 2016/17 2013/14 - 2016/17 2017/18 2018/19 2019/20 2016/17 - 2019/20 Administration 1 691.7 2 080.5 1 565.4 2 528.1 14.3% 28.3% 2 013.8 2 403.5 2 469.8 -0.8% 28.3%Logistics 659.2 427.2 262.6 327.0 -20.8% 6.2% 41.2 43.6 46.1 -47.9% 1.4%Postbank 148.8 180.3 169.6 383.5 37.1% 3.1% 557.0 619.1 616.5 17.1% 6.5%Mail, retail and e-business 4 086.5 4 259.8 4 020.1 4 746.1 5.1% 62.4% 5 021.3 5 614.3 5 802.0 6.9% 63.7%Total 6 586.2 6 947.9 6 017.7 7 984.7 6.6% 100.0% 7 633.2 8 680.5 8 934.5 3.8% 100.0%
Statements of historical financial performance and position Table 32.15 South African Post Office statements of historical financial performance and positionStatement of financial performance
Budget Audited outcome Budget
Audited outcome Budget
Audited outcome
Budget estimate
Revised estimate
Average:Outcome/
Budget (%)
R million 2013/14 2014/15 2015/16 2016/17 2013/14 - 2016/17 Revenue Non-tax revenue 6 389.0 6 033.5 6 859.1 5 391.1 6 720.0 4 838.1 5 830.2 6 596.8 88.6%Sale of goods and services other than capital assets
5 823.9 5 784.1 6 324.0 5 123.8 5 618.6 4 730.8 5 590.3 6 397.5 94.3%
of which: Sales by market establishment 5 823.9 5 784.1 6 324.0 5 123.8 5 618.6 4 730.8 5 590.3 6 397.5 94.3%Postal services and courier services 4 960.5 4 784.0 5 314.9 4 022.5 4 475.7 3 589.7 4 389.0 4 751.0 89.6%Financial services (retail and Postbank) 863.4 646.0 712.3 666.3 656.6 651.1 686.1 1 131.3 106.0%Postbank interest revenue – 354.1 296.7 435.0 486.3 490.0 515.2 515.2 138.2%Other non-tax revenue 565.1 249.5 535.1 267.3 1 101.4 107.3 239.9 199.3 33.7%Transfers received 205.0 – – 135.3 64.9 64.9 240.0 240.0 86.3%Total revenue 6 594.0 6 179.5 6 859.1 5 526.4 6 800.0 4 902.9 6 070.2 6 836.8 89.1%

Vote 32: Telecommunication and Postal Services
615
Table 32.15 South African Post Office statements of historical financial performance and positionStatement of financial performance
Budget Audited outcome Budget
Audited outcome Budget
Audited outcome
Budget estimate
Revisedestimate
Average:Outcome/
Budget (%)
R million 2013/14 2014/15 2015/16 2016/17 2013/14 - 2016/17 Expenses Current expenses 6 599.4 6 585.3 7 222.0 6 388.9 6 902.5 6 017.6 6 211.4 7 984.7 100.2%Compensation of employees 3 496.9 3 537.4 4 045.6 3 634.1 4 152.8 3 476.2 3 305.2 3 914.2 97.1%Goods and services 2 849.7 2 804.9 2 905.3 2 528.0 2 505.9 2 209.6 2 502.8 3 561.2 103.2%Depreciation 175.9 166.9 199.1 148.9 151.8 165.2 162.1 204.5 99.5%Interest, dividends and rent on land 76.9 76.1 71.9 77.9 92.0 166.7 241.3 304.8 129.7%Total expenses 6 599.4 6 586.2 7 222.3 6 947.9 6 902.5 6 017.7 6 211.4 7 984.7 102.2%Surplus/(Deficit) (5.0) (407.0) (363.0) (1 421.0) (102.0) (1 115.0) (141.0) (1 148.0)
Statement of financial position Carrying value of assets 1 366.4 1 466.9 1 345.9 1 419.8 2 050.1 1 240.2 1 412.3 1 962.6 98.6%of which: Acquisition of assets (176.4) (192.4) (263.8) (121.9) (530.2) (45.8) (204.4) (900.0) 107.3%Investments 5 788.3 4 327.1 5 580.8 4 521.8 4 589.3 5 509.8 5 363.3 5 502.4 93.1%Inventory 66.7 77.4 48.8 67.8 69.8 54.8 61.2 74.8 111.4%Receivables and prepayments 805.3 574.5 584.4 372.1 522.3 426.3 505.2 574.6 80.6%Cash and cash equivalents 2 214.5 4 050.1 2 876.8 3 413.9 4 342.0 2 885.0 3 708.4 2 790.9 100.0%Taxation 266.5 800.7 379.9 – 735.9 – – – 57.9%Total assets 10 507.7 11 296.6 10 816.6 9 795.6 12 309.5 10 116.1 11 050.5 10 905.2 94.2%Accumulated surplus/(deficit) 1 544.0 1 589.2 937.2 53.4 (1.2) (1 079.0) (1 027.8) (2 274.5) -117.8%Capital and reserves 951.6 746.5 1 450.9 758.7 1 806.6 937.0 1 584.7 1 578.1 69.4%Capital reserve fund – 85.3 – – – – – – – Borrowings – 350.4 – 78.7 1 200.0 1 229.4 1 520.0 3 850.2 202.5%Finance lease 43.2 4.0 80.6 3.7 4.5 6.1 3.2 – 10.6%Deferred income 333.9 284.8 340.9 269.0 346.6 258.6 268.3 266.1 83.6%Trade and other payables 6 410.8 6 284.6 6 812.3 7 030.8 7 264.9 7 190.8 7 120.6 5 825.2 95.4%Taxation 18.5 244.3 0.9 – – – – – 1 258.2%Provisions 1 205.7 1 707.4 1 193.8 1 601.1 1 688.2 1 573.1 1 581.4 1 660.1 115.4%Total equity and liabilities 10 507.7 11 296.6 10 816.6 9 795.6 12 309.5 10 116.1 11 050.5 10 905.2 –
Statements of estimates of financial performance and position Table 32.16 South African Post Office statements of estimates of financial performance and positionStatement of financial performance
Revised estimate
Averagegrowth
rate(%)
Average:Expen-diture/
Total(%) Medium-term estimate
Averagegrowth
rate(%)
Average:Expen-diture/
Total(%)
R million 2016/17 2013/14 - 2016/17 2017/18 2018/19 2019/20 2016/17 - 2019/20 Revenue Non-tax revenue 6 596.8 3.0% 97.6% 7 907.3 11 011.8 11 324.0 19.7% 98.4%Sale of goods and services other than capital assets 6 397.5 3.4% 94.1% 7 603.7 10 688.9 10 992.5 19.8% 95.3%of which: Sales by market establishment 6 397.5 3.4% 94.1% 7 603.7 10 688.9 10 992.5 19.8% 95.3%Postal services and courier services 4 751.0 -0.2% 73.2% 5 302.1 6 820.3 6 970.0 19.8% 49.0%Financial services (retail and Postbank) 1 131.3 20.5% 13.1% 1 621.0 3 097.1 3 152.3 19.8% 49.0%Postbank interest revenue 515.2 13.3% 7.8% 680.6 771.5 870.2 19.8% 49.0%Other non-tax revenue 199.3 -7.2% 3.5% 303.7 322.9 331.4 18.5% 3.1%Transfers received 240.0 – 1.8% 240.0 – – -100.0% 1.6%Total revenue 6 836.8 3.4% 100.0% 8 147.3 11 011.8 11 324.0 18.3% 100.0%Expenses Current expenses 7 984.7 6.6% 98.0% 7 633.2 8 680.5 8 934.5 3.8% 126.3%Compensation of employees 3 914.2 3.4% 53.2% 3 738.9 3 995.9 4 230.3 2.6% 47.8%Goods and services 3 561.2 8.3% 40.1% 3 259.8 3 918.9 3 875.4 2.9% 44.0%Depreciation 204.5 7.0% 2.5% 152.0 245.0 267.2 9.3% 2.6%Interest, dividends and rent on land 304.8 58.8% 2.2% 482.5 520.8 561.5 22.6% 5.6%Total expenses 7 984.7 6.6% 100.0% 7 633.2 8 680.5 8 934.5 3.8% 100.0%Surplus/(Deficit) (1 148.0) – – 514.0 2 331.0 2 389.0 -227.7% –
Statement of financial position Carrying value of assets 1 962.6 10.2% 14.4% 1 525.9 1 798.5 1 982.4 0.3% 13.7%of which: Acquisition of assets (900.0) 67.2% -2.9% (513.1) (610.4) (593.6) -13.0% -5.1%Investments 5 502.4 8.3% 47.3% 5 877.0 6 220.9 6 697.8 6.8% 45.4%Inventory 74.8 -1.1% 0.7% 61.6 65.2 69.2 -2.6% 0.5%Receivables and prepayments 574.6 0.0% 4.6% 621.5 841.0 864.7 14.6% 5.3%Cash and cash equivalents 2 790.9 -11.7% 31.2% 3 928.9 5 838.5 7 105.3 36.5% 35.1%Total assets 10 905.2 -1.2% 100.0% 12 014.9 14 764.1 16 719.4 15.3% 100.0%

2017 Estimates of National Expenditure
616
Table 32.16 South African Post Office statements of estimates of financial performance and position
Revised estimate
Averagegrowth
rate(%)
Average:Expen-diture/
Total(%) Medium-term estimate
Averagegrowth
rate(%)
Average:Expen-diture/
Total(%)
R million 2016/17 2013/14 - 2016/17 2017/18 2018/19 2019/20 2016/17 - 2019/20 Accumulated surplus/(deficit) (2 274.5) -212.7% – (1 704.0) 627.3 3 016.8 -209.9% -3.2%Capital and reserves 1 578.1 28.3% – 1 580.0 1 573.7 1 568.1 -0.2% 11.9%Borrowings 3 850.2 122.3% – 3 700.0 3 700.0 2 700.0 -11.2% 26.8%Finance lease – -100.0% – 6.9 7.3 7.8 – 0.0%Deferred income 266.1 -2.2% – 296.1 319.8 345.4 9.1% 2.3%Trade and other payables 5 825.2 -2.5% – 6 339.0 6 605.7 7 007.4 6.4% 48.2%Provisions 1 660.1 -0.9% – 1 796.9 1 930.3 2 074.0 7.7% 13.9%Total equity and liabilities 10 905.2 -1.2% – 12 014.9 14 764.1 16 719.4 15.3% 100.0%
Personnel information Table 32.17 South African Post Office personnel numbers and cost by salary level
Number of posts estimated for 31 March 2017 Number and cost1 of personnel posts filled / planned for on funded establishment Number
Number of
funded posts
Number of
posts on approved
establishment Actual Revised estimate Medium-term expenditure estimate
Averagegrowth
rate(%)
Average:Salary
level/Total(%)
2015/16 2016/17 2017/18 2018/19 2019/20 2016/17 - 2019/20
South African Post Office Number Cost Unit cost Number Cost
Unit cost Number Cost
Unit cost Number Cost
Unit cost Number Cost
Unit cost
Salary level
21 798 21 798 20 781 3 476.2 0.2 21 798 3 914.2 0.2 19 632 3 738.9 0.2 19 632 3 995.9 0.2 19 632 4 230.3 0.2 2.6% 100.0%
1 – 6 13 532 13 532 12 900 1 444.5 0.1 13 532 1 633.1 0.1 12 183 1 557.3 0.1 12 183 1 670.8 0.1 12 183 1 769.8 0.1 2.7% 62.1%7 – 10 8 253 8 253 7 868 2 004.3 0.3 8 253 2 252.2 0.3 7 436 2 150.9 0.3 7 436 2 292.6 0.3 7 436 2 426.0 0.3 2.5% 37.9%13 – 16 5 5 5 9.2 1.8 5 9.7 1.9 5 10.3 2.1 5 10.9 2.2 5 11.6 2.3 6.0% 0.0%17 – 22 8 8 8 18.1 2.3 8 19.2 2.4 8 20.4 2.5 8 21.6 2.7 8 22.9 2.9 6.0% 0.0%1. Rand million.
State Information Technology Agency
Mandate The State Information Technology Agency is governed by the State Information Technology Agency Act (1998) and is listed as a schedule 3A public entity. The act mandates the agency to consolidate and coordinate government’s IT resources to achieve cost savings through economies of scale, increased delivery capabilities and enhanced interoperability of systems. It also separates the agency’s services into mandatory services, which are services that it must provide, and non-mandatory services, which are services that it may provide. Mandatory services include the provision and maintenance of transversal information systems and data processing or associated services for the transversal systems.
Selected performance indicators Table 32.18 State Information Technology Agency performance indicators by programme/objective/activity and related outcome Indicator Programme/objective/activity Outcome Past Current Projections
2013/14 2014/15 2015/16 2016/17 2017/18 2018/19 2019/20Number of e-government services implemented per year
Business operations
Outcome 6: An efficient, competitive and responsive economic infrastructure network
–1 75 24 75 75 75 75
Percentage of projects timeously, successfully and satisfactorily delivered within budget
Business operations –1 80% (583/ 728)
85% (809/955)
90% 85% 90% 95%
Bandwidth capacity maintained at below 75% per year
Business operations –1 75% 75% 75% 75% 75% 75%
1. No historical data available.
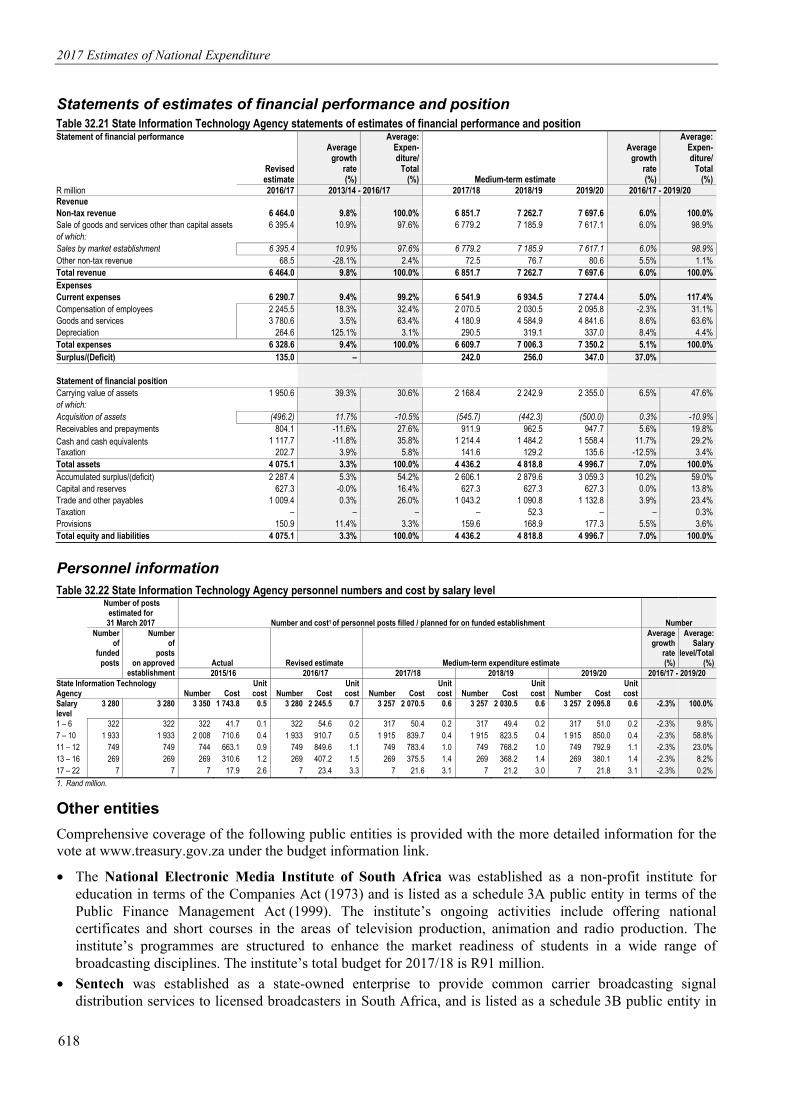
Expenditure analysis The State Information Technology Agency contributes to outcome 6 (an efficient, competitive and responsive economic infrastructure network) of government’s 2014-2019 medium-term strategic framework by ensuring the expansion, modernisation, access and affordability of the country’s ICT infrastructure. The agency’s focus over the medium term will be on collaborating with the Department of Telecommunications and Postal Services in the implementation of phase 1 of the South Africa Connect programme, which intends to provide broadband connectivity to 6 135 government institutions and 4 983 for schools across eight district municipalities.

Vote 32: Telecommunication and Postal Services
617
Furthermore, the agency will by 2019/20 implement 75 e-services, which provide access to government services online. It will also work with National Treasury in driving supply chain reforms by rolling out g-commerce components to 33 per cent of government departments. The agency will also upgrade and invest in ICT infrastructure through the consolidation and modernisation programme. To plan for this, a business case is expected to be approved and the tender awarded by 2017/18 for implementation. These activities are in the business operations programme, increasing at an average annual rate of 5.6 per cent.
The agency intends to spend R1.5 billion on its capital expenditure plan to upgrade its internal ICT infrastructure and build internal capacity. In addition, the projected surpluses of R845 million over the medium term will be used for business re-engineering. The total compensation budget is projected to decrease to R2.1 billion in 2019/20 from R2.2 billion in 2016/17, at an average annual rate of 2.3 per cent. The agency has 3 280 staff members in 2016/17 which will be reduced to 3 257 in 2019/20 because of natural attrition and vacant posts that will not be filled.
Programmes/objectives/activities Table 32.19 State Information Technology Agency expenditure trends and estimates by programme/objective/activity
Audited outcome Revisedestimate
Averagegrowth
rate(%)
Average:Expen-diture/
Total(%)
Medium-term expenditure estimate
Averagegrowth
rate(%)
Average:Expen-diture/
Total(%)
R million 2013/14 2014/15 2015/16 2016/17 2013/14 - 2016/17 2017/18 2018/19 2019/20 2016/17 - 2019/20 Administration 981.8 1 323.7 1 132.5 1 155.5 5.6% 20.5% 1 186.4 1 257.5 1 257.5 2.9% 17.8%Business operations 3 849.4 4 145.8 4 710.3 5 173.1 10.4% 79.5% 5 423.3 5 748.7 6 092.7 5.6% 82.2%Total 4 831.2 5 469.5 5 842.8 6 328.6 9.4% 100.0% 6 609.7 7 006.3 7 350.2 5.1% 100.0%
Statements of historical financial performance and position Table 32.20 State Information Technology Agency statements of historical financial performance and position Statement of financial performance
Budget Audited outcome Budget
Audited outcome Budget
Audited outcome
Budget estimate
Revisedestimate
Average:Outcome/
Budget (%)
R million 2013/14 2014/15 2015/16 2016/17 2013/14 - 2016/17 Revenue Non-tax revenue 5 716.6 4 876.6 5 267.8 5 574.3 5 676.9 5 685.5 5 868.2 6 464.0 100.3%Sale of goods and services other than capital assets
5 635.0 4 692.0 5 182.5 5 539.9 5 592.3 5 458.6 5 795.5 6 395.4 99.5%
of which: Sales by market establishment 5 635.0 4 692.0 5 182.5 5 539.9 5 592.3 5 458.6 5 795.5 6 395.4 99.5%Other non-tax revenue 81.6 184.6 85.3 34.5 84.5 226.9 72.7 68.5 158.7%Total revenue 5 716.6 4 876.6 5 267.8 5 574.3 5 676.9 5 685.5 5 868.2 6 464.0 100.3%Expenses Current expenses 5 515.9 4 809.3 4 987.1 5 391.0 6 127.4 5 792.1 6 257.9 6 290.7 97.4%Compensation of employees 1 670.6 1 354.7 1 463.1 1 983.2 2 354.6 1 743.8 2 212.7 2 245.5 95.1%Goods and services 3 714.8 3 408.1 3 262.5 3 146.2 3 532.6 3 836.4 3 780.6 3 780.6 99.2%Depreciation 130.5 23.2 261.5 261.5 240.2 167.8 264.6 264.6 80.0%Interest, dividends and rent on land – 23.3 – – – 44.0 – – – Total expenses 5 572.1 4 831.2 5 065.6 5 469.5 6 165.1 5 842.8 6 299.5 6 328.6 97.3%Surplus/(Deficit) 144.0 45.0 202.0 105.0 (488.0) (157.0) (431.0) 135.0
Statement of financial position Carrying value of assets 2 559.0 721.3 2 954.0 905.7 1 583.0 1 171.2 1 456.1 1 950.6 55.5%of which: Acquisition of assets (1 793.0) (356.0) (1 538.0) (254.4) (1 151.0) (511.4) (600.0) (496.2) 31.8%Investments – – – – – 13.7 – – – Inventory 60.0 – – – – – – – – Receivables and prepayments 667.5 1 164.2 873.8 1 163.3 973.1 1 067.3 1 069.7 804.1 117.2%Cash and cash equivalents 153.5 1 630.2 165.6 1 539.4 875.1 1 152.5 843.1 1 117.7 267.0%Taxation 50.0 180.9 50.0 117.4 115.0 387.5 40.0 202.7 348.4%Total assets 3 490.1 3 696.5 4 043.5 3 725.8 3 546.2 3 792.2 3 408.9 4 075.1 105.5%Accumulated surplus/(deficit) 1 723.4 1 959.3 2 030.9 2 103.6 2 200.5 1 946.3 2 068.9 2 287.4 103.4%Capital and reserves 627.3 627.3 627.3 627.3 627.3 627.3 627.3 627.3 100.0%Trade and other payables 948.8 1 000.6 1 045.3 867.5 569.8 1 095.9 552.1 1 009.4 127.5%Taxation 42.6 – 179.3 – – – – – – Provisions 148.0 109.3 160.6 127.4 148.7 122.6 160.5 150.9 82.6%Total equity and liabilities 3 490.1 3 696.5 4 043.5 3 725.8 3 546.2 3 792.2 3 408.9 4 075.1 105.5%
2017 Estimates of National Expenditure
618
Statements of estimates of financial performance and position Table 32.21 State Information Technology Agency statements of estimates of financial performance and position Statement of financial performance
Revised estimate
Averagegrowth
rate(%)
Average:Expen-diture/
Total(%) Medium-term estimate
Averagegrowth
rate(%)
Average:Expen-diture/
Total(%)
R million 2016/17 2013/14 - 2016/17 2017/18 2018/19 2019/20 2016/17 - 2019/20 Revenue Non-tax revenue 6 464.0 9.8% 100.0% 6 851.7 7 262.7 7 697.6 6.0% 100.0%Sale of goods and services other than capital assets 6 395.4 10.9% 97.6% 6 779.2 7 185.9 7 617.1 6.0% 98.9%of which: Sales by market establishment 6 395.4 10.9% 97.6% 6 779.2 7 185.9 7 617.1 6.0% 98.9%Other non-tax revenue 68.5 -28.1% 2.4% 72.5 76.7 80.6 5.5% 1.1%Total revenue 6 464.0 9.8% 100.0% 6 851.7 7 262.7 7 697.6 6.0% 100.0%Expenses Current expenses 6 290.7 9.4% 99.2% 6 541.9 6 934.5 7 274.4 5.0% 117.4%Compensation of employees 2 245.5 18.3% 32.4% 2 070.5 2 030.5 2 095.8 -2.3% 31.1%Goods and services 3 780.6 3.5% 63.4% 4 180.9 4 584.9 4 841.6 8.6% 63.6%Depreciation 264.6 125.1% 3.1% 290.5 319.1 337.0 8.4% 4.4%Total expenses 6 328.6 9.4% 100.0% 6 609.7 7 006.3 7 350.2 5.1% 100.0%Surplus/(Deficit) 135.0 – 242.0 256.0 347.0 37.0%
Statement of financial position Carrying value of assets 1 950.6 39.3% 30.6% 2 168.4 2 242.9 2 355.0 6.5% 47.6%of which: Acquisition of assets (496.2) 11.7% -10.5% (545.7) (442.3) (500.0) 0.3% -10.9%Receivables and prepayments 804.1 -11.6% 27.6% 911.9 962.5 947.7 5.6% 19.8%Cash and cash equivalents 1 117.7 -11.8% 35.8% 1 214.4 1 484.2 1 558.4 11.7% 29.2%Taxation 202.7 3.9% 5.8% 141.6 129.2 135.6 -12.5% 3.4%Total assets 4 075.1 3.3% 100.0% 4 436.2 4 818.8 4 996.7 7.0% 100.0%Accumulated surplus/(deficit) 2 287.4 5.3% 54.2% 2 606.1 2 879.6 3 059.3 10.2% 59.0%Capital and reserves 627.3 -0.0% 16.4% 627.3 627.3 627.3 0.0% 13.8%Trade and other payables 1 009.4 0.3% 26.0% 1 043.2 1 090.8 1 132.8 3.9% 23.4%Taxation – – – – 52.3 – – 0.3%Provisions 150.9 11.4% 3.3% 159.6 168.9 177.3 5.5% 3.6%Total equity and liabilities 4 075.1 3.3% 100.0% 4 436.2 4 818.8 4 996.7 7.0% 100.0%
Personnel information Table 32.22 State Information Technology Agency personnel numbers and cost by salary level
Number of posts estimated for 31 March 2017 Number and cost1 of personnel posts filled / planned for on funded establishment Number
Number of
funded posts
Number of
posts on approved
establishment Actual Revised estimate Medium-term expenditure estimate
Averagegrowth
rate(%)
Average:Salary
level/Total(%)
2015/16 2016/17 2017/18 2018/19 2019/20 2016/17 - 2019/20State Information Technology Agency Number Cost
Unit cost Number Cost
Unit cost Number Cost
Unit cost Number Cost
Unit cost Number Cost
Unit cost
Salary level
3 280 3 280 3 350 1 743.8 0.5 3 280 2 245.5 0.7 3 257 2 070.5 0.6 3 257 2 030.5 0.6 3 257 2 095.8 0.6 -2.3% 100.0%
1 – 6 322 322 322 41.7 0.1 322 54.6 0.2 317 50.4 0.2 317 49.4 0.2 317 51.0 0.2 -2.3% 9.8%7 – 10 1 933 1 933 2 008 710.6 0.4 1 933 910.7 0.5 1 915 839.7 0.4 1 915 823.5 0.4 1 915 850.0 0.4 -2.3% 58.8%11 – 12 749 749 744 663.1 0.9 749 849.6 1.1 749 783.4 1.0 749 768.2 1.0 749 792.9 1.1 -2.3% 23.0%13 – 16 269 269 269 310.6 1.2 269 407.2 1.5 269 375.5 1.4 269 368.2 1.4 269 380.1 1.4 -2.3% 8.2%17 – 22 7 7 7 17.9 2.6 7 23.4 3.3 7 21.6 3.1 7 21.2 3.0 7 21.8 3.1 -2.3% 0.2%1. Rand million.
Other entities Comprehensive coverage of the following public entities is provided with the more detailed information for the vote at www.treasury.gov.za under the budget information link.
• The National Electronic Media Institute of South Africa was established as a non-profit institute for education in terms of the Companies Act (1973) and is listed as a schedule 3A public entity in terms of the Public Finance Management Act (1999). The institute’s ongoing activities include offering national certificates and short courses in the areas of television production, animation and radio production. The institute’s programmes are structured to enhance the market readiness of students in a wide range of broadcasting disciplines. The institute’s total budget for 2017/18 is R91 million.
• Sentech was established as a state-owned enterprise to provide common carrier broadcasting signal distribution services to licensed broadcasters in South Africa, and is listed as a schedule 3B public entity in
Vote 32: Telecommunication and Postal Services
619
terms of the Public Finance Management Act (1999). In 2002, the company’s mandate was expanded to provide an international voice gateway and common carrier multimedia services in accordance with government’s imperative to liberalise the telecommunications sector. The company’s total budget for 2017/18 is R1.3 billion.
• The Universal Service and Access Agency of South Africa was established in terms of section 80 of the Electronic Communications Act (2005) as a statutory body and is listed as a schedule 3A public entity in terms of the Public Finance Management Act (1999). Its sole mandate is to promote universal service and access to electronic communications services, electronic communications network services and broadcasting services. The agency’s total budget for 2017/18 is R75.7 million.
• The Universal Service and Access Fund was established in terms of section 89(1) of the Electronic Communications Act (2005). The fund’s sole mandate is to make payments for subsidies towards the provision of ICT equipment and services as well as the construction and extension of electronic communication and broadcasting networks for needy persons in underserviced areas. The fund is managed by the Universal Service and Access Agency of South Africa and is financed by contributions from all telecommunications licensees except community broadcasting service licensees. The fund’s total budget for 2017/18 is R133.7 million.

620
2017 Estimates of National Expenditure
Additional table:Summary of expenditure on infrastructureProject name Service delivery
outputs Current project stage
Totalproject cost Audited outcome
Adjustedappropriation Medium-term expenditure estimate
R million 2013/14 2014/15 2015/16 2016/17 2017/18 2018/19 2019/20 Departmental infrastructure Large projects (total project cost of at least R250 million but less than R1 billion over the project life cycle) South Africa Connect: Phase 1 of digital development plan
Connection of schools and government institutions to broadband
Construction 6 565.0 384.9 – – 450.3 411.9 703.6 724.5
Infrastructure transfers to other spheres, agencies and departments Mega projects (total project cost of at least R1 billion over the project life cycle) Sentech: Digitisation of terrestrial television network
Efficient use of spectrum; achievement of broadcast digital dividend; achievement of multiple channel possibilities and generation of new content
Design 1 534.9 423.3 – – – – – –
Large projects (total project cost of at least R250 million but less than R1 billion over the project life cycle) Sentech: Migration of digital signals Efficient use of spectrum; achievement of
broadcast digital dividend; achievement of multiple channel possibilities and generation of new content
Design 113.0 – – – – 53.0 60.0 –
Small projects (total project cost of less than R250 million over the project life cycle) South Africa Connect: Phase 1 of digital development plan
Efficient use of spectrum; achievement of broadcast digital dividend; achievement of multiple channel possibilities and generation of new content
Various 138.0 76.0 – – – – – –
Total 8 350.9 884.2 – – 450.3 464.9 763.6 724.5