Vote 18 Labour - National Treasury
56
National Treasury ESTIMATES OF NATIONAL EXPENDITURE VOTE 18 Labour National Treasury Department: REPUBLIC OF SOUTH AFRICA national treasury
Transcript of Vote 18 Labour - National Treasury

N a t i o n a l T r e a s u r y
estimates of national expenditure
vote 18 Labour
National TreasuryDepartment:
REPUBLIC OF SOUTH AFRICA
national treasury
Final Budget 2012 Votes Covers_Print.indd 18 2012/02/20 9:07 AM

Estim
ates o
f Natio
na
l expen
ditu
re

Estimates of
National Expenditure
2012
National Treasury
Republic of South Africa
22 February 2012

ISBN: 978-0-621-40578-1
RP: 01/2012
The Estimates of National Expenditure 2012 e-publications are compiled with the latest available information from departmental and other sources. Some of this information is unaudited or subject to revision. The Estimates of National Expenditure e-publications for individual votes are available on www.treasury.gov.za. Compared to the abridged version of the Estimates of National Expenditure, these publications contain more comprehensive coverage of goods and services, transfers and subsidies, and public entities. Additional tables are included containing information on the main and adjusted appropriation, with revised spending estimates for the current financial year, on skills training, conditional grants to provinces and municipalities, public private partnerships and information on donor funding. Expenditure information at the level of service delivery is also included, where appropriate.

Foreword The current global economic context is characterised by high levels of uncertainty. Against this backdrop, South Africa’s development depends largely on government improving its level and quality of service delivery in support of the inclusive and equitable economic roadmap, as contained in the new growth path. The 2012 Budget is an important tool of government for giving effect to these objectives, and this Budget allocates resources to specific interventions that will be actioned over the period of the medium term expenditure framework (MTEF). Growth in spending focuses particularly on infrastructure development, job creation, enterprise support and the enhancement of local government delivery.
South Africa’s fiscal stance and public spending programmes are focused on long term structural transformation. Over the next three years of the MTEF period, government priorities will continue to be realised within a sustainable fiscal trajectory, which balances current needs with intergenerational equity. In line with this, spending baselines have undergone rigorous review, areas of inefficiency and lower priority have been identified, and funds have been redirected towards government’s key priorities, both new and existing. This has been done in recognition of the relationship between the composition of spending and fiscal sustainability over the long term. Here, the balance between consumption and investment is extremely important. Even the distribution of consumption spending between wages, goods and services and transfers is significant, as is the balance between the functional categories expenditure (such as education, health and economic services). Underspending on key priorities undermines the aims of the spending proposed within MTEF Budgets.
Since introducing the functional approach to budget decision-making in 2009, transparency and coordination in budgeting has been enhanced, largely due to the participation by the stakeholders responsible for delivery across all spheres of government. South African budget reforms, especially the intensified focus on budget trade-offs and the composition of expenditure, will lead to greater accountability and improved control.
It is not enough to demonstrate a change in the composition of budgeted expenditure; nor is it enough to pinpoint the specific actions required and proposed within the Budget. Success will only be achieved when we can demonstrate that a shift in the composition of actual expenditure has taken place, together with the achievement of improved delivery targets.
This year, the layout of this publication has been altered substantially. The focus is on linking more closely expenditure planned with targeted performance. Specific focus is on the outcomes to which institutions contribute and the output and other performance measures supporting them. The sections covering employee numbers, personnel budgets and the purpose and key activities of each subprogramme within a vote are now more prominent, giving expression to the budget and service delivery. This publication still indicates details per vote of the allocation of new monies, monies reprioritised between or within budget programmes, and Cabinet approved budget reductions over the period ahead. Compared to the abridged version of the Estimates of National Expenditure, the e-publications for each vote contain more comprehensive coverage of goods and services, transfers and subsidies, and public entities. Additional tables are included, containing information on: the main and adjusted appropriation, with revised spending estimates for the current financial year; skills training; conditional grants to provinces and municipalities; public private partnerships; and donor funding. Expenditure information at the level of service delivery is also included, where appropriate.
The expenditure estimates of departments are the outcome of a rigorous administrative and executive process. Treasury budget analysts, under the guidance of the Ministers’ Committee on the Budget, follow a wide-ranging intergovernmental consultative process, working closely with the policy and budget teams of departments and entities to ensure that government priorities are appropriately funded within the available resource envelope. The Treasury is grateful for the contribution of these teams. Appreciation is also due to the people in the Treasury team, who worked with great diligence to produce a high quality document that provides a comprehensive account of government’s spending and performance plans.
Lungisa Fuzile Director General: National Treasury


Introduction The Estimates of National Expenditure publications The Estimates of National Expenditure publications are important accountability documents, which set out the details in relation to planned expenditure and planned performance at the time of the tabling of the Budget. Estimates of National Expenditure publications continue to make a significant contribution to the changes relating to budgeting by programme. As part of these ongoing efforts, several changes have been made to the 2012 Estimates of National Expenditure publications. Departments still provide information on the key objectives of each subprogramme within a programme, and note the activities carried out, the number of personnel responsible for undertaking these activities and the funding allocations supporting this. This year in the 2012 publications, information on expenditure and performance is more closely linked under the ’expenditure trends’ section, with a brief discussion on the impact of budget allocations on the achievement of outputs over the seven-year period. In addition, an explanation of the personnel trends, per programme by salary level, over the seven years in relation to compensation of employees has also been included. Finally, information on Cabinet approved cost reduction measures and other budget reprioritisation has been included per programme.
The 2012 abridged Estimates of National Expenditure publication, and the separate Estimates of National Expenditure e-publications for each vote are the product of an extensive consultative review process of budgets and policy, and policy implementation by programme, and include the latest improvements in non-financial performance information. These publications provide the details of the spending estimates for the next three financial years (2012/13 to 2014/15), expenditure outcomes for the past three years (2008/09 to 2010/11) and revised estimates for the current financial year (2011/12). Information is provided on performance targets over the seven year period as well as changes in these, as they relate to trends in planned expenditure.
The e-publications for individual votes contain more comprehensive coverage of goods and services, transfers and subsidies, and public entities. Additional tables are included containing information on: the main and adjusted appropriation, with revised spending estimates for the current financial year; skills training; conditional grants to provinces and municipalities; public private partnerships; and donor funding. Expenditure information at the level of service delivery is also included, where appropriate.
A consolidated account, summarising the Estimates of National Expenditure publication information across votes, is provided in the form of a narrative and summary tables in the Introduction chapter, which is included in the front pages of the abridged version of the Estimates of National Expenditure. A write-up containing the explanation of the information that is contained in each section of the publications has also been included in the abridged version of the Estimates of National Expenditure. Like the separate Estimates of National Expenditure e-publications for each vote, the abridged Estimates of National Expenditure publication is also available on www.treasury.gov.za.


Labour
National Treasury Republic of South Africa

Contents
Budget summary ................................................................................................... 1
Aim ......................................................................................................................... 1
Programme purposes ........................................................................................... 1
Strategic overview: 2008/09 – 2014/15 ................................................................ 1
Selected performance indicators......................................................................... 2
Expenditure estimates .......................................................................................... 3
Expenditure trends ............................................................................................... 4
Personnel information .......................................................................................... 5
Departmental receipts .......................................................................................... 6
Programme 1: Administration .............................................................................. 7
Programme 2: Inspection and Enforcement Services ....................................... 9
Programme 3: Public Employment Services ..................................................... 12
Programme 4: Labour Policy and Industrial Relations ..................................... 16
Public entities and other agencies ..................................................................... 20
Additional tables .................................................................................................. 36
1
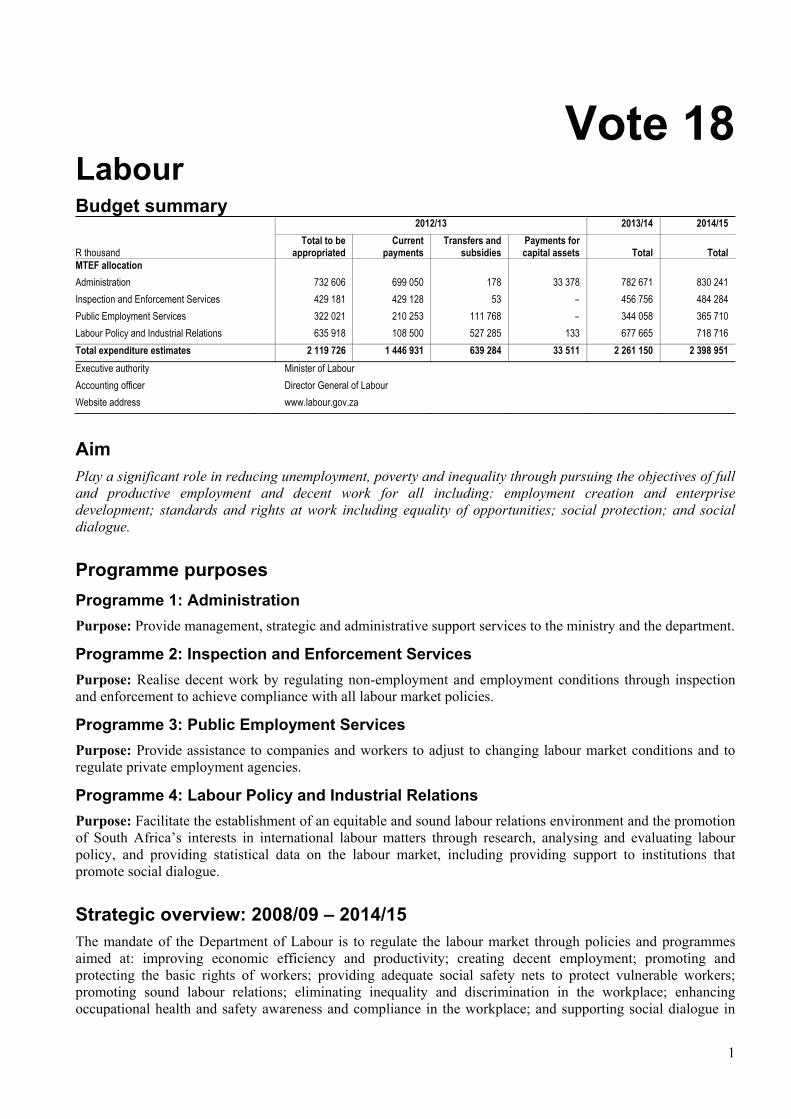
Vote 18 Labour Budget summary
2012/13 2013/14 2014/15 R thousand
Total to be appropriated
Current payments
Transfers and subsidies
Payments for capital assets Total Total
MTEF allocation Administration 732 606 699 050 178 33 378 782 671 830 241Inspection and Enforcement Services 429 181 429 128 53 – 456 756 484 284Public Employment Services 322 021 210 253 111 768 – 344 058 365 710Labour Policy and Industrial Relations 635 918 108 500 527 285 133 677 665 718 716Total expenditure estimates 2 119 726 1 446 931 639 284 33 511 2 261 150 2 398 951Executive authority Minister of Labour Accounting officer Director General of Labour Website address www.labour.gov.za
Aim Play a significant role in reducing unemployment, poverty and inequality through pursuing the objectives of full and productive employment and decent work for all including: employment creation and enterprise development; standards and rights at work including equality of opportunities; social protection; and social dialogue.
Programme purposes Programme 1: Administration Purpose: Provide management, strategic and administrative support services to the ministry and the department.
Programme 2: Inspection and Enforcement Services Purpose: Realise decent work by regulating non-employment and employment conditions through inspection and enforcement to achieve compliance with all labour market policies.
Programme 3: Public Employment Services Purpose: Provide assistance to companies and workers to adjust to changing labour market conditions and to regulate private employment agencies.
Programme 4: Labour Policy and Industrial Relations Purpose: Facilitate the establishment of an equitable and sound labour relations environment and the promotion of South Africa’s interests in international labour matters through research, analysing and evaluating labour policy, and providing statistical data on the labour market, including providing support to institutions that promote social dialogue.
Strategic overview: 2008/09 – 2014/15 The mandate of the Department of Labour is to regulate the labour market through policies and programmes aimed at: improving economic efficiency and productivity; creating decent employment; promoting and protecting the basic rights of workers; providing adequate social safety nets to protect vulnerable workers; promoting sound labour relations; eliminating inequality and discrimination in the workplace; enhancing occupational health and safety awareness and compliance in the workplace; and supporting social dialogue in

2012 Estimates of National Expenditure
2
order to formulate sound and responsive legislation and policies that balance labour market flexibility for enterprise competitiveness with promoting decent employment.
Strategic priorities Specific strategic goals include: implementing the Decent Work country programme; rebuilding public employment services to enable government to maintain a database of job seekers and job opportunities, and match and place job seekers; strengthening the labour inspectorate system to effectively monitor and enforce compliance with legislation to ensure adherence to decent work principles and address vulnerability in the labour market; strengthening social security, including reintegrating workers into the labour market and restructuring sheltered employment factories; and strengthening the institutional capacity of the department to improve quality and access to service delivery.
Amending legislation To contribute to the creation of decent employment, the department, after consultation with stakeholders, will present to Parliament in 2012/13 amendments to the following legislation it administers: the Unemployment Insurance Act (2001), to improve benefits and to effect administrative changes regarding submission of information to the fund by employers; and the Compensation for Occupational Injuries and Diseases Act (1993), to allow for the development of a rehabilitation, reintegration, and return-to-work policy for injured and diseased workers. The department will also seek to repeal the Occupational Health and Safety Act (1993) in its current form to ensure that employers develop and implement a health and safety management system, that penalties issued to employers are increased, and that inspectors can issue prescribed fines on the spot.
Other key pieces of legislation which were scheduled to be tabled at Parliament in 2011/12, but which are still under discussion at the National Economic Development and Labour Council include: the Labour Relations Amendment Bill (2010), which proposes to stop repeated short term contracting, address labour broking and clarify the definition of employer in certain circumstances; the Basic Conditions of Employment Amendment Bill (2010), which seeks to vary the circumstances under which trade unions may qualify for representational rights and to empower the minister to amend wages in certain circumstances; the Employment Equity Amendment Bill (2010), to give effect to the same-employer equal pay for work of equal value principle; and the Employment Services Bill (2010), to regulate activities concerned with employment placement services.
Labour market information systems The department will enhance all its labour market information systems to produce relevant, accurate, and updated statistics and information by completing the upgrade of its ICT systems. The critical project related to this is the integrated client database, which will provide crucial information for individuals and companies. Once completed, all other systems within the department will be linked and updated from the main system. This information will assist policy makers and other stakeholders interested in changes in labour market trends to review policies and propose new interventions in the labour market. In addition to this milestone, completing and implementing the department’s executive dashboard system remains a key strategic priority for improving service delivery in the department.
Selected performance indicators Table 18.1 Labour Indicator Programme Past Current Projections 2008/09 2009/10 2010/11 2011/12 2012/13 2013/14 2014/15Number of work places inspected per year
Inspection and Enforcement Services
153 697 147 556 192 129 130 000 140 000 150 000 160 000
Number of complaints resolved within 14 days at Registration Services per year
Inspection and Enforcement Services
178 863 150 831 116 131 79 440 (Q3) –1 –1 –1
Number of job seekers registered on the employment services for South Africa system per year
Public Employment Services
421 686 636 140 472 179 600 000 700 000 800 000 900 000
Vote 18: Labour
3
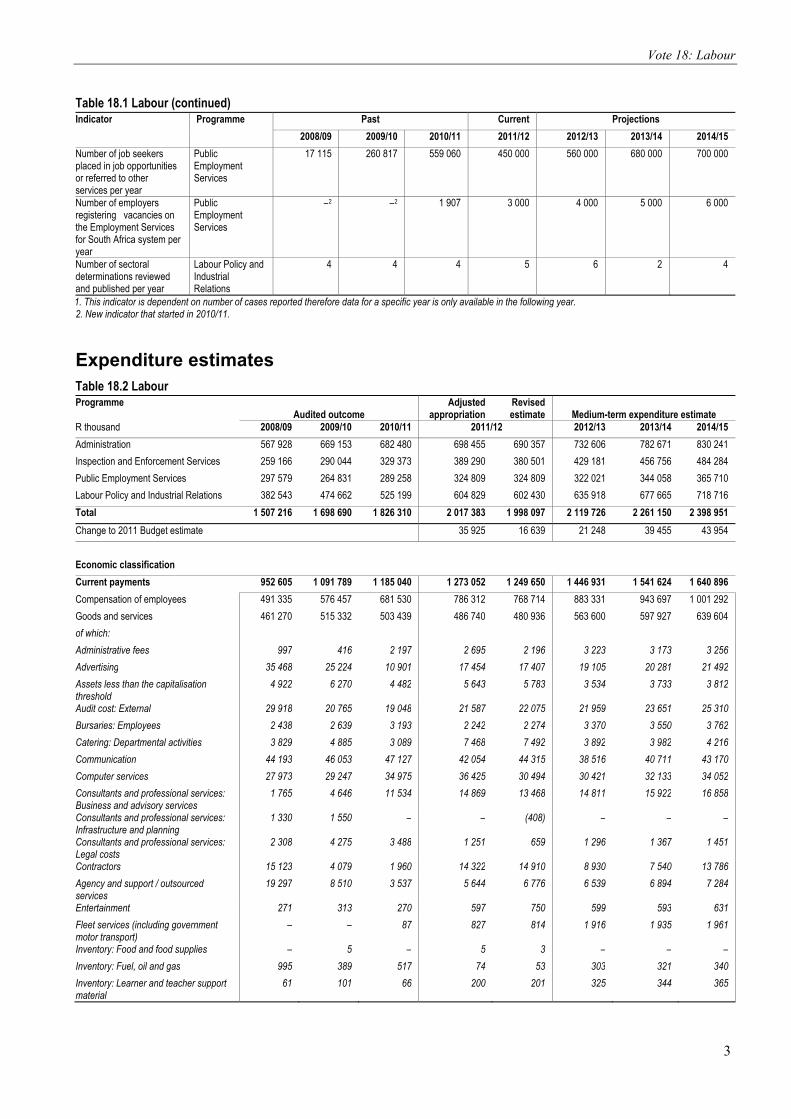
Table 18.1 Labour (continued) Indicator Programme Past Current Projections 2008/09 2009/10 2010/11 2011/12 2012/13 2013/14 2014/15Number of job seekers placed in job opportunities or referred to other services per year
Public Employment Services
17 115 260 817 559 060 450 000 560 000 680 000 700 000
Number of employers registering vacancies on the Employment Services for South Africa system per year
Public Employment Services
–2 –2 1 907 3 000 4 000 5 000 6 000
Number of sectoral determinations reviewed and published per year
Labour Policy and Industrial Relations
4 4 4 5 6 2 4
1. This indicator is dependent on number of cases reported therefore data for a specific year is only available in the following year. 2. New indicator that started in 2010/11.
Expenditure estimates Table 18.2 Labour Programme
Audited outcome Adjusted
appropriation Revised estimate Medium-term expenditure estimate
R thousand 2008/09 2009/10 2010/11 2011/12 2012/13 2013/14 2014/15 Administration 567 928 669 153 682 480 698 455 690 357 732 606 782 671 830 241Inspection and Enforcement Services 259 166 290 044 329 373 389 290 380 501 429 181 456 756 484 284Public Employment Services 297 579 264 831 289 258 324 809 324 809 322 021 344 058 365 710Labour Policy and Industrial Relations 382 543 474 662 525 199 604 829 602 430 635 918 677 665 718 716Total 1 507 216 1 698 690 1 826 310 2 017 383 1 998 097 2 119 726 2 261 150 2 398 951Change to 2011 Budget estimate 35 925 16 639 21 248 39 455 43 954 Economic classification Current payments 952 605 1 091 789 1 185 040 1 273 052 1 249 650 1 446 931 1 541 624 1 640 896Compensation of employees 491 335 576 457 681 530 786 312 768 714 883 331 943 697 1 001 292Goods and services 461 270 515 332 503 439 486 740 480 936 563 600 597 927 639 604of which: Administrative fees 997 416 2 197 2 695 2 196 3 223 3 173 3 256Advertising 35 468 25 224 10 901 17 454 17 407 19 105 20 281 21 492Assets less than the capitalisation threshold
4 922 6 270 4 482 5 643 5 783 3 534 3 733 3 812
Audit cost: External 29 918 20 765 19 048 21 587 22 075 21 959 23 651 25 310Bursaries: Employees 2 438 2 639 3 193 2 242 2 274 3 370 3 550 3 762Catering: Departmental activities 3 829 4 885 3 089 7 468 7 492 3 892 3 982 4 216Communication 44 193 46 053 47 127 42 054 44 315 38 516 40 711 43 170Computer services 27 973 29 247 34 975 36 425 30 494 30 421 32 133 34 052Consultants and professional services: Business and advisory services
1 765 4 646 11 534 14 869 13 468 14 811 15 922 16 858
Consultants and professional services: Infrastructure and planning
1 330 1 550 – – (408) – – –
Consultants and professional services: Legal costs
2 308 4 275 3 488 1 251 659 1 296 1 367 1 451
Contractors 15 123 4 079 1 960 14 322 14 910 8 930 7 540 13 786Agency and support / outsourced services
19 297 8 510 3 537 5 644 6 776 6 539 6 894 7 284
Entertainment 271 313 270 597 750 599 593 631Fleet services (including government motor transport)
– – 87 827 814 1 916 1 935 1 961
Inventory: Food and food supplies – 5 – 5 3 – – –Inventory: Fuel, oil and gas 995 389 517 74 53 303 321 340Inventory: Learner and teacher support material
61 101 66 200 201 325 344 365

2012 Estimates of National Expenditure
4
Table 18.2 Labour (continued) Audited outcome Adjusted
appropriation Revised estimate
Medium-term expenditure estimate
R thousand 2008/09 2009/10 2010/11 2011/12 2012/13 2013/14 2014/15 Economic classification Current payments Inventory: Materials and supplies 257 834 516 184 177 203 203 215Inventory: Medical supplies 13 9 10 12 (237) – – –Inventory: Other consumables 2 062 2 412 3 523 5 142 5 095 2 253 2 383 2 528Inventory: Stationery and printing 25 447 29 687 20 499 24 415 23 527 26 137 28 049 29 683Lease payments 87 420 124 995 143 530 115 696 121 370 218 918 232 956 246 926Property payments 20 776 63 769 65 251 43 912 42 742 45 479 49 394 52 356Transport provided: Departmental activity
40 38 – 655 709 – – –
Travel and subsistence 107 181 102 004 106 164 93 779 167 592 79 935 85 043 90 590Training and development 8 851 10 335 6 507 10 443 10 855 12 097 12 483 13 190Operating expenditure 2 469 8 305 5 355 5 929 (71 697) 5 783 6 216 6 502Venues and facilities 15 866 13 577 5 613 13 216 11 990 14 056 15 070 15 868Rental and hiring – – – – (449) – – –Interest and rent on land – – 71 – – – – –Transfers and subsidies 457 248 516 275 561 038 626 267 630 447 639 284 682 392 724 491Provinces and municipalities – 1 54 12 12 – – –Departmental agencies and accounts 323 173 411 485 457 948 542 184 542 184 551 392 589 664 626 200Foreign governments and international organisations
10 377 8 618 10 703 10 211 14 306 10 722 11 312 11 991
Public corporations and private enterprises
– 555 – – – – – –
Non-profit institutions 119 179 92 112 89 196 73 258 73 258 76 906 81 137 86 005Households 4 519 3 504 3 137 602 687 264 279 295Payments for capital assets 93 111 90 109 80 213 118 064 118 000 33 511 37 134 33 564Buildings and other fixed structures 2 724 225 3 117 3 996 3 996 3 416 5 486 17Machinery and equipment 90 387 89 879 77 086 114 068 114 004 30 095 31 648 33 547Software and other intangible assets – 5 10 – – – – –Payments for financial assets 4 252 517 19 – – – – –Total 1 507 216 1 698 690 1 826 310 2 017 383 1 998 097 2 119 726 2 261 150 2 398 951
Expenditure trends The spending focus over the medium term will be on protecting vulnerable workers, reintegrating work seekers into the labour market and ensuring decent work. The Labour Policy and Industrial Relations programme will focus on making transfer payments to address financial constraints at the Commission for Conciliation, Mediation and Arbitration and the National Economic Development and Labour Council.
Expenditure grew from R1.5 billion in 2008/09 to R2 billion in 2011/12, at an average annual rate of 10 per cent, mainly as a result of additional allocations to: the Commission for Conciliation, Mediation and Arbitration for a new case management system and increases in operational costs; the National Economic Development and Labour Council for increased operational costs; and for the Inspection and Enforcement Services programme for the employment of additional specialist inspectors. Expenditure is projected to grow to R2.4 billion over the medium term, at an average annual rate of 6 per cent.
The 2012 Budget provides additional allocations of R25.9 million in 2012/13, R41 million in 2013/14 and R45.5 million in 2014/15 as follows:
• R17.5 million in 2012/13, R28.5 million in 2013/14 and R31.1 million in 2014/15 for improvements in conditions of service within the department
• R3.4 million in 2012/13, R5.9 million in 2013/14 and R6.6 million in 2014/15 for the Commission for Conciliation, Mediation and Arbitration for improvements to conditions of service
• R783 000 in 2012/13, R1.3 million in 2013/14 and R1.5 million in 2014/15 for Productivity SA for improvements to conditions of service

Vote 18: Labour
5
• R176 000 in 2012/13, R290 000 in 2013/14 and R311 000 in 2014/15 for the National Economic Development and Labour Council for improvements to conditions of service
• R4 million in 2012/13, R5 million in 2013/14 and R6 million in 2014/15 for the Compensation Fund for the administration cost of public servants’ claims for injuries/illnesses or diseases contracted while on duty.
The department has reprioritised R3.2 million in 2012/13 for additional posts in the office of the chief information officer in the Administration programme. Cabinet approved baseline cuts amounting to R4.5 million over the 2012 MTEF period, mainly from goods and services, lease payments, and through reducing travel and the hiring of venues and facilities, have been made. Between 2008/09 to 2011/12, the department used 71 consultants for 45 projects, at an estimated cost of R47 million. Details on the nature of the work the consultants performed are discussed in each programme.
Infrastructure spending The department has various small infrastructure projects at different stages of completion. Spending on infrastructure increased from R2.7 million in 2008/09 to R4 million in 2011/12, and is projected to decrease to R17 000 by 2014/15. Spending between 2008/09 to 2011/12 focused mainly on small projects to provide safe working conditions for staff and improved access to services to the public. Infrastructure spending over the first two years of the MTEF period relates to the cost of site clearance for various new projects in Mpumalanga and Western Cape, with spending mainly on consultant fees. The designs for the new Taung, Bochum and Mount Ayliff labour centres are complete. The start date for construction will depend on the site clearance work being finalised by the Department of Public Works. The allocation in 2014/15 is for the construction of booths for security guards at labour centres.
Personnel information Table 18.3 Details of approved establishment and personnel numbers according to salary level1
Personnel post status as at 30 September 2011 Number of personnel posts filled / planned for on funded establishment Number of Number
of funded posts
Number of posts on posts additional approved to the Actual Mid-year2 Medium-term estimate establishment establishment 2008/09 2009/10 2010/11 2011/12 2012/13 2013/14 2014/15 Department 3 483 3 466 17 2 765 3 100 3 092 3 155 3 460 3 460 3 460Salary level 1 – 6 1 715 1 707 8 1 512 1 627 1 582 1 558 1 707 1 707 1 707Salary level 7 – 10 1 587 1 583 4 1 113 1 320 1 359 1 436 1 577 1 577 1 577Salary level 11 – 12 120 118 2 98 99 102 107 118 118 118Salary level 13 – 16 61 58 3 41 53 49 54 58 58 58Administration 1 202 1 196 6 1 017 1 014 1 068 1 098 1 193 1 193 1 193Salary level 1 – 6 658 656 2 599 577 615 599 656 656 656Salary level 7 – 10 461 461 – 349 358 384 422 458 458 458Salary level 11 – 12 50 48 2 43 44 42 46 48 48 48Salary level 13 – 16 33 31 2 26 34 27 31 31 31 31Inspection and Enforcement Services
1 429 1 429 – 1 154 1 425 1 291 1 316 1 429 1 429 1 429
Salary level 1 – 6 869 869 – 762 885 795 795 869 869 869Salary level 7 – 10 537 537 – 371 518 474 498 537 537 537Salary level 11 – 12 16 16 – 15 16 15 16 16 16 16Salary level 13 – 16 7 7 – 6 6 7 7 7 7 7Public Employment Services
656 649 7 435 474 539 563 646 646 646
Salary level 1 – 6 165 159 6 128 139 144 141 159 159 159Salary level 7 – 10 456 456 – 293 320 375 398 453 453 453Salary level 11 – 12 23 23 – 13 13 15 17 23 23 23Salary level 13 – 16 12 11 1 1 2 5 7 11 11 11Labour Policy and Industrial Relations
196 192 4 159 187 194 178 192 192 192
Salary level 1 – 6 23 23 – 23 26 28 23 23 23 23Salary level 7 – 10 133 129 4 100 124 126 118 129 129 129Salary level 11 – 12 31 31 – 27 26 30 28 31 31 31Salary level 13 – 16 9 9 – 8 11 10 9 9 9 9
1. Data has been provided by the department and may not necessarily reconcile with official government personnel data.2. As at 30 September 2011.

2012 Estimates of National Expenditure
6
As at 30 September 2011, the department had an establishment of 3 483 posts, of which 3 466 were funded and 17 were additional to the establishment. The number of filled posts increased from 2 765 in 2008/09 to 3 155 in 2011/12, and is projected to grow to 3 460 in 2014/15. The increase between 2008/09 and 2011/12 is due to the filling of all critical posts across programmes. There are 311 vacancies within the department, most of which are at salary level 5 in the Administration and Inspection and Enforcement Services programmes. The delays in filling these posts are attributed to the delays in the State Security Agency process in vetting applicants.
As at 30 September 2011, the ratio of support staff to line staff in the department was 1:6 and the percentage of consultants used in relation to the total number of personnel was 2.3 per cent.
Departmental receipts Table 18.4 Receipts Audited outcome Adjusted
estimate Revised estimate
Medium-term receipts estimate
R thousand 2008/09 2009/10 2010/11 2011/12 2012/13 2013/14 2014/15 Departmental receipts 28 863 12 916 9 036 10 801 10 801 8 136 8 280 8 556Sales of goods and services produced by department
4 608 5 247 2 539 2 523 2 523 2 484 2 268 2 064
Sales by market establishments 584 577 215 181 181 180 204 240of which: Rental for non-residential buildings (INDLELA) 209 199 50 – – – – –Rental for staff dwellings 249 252 35 42 42 41 45 50Rental for parking (covered and open) 126 126 130 139 139 139 159 190Administration fees 2 340 2 701 1 046 996 996 960 720 480of which: Licence fees for occupational health and safety – 65 214 250 250 300 350 380Inspection fees for INDLELA's trade tests 2 340 2 636 832 746 746 660 370 100Other sales 1 684 1 969 1 278 1 346 1 346 1 344 1 344 1 344of which: Boarding services for staff and external persons (INDLELA)
578 592 6 – – – – –
Formal training provided (INDLELA) 46 226 18 – – – – –Commission on insurance and garnishee orders 1 046 1 146 1 250 1 341 1 341 1 341 1 341 1 341Replacement of security cards 2 4 4 5 5 3 3 3Sale of assets < R5 000 12 1 – – – – – –Sales of scrap, waste, arms and other used current goods
46 43 12 12 12 12 12 12
of which: Sale of scrap 22 15 5 5 5 5 5 5Sale of waste paper 24 28 7 7 7 7 7 7Fines, penalties and forfeits 436 537 601 585 585 600 600 600Interest, dividends and rent on land 3 905 821 549 488 488 480 480 480Interest 3 905 821 549 488 488 480 480 480Sales of capital assets – 331 – – – – – –Transactions in financial assets and liabilities
19 868 5 937 5 335 7 193 7 193 4 560 4 920 5 400
Total 28 863 12 916 9 036 10 801 10 801 8 136 8 280 8 556
Revenue is generated mainly from administrative fees, parking fees and commission from insurance companies for deducting premiums from staff. Revenue is also received from financial transactions in assets and liabilities, comprising of fees from stale cheques, recoveries from the previous financial year, breach of contract fees, and issuing and renewal of occupational health and safety licences.
Transactions in financial assets and liabilities grew significantly in 2008/09 due to the recovery of R15.3 million from the Compensation Fund for recoverable compensation of employees’ payments. Over the medium term,
Vote 18: Labour
7
departmental receipts are expected to decrease from R10.8 million in 2011/12 to R8.6 million in 2014/15, at an average annual rate of 7.5 per cent, due to the transfer of the Institute for the National Development of Learnerships Employment Skills and Labour Assessments to the Department of Higher Education and Training from 1 April 2010.
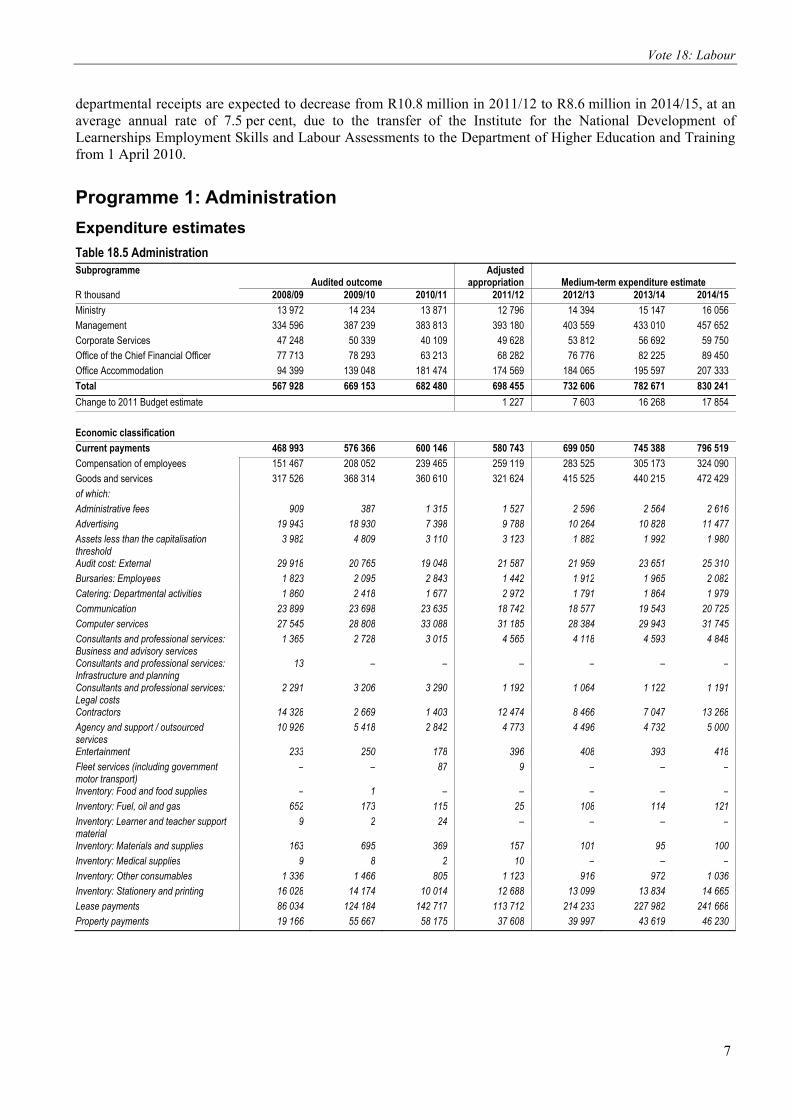
Programme 1: Administration Expenditure estimates Table 18.5 Administration Subprogramme
Audited outcome Adjusted
appropriation Medium-term expenditure estimate R thousand 2008/09 2009/10 2010/11 2011/12 2012/13 2013/14 2014/15 Ministry 13 972 14 234 13 871 12 796 14 394 15 147 16 056Management 334 596 387 239 383 813 393 180 403 559 433 010 457 652Corporate Services 47 248 50 339 40 109 49 628 53 812 56 692 59 750Office of the Chief Financial Officer 77 713 78 293 63 213 68 282 76 776 82 225 89 450Office Accommodation 94 399 139 048 181 474 174 569 184 065 195 597 207 333Total 567 928 669 153 682 480 698 455 732 606 782 671 830 241Change to 2011 Budget estimate 1 227 7 603 16 268 17 854 Economic classification Current payments 468 993 576 366 600 146 580 743 699 050 745 388 796 519Compensation of employees 151 467 208 052 239 465 259 119 283 525 305 173 324 090Goods and services 317 526 368 314 360 610 321 624 415 525 440 215 472 429of which: Administrative fees 909 387 1 315 1 527 2 596 2 564 2 616Advertising 19 943 18 930 7 398 9 788 10 264 10 828 11 477Assets less than the capitalisation threshold
3 982 4 809 3 110 3 123 1 882 1 992 1 980
Audit cost: External 29 918 20 765 19 048 21 587 21 959 23 651 25 310Bursaries: Employees 1 823 2 095 2 843 1 442 1 912 1 965 2 082Catering: Departmental activities 1 860 2 418 1 677 2 972 1 791 1 864 1 979Communication 23 899 23 698 23 635 18 742 18 577 19 543 20 725Computer services 27 545 28 808 33 088 31 185 28 384 29 943 31 745Consultants and professional services: Business and advisory services
1 365 2 728 3 015 4 565 4 118 4 593 4 848
Consultants and professional services: Infrastructure and planning
13 – – – – – –
Consultants and professional services: Legal costs
2 291 3 206 3 290 1 192 1 064 1 122 1 191
Contractors 14 328 2 669 1 403 12 474 8 466 7 047 13 268Agency and support / outsourced services
10 926 5 418 2 842 4 773 4 496 4 732 5 000
Entertainment 233 250 178 396 408 393 418Fleet services (including government motor transport)
– – 87 9 – – –
Inventory: Food and food supplies – 1 – – – – –Inventory: Fuel, oil and gas 652 173 115 25 108 114 121Inventory: Learner and teacher support material
9 2 24 – – – –
Inventory: Materials and supplies 163 695 369 157 101 95 100Inventory: Medical supplies 9 8 2 10 – – –Inventory: Other consumables 1 336 1 466 805 1 123 916 972 1 036Inventory: Stationery and printing 16 028 14 174 10 014 12 688 13 099 13 834 14 665Lease payments 86 034 124 184 142 717 113 712 214 233 227 982 241 668Property payments 19 166 55 667 58 175 37 608 39 997 43 619 46 230

2012 Estimates of National Expenditure
8
Table 18.5 Administration (continued)
Audited outcome Adjusted
appropriation Medium-term expenditure estimate R thousand 2008/09 2009/10 2010/11 2011/12 2012/13 2013/14 2014/15
Economic classification Current payments Transport provided: Departmental activity
– 38 – 500 – – –
Travel and subsistence 42 505 40 853 36 327 31 409 30 053 31 700 33 608Training and development 4 691 5 052 3 045 4 494 5 215 5 542 5 853Operating expenditure 1 431 4 717 3 437 1 727 2 110 2 225 2 290Venues and facilities 6 467 5 103 2 651 4 396 3 776 3 895 4 219Interest and rent on land – – 71 – – – –Transfers and subsidies 2 200 2 472 2 684 255 178 188 199Provinces and municipalities – 1 54 12 – – –Public corporations and private enterprises
– 555 – – – – –
Households 2 200 1 916 2 630 243 178 188 199Payments for capital assets 92 483 89 798 79 631 117 457 33 378 37 095 33 523Buildings and other fixed structures 2 724 225 3 117 3 996 3 416 5 486 17Machinery and equipment 89 759 89 568 76 504 113 461 29 962 31 609 33 506Software and other intangible assets – 5 10 – – – –Payments for financial assets 4 252 517 19 – – – –Total 567 928 669 153 682 480 698 455 732 606 782 671 830 241
Details of transfers and subsidies Provinces and municipalities Provinces Provincial agencies and funds Current – 1 54 12 – – –Vehicle licences – 1 54 12 – – –Households Social benefits Current 994 1 916 2 626 243 178 188 199Households 322 1 538 2 060 – – – –Employee social benefits 672 378 566 243 178 188
199 Households Other transfers to households Current 1 206 – 4 – – – –Gifts and donations 1 206 – 4 – – – –Public corporations and private enterprises Public corporations Other transfers to public corporations
Current – 555 – – – – –Non-life insurance – 25 – – – – –Exgratia payment – 530 – – – – –
Expenditure trends Expenditure grew from R567.9 million in 2008/09 to R698.5 million in 2011/12, at an average annual rate of 7.1 per cent, due to increased spending on office accommodation. Payments for office accommodation grew from R94.4 million in 2008/09 to R174.6 million in 2011/12, at an average annual rate of 22.8 per cent. Over the medium term, expenditure is expected to increase to R830.2 million in 2014/15, at an average annual rate of 5.9 per cent. Most of the increase over the medium term is due to spending on goods and services, which is

Vote 18: Labour
9
expected to grow from R321.6 million in 2011/12 to R472.4 million in 2014/15, at an average annual rate of 13.7 per cent, due to increased lease payments for the public private partnership unitary fees, lease payments for office buildings and administration fees.
Spending on compensation of employees grew from R151.5 million in 2008/09 to R259.1 million in 2011/12, at an average annual rate of 19.6 per cent, due to the inclusion of provincial office senior management staff into the management subprogramme. Spending on buildings and other fixed structures increased from R2.7 million in 2008/09 to R4 million in 2011/12, at an average annual rate of 13.6 per cent, due to the head office repairs and maintenance project.
Between 2008/09 and 2011/12, the programme used 12 consultants for 12 projects, at an estimated total cost of R21.7 million. The consultants worked on: the disclosure of the public private partnership contract in the financial statements; competency assessments for all senior management service members; public entities compliance; the update and maintenance of the accrual balance for the SAP implementation; and the facilitation, analysis and evaluation of public entities financial reporting. Over the MTEF period, the programme estimates spending R16.9 million on consultants to assist with the disclosure of its information technology/information security public private partnership contract in the financial statements.
Programme 2: Inspection and Enforcement Services Objectives and measures • Protect vulnerable workers by:
– inspecting 130 000 workplaces to achieve 80 per cent compliance with labour legislation by employers and employees inspected (proactive and reactive) within 90 days of receiving the complaint, with a specific focus on vulnerable sectors (private security, agriculture, forestry, hospitality, and domestic workers) to ensure that Decent Work principles are adhered to by 2012/13
– settling at least 75 per cent of labour related complaints within 14 days of registration of complaint annually.
• Promote equity in the workplace and ensure the transformation of the labour market by inspecting 12 000 workplaces of which 160 will be designated employers or companies and 80 will be Johannesburg Stock Exchange listed companies to achieve 80 per cent compliance with employment equity legislation by 2012/13.
• Promote social protection by: – reducing accidents and injuries in the 4 high risk sectors (iron and steel, construction, chemicals, and
agriculture and forestry) by conducting 40 audits per sector and 4 blitz inspections per year targeting 18 000 workplaces
– increasing the promotion of knowledge and awareness of occupational health and safety to employers and workers in the agriculture sector by rolling out the roving safety representative project to KwaZulu-Natal and Western Cape provinces during 2012/13
– reducing the overexposure of workers to silica dust by conducting inspections in 200 workplaces in the following industries: foundries (40), ceramics (20), sandstone (20), construction (20), refractories (80) and sandblasting (10) in 2012/13.
• Strengthen the department’s institutional capacity by developing and implementing competency and induction programmes for existing and new inspectors in 2012/13.
Subprogrammes • Management and Support Services: Inspection and Enforcement Services manages the delegated
administrative and financial responsibilities of the office of the deputy director general: inspection and enforcement services, and provides corporate support to line function subprogrammes within the programme. This subprogramme had a staff complement of 40, including 24 pupil inspector posts, and a total budget of R12.1 million in 2011/12, of which 71.1 per cent was used for compensation of employees.

2012 Estimates of National Expenditure
10
Approved budget cuts of R130 000 have been identified in 2012/13 from advertising and inventory, stationery and printing.
• Occupational Health and Safety promotes health and safety in the workplace by regulating dangerous activities and the use of plant and machinery, through inspections to ensure compliance with the Occupational Health and Safety Act (1993). This subprogramme had a staff complement of 17 and a total budget of R16.9 million in 2011/12, of which 57.8 per cent was used for compensation of employees. In 2010/11, 208 inspections were conducted at identified industries with silica dust and a further 59 during the first half of 2011/12. Approved budget cuts of R300 000 in 2012/13 have been identified from inventory: stationery and printing.
• Registration: Inspection and Enforcement Services registers incidents relating to labour relations and occupational health and safety matters, as reported by members of the public, and communicates these to the relevant structures within the Compliance, Monitoring and Enforcement subprogramme for investigation. This subprogramme had a staff complement of 402 and a total budget of R82.5 million in 2011/12, of which 92 per cent was used for compensation of employees. In 2010/11, this subprogramme registered 154 441 labour complaints, of which 75 per cent were settled within 90 days, with R16.5 million having been recovered for complainants. No approved budget cuts have been made in this subprogramme.
• Compliance, Monitoring and Enforcement ensures that employers and employees comply with labour legislation through regular inspections and follows up on reported incidents. This subprogramme had a staff complement of 864 and a total budget of R274.6 million in 2011/12, of which 78 per cent was used for compensation of employees. In 2010/11, over 120 566 of the 154 441 complaints received were investigated, of which 116 131 were settled within 90 days; 24 013 blitz inspections in high risk areas were conducted with a compliance rate of 60 per cent; 192 129 workplace inspections were conducted with a compliance rate of 77 per cent; 157 132 routine inspections were conducted with a compliance rate of 80 per cent; and 9 734 employment equity inspections were conducted with a compliance rate of 79 per cent. No approved budget cuts have been made in this subprogramme.
• Training of Staff: Inspection and Enforcement Services defrays all expenditure relating to staff training within this programme in order to easily identify this expenditure for reporting purposes. This subprogramme has no staff complement and a total budget of R3.2 million in 2011/12, of which 100 per cent was used for staff training. No approved budget cuts have been made in this subprogramme.
Expenditure estimates Table 18.6 Inspection and Enforcement Services Subprogramme
Audited outcome Adjusted
appropriation Medium-term expenditure estimate R thousand 2008/09 2009/10 2010/11 2011/12 2012/13 2013/14 2014/15 Management and Support Services: Inspection and Enforcement Services
9 461 10 617 8 455 12 052 13 994 14 993 15 896
Occupational Health and Safety 12 621 12 439 15 851 16 946 14 542 15 628 16 569Registration: Inspection and Enforcement Services
61 118 66 348 61 328 82 526 94 762 100 174 106 186
Compliance, Monitoring and Enforcement
173 340 199 193 240 942 274 600 301 179 321 314 340 707
Training of Staff: Inspection and Enforcement Services
2 626 1 447 2 797 3 166 4 704 4 647 4 926
Total 259 166 290 044 329 373 389 290 429 181 456 756 484 284Change to 2011 Budget estimate 2 564 1 771 3 579 3 916 Economic classification Current payments 257 934 289 610 328 588 389 091 429 128 456 700 484 225Compensation of employees 183 561 210 659 248 785 308 418 352 936 375 867 398 541Goods and services 74 373 78 951 79 803 80 673 76 192 80 833 85 684of which: Administrative fees – 17 524 866 331 295 307Advertising 4 426 1 465 144 290 563 707 750Assets less than the capitalisation threshold
367 619 392 409 985 1 039 1 093
Bursaries: Employees 511 399 251 581 1 115 1 225 1 299

Vote 18: Labour
11
Table 18.6 Inspection and Enforcement Services (continued) Audited outcome
Adjusted appropriation Medium-term expenditure estimate
R thousand 2008/09 2009/10 2010/11 2011/12 2012/13 2013/14 2014/15 Economic classification Current payments Catering: Departmental activities 855 1 274 809 1 229 1 167 1 136 1 203Communication 12 072 14 202 14 119 15 838 14 458 15 401 16 371Computer services 32 19 278 – – – –Consultants and professional services: Business and advisory services
135 1 716 1 242 396 713 777 824
Consultants and professional services: Infrastructure and planning
1 317 1 550 – – – – –
Consultants and professional services: Legal costs
17 13 69 44 – – –
Contractors 335 1 174 248 454 308 328 344Agency and support / outsourced services
3 520 1 129 501 696 1 011 1 079 1 146
Entertainment 15 24 29 87 45 45 47Fleet services (including government motor transport)
– – – 818 1 916 1 935 1 961
Inventory: Food and food supplies – 4 – 5 – – –Inventory: Fuel, oil and gas 168 154 318 5 – – –Inventory: Learner and teacher support material
28 12 2 14 – – –
Inventory: Materials and supplies 54 110 70 13 83 87 92Inventory: Medical supplies 1 1 – 1 – – –Inventory: Other consumables 554 798 2 614 1 807 802 848 899Inventory: Stationery and printing 4 668 4 085 2 737 3 367 5 933 6 715 7 110Lease payments 276 168 98 280 1 745 1 878 1 997Property payments 748 3 793 3 931 4 153 3 525 3 715 3 952Transport provided: Departmental activity
3 – – – – – –
Travel and subsistence 37 150 38 342 47 031 42 219 30 928 32 697 34 620Training and development 2 626 1 447 1 773 2 757 4 704 4 647 4 926Operating expenditure 417 1 200 923 1 033 1 143 1 301 1 382Venues and facilities 4 078 5 236 1 700 3 311 4 717 4 978 5 361Transfers and subsidies 1 106 418 429 199 53 56 59Households 1 106 418 429 199 53 56 59Payments for capital assets 126 16 356 – – – –Machinery and equipment 126 16 356 – – – –Total 259 166 290 044 329 373 389 290 429 181 456 756 484 284
Details of transfers and subsidies Households Other transfers to households Current 1 106 418 429 199 53 56 59Employee social benefits 1 106 418 429 199 53 56 59
Expenditure trends Over the medium term, this programme will focus on professionalising the inspectorate by enhancing capacity to effectively monitor and enforce compliance with legislation, through the employment of appropriately qualified and experienced inspectors to ensure that Decent Work principles are adhered to and that vulnerable workers are protected. Due to the professionalisation of the inspectorate, the number of posts is expected to increase from 1 316 in 2011/12 to 1 429 over the MTEF period. In 2010/11, 192 129 health and safety inspections were conducted at a cost of R240.9 million.
2012 Estimates of National Expenditure
12
Expenditure increased from R259.2 million in 2008/09 to R389.3 million in 2011/12, at an average annual rate of 14.5 per cent, due to increased spending on compensation of employees to retain labour inspectors by improving their remuneration. This also accounts for the 21 per cent increase in expenditure in the Compliance, Monitoring and Enforcement subprogramme between 2009/10 and 2010/11. In 2011/12, 90 additional inspector posts will be established to provide additional capacity in the inspectorate.
Over the medium term, expenditure is expected to grow from R389.3 million in 2011/12 to R484.3 million in 2014/15, at an average annual rate of 7.5 per cent, mainly due to additional allocations in the 2011 MTEF of R28 million in 2012/13 and R32 million in 2013/14 for the creation of new specialist inspector posts in the Occupational Health and Safety subprogramme. The bulk of the goods and services budget is spent on travelling costs for inspectors who have to visit workplaces, either for proactive or reactive inspections, to ensure a safe working environment. Fleet services, an expenditure item under goods and services, increases at an average annual rate of 33.8 per cent over the MTEF period. The fluctuation in fuel prices and the possible implementation of the tolled roads in Gauteng will influence the number of inspections that the inspectors will be able to conduct with available resources.
Consultants were appointed in 2011/12 to work on the second phase of the silicosis research study project for six months at a cost of R500 000, and to assess compliance with occupational health and safety measures in the high risk construction, agriculture, and iron and steel sectors, at a cost of R969 000. These consultants are paid from the Research, Policy and Planning subprogramme budget under the Labour Policy and Industrial Relations programme. Spending on consultants over the medium term is estimated at R2.3 million and they will assist with investigations into major health and safety incidents.
Programme 3: Public Employment Services Objectives and measures • Reduce unemployment by registering and placing unemployed people in decent work by:
– providing free recruitment and selection services for at least 70 per cent of reported government posts at levels 2 to 6 and selected positions in state owned enterprises and municipalities annually
– filling at least 50 per cent of job opportunities on the employment services database within 60 days of their registration on the system annually
– supporting a multi-pronged strategy to reduce youth unemployment on an ongoing basis through training and employment creation innovation programmes
– making and submitting recommendations to the Department of Home Affairs on migrant corporate and general work permit applications on an ongoing basis
– providing career counselling and employability enhancement programmes for 90 000 work seekers in 2012/13
– facilitating the employment of 100 people with disabilities per year by ensuring that service products (sheltered employment factories), orders and sales are increased by 30 per cent per year
– facilitating the achievement of employment equity targets for disability over the MTEF period by training 600 learners with disabilities per year for employment in the mainstream economy.
Subprogrammes • Management and Support Services: Public Employment Services manages delegated administrative and
financial responsibilities, coordinates all planning, monitoring and evaluation functions, and provides corporate support to line function subprogrammes. This subprogramme had a staff complement of 23, including senior managers in the Employer Services and Work Seeker Services subprogrammes. It had a budget of R25 million in 2011/12, of which 57.3 per cent was used for compensation of employees. No approved budget cuts have been made in this subprogramme.
• Employer Services facilitates the registering of vacancies and disseminates scarce skills information, issues immigrant corporate and work permits, records migrating skilled South Africans, oversees placements, responds to companies in distress, provides a social plan, and regulates private employment agencies. This subprogramme had a staff complement of 361 and a total budget of R141.5 million in 2011/12, of which

Vote 18: Labour
13
80.3 per cent was used for compensation of employees. In 2010/11, 675 private employment agencies were registered against a target of 1 031. In the same year, 1 907 employers were recruited to register on the Employment Services for South Africa database against a target of 1 000. Approved budget cuts of R329 000 in 2012/13 have been identified from venues and facilities and travel and subsistence.
• Work Seeker Services registers work seekers, retrenched workers, work vacancies, training and income generating opportunities on the employment services system, and facilitates access to employment and income generating opportunities for the unemployed and underemployed. This subprogramme had a staff complement of 197 and a total budget of R26.2 million in 2011/12, of which 93.8 per cent was used for compensation of employees. In 2010/11, 483 038 work seekers were registered on the Employment Services for South Africa database against a target of 652 611. In the same year, 31 per cent of the work seekers were assessed and profiled against a target of 50 per cent. Approved budget cuts of R330 000 has been identified in 2012/13 from travel and subsistence.
• Designated Groups Special Services facilitates the transfer of subsidies to national councils to promote the employment of people with disabilities, youth and women in collaboration with sheltered employment factories and other relevant bodies. This subprogramme has no staff complement and a total budget of R722 000 in 2011/12, which was transferred in full to the South African National Council for the Blind (R287 000), the Deaf Federation of South Africa (R235 000) and the National Council for Persons with Physical Disabilities in South Africa (R200 000). No approved budget cuts have been made in this subprogramme.
• Sheltered Employment Factories and Subsidies to Designated Workshops transfers funds to subsidised workshops for the blind and subsidised work centres for people with disabilities, and aims to improve the administration, production and financial control of sheltered employment factories and workshops. This subprogramme has no staff complement and a total budget of R59.8 million in 2011/12, which was transferred in full to non-profit institutions. No approved budget cuts have been made in this subprogramme.
• Productivity South Africa transfers funds to Productivity South Africa, which promotes improvements in workplace productivity and competitiveness. This subprogramme has no staff complement and a total budget of R34.1 million in 2011/12, which was transferred in full to the entity. In 2010/11, 13 533 jobs were saved against a target of 20 000. In the same year, 2 707 small, medium and micro enterprises (SMME) managers were trained against a target of 3 000. No approved budget cuts have been made in this subprogramme.
• Unemployment Insurance Fund provides for the possible future funding of the Unemployment Insurance Fund. This subprogramme has no staff complement and a total budget of R1 000 in 2011/12. No approved budget cuts have been made in this subprogramme.
• Compensation Fund provides for costs incurred through claims from civil servants for injuries sustained on duty or occupation related illnesses and diseases, and provides for the funding of claims from the Compensation Fund. This subprogramme has no staff complement and a total budget of R36.1 million in 2011/12, which was transferred in full to the Compensation Fund based on claims received. No approved budget cuts have been made in this subprogramme.
• Training of Staff: Public Employment Services facilitates training of staff within the programme to comply with the 1 per cent payroll Skills Development Levies Act (1999). This subprogramme has no staff complement and a total budget of R1.4 million in 2011/12. No approved budget cuts have been made in this subprogramme.

2012 Estimates of National Expenditure
14
Expenditure estimates Table 18.7 Public Employment Services Subprogramme
Audited outcome Adjusted
appropriation Medium-term expenditure estimate R thousand 2008/09 2009/10 2010/11 2011/12 2012/13 2013/14 2014/15 Management and Support Services: Public Employment Services
6 864 16 074 19 220 25 036 29 972 30 280 32 569
Employer Services 116 229 111 273 128 688 141 518 82 890 89 382 94 150Work Seeker Services 20 512 18 114 22 927 26 208 90 092 97 645 103 815Designated Groups Special Services 500 488 482 722 758 801 850Sheltered Employment Factories and Subsidies to Designated Workshops
105 571 80 330 76 943 59 766 66 747 70 290 74 573
Productivity South Africa 41 138 29 476 31 155 34 059 36 545 39 044 41 452Unemployment Insurance Fund – – – 1 1 1 1Compensation Fund 6 366 6 013 8 908 36 105 14 085 15 640 17 278Training of Staff: Public Employment Services
399 3 063 935 1 394 931 975 1 022
Total 297 579 264 831 289 258 324 809 322 021 344 058 365 710Change to 2011 Budget estimate 28 663 8 502 13 433 15 247 Economic classification Current payments 146 182 150 603 174 138 196 168 210 253 224 872 238 608Compensation of employees 111 688 109 771 138 703 154 397 180 163 192 432 204 222Goods and services 34 494 40 832 35 435 41 771 30 090 32 440 34 386of which: Administrative fees – – 133 8 – – –Advertising 492 110 88 211 742 779 818Assets less than the capitalisation threshold
509 508 879 1 950 407 427 448
Bursaries: Employees 100 145 96 219 220 230 243Catering: Departmental activities 872 986 464 1 885 697 731 767Communication 6 755 6 825 7 585 5 832 3 908 4 104 4 310Computer services 265 278 93 3 422 1 187 1 291 1 354Consultants and professional services: Business and advisory services
– – – 71 82 86 90
Contractors 203 191 224 984 21 22 23Agency and support / outsourced services
2 969 215 122 162 1 015 1 065 1 118
Entertainment 4 – 23 77 72 77 82Inventory: Fuel, oil and gas 118 55 56 26 10 11 12Inventory: Learner and teacher support material
– 1 1 – – – –
Inventory: Materials and supplies 26 26 43 5 5 6 7Inventory: Medical supplies 2 – 8 1 – – –Inventory: Other consumables 136 85 71 2 169 351 368 386Inventory: Stationery and printing 1 854 7 858 4 951 4 536 3 890 4 102 4 306Lease payments 201 188 208 730 1 862 1 955 2 052Property payments 634 2 414 2 751 1 877 1 055 1 107 1 163Transport provided: Departmental activity
37 – – 155 – – –
Travel and subsistence 16 044 14 364 15 164 10 973 9 096 10 224 11 311Training and development 399 3 063 900 2 074 931 975 1 022Operating expenditure 340 1 615 710 2 795 2 109 2 245 2 358Venues and facilities 2 534 1 905 865 1 609 2 430 2 635 2 516Transfers and subsidies 151 256 114 105 114 958 128 391 111 768 119 186 127 102Departmental agencies and accounts 47 504 35 489 40 063 70 165 50 631 54 685 58 731Non-profit institutions 103 276 78 317 74 817 58 195 61 104 64 466 68 334Households 476 299 78 31 33 35 37Payments for capital assets 141 123 162 250 – – –Machinery and equipment 141 123 162 250 – – –Total 297 579 264 831 289 258 324 809 322 021 344 058 365 710

Vote 18: Labour
15
Table 18.7 Public Employment Services (continued) Audited outcome Adjusted
appropriation Medium-term expenditure estimate
R thousand 2008/09 2009/10 2010/11 2011/12 2012/13 2013/14 2014/15 Details of transfers and subsidies
Departmental agencies and accounts Social security funds Current 6 366 6 013 8 908 36 106 14 086 15 641 17 279Unemployment Insurance Fund – – – 1 1 1 1Compensation Fund 6 366 6 013 8 908 36 105 14 085 15 640 17 278Departmental agencies and accounts Departmental agencies (non-business entities) Current 41 138 29 476 31 155 34 059 36 545 39 044 41 452Productivity South Africa 41 138 29 476 31 155 34 059 36 545 39 044 41 452Non-profit institutions Current 103 276 78 317 74 817 58 195 61 104 64 466 68 334Deaf Federation of South Africa 105 111 86 200 210 223 238National Council for the Physically Disabled
159 199 207 235 245 260 275
South African National Council for the Blind
236 178 189 287 303 318 337
Subsidised workshops for the blind 7 365 7 733 8 196 8 688 9 122 9 578 10 152Subsidised workcentres for the disabled 95 411 70 096 66 139 48 785 51 224 54 087 57 332Households Social benefits Current – – 12 – – – –Households – – 12 – – – –Households Other transfers to households Current 476 299 66 31 33 35 37Employee social benefits 476 299 66 31 33 35 37
Expenditure trends The spending focus over the MTEF period will be on: strengthening the employment services system; enhancing capacity in order to implement the Employment Services Bill; registering work seekers to enhance support for government’s multi-pronged strategy to reduce youth unemployment and increase job creation; and facilitating placement in decent job opportunities or making referrals to other departmental beneficiary services.
In 2010/11, the Employer Services subprogramme spent R128.7 million to process 178 applications for migrant and corporate work permits, of which 115 were approved and 63 disapproved; register work opportunities from 1 907 companies; register 675 private employment agencies; and enhance the capacity of the subprogramme to deliver effective and efficient employer services.
Spending over the seven-year period is expected to grow from R297.6 million in 2008/09 to R365.7 million in 2014/15, at an average annual rate of 3.0 per cent. Spending in the Compensation Fund subprogramme grew at an average annual rate of 78.3 per cent between 2008/09 and 2011/12, due to a once-off additional allocation of R26.5 million in 2011/12 to fund the administration costs of increased public servant claims for injuries, illness and diseases contracted while on duty.
In 2010/11, one consultant was appointed as the acting chief financial officer for the sheltered employment factories at a cost of R463 752 and was paid from the transfer to the sheltered employment factories. Spending on consultants over the medium term is estimated at R258 000 for capacity building to ensure the effective implementation of the Employment Services Bill.
2012 Estimates of National Expenditure
16
Programme 4: Labour Policy and Industrial Relations Objectives and measures • Improve the status of vulnerable workers by:
– reviewing 16 sectoral determinations on appropriate minimum wages and conditions of employment by March 2015
– investigating the feasibility of establishing a medical aid scheme for the private security sector by March 2013
– investigating the feasibility of establishing provident funds for the domestic worker and farm worker sectors by March 2013 to bring them in line with other sectors.
• Address income disparities along racial and gender lines through: – promoting the relevant provisions of the Employment Equity Act (1998) by endorsing the principle of
equal pay for work of equal value across all occupational levels of the workforce in the labour market – assisting employers in identifying income disparities by conducting 7 income differential assessments
per quarter. • managing the implementation of the Labour Relations Act (1995) by annually extending collective
agreements and registering labour organisations within 90 days of receiving a completed application.
Subprogrammes • Management and Support Services: Labour Policy and Industrial Relations manages delegated
administrative and financial responsibilities; coordinates all planning, monitoring and evaluation functions; and provides corporate support to line function subprogrammes. This subprogramme had a staff complement of 18 and a total budget of R10.3 million in 2011/12, of which 67.8 per cent was used for compensation of employees. No approved budget cuts have been made in this subprogramme.
• Strengthen Civil Society makes transfers to various civil society organisations that provide resources, support and expertise to improve the independence and self-reliance of workers and employers, with the aim of strengthening the capacity of workers and employers to contribute to a stable and smoothly functioning labour market. This subprogramme has no staff complement and a budget of R15.1 million in 2011/12, which was transferred in full to civil society organisations, including R2.2 million to the Workers’ College KwaZulu-Natal and R8.4 million to the Ditsela Workers' Education Institute. No approved budget cuts have been made in this subprogramme.
• Collective Bargaining manages the implementation of the Labour Relations Act (1995) through developing policies and practices that promote sound labour relations. This subprogramme had a staff complement of 31 and a total budget of R11.1 million in 2011/12, of which 84 per cent was used for compensation of employees. In 2010/11, 38 new applications for registrations by labour organisations were processed and 15 collective agreements were extended. No approved budget cuts have been made in this subprogramme.
• Employment Equity promotes equity in the labour market through improving the enforcement of the Employment Equity Act (1998). This subprogramme had a staff complement of 20 and a total budget of R12.2 million in 2011/12, of which 45.5 per cent was spent on compensation of employees. The balance of the allocation is used to publish employment equity compliance information and market the employment equity online reporting facility. In 2010/11, follow-up visits were conducted on 61 Johannesburg Stock Exchange listed companies for substantive compliance with the act, against a target of 60, and letters sent regarding measures to address income differentials. An approved budget cut of R236 000 in 2012/13 has been identified from venues and facilities.
• Employment Standards protects vulnerable workers in the labour market by administering the Basic Conditions of Employment Act (1997). This subprogramme had a staff complement of 17 and a total budget of R11.9 million in 2011/12, of which 47.9 per cent was used for compensation of employees, while 52.1 per cent was used to establish and review sectoral determinations, administer the act and protect children from labour exploitation. In 2010/11, 6 out of 8 sectoral determinations were reviewed for the civil engineering, hospitality, general learnerships, taxi, contract cleaning and domestic sectors at a cost of R2.1 million, resulting in improved conditions of employment for workers in these sectors. Cost saving
Vote 18: Labour
17
measures will be introduced by conducting public hearings for more than one sector at the same time, thereby reducing travel and accommodation costs. Further cost saving measures will include reduced communications activities. In 2010/11, savings of R113 500 were realised due to these interventions and have been reprioritised to publishing labour regulations for children between 15 and 18. No approved budget cuts have been made in this subprogramme.
• Commission for Conciliation, Mediation and Arbitration transfers funds to the Commission for Conciliation, Mediation and Arbitration, which promotes fairness in the workplace through dispute prevention and dispute resolution services. This subprogramme has no staff complement and a total budget of R448.1 million in 2011/12, which was transferred in full to the commission. No approved budget cuts have been made in this subprogramme.
• Research, Policy and Planning supports policy formulation and the drafting of legislation in the department through conducting research, manages commissioned research projects, monitors and evaluates working conditions and policies affecting the labour market in South Africa and elsewhere, and identifies relevant labour market interventions and policy options. This subprogramme had a staff complement of 9 and a total budget of R15.2 million in 2011/12, of which 28.5 per cent was used for compensation of employees and 71.2 per cent was used for goods and services. In 2010/11, 3 research agenda projects were concluded, at a cost of R3.5 million: an assessment of registration, recruitment and selection services in Employment Services for South Africa; an Unemployment Insurance Fund client satisfaction survey; and a report on non-compliance with the Unemployment Insurance Act (2001) in the taxi, domestic and catering sectors. The projects have been completed and reports presented to the Minister of Labour. No approved budget cuts have been made in this subprogramme.
• Labour Market Information and Statistics collects, collates analyses, disseminates internal and external labour market statistics about changes in the South African labour market that impact on legislation, and triggers further research. This subprogramme had a staff complement of 100 and a total budget of R31.1 million in 2011/12, of which 80 per cent was used for compensation of employees. In 2010/11, 3 additional statistical officials joined the unit on a contract basis until 2013. They completed statistical training at the International Labour Organisation in Geneva, Switzerland at no cost to the department. The three officials are tasked with compiling the statistical yearbook using the department’s administrative data. The first report is expected by March 2012. They are responsible for monitoring provincial data processing and will also contribute to the development of the annual labour market bulletin to be released in September 2012. No approved budget cuts have been made in this subprogramme.
• International Labour Matters facilitates bilateral and multilateral cooperation between the department and its partners internationally to exchange information and best practices on labour market issues. This subprogramme had a staff complement of 16 and a total budget of R25.3 million in 2011/12, of which 27.6 per cent was used for compensation of employees, while 40.3 per cent was transferred to the International Labour Organisation (R9.6 million) and the African Regional Labour Administration Centre for South Africa’s (R634 000) for membership fees. A key achievement has been the co-hosting of the 12th International Labour Organisation African Regional Meeting, which took place in October 2011 at the Sandton Convention Centre in Johannesburg, at a cost of R2 million. The objectives of the meeting were to plan for South Africa to meet its Decent Work country programme commitments, and to set out future priority actions for the region to promote the Decent Work agenda in Africa. No approved budget cuts have been made in this subprogramme.
• National Economic Development and Labour Council transfers funds to the National Economic Development and Labour Council, which promotes economic growth, participation in economic decision making and social equity. This subprogramme had a staff complement of 1 and a total budget of R24.5 million, of which 97.7 per cent was transferred to the council. No approved budget cuts have been made in this subprogramme.

2012 Estimates of National Expenditure
18
Expenditure estimates Table 18.8 Labour Policy and Industrial Relations Subprogramme
Audited outcome Adjusted
appropriation Medium-term expenditure estimate R thousand 2008/09 2009/10 2010/11 2011/12 2012/13 2013/14 2014/15 Management and Support Services: Labour Policy and Industrial Relations
8 078 8 503 8 467 10 293 11 315 11 928 12 634
Strengthen Civil Society 15 903 13 795 14 379 15 063 15 802 16 671 17 671Collective Bargaining 9 321 9 525 9 746 11 052 12 031 12 569 13 323Employment Equity 15 440 10 154 9 656 12 229 12 637 13 584 14 401Employment Standards 8 173 7 723 6 506 11 909 12 791 13 497 14 308Commission for Conciliation, Mediation and Arbitration
261 710 356 442 402 017 448 104 476 697 509 384 540 335
Research, Policy and Planning 4 785 8 497 12 345 15 184 15 207 16 059 17 026Labour Market Information and Statistics
22 399 22 375 26 403 31 143 32 450 34 196 36 249
International Labour Matters 22 407 17 655 19 338 25 333 22 337 23 564 24 980National Economic Development and Labour Council
14 327 19 993 16 342 24 519 24 651 26 213 27 789
Total 382 543 474 662 525 199 604 829 635 918 677 665 718 716Change to 2011 Budget estimate 3 471 3 372 6 175 6 937 Economic classification Current payments 79 496 75 210 82 168 107 050 108 500 114 664 121 544Compensation of employees 44 619 47 975 54 577 64 378 66 707 70 225 74 439Goods and services 34 877 27 235 27 591 42 672 41 793 44 439 47 105of which: Administrative fees 88 12 225 294 296 314 333Advertising 10 607 4 719 3 271 7 165 7 536 7 967 8 447Assets less than the capitalisation threshold
64 334 101 161 260 275 291
Bursaries: Employees 4 – 3 – 123 130 138Catering: Departmental activities 242 207 139 1 382 237 251 267Communication 1 467 1 328 1 788 1 642 1 573 1 663 1 764Computer services 131 142 1 516 1 818 850 899 953Consultants and professional services: Business and advisory services
265 202 7 277 9 837 9 898 10 466 11 096
Consultants and professional services: Legal costs
– 1 056 129 15 232 245 260
Contractors 257 45 85 410 135 143 151Agency and support / outsourced services
1 882 1 748 72 13 17 18 20
Entertainment 19 39 40 37 74 78 84Inventory: Fuel, oil and gas 57 7 28 18 185 196 207Inventory: Learner and teacher support material
24 86 39 186 325 344 365
Inventory: Materials and supplies 14 3 34 9 14 15 16Inventory: Medical supplies 1 – – – – – –Inventory: Other consumables 36 63 33 43 184 195 207Inventory: Stationery and printing 2 897 3 570 2 797 3 824 3 215 3 398 3 602Lease payments 909 455 507 974 1 078 1 141 1 209Property payments 228 1 895 394 274 902 953 1 011Travel and subsistence 11 482 8 445 7 642 9 178 9 858 10 422 11 051Training and development 1 135 773 789 1 118 1 247 1 319 1 389Operating expenditure 281 773 285 374 421 445 472Venues and facilities 2 787 1 333 397 3 900 3 133 3 562 3 772
Vote 18: Labour
19
Table 18.8 Labour Policy and Industrial Relations (continued) Audited outcome Adjusted
appropriation Medium-term expenditure estimate
R thousand 2008/09 2009/10 2010/11 2011/12 2012/13 2013/14 2014/15 Economic classification Transfers and subsidies 302 686 399 280 442 967 497 422 527 285 562 962 597 131Departmental agencies and accounts 275 669 375 996 417 885 472 019 500 761 534 979 567 469Foreign governments and international organisations
10 377 8 618 10 703 10 211 10 722 11 312 11 991
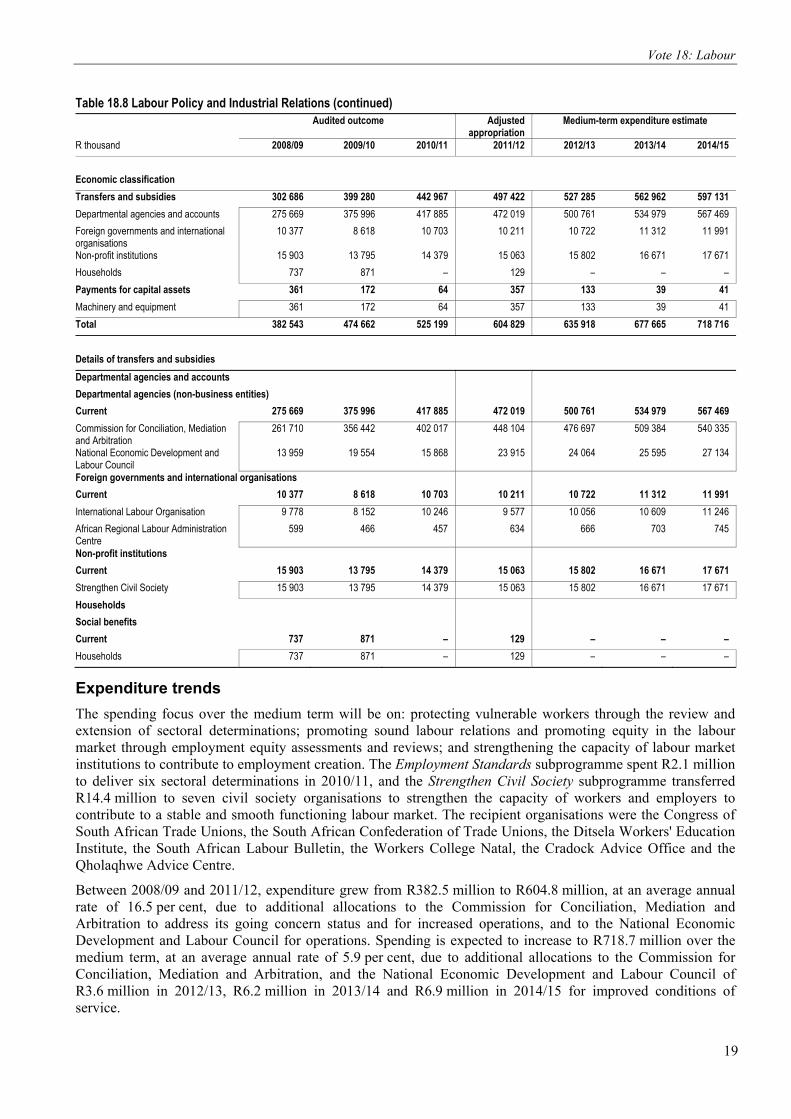
Non-profit institutions 15 903 13 795 14 379 15 063 15 802 16 671 17 671Households 737 871 – 129 – – –Payments for capital assets 361 172 64 357 133 39 41Machinery and equipment 361 172 64 357 133 39 41Total 382 543 474 662 525 199 604 829 635 918 677 665 718 716
Details of transfers and subsidies Departmental agencies and accounts Departmental agencies (non-business entities) Current 275 669 375 996 417 885 472 019 500 761 534 979 567 469Commission for Conciliation, Mediation and Arbitration
261 710 356 442 402 017 448 104 476 697 509 384 540 335
National Economic Development and Labour Council
13 959 19 554 15 868 23 915 24 064 25 595 27 134
Foreign governments and international organisations Current 10 377 8 618 10 703 10 211 10 722 11 312 11 991International Labour Organisation 9 778 8 152 10 246 9 577 10 056 10 609 11 246African Regional Labour Administration Centre
599 466 457 634 666 703 745
Non-profit institutions Current 15 903 13 795 14 379 15 063 15 802 16 671 17 671Strengthen Civil Society 15 903 13 795 14 379 15 063 15 802 16 671 17 671Households Social benefits Current 737 871 – 129 – – –Households 737 871 – 129 – – –
Expenditure trends The spending focus over the medium term will be on: protecting vulnerable workers through the review and extension of sectoral determinations; promoting sound labour relations and promoting equity in the labour market through employment equity assessments and reviews; and strengthening the capacity of labour market institutions to contribute to employment creation. The Employment Standards subprogramme spent R2.1 million to deliver six sectoral determinations in 2010/11, and the Strengthen Civil Society subprogramme transferred R14.4 million to seven civil society organisations to strengthen the capacity of workers and employers to contribute to a stable and smooth functioning labour market. The recipient organisations were the Congress of South African Trade Unions, the South African Confederation of Trade Unions, the Ditsela Workers' Education Institute, the South African Labour Bulletin, the Workers College Natal, the Cradock Advice Office and the Qholaqhwe Advice Centre.
Between 2008/09 and 2011/12, expenditure grew from R382.5 million to R604.8 million, at an average annual rate of 16.5 per cent, due to additional allocations to the Commission for Conciliation, Mediation and Arbitration to address its going concern status and for increased operations, and to the National Economic Development and Labour Council for operations. Spending is expected to increase to R718.7 million over the medium term, at an average annual rate of 5.9 per cent, due to additional allocations to the Commission for Conciliation, Mediation and Arbitration, and the National Economic Development and Labour Council of R3.6 million in 2012/13, R6.2 million in 2013/14 and R6.9 million in 2014/15 for improved conditions of service.

2012 Estimates of National Expenditure
20
Between 2008/09 and 2011/12, this programme used 57 consultants for 30 projects at an estimated total cost of R18.8 million. The projects included: evaluating the impact of sectoral determinations in addressing the plight of vulnerable workers; assessing compliance with occupational health and safety in three high risk sectors; assessing the impact of the second national skills development strategy; monitoring non-compliance with the unemployment insurance act; providing legal advice on the practice of labour broking; reviewing labour law; and drafting amendments to three pieces of labour legislation.
Spending on consultants over the medium term is projected at R32.2 million. These consultants will work on: investigating the unskilled labour and taxi sectors, determining the impact of sectoral determinations in addressing the plight of vulnerable workers, analysing the survey on activities of young people; conducting a research seminar on the labour legislative environment, developing a worker cooperatives support strategy, conducting a research seminar on the informal economy and the impact of employment equity since its inception, assessing compliance with occupational health and safety in the high risk construction, agriculture and iron and steel sectors; evaluating bargaining council pension and provident funds; assessing the impact of the second national skills development strategy; and researching noise induced hearing loss.
Public entities and other agencies Unemployment Insurance Fund
Overview: 2008/09 – 2014/15 The Unemployment Insurance Fund contributes to the alleviation of poverty in South Africa by providing short term unemployment insurance to all workers who qualify for unemployment related benefits as legislated in the Unemployment Insurance Act (2001) as amended. The fund is financed by contributions from employees and employers as legislated in the Unemployment Insurance Contributions Act (2002).
The fund’s strategic and policy approach is derived from the Minister of Labour’s Programme of Action and policy directives from the Department of Labour. Key priorities for the short to medium term include: re-integrating unemployed workers into the labour market; assisting in job-creation; restructuring of Unemployment Insurance Fund benefits and coverage; combating fraud and corruption; improving the capacity and efficacy of the fund; improving service delivery, revenue inflows and customer awareness and satisfaction; funding poverty alleviation schemes; improving governance; strengthening the institutional capacity of the fund; and encouraging compliance through enhanced service delivery and improving stakeholder relations.
As mandated by section 48(1)(a)(iv) of the Unemployment Insurance Act (2001), the fund will establish partnerships to identify projects that can alleviate the harmful effects of unemployment by creating or retaining jobs, providing social plans to stabilise employers, and placing unemployed workers. The fund has committed R1.2 billion to the training layoff scheme managed by the Commission for Conciliation, Mediation and Arbitration. In terms of the training and social plan funding, funds will be utilised to skill the unemployed in general and the Fund’s unemployment beneficiaries in order to improve their chances of reintegration into employment.
Performance In 2010/11, the fund registered 69 701 new employers on its database, raising the total number of employers to 1 350 651. In addition, the fund added 162 049 employees to its database, raising the total to 7 919 290 registered employees. Through the improvement of the fund’s business processes and communication drive, a benefit approval rate of 97.4 per cent was obtained. By 2014/15, the fund aims to process 90 per cent of claims received within 90 days of receiving the claim compared to 73 per cent finalised in 2010/11. In 2010/11, the fund placed 47 per cent of beneficiaries of the mandated social responsibility investment programmes in job creation projects and aims to place 90 per cent by 2014/1. The fund designed an additional 9 schemes over the medium term to re-integrate the unemployed back into employment.
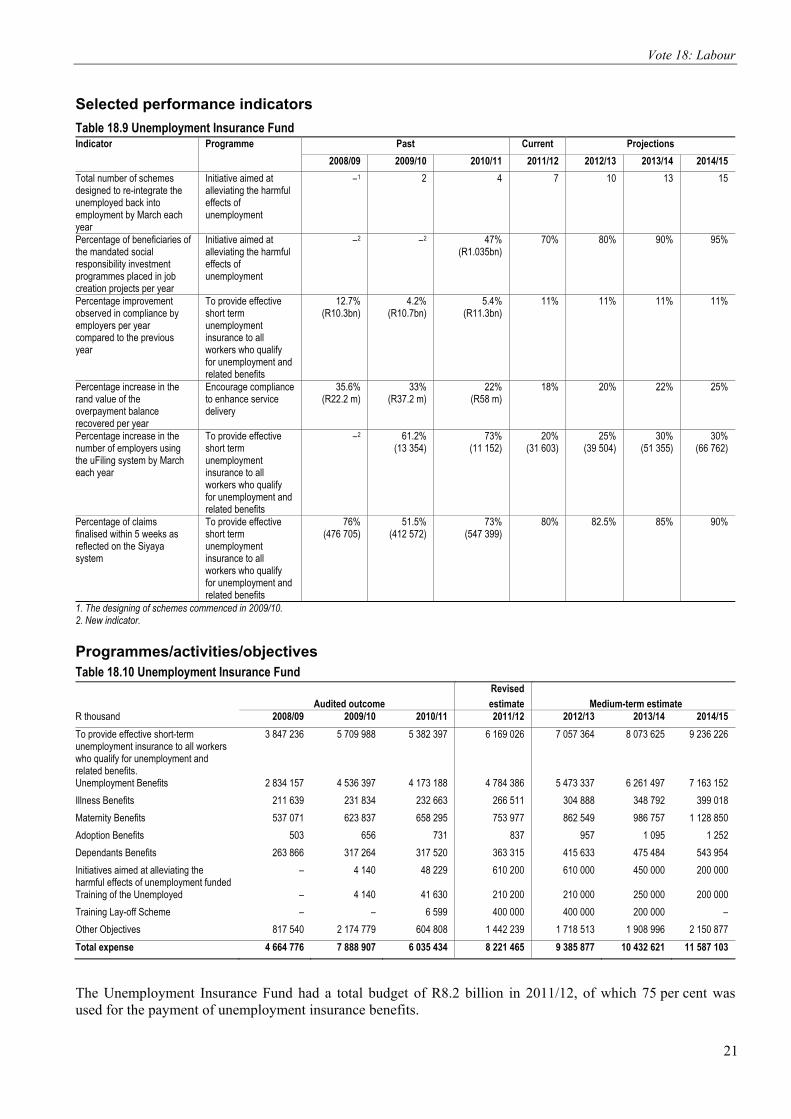
Vote 18: Labour
21
Selected performance indicators Table 18.9 Unemployment Insurance Fund Indicator Programme Past Current Projections 2008/09 2009/10 2010/11 2011/12 2012/13 2013/14 2014/15 Total number of schemes designed to re-integrate the unemployed back into employment by March each year
Initiative aimed at alleviating the harmful effects of unemployment
–1 2 4 7 10 13 15
Percentage of beneficiaries of the mandated social responsibility investment programmes placed in job creation projects per year
Initiative aimed at alleviating the harmful effects of unemployment
–2 –2 47%(R1.035bn)
70% 80% 90% 95%
Percentage improvement observed in compliance by employers per year compared to the previous year
To provide effective short term unemployment insurance to all workers who qualify for unemployment and related benefits
12.7%(R10.3bn)
4.2% (R10.7bn)
5.4% (R11.3bn)
11%
11%
11%
11%
Percentage increase in the rand value of the overpayment balance recovered per year
Encourage compliance to enhance service delivery
35.6%(R22.2 m)
33%(R37.2 m)
22% (R58 m)
18%
20%
22%
25%
Percentage increase in the number of employers using the uFiling system by March each year
To provide effective short term unemployment insurance to all workers who qualify for unemployment and related benefits
–2 61.2%(13 354)
73% (11 152)
20%(31 603)
25% (39 504)
30%(51 355)
30%(66 762)
Percentage of claims finalised within 5 weeks as reflected on the Siyaya system
To provide effective short term unemployment insurance to all workers who qualify for unemployment and related benefits
76% (476 705)
51.5%(412 572)
73% (547 399)
80% 82.5% 85% 90%
1. The designing of schemes commenced in 2009/10. 2. New indicator.
Programmes/activities/objectives Table 18.10 Unemployment Insurance Fund
Revised Audited outcome estimate Medium-term estimate
R thousand 2008/09 2009/10 2010/11 2011/12 2012/13 2013/14 2014/15 To provide effective short-term unemployment insurance to all workers who qualify for unemployment and related benefits.
3 847 236 5 709 988 5 382 397 6 169 026 7 057 364 8 073 625 9 236 226
Unemployment Benefits 2 834 157 4 536 397 4 173 188 4 784 386 5 473 337 6 261 497 7 163 152Illness Benefits 211 639 231 834 232 663 266 511 304 888 348 792 399 018Maternity Benefits 537 071 623 837 658 295 753 977 862 549 986 757 1 128 850Adoption Benefits 503 656 731 837 957 1 095 1 252Dependants Benefits 263 866 317 264 317 520 363 315 415 633 475 484 543 954Initiatives aimed at alleviating the harmful effects of unemployment funded
– 4 140 48 229 610 200 610 000 450 000 200 000
Training of the Unemployed – 4 140 41 630 210 200 210 000 250 000 200 000Training Lay-off Scheme – – 6 599 400 000 400 000 200 000 –Other Objectives 817 540 2 174 779 604 808 1 442 239 1 718 513 1 908 996 2 150 877Total expense 4 664 776 7 888 907 6 035 434 8 221 465 9 385 877 10 432 621 11 587 103
The Unemployment Insurance Fund had a total budget of R8.2 billion in 2011/12, of which 75 per cent was used for the payment of unemployment insurance benefits.

2012 Estimates of National Expenditure
22
Savings and cost effectiveness measures The fund realised savings of R44 million on administrative expenditure, R86 million on operating expenditure and R83.9 million on employee costs, mainly as a result of initiatives implemented to reduce air travel, the use of car rental and accommodation, and the number of meetings and hence catering costs. Savings were also realised through the implementation of the South African Post Office contract to print and distribute various letters in bulk. Savings over the medium term as a result of these measures is estimated at R204 million.
Expenditure estimates Table 18.11 Unemployment Insurance Fund Statement of financial performance Revised
Audited outcome estimate Medium-term estimate R thousand 2008/09 2009/10 2010/11 2011/12 2012/13 2013/14 2014/15 Revenue Non-tax revenue 3 528 559 4 099 527 4 293 094 3 797 940 4 250 207 4 670 083 5 038 592Sale of goods and services other than capital assets
2 024 2 282 2 250 3 570 3 298 2 429 2 550
of which: Sales by market establishments 2 015 2 094 2 212 1 973 2 078 2 192 2 302Other sales 9 188 38 1 597 1 220 237 248Other non-tax revenue 3 526 535 4 097 245 4 290 844 3 794 370 4 246 909 4 667 654 5 036 042Transfers received 10 223 924 10 643 021 11 204 252 12 007 715 12 828 532 13 509 396 14 226 839Total revenue 13 752 483 14 742 548 15 497 346 15 805 655 17 078 739 18 179 479 19 265 431Expenses Current expense 757 532 848 049 1 017 898 1 377 530 1 466 985 1 530 367 1 604 589Compensation of employees 349 014 416 734 515 009 704 676 746 960 788 043 827 445Goods and services 405 091 426 584 497 307 666 429 710 535 734 234 771 143Depreciation 3 400 4 723 5 582 6 418 9 478 8 077 5 988Interest, dividends and rent on land 27 8 – 7 12 13 13Transfers and subsidies 3 907 244 7 040 858 5 017 536 6 843 935 7 918 892 8 902 254 9 982 514Total expenses 4 664 776 7 888 907 6 035 434 8 221 465 9 385 877 10 432 621 11 587 103Surplus / (Deficit) 9 087 707 6 853 641 9 461 912 7 584 190 7 692 862 7 746 858 7 678 328
Expenditure trends Over the medium term, the fund will focus its spending on: implementing poverty alleviation schemes to assist unemployed workers registered on the fund’s database; strengthening the institutional capacity of the fund; and encouraging compliance by employers through advocacy, enhanced service delivery and improved stakeholder relations and reforms to the unemployment insurance scheme.
The fund generates approximately 74 per cent of its revenue from unemployment contributions and 26 per cent from non-tax revenue, with the latter driven by interest on investments. Total revenue is expected to grow from R13.8 billion in 2008/09 to R19.3 billion in 2014/15, at an average annual rate of 4.9 per, due to an anticipated increase in fund contributors as the economy recovers.
Expenditure grew from R4.7 billion in 2008/09 to R8.2 billion in 2011/12, at an average annual rate of 20.8 per cent, and is expected grow to R11.6 billion in 2014/15, at an average annual rate of 12.1 per cent over the medium term. This is as a result of an increase in expenditure in compensation of employees due to the appointment of payroll auditors, general salary adjustments, the decentralisation of staff for functions in the provinces, the organisational restructuring of the fund, and an increase in transfers and subsidies paid to the fund’s beneficiaries. The latter increases are based on actuarial reports, and labour and economic trends. The increased expenditure on additional staff and premises at the additional number of service delivery sites will strengthen capacity and improve delivery.
The 34 per cent increase in spending on goods and services in 2011/12 was mainly due to the additional R36 million that the fund has budgeted for lease payments for additional office premises in the provinces. Unemployment insurance claims paid, which are reflected in transfers and subsidies expenditure, grew from R3.9 billion in 2008/09 to R6.8 billion in 2011/12, at an average annual rate of 20.5 per cent, due to increased

Vote 18: Labour
23
retrenchments arising from the global economic crisis. This trend is expected to continue over the medium term with spending increasing at a slower average annual rate of 13.4 per cent as global economies begin to recover. The fund fulfilled its mandate in 2010/11 and paid R5.3 billion in claims to 732 158 beneficiaries of which:
• R4.1 billion was paid to 578 266 claimants for unemployment benefits • R232 million was paid to 22 727 claimants for illness benefits • R659 million was paid to 104 042 claimants for maternity and adoption benefits • R317 million was paid to 27 123 claimants for dependant benefits. Over the medium term, the fund estimates to spend R26.8 billion on providing unemployment, illness, maternity and adoption benefits, and illness benefits.
Personnel information Table 18.12 Unemployment Insurance Fund
Personnel post status as at 30 September 2011 Number of personnel posts filled/planned for on funded establishmentNumber of
posts on approved
establishment
Number of funded posts
Number of vacant
posts Actual Mid-year1 Medium-term estimate2008/09 2009/10 2010/11 2011/12 2012/13 2013/14 2014/15
Executive management 1 1 – 1 1 1 1 1 1 1Senior management 11 11 4 9 9 8 7 14 17 17Middle management 26 26 3 22 21 25 23 30 35 40Professionals 47 47 4 42 44 43 43 53 58 65Skilled 100 100 9 78 81 89 91 100 115 130Semi-skilled 257 257 7 218 235 249 250 260 280 295Very low skilled 13 13 2 10 10 10 11 12 11 11Total 455 455 29 380 401 425 426 470 517 559Compensation (R thousand) 349 014 416 734 515 009 704 676 746 960 788 043 827 445Unit cost (R thousand) 918 1 039 1 212 1 654 1 589 1 524 1 4801. As at 30 September 2011.
As at the 30 September 2011, the entity had an establishment of 455 posts, all of which were funded. The number of filled posts increased from 380 in 2008/09 to 426 in 2011/12, and is expected to grow to 559 in 2014/15. This growth is as a result of the fund’s organisational restructuring to align its structure with its key business processes, taking into account the decentralisation drive to improve service delivery and the implementation of the virtual office concept.
There were 29 vacancies within the fund, of which 2 were at the very low skilled level, 7 in the semi-skilled level, 9 at the skilled level, 4 in the professional level and 7 in management. These posts remain vacant pending the finalisation of the organisational restructuring process.
The fund has budgeted R157.1 million over the medium for consultants to provide risk advisory services and policy development, security services, asset software, forensic audit, internal audit, change management, specialised recruitment and the verification of qualifications, and financial year-end technical support. The ratio of support staff to line function staff is 1:1.1. This figure includes vacancies created as employees leave the fund and others are promoted within the fund.
Compensation Fund
Overview: 2008/09 – 2014/15 The Compensation Fund administers the Compensation for Occupational Injuries and Diseases Act (1993). The fund’s main objective is to provide compensation for disability, illness and death resulting from occupational injuries and diseases. The fund derives its revenue from levies paid by employers, which consists mainly of annual assessments paid by registered employers on the basis of a percentage or fixed rate of the annual earnings of their employees. The act, however, makes provision for a minimum assessment to ensure that the assessment is not less than the administration costs incurred.

2012 Estimates of National Expenditure
24
Over the past few years, good progress has been made in reducing the service delivery challenges experienced by the fund and its clients. To this end, the fund has improved services to beneficiaries by shortening the turnaround time and improving access for beneficiaries, as well as improving communication with stakeholders. To meet its key strategic priority of efficiently and effectively providing compensation for occupational related injuries, diseases and death and (of improving the health profile of the nation), the fund will focus on the following initiatives:
• intensifying the implementation of the rehabilitation and reintegration policy framework • enlisting the help of tracing agents to contact injured employees and dependants, and obtain outstanding
information to finalise claims. (This will reduce the number of outstanding claims in the funds operations.) • conducting a study on all employees on pension and those who require prosthetic devices, in order to
compile a database for the fund. Performance The fund registered 215 493 claims in 2010/11, of which 144 081 or 67 per cent were finalised. The remaining 33 per cent are claims where the medical condition of the employee has not stabilised, and will only be assessed in the next financial year as per the Compensation for Occupational Injuries and Diseases Act (1993). Although there were fewer payments made in 2010/11 (329 091 compared to 340 159 in 2009/10), the Rand value of claims processed for the year was 4 per cent higher than 2009/10 at R801.7 million. This was due to the Compensation Board reviewing existing benefits and recommending increases in a number of benefits such as the caregiver’s allowance for pensioners and maximum funeral benefits.
In December 2010, the fund piloted the decentralisation of certain claims functions to the remaining five provinces (Gauteng, Western Cape, Northern Cape, North West and Mpumalanga). This has resulted in an increase in the number of claims processed from 143 867 in first 6 months of 2009/10 claims to 165 612 in equivalent period in 2010/11, a 20 per cent increase. A draft organisational structure has been finalised, which will facilitate the process of redeploying staff permanently to the provinces. More medical professionals will be employed on a sessional basis to support the processing in provinces. The development and implementation of a new integrated claims management system has been accelerated. These initiatives will result in a large increase in the number of claims received, processed and finalised, and is reflected in the increase in targets over the MTEF period. The year-on-year increases in the number of employers registered is due in part to better cooperation with the Companies and Intellectual Property Commission, the South African Revenue Service and the Unemployment Insurance Fund, through the integrated customer data project. The increase in the number of employers registered for assessment for contributions, and the concomitant growth in assessment revenue, is attributable to increased advocacy and information road shows, and more effective administration and collection of the assessment fees and any penalties.

Vote 18: Labour
25
Selected performance indicators Table 18.13 Compensation Fund Indicator Programme/Activity/Objective Past Current Projections
2008/09 2009/10 2010/11 2011/12 2012/13 2013/14 2014/15Number of new claims registered per year
Compensation claims/ Compensation for Occupational Injuries and Diseases Act
203 711 200 559 215 493 449 742 472 229 661 121 700 788
Percentage of registered claims finalised per year
Compensation claims/ Compensation for Occupational Injuries and Diseases Act
70% (158 481)
60% (143 066)
67% (144 081)
33% (148 403)
75% (354 172)
77% (509 063)
82% (574 656)
Percentage of medical claims finalised per year within a three month period
Medical claims 70% (203 761)
70% (195 312)
64% (226 382)
45% (107 475)
70% (250 775)
75% (263 313)
80% (276 479)
Percentage growth in assessment revenue per year
Administration/Operations 100%(R4.5 billion)
7%(R4 billion)
20%(R4.8 billion)
4%(R5 billion)
9% (R5.4 billion)
10%(R6 billion)
10%(R6.6 billion)
Percentage increase in the number of registered employers
Administration/Operations 6%(380 244)
5%(400 355)
5%(422 371)
5%(443 490)
5% (465 664)
5%(488 947)
5%(513 395)
Programmes/activities/objectives Table 18.14 Compensation Fund
Revised Audited outcome estimate Medium-term estimate
R thousand 2008/09 2009/10 2010/11 2011/12 2012/13 2013/14 2014/15 Administration / Operations 287 835 345 377 401 730 498 587 633 682 660 881 685 762Compensation claims / Compensation for Occupational Injuries and Diseases Act (1993)
3 041 230 2 736 153 2 129 640 1 947 285 1 607 329 1 773 487 1 907 053
Medical claims 2 114 053 1 826 084 1 362 624 1 639 487 2 178 302 2 164 587 2 189 522Total expense 5 443 118 4 907 614 3 893 994 4 085 359 4 419 313 4 598 955 4 782 338
The Compensation Fund had a total budget of R4.1 billion in 2011/12, of which 87.8 per cent was used for the payment of claims for occupational injuries, illnesses and diseases.
Savings and cost effectiveness measures The Compensation Fund is currently working on cost cutting measures, especially in administrative expenses. These include reducing the number of meetings, scheduling meetings in offices to avoid travel, and disconnecting telephone lines after 16h00. The decentralisation project pilot to provinces is expected to reduce costs in future by minimising travel cost as staff will be permanently deployed in the provinces.
Expenditure estimates Table 18.15 Compensation Fund Statement of financial performance Revised
Audited outcome estimate Medium-term estimate R thousand 2008/09 2009/10 2010/11 2011/12 2012/13 2013/14 2014/15 Revenue Non-tax revenue 2 580 358 2 725 943 2 671 361 2 784 005 2 903 275 3 031 133 3 168 890Other non-tax revenue 2 580 358 2 725 943 2 671 361 2 784 005 2 903 275 3 031 133 3 168 890Transfers received 4 035 398 4 491 623 4 865 989 5 206 608 5 571 071 5 961 046 6 378 319Total revenue 6 615 756 7 217 566 7 537 350 7 990 613 8 474 346 8 992 179 9 547 209

2012 Estimates of National Expenditure
26
Table 18.15 Compensation Fund (continued)
Statement of financial performance Revised Audited outcome estimate Medium-term estimate
R thousand 2008/09 2009/10 2010/11 2011/12 2012/13 2013/14 2014/15 Expenses Current expense 439 847 610 129 674 686 737 279 937 309 977 671 1 016 203Compensation of employees 129 985 152 483 184 653 203 025 342 526 359 653 374 038Goods and services 304 757 445 079 486 255 530 306 590 658 613 708 637 662Depreciation 5 058 3 267 1 834 1 926 2 022 2 123 2 229Interest, dividends and rent on land 47 9 300 1 944 2 022 2 103 2 187 2 274Transfers and subsidies 5 003 271 4 297 485 3 219 308 3 348 080 3 482 004 3 621 284 3 766 135Total expenses 5 443 118 4 907 614 3 893 994 4 085 359 4 419 313 4 598 954 4 782 338Surplus / (Deficit) 1 172 638 2 309 952 3 643 356 3 905 254 4 055 033 4 393 225 4 764 870
Expenditure trends The spending focus over the medium term will be on restructuring the fund, implementing the early return to work policy and decentralising the fund’s services for ease of access and efficient processing of all compensation related claims. In 2010/11, the Compensation Fund registered 215 493 claims and made 329 091 payments, at a cost of R2.1 billion. A total of 868 284 medical claims were paid, at a cost of R1.6 billion.
The fund generates its revenue from assessed levies on employers. Between 2008/09 and 2011/12, total revenue increased from R6.6 billion to R8 billion, at an average annual rate of 6.5 per cent, mainly due to increased compliance by employers in submitting their annual assessments and increased returns on investments. Revenue is expected to grow to R9.5 billion in 2014/15, at an average annual rate of 6.1 per cent over the MTEF period, due to an increase in assessments paid by employers.
Expenditure decreased from R5.4 billion in 2008/09 to R4.1 billion in 2011/12, at an average annual rate of 9.1 per cent, due to a 12.5 per cent decline in claims paid as a result of fewer backlog claims to be cleared arising from 2007/08. Spending on compensation of employees grew from R130 million to R203 million between 2008/09 and 2011/12, at an average annual rate of 16 per cent, as the fund filled posts on its new organisational structure. Spending on this item over the MTEF period is expected to grow to R374 million, at an average annual rate of 22.6 per cent, as the fund completes the decentralisation to provinces. Growth in expenditure will provide for the appointment of additional staff to roll out the decentralisation of functions to provincial offices, and the concomitant purchase of furniture, transport and equipment.
Between 2008/09 to 2011/12, spending on goods and services grew from R304.8 million to R530.3 million, at an average annual rate of 20.3 per cent due to the appointment of external consultants to assist with the turnaround strategy, the travel and subsistence related costs for the decentralisation pilot project and the existing contract with a debt collection agency. Although actual debt collection costs have increased over this period, the fund collected 359 per cent more than its target in 2010/11.
Over the seven-year period, spending on interest, dividends and rent on land is expected to grow from R47 000 to R2.3 million, at an average annual rate of 74.1 per cent, due to interest paid to service providers for late payments of claims due to inefficiencies. By the end of the second quarter of 2011/12, about 70 per cent of current claims were processed and paid within three months of receiving complete documentation.
Over the MTEF period, expenditure is expected to grow to R4.8 billion in 2014/15, at an average annual rate 5.4 per cent, due mainly to implementing the new computerised integrated claims management financial system, and maintaining the entity’s building and restructuring the fund. This is also reflected in the 6.3 per cent increase in goods and services and the 22.6 per cent increase in compensation of employees over the MTEF period.

Vote 18: Labour
27
Personnel information Table 18.16 Compensation Fund
Personnel post status as at 30 September 2011 Number of personnel posts filled/planned for on funded establishmentNumber of posts
on approved establishment
Number of Funded
posts
Number ofVacant
posts
Actual Mid-year1 Medium-term estimate2008/09 2009/10 2010/11 2011/12 2012/13 2013/14 2014/15
Executive management 1 1 – 1 1 1 1 1 1 1Senior management 13 13 1 6 11 11 12 13 13 13Middle management 52 52 15 19 37 43 37 207 207 207Skilled 210 210 – 179 184 199 212 596 596 596Semi-skilled 435 435 15 379 409 419 420 600 600 600Total 711 711 31 584 642 673 682 1 417 1 417 1 417Compensation (R thousand) 129 985 152 483 184 653 316 535 342 526 359 653 374 038Unit cost (R thousand) 223 238 274 464 242 254 2641. As at 30 September 2011.
The fund had an establishment of 711 posts, which are all funded. The number of filled posts increased from 584 in 2008/09 to 682 in 2011/12, with the number projected to increase to 1 417 over the MTEF period due to the decentralisation of Compensation for Occupational Injuries and Diseases Act (1993) functions to all provinces.
The fund had a vacancy rate of 4.4 per cent or 31 posts, 15 at the semi-skilled level, 15 at middle management and 1 at senior management level. These posts remain vacant due to the organisational restructuring process that is currently under way. The ratio of support staff to line staff is 1:2. Over the medium term, the fund has budgeted R485 million for consultants for the rollout of SAP systems and financial and risk management.
Commission for Conciliation, Mediation and Arbitration
Overview: 2008/09 – 2014/15 The Commission for Conciliation, Mediation and Arbitration is an independent and autonomous organisation that was established by the Labour Relations Act (1995) to deliver services to the people of South Africa that ensures fair labour practices are observed.
The core mandate of the commission is derived from the purpose of the act which, among others, is to advance economic development, social justice, labour peace and the democratisation of the workplace. In response to this policy and legislative environment, the Siyaphambili strategy document sets out the roadmap which the organisation will follow to execute its mandate for the period 2012-2016, ensuring that the commission’s services are of a high quality and that its processes and operations are effective and efficient. The main function of the commission is the conciliation of workplace disputes and the arbitration of disputes that remain unresolved after conciliation.
The global economic crisis has adversely affected the South African labour market, resulting in significant job losses and business closures. In 2009/10, the commission witnessed an unprecedented increase in its workload, from 132 868 cases in 2007/08 to 153 657 cases in 2009/10, as a direct result of the crisis. The organisation responded with creative solutions to the dramatic increase in demand. One of the innovations developed was to deal with cases electronically; another involved linking more bargaining councils to case management for easier case flow. A national response team was sent to guide, advise and support provincial managers to turn around performance and achieve efficiencies. Non-monetary incentives for staff, such as a director’s award, were also introduced.
Activities undertaken by the commission included: marking its fifteenth year of operations in November 2011; streamlining its supply chain management processes following the recommendations of the Auditor-General, which included training and refresher courses for staff and participating at the International Labour Organisation. The commission is also responsible for accrediting and considering applications for subsidies by bargaining councils and private agencies, and manages the training layoff scheme on behalf of government. The aim of the scheme is to curb retrenchments during the economic downturn by the temporary suspension of work of a worker or group of workers. In the period in which work is suspended, the worker undergoes training, forfeiting a salary in lieu of a training allowance, while the employer continues to pay benefits.
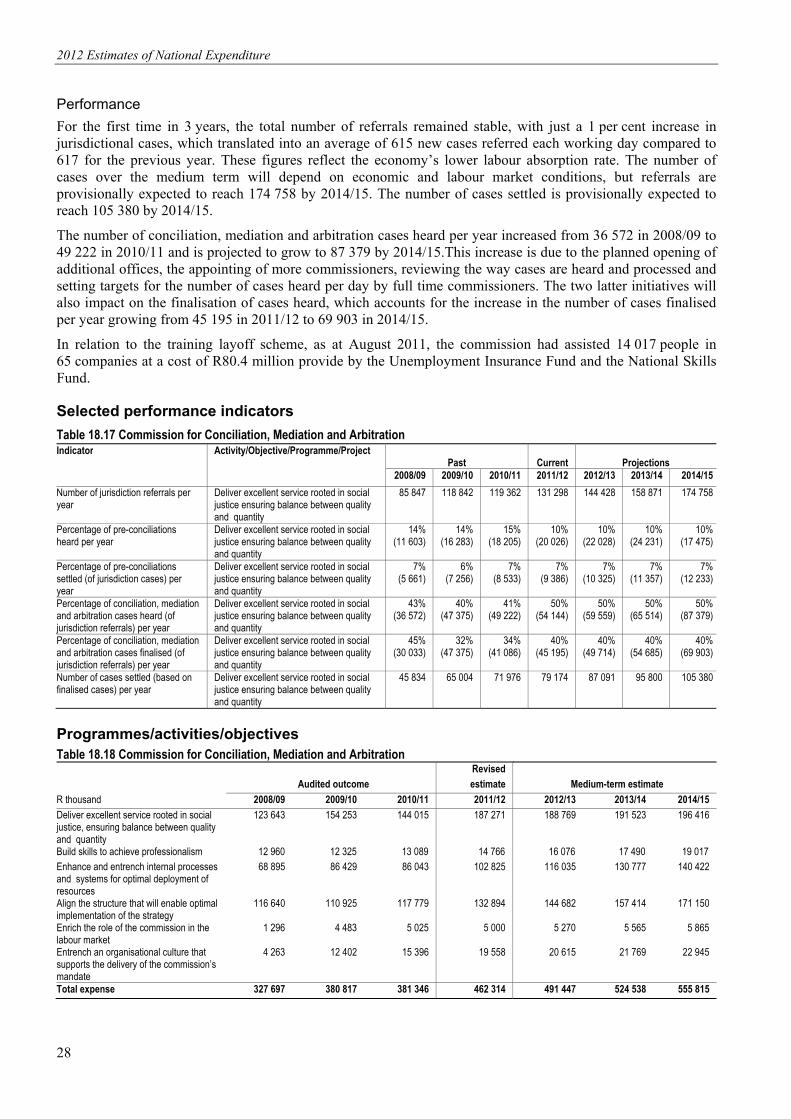
2012 Estimates of National Expenditure
28
Performance For the first time in 3 years, the total number of referrals remained stable, with just a 1 per cent increase in jurisdictional cases, which translated into an average of 615 new cases referred each working day compared to 617 for the previous year. These figures reflect the economy’s lower labour absorption rate. The number of cases over the medium term will depend on economic and labour market conditions, but referrals are provisionally expected to reach 174 758 by 2014/15. The number of cases settled is provisionally expected to reach 105 380 by 2014/15.
The number of conciliation, mediation and arbitration cases heard per year increased from 36 572 in 2008/09 to 49 222 in 2010/11 and is projected to grow to 87 379 by 2014/15.This increase is due to the planned opening of additional offices, the appointing of more commissioners, reviewing the way cases are heard and processed and setting targets for the number of cases heard per day by full time commissioners. The two latter initiatives will also impact on the finalisation of cases heard, which accounts for the increase in the number of cases finalised per year growing from 45 195 in 2011/12 to 69 903 in 2014/15.
In relation to the training layoff scheme, as at August 2011, the commission had assisted 14 017 people in 65 companies at a cost of R80.4 million provide by the Unemployment Insurance Fund and the National Skills Fund.
Selected performance indicators Table 18.17 Commission for Conciliation, Mediation and Arbitration Indicator Activity/Objective/Programme/Project
Past
Current
Projections 2008/09 2009/10 2010/11 2011/12 2012/13 2013/14 2014/15 Number of jurisdiction referrals per year
Deliver excellent service rooted in social justice ensuring balance between quality and quantity
85 847 118 842 119 362 131 298 144 428 158 871 174 758
Percentage of pre-conciliations heard per year
Deliver excellent service rooted in social justice ensuring balance between quality and quantity
14% (11 603)
14% (16 283)
15% (18 205)
10% (20 026)
10% (22 028)
10% (24 231)
10%(17 475)
Percentage of pre-conciliations settled (of jurisdiction cases) per year
Deliver excellent service rooted in social justice ensuring balance between quality and quantity
7% (5 661)
6% (7 256)
7% (8 533)
7% (9 386)
7% (10 325)
7% (11 357)
7% (12 233)
Percentage of conciliation, mediation and arbitration cases heard (of jurisdiction referrals) per year
Deliver excellent service rooted in social justice ensuring balance between quality and quantity
43% (36 572)
40% (47 375)
41% (49 222)
50% (54 144)
50% (59 559)
50% (65 514)
50%(87 379)
Percentage of conciliation, mediation and arbitration cases finalised (of jurisdiction referrals) per year
Deliver excellent service rooted in social justice ensuring balance between quality and quantity
45% (30 033)
32% (47 375)
34% (41 086)
40% (45 195)
40% (49 714)
40% (54 685)
40% (69 903)
Number of cases settled (based on finalised cases) per year
Deliver excellent service rooted in social justice ensuring balance between quality and quantity
45 834 65 004 71 976 79 174 87 091 95 800 105 380
Programmes/activities/objectives Table 18.18 Commission for Conciliation, Mediation and Arbitration
Revised Audited outcome estimate Medium-term estimate
R thousand 2008/09 2009/10 2010/11 2011/12 2012/13 2013/14 2014/15 Deliver excellent service rooted in social justice, ensuring balance between quality and quantity
123 643 154 253 144 015 187 271 188 769 191 523 196 416
Build skills to achieve professionalism 12 960 12 325 13 089 14 766 16 076 17 490 19 017Enhance and entrench internal processes and systems for optimal deployment of resources
68 895 86 429 86 043 102 825 116 035 130 777 140 422
Align the structure that will enable optimal implementation of the strategy
116 640 110 925 117 779 132 894 144 682 157 414 171 150
Enrich the role of the commission in the labour market
1 296 4 483 5 025 5 000 5 270 5 565 5 865
Entrench an organisational culture that supports the delivery of the commission’s mandate
4 263 12 402 15 396 19 558 20 615 21 769 22 945
Total expense 327 697 380 817 381 346 462 314 491 447 524 538 555 815

Vote 18: Labour
29
The Commission for Conciliation, Mediation and Arbitration had a total budget of R462.3 million in 2011/12, of which 40.5 per cent was spent on delivering the services of the commission and case disbursement costs.
Savings and cost effectiveness measures The commission expects to save more than R1.5 million per year from: discontinuing the practice of paying senior commissioner fees on less complicated matters, revising the travel policy to pay allowances in line with South African Revenue Service requirements, requiring a cost benefit analysis before a travel booking is made, enforcing the guidelines on saving energy and recycling paper, and reducing communication costs through the rollout of voice over internet protocol nationally.
Expenditure estimates Table 18.19 Commission for Conciliation, Mediation and Arbitration Statement of financial performance Revised
Audited outcome estimate Medium-term estimate R thousand 2008/09 2009/10 2010/11 2011/12 2012/13 2013/14 2014/15 Revenue Non-tax revenue 12 001 9 135 11 208 14 210 14 750 15 154 15 480Sale of goods and services other than capital assets
4 661 3 136 1 506 1 638 1 747 1 870 1 900
of which: Other sales 4 661 3 136 1 506 1 638 1 747 1 870 1 900Other non-tax revenue 7 340 5 999 9 702 12 572 13 003 13 284 13 580Transfers received 278 746 356 442 402 017 448 104 476 697 509 384 540 335Total revenue 290 747 365 577 413 225 462 314 491 447 524 538 555 815Expenses Current expense 327 697 380 817 381 346 462 314 491 447 524 538 555 815Compensation of employees 129 600 123 250 130 867 147 660 160 758 174 904 190 167Goods and services 191 204 251 431 249 863 310 411 326 991 345 936 361 950Depreciation 6 893 6 136 616 4 243 3 698 3 698 3 698Total expenses 327 697 380 817 381 346 462 314 491 447 524 538 555 815Surplus / (Deficit) (36 950) (15 240) 31 879 – – – –
Expenditure trends With the Siyaphambili strategy in place since 2009/10, the spending focus over the medium term will be on research, communication, development and innovation, as well as increasing staff capacity to improve management internal controls and deal with deficiencies identified within the organisation. These measures will impact on expenditure on procuring goods and services and compensating employees. The commission also plans to review its funding/business model, work with the development policy research unit of the University of Cape Town to provide capacity and train research unit staff to provide labour market and economic information needed to support the commission’s mutual interest mediators, investigate methods of increasing the commission’s accessibility to the community, and revise the commission’s rules and forms. In 2010/11, the average cost per case referred was R2 485, while the average cost per settlement was R5 430. The total cost of case disbursements was R144 million.
The commission generates revenue from user charges and interest received. Revenue grew from R290.7 million in 2008/09 to R462.3 million in 2011/12, at an average annual rate of 16.7 per cent, due to additional allocations from the department to fund an increase in demand for the commission’s services brought about by the global economic crisis. Between 2008/09 and 2011/12, other non-tax revenue grew from R7.3 million to R12.6 million, at an average annual rate of 19.6 per cent, due to higher interest earned on investments. Over the medium term, total revenue is expected to increase to R555.8 million, at an average annual rate of 6.3 per cent, due to additional allocations provided in previous MTEF periods for the case management system and increased operations as a result of bringing services closer to the people.
Between 2008/09 and 2011/12, expenditure increased from R327.7 million to R462.3 million, at an average annual rate of 12.2 per cent, mostly due to increased spending on goods and services for case disbursement costs as a result of increased caseloads. Total spending over the medium term is projected to increase to

2012 Estimates of National Expenditure
30
R555.8 million, at an average annual rate of 6.3 per cent. This growth is mainly driven by increased spending on compensation of employees from R147.7 million in 2011/12 to R190.2 million in 2014/15, at an average annual rate of 8.8 per cent over the MTEF period. The increased spending on compensation of employees is to increase capacity to address the case loads of the research unit, and improve back office support to enhance the management of internal control deficiencies identified through the external audit. This also accounts for the 18.4 per cent increase in spending on this item in 2011/12.
Personnel information Table 18.20 Commission for Conciliation, Mediation and Arbitration
Personnel post status as at 30 September 2011 Number of personnel posts filled/planned for on funded establishmentNumber of posts
on approved establishment
Number of funded
posts
Number ofVacant
posts Actual Mid-year1 Medium-term estimate2008/09 2009/10 2010/11 2011/12 2012/13 2013/14 2014/15
Executive management 8 8 – 8 8 8 8 8 8 8Senior management 10 10 – 10 10 10 10 10 10 10Middle management 75 75 – 75 75 75 75 75 75 75Skilled 362 362 – 352 351 351 362 369 369 369Semi-skilled 40 40 – 39 39 39 40 40 40 40Total 495 495 – 484 483 483 495 502 502 502Compensation (R thousand) 129 600 123 246 130 865 147 660 160 758 174 904 190 167Unit cost (R thousand) 268 255 271 298 320 348 3791. As at 30 September 2011.
As at 30 September 2011, the commission had an establishment of 495 posts, all of which were funded. The number of filled posts remained constant at 483 between 2008/09 and 2010/11, and is expected to increase from 495 in 2011/12 to 502 over the medium term, due to the need to increase capacity for the research unit and enhance the management of internal control. Research will play an important role in developing new and innovative techniques and solutions to dispute resolution, and maintaining the commission’s reputation as a world leader in the field of dispute resolution.
The ratio of support staff to line function staff was 1:2.3. The commission has budgeted an estimated R18.4 million over the medium term for consultants to work on the upgrading of its financial systems.
National Economic Development and Labour Council
Overview: 2008/09 – 2014/15 The National Economic Development and Labour Council was established in terms of the National Economic Development and Labour Council Act (1994). The act requires organised labour, organised business, community based organisations and government, as a collective, to: strive to promote the goals of economic growth; participate in economic decision making and social equity; seek consensus and conclude agreements on matters pertaining to social and economic policy; consider all proposed labour legislation relating to labour market policy before it is introduced in Parliament; consider all significant changes to social and economic policy before it is implemented or introduced in Parliament, and encourage and promote the formulation of coordinated policy on social and economic matters.
In 2010/11, the key discussion and debates at the council focused on labour legislation reform: the Labour Relations Amendment Bill, 2010, the Basic Conditions of Employment Amendment Bill, 2010, the Employment Equity Amendment Bill, 2010, and the Employment Services Bill, 2010. Other policies debated included the Medium Term Budget Policy Statement, the education and skills development policy, and the workings of the National Planning Commission. The labour market chamber considered and finalised 23 applications from the Commission for Conciliation, Mediation and Arbitration on bargaining council demarcation disputes and completed a report on the social plan review and the Municipal Systems Amendment Bill. The trade and industry chamber completed a report on climate change.
Over the medium term, the council will focus on: enhancing the leadership role, relevance and responsiveness of the council to the economic, social and developmental challenges facing South Africa; ensuring effective engagement on all relevant areas of legislation and policy in terms of the Act; promoting and strengthening the

Vote 18: Labour
31
culture of social dialogue and the capacity of constituencies to engage more effectively; and ensuring proper governance and the upgrading of internal capacity, operations and systems of the council.
Programmes/activities/objectives Table 18.21 National Economic Development and Labour Council
Revised Audited outcome estimate Medium-term estimate
R thousand 2008/09 2009/10 2010/11 2011/12 2012/13 2013/14 2014/15 Administration/ Operations 12 838 13 525 13 678 19 719 19 882 21 055 22 354Nedlac summit 931 793 865 1 000 850 901 955Constituency capacity building funds 2 173 1 851 1 971 2 118 2 432 2 517 2 769Special projects 1 118 1 287 728 2 000 1 921 2 240 2 278Total expense 17 060 17 456 17 242 24 837 25 085 26 713 28 356
The National Economic Development and Labour Council had a total budget of R24.8 million in 2011/12, of which 79.4 per cent was spent on administration and operations to meet the mandate of the council.
Savings and cost effectiveness measures The entity has identified areas of cost saving and has revised the organisation’s travel policy to ensure that travel costs are managed more effectively by reducing cancellations and late bookings and by regular reviews of service provider costs. The council has also introduced competitive procurement to ensure better prices and discounts on flights, accommodation and car hire. The number of meetings will be reduced through better scheduling and more expeditious handling of cases, and better use of communications technology such as e-mails and cell phones. Savings will also be made on catering costs, a significant component of meeting costs. Appointment of a programme director is expected to improve operations management systems and processes. The constituency capacity funds have also been placed under stricter control to ensure that expenditure remains within budget. Expenses are tracked by the acting chief financial officer on a monthly basis and reported to the constituents to advise them of the actual expenditure against budget and the remaining available budget. The council estimates reprioritised savings of R6 million over the MTEF period.
Expenditure estimates Table 18.22 National Economic Development and Labour Council Statement of financial performance Revised
Audited outcome estimate Medium-term estimate R thousand 2008/09 2009/10 2010/11 2011/12 2012/13 2013/14 2014/15 Revenue Non-tax revenue 581 576 990 922 1 021 1 118 1 222Other non-tax revenue 581 576 990 922 1 021 1 118 1 222Transfers received 13 959 19 554 15 868 23 915 24 064 25 595 27 134Total revenue 14 540 20 130 16 858 24 837 25 085 26 713 28 356Expenses Current expense 17 060 17 456 17 242 24 837 25 085 26 713 28 356Compensation of employees 4 833 5 435 5 678 7 914 8 796 9 353 9 883Goods and services 11 863 11 228 10 794 16 023 15 186 16 217 17 453Depreciation 364 793 770 900 1 103 1 143 1 020Total expenses 17 060 17 456 17 242 24 837 25 085 26 713 28 356Surplus / (Deficit) (2 520) 2 674 (384) – – – –
Expenditure trends Over the MTEF period, the spending focus will be on: hosting the entity’s national summit, capacity building within the business, community and labour constituencies; ongoing funding of section 77 of the Labour Relations Act; and funding of ongoing special projects such as hosting consultations on the national health insurance and the national project to reduce poverty and inequality in South Africa.
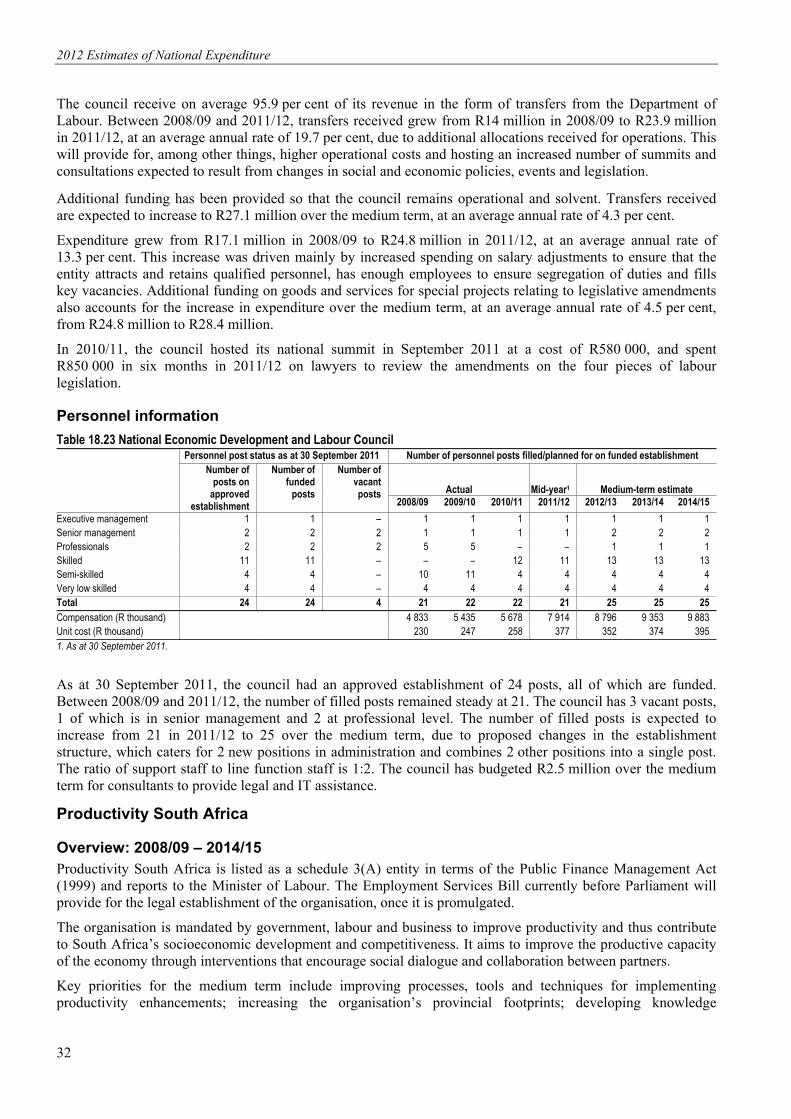
2012 Estimates of National Expenditure
32
The council receive on average 95.9 per cent of its revenue in the form of transfers from the Department of Labour. Between 2008/09 and 2011/12, transfers received grew from R14 million in 2008/09 to R23.9 million in 2011/12, at an average annual rate of 19.7 per cent, due to additional allocations received for operations. This will provide for, among other things, higher operational costs and hosting an increased number of summits and consultations expected to result from changes in social and economic policies, events and legislation.
Additional funding has been provided so that the council remains operational and solvent. Transfers received are expected to increase to R27.1 million over the medium term, at an average annual rate of 4.3 per cent.
Expenditure grew from R17.1 million in 2008/09 to R24.8 million in 2011/12, at an average annual rate of 13.3 per cent. This increase was driven mainly by increased spending on salary adjustments to ensure that the entity attracts and retains qualified personnel, has enough employees to ensure segregation of duties and fills key vacancies. Additional funding on goods and services for special projects relating to legislative amendments also accounts for the increase in expenditure over the medium term, at an average annual rate of 4.5 per cent, from R24.8 million to R28.4 million.
In 2010/11, the council hosted its national summit in September 2011 at a cost of R580 000, and spent R850 000 in six months in 2011/12 on lawyers to review the amendments on the four pieces of labour legislation.
Personnel information Table 18.23 National Economic Development and Labour Council
Personnel post status as at 30 September 2011 Number of personnel posts filled/planned for on funded establishmentNumber of
posts on approved
establishment
Number of funded
posts
Number ofvacant posts Actual Mid-year1 Medium-term estimate
2008/09 2009/10 2010/11 2011/12 2012/13 2013/14 2014/15Executive management 1 1 – 1 1 1 1 1 1 1Senior management 2 2 2 1 1 1 1 2 2 2Professionals 2 2 2 5 5 – – 1 1 1Skilled 11 11 – – – 12 11 13 13 13Semi-skilled 4 4 – 10 11 4 4 4 4 4Very low skilled 4 4 – 4 4 4 4 4 4 4Total 24 24 4 21 22 22 21 25 25 25Compensation (R thousand) 4 833 5 435 5 678 7 914 8 796 9 353 9 883Unit cost (R thousand) 230 247 258 377 352 374 3951. As at 30 September 2011.
As at 30 September 2011, the council had an approved establishment of 24 posts, all of which are funded. Between 2008/09 and 2011/12, the number of filled posts remained steady at 21. The council has 3 vacant posts, 1 of which is in senior management and 2 at professional level. The number of filled posts is expected to increase from 21 in 2011/12 to 25 over the medium term, due to proposed changes in the establishment structure, which caters for 2 new positions in administration and combines 2 other positions into a single post. The ratio of support staff to line function staff is 1:2. The council has budgeted R2.5 million over the medium term for consultants to provide legal and IT assistance.
Productivity South Africa
Overview: 2008/09 – 2014/15 Productivity South Africa is listed as a schedule 3(A) entity in terms of the Public Finance Management Act (1999) and reports to the Minister of Labour. The Employment Services Bill currently before Parliament will provide for the legal establishment of the organisation, once it is promulgated.
The organisation is mandated by government, labour and business to improve productivity and thus contribute to South Africa’s socioeconomic development and competitiveness. It aims to improve the productive capacity of the economy through interventions that encourage social dialogue and collaboration between partners.
Key priorities for the medium term include improving processes, tools and techniques for implementing productivity enhancements; increasing the organisation’s provincial footprints; developing knowledge

Vote 18: Labour
33
management systems; building relationships with key stakeholders; improving responsiveness; and demonstrating the impact of projects.
Performance 2010/11 marked 13 years since the formation of the turnaround solutions programme, a social plan that aims to avoid job losses and employment decline wherever possible. In 2010/11, successful management of the programme ensured that over 16 000 jobs were saved, a considerable achievement in the poor economic environment, and 600 education, training and development service providers were trained in productivity concepts. A further 10 skills development facilitators and 620 workers and managers were trained. Training on the productive capacity building programme was provided to 2 707 small and micro-enterprises and 109 managers were trained as productivity practitioners. Due to an increase in funding, the organisation was able to increase the number of education, training and development service providers trained as productivity trainers, from 480 in 2008/09 to 700 in 2011/12. The number of emerging entrepreneurs trained in productivity improvement and competencies from grew from 1800 in 2008/09 to 3500 in 2011/12, and the number of future forums established per year at companies with turnaround solutions increased from 120 in 2008/09 to 160 in 2011/12.
Selected performance indicators Table 18.24 Productivity South Africa Indicator Programme Past Current Projections 2008/09 2009/10 2010/11 2011/12 2012/13 2013/14 2014/15Number of education, training and development service providers trained as productivity trainers per year
Public Organisation Solution
480 500 600 700 800 850 900
Number of ETD service providers and productivity trainers accredited / Licensing of external service providers per year
Public Organisation Solution
30 01 26 30 35 40 45
Number of emerging entrepreneurs trained in productivity improvement and competencies per year
Public Organisation Solution
1 800 2 500 3 000 3 500 4 000 4 500 5000
Number of skills development facilitators trained in productivity per year
Public Organisation Solution
120 200 250 300 400 500 550
Number of managers and workers trained to enhance productivity competencies and mindsets in private and public enterprises per year
Public Organisation Solution
530 600 620 720 780 840 950
Number of future forums established per year at companies with turnaround solutions
Turnaround Solution: turning-around distressed organisations
120 120 140 160 180 200 220
1. The addendum to extend the contract between Productivity SA and the Small Enterprise Development Agency was not approved.
Programmes/activities/objectives Table 18.25 Productivity South Africa
Revised Audited outcome estimate Medium-term estimate
R thousand 2008/09 2009/10 2010/11 2011/12 2012/13 2013/14 2014/15 Public organisation solution 4 943 3 975 2 654 5 165 5 439 5 794 6 692Workplace challenge programme 6 262 5 963 4 505 5 721 6 964 6 853 7 871Turnaround Solutions: Turning-around Distressed Organisations
18 785 19 229 15 130 19 057 33 900 35 708 36 969
Knowledge, awareness and information 3 244 2 099 1 975 6 593 3 647 3 687 3 871Administration/ Operations 45 649 46 583 45 300 74 096 66 093 70 874 74 115Total expense 78 883 77 849 69 564 110 632 116 043 122 916 129 518
Productivity South Africa had a total budget of R110.6 million in 2011/12, of which 67 per cent was spent on administration, which included spending on consultants to provide business support services to clients.

2012 Estimates of National Expenditure
34
Savings and cost effective service delivery The organisation has implemented cost effectiveness measures by strengthening its internal capacity to allow it to outsource only those functions that are not core to the organisation, such as the legal and human resource functions. The organisation also visited model companies in Japan to learn from best practice, including about the Kaizan project method for quality improvements. Costs have also been reduced by conducting training in productivity competencies using a train-the-trainer approach. Partnerships with private and public sector organisations in relation to recruiting companies for interventions and client sponsorship of venues and catering also contribute to cost savings. Estimated savings over the medium amount to R1.2 million.
Expenditure estimates Table 18.26 Productivity South Africa Statement of financial performance Revised
Audited outcome estimate Medium-term estimate R thousand 2008/09 2009/10 2010/11 2011/12 2012/13 2013/14 2014/15 Revenue Non-tax revenue 12 320 5 884 2 051 11 981 7 067 7 455 7 829Sale of goods and services other than capital assets
12 033 5 418 1 825 10 773 5 795 6 113 6 419
of which: Sales by market establishments 12 033 5 418 1 825 10 773 5 795 6 113 6 419Other non-tax revenue 287 466 226 1 208 1 272 1 342 1 410Transfers received 75 127 71 002 77 433 98 651 108 977 115 460 121 689Total revenue 87 447 76 886 79 484 110 632 116 044 122 915 129 518Expenses Current expense 78 883 77 849 69 564 110 632 116 044 122 916 129 518Compensation of employees 27 334 29 822 32 263 34 683 36 695 38 897 41 036Goods and services 50 308 47 358 36 763 75 421 78 756 83 393 87 826Depreciation 748 621 530 527 536 566 594Interest, dividends and rent on land 493 48 8 0 57 60 63Total expenses 78 883 77 849 69 564 110 632 116 044 122 916 129 518Surplus / (Deficit) 8 564 (963) 9 920 – – – –
Expenditure trends The spending focus over the MTEF period is on the development of competitive value chains within industries, the establishment of sheltered employment factories as pilot sites for the Japanese productivity project, and the implementation of turnaround strategies at sheltered employment factories and other companies.
Transfers from the Department of Labour constitute on average 92.4 per cent of total revenue over the seven-year period. Transfers received grew from R75.1 million in 2008/09 to R98.7 million in 2011/12, at an average annual rate of 9.5 per cent, due to higher transfers from the Unemployment Insurance Fund for the turnaround solutions programme. The funding for the programme was shifted from the National Skills Fund to the Unemployment Insurance Fund after the former was moved to the Department of Higher Education and Training. In 2011/12, transfers received grew by 27.4 per cent, due to an increased transfer from the Department of Trade and Industry for the workplace challenge programme and from the Unemployment Insurance Fund for the turnaround solutions programme. Other non-tax revenue grew from R226 000 in 2010/11 to R1.2 million in 2011/12, due mainly to higher income for services rendered to clients. The number of clients increased due to the deteriorating economic climate.
Between 2008/09 and 2011/12, spending grew from R78.9 million to R110.6 million, at an average annual rate of 11.9 per cent, driven mainly by spending on goods and services. This latter item constitutes on average 64.2 per cent of total expenditure over the seven-year period, increasing at an average annual rate of 14.5 per cent, due to higher spending on the turnaround solutions programme. The largest goods and services spending is on consultants, who are contracted by the entity to provide business support services to clients. Productivity South Africa works with a large network of independent consultants throughout the country to reach as many companies as possible over a wide geographic area. Over the medium term, total expenditure is

Vote 18: Labour
35
projected to grow from R110.6 million in 2011/12 to R129.5 million in 2014/15, at an average annual rate of 5.4 per cent, due to inflation related adjustments to goods and services and compensation of employees.
Personnel information Table 18.27 Productivity South Africa
Personnel post status as at 30 September2011 Number of personnel posts filled / planned for on funded establishmentNumber of
posts on approved
establishment
Number of funded
posts
Number ofvacant posts Actual Mid-year1 Medium-term estimate
2008/09 2009/10 2010/11 2011/12 2012/13 2013/14 2014/15Executive management 6 6 – 6 6 5 6 6 6 6Senior management 2 2 – 2 2 1 2 2 2 2Middle management 18 18 1 19 19 17 17 19 19 19Professionals 30 30 1 30 27 26 29 30 30 30Skilled 25 25 2 27 27 21 23 27 27 27Semi-skilled 12 12 – 10 10 15 12 15 15 15Total 93 93 4 94 91 85 89 99 99 99Compensation (R thousand) 27 334 29 822 32 263 34 683 36 695 38 897 41 036Unit cost (R thousand) 291 328 380 390 371 393 4151. As at 30 September 2011.
As at 30 September 2011, Productivity South Africa had an establishment of 93 posts, all of which were funded. The entity has 4 vacancies, 2 of which are at skilled level, with the balance at professional and middle management level. The number of filled posts increased from 85 in 2010/11 to 89 in 2011/12, and is projected to increase further to 99 over the medium term as the organisation increases its capacity. The ratio of support staff to line function staff is 1:6.8. In 2010/11, the entity used 38 consultants to provide business support to 72 companies, at a ratio of 1:2.6.

2012 Estimates of National Expenditure
36
Additional tables Table 18.A Summary of expenditure trends and estimates per programme and economic classification Programme Appropriation Audited Appropriation Revised
Main Adjusted outcome Main Additional Adjusted estimate R thousand 2010/11 2010/11 2011/12 2011/12 Administration 649 997 656 320 682 480 697 228 1 227 698 455 690 357Inspection and Enforcement Services 356 603 366 642 329 373 386 726 2 564 389 290 380 501Public Employment Services 280 420 277 902 289 258 296 146 28 663 324 809 324 809Labour Policy and Industrial Relations 496 869 534 959 525 199 601 358 3 471 604 829 602 430Total 1 783 889 1 835 823 1 826 310 1 981 458 35 925 2 017 383 1 998 097
Economic classification Current payments 1 259 947 1 285 402 1 185 040 1 349 907 (76 855) 1 273 052 1 249 650Compensation of employees 738 405 744 808 681 530 786 294 18 786 312 768 714Goods and services 521 542 540 594 503 439 563 613 (76 873) 486 740 480 936Interest and rent on land – – 71 – – – –Transfers and subsidies 515 165 537 299 561 038 599 402 26 865 626 267 630 447Provinces and municipalities – 39 54 – 12 12 12Departmental agencies and accounts 429 790 457 990 457 948 515 684 26 500 542 184 542 184Foreign governments and international organisations
9 633 9 633 10 703 10 211 – 10 211 14 306
Non-profit institutions 75 502 69 280 89 196 73 258 – 73 258 73 258Households 240 357 3 137 249 353 602 687Payments for capital assets 8 777 13 122 80 213 32 149 85 915 118 064 118 000Buildings and other fixed structures 3 771 3 771 3 117 3 996 – 3 996 3 996Machinery and equipment 5 006 9 351 77 086 28 153 85 915 114 068 114 004Software and other intangible assets – – 10 – – – –Payments for financial assets – – 19 – – – –Total 1 783 889 1 835 823 1 826 310 1 981 458 35 925 2 017 383 1 998 097
Table 18.B Summary of expenditure on training
Adjusted Audited outcome appropriation Medium-term expenditure estimate 2008/09 2009/10 2010/11 2011/12 2012/13 2013/14 2014/15
Compensation of employees (R thousand) 491 335 576 457 681 530 786 312 883 331 943 697 1 001 292Training expenditure (R thousand) 8 851 10 335 6 507 10 443 12 097 12 483 13 190Training as percentage of compensation 1.8% 1.8% 1.0% 1.3% 1.4% 1.3% 1.3%Total number trained in department (headcount) 2 005 4 423 3 557 3 146 of which: Employees receiving bursaries (headcount) 238 196 242 243 Learnerships (headcount) – – 19 – Internships (headcount) – 68 72 81

Vote 18: Labour
37
Table 18.C Summary of departmental public private partnership projects Project description: Siemens Business Services IT agreement Project
annual unitary fee Budgeted at time of contract expenditure Medium-term expenditure estimate
R thousand 2011/12 2012/13 2013/14 2014/15
Projects signed in terms of Treasury Regulation 16 40 833 86 485 91 691 – –Public private partnership unitary charge 40 833 86 485 91 691 – – Total 40 833 86 485 91 691 – –
Disclosure notes for projects signed in terms of Treasury Regulation 16 Project name Public private partnership agreement between the Department of Labour and Siemens
Business Services for the provision of IT services Brief description The department regards the IT public private partnership agreement as a way of achieving
its objectives against the background of the requirements of the specialised knowledge and expertise needed to develop and manage a modern IT service
Date public private partnership agreement was signed 30 November 2002 Duration of public private partnership agreement 10 years Escalation index for unitary fee Annual increases at the consumer price Index (excluding interest rates on mortgage bonds)
as well as increases based on the number of computer users Net present value of all payment obligations discounted at appropriate duration government bond yield
Net present value calculated at R117 987 322 utilising the government bond yield of 8.55%
Variations and amendments to public private partnership agreement The public private partnership agreement makes provision for a change management process that deals with changes to the agreement and unitary fee
Cost implications of variations and amendments The contractual change management procedures make provision for the approval of changes in the public private partnership agreement through mutual agreement with payment either through an agreed change in the unitary fee or a lump sum payment

38
2012 Estimates of National Expenditure
Tabl
e 18.D
Sum
mar
y of e
xpen
ditu
re o
n in
frast
ruct
ure
Proj
ect n
ame
Ser
vice d
elive
ry
Curre
nt
Tota
l
Adju
sted
out
puts
pr
ojec
t sta
ge
proj
ect c
ost
Aud
ited
outc
ome
appr
opria
tion
Medi
um-te
rm ex
pend
iture
estim
ate
R tho
usan
d 20
08/09
20
09/10
20
10/11
20
11/12
20
12/13
20
13/14
20
14/15
De
partm
enta
l infra
stru
ctur
e
Ru
stenb
urg l
abou
r cen
tre:
Cons
tructi
on of
build
ing
New
labou
r cen
tre
Cons
tructi
on15
461
– –
1 592
1 545
1 000
5 105
–
Moun
t Ayli
ff: Si
te cle
aran
ceNe
w lab
our c
entre
De
sign
15 21
6–
–29
2–
200
234
– Ga
rank
uwa:
Site
clear
ance
New
labou
r cen
tre
Desig
n27
9–
–31
–15
013
1–
Midd
elbur
g: Si
te cle
aran
ceNe
w lab
our c
entre
De
sign
512
– –
–32
120
0–
– At
hlone
: Site
Clea
ranc
eNe
w lab
our c
entre
De
sign
1 602
– –
–24
017
2–
– Ca
pe T
own:
Site
clear
ance
New
labou
r cen
tre
Desig
n13
029
– –
–95
415
1–
– Sw
ellen
dam:
Site
clea
ranc
eNe
w lab
our c
entre
De
sign
533
– –
–80
150
––
Vred
enbu
rg: S
ite C
leara
nce
New
labou
r cen
tre
Desig
n1 5
96–
––
–15
0–
– So
merse
t Wes
t: Site
clea
ranc
eNe
w lab
our c
entre
De
sign
2 129
– –
–31
915
0–
– Kn
ysna
: Site
clea
ranc
eNe
w lab
our c
entre
De
sign
1 497
– –
–22
515
0–
– Be
llville
: Site
clea
ranc
eNe
w lab
our c
entre
De
sign
445
– –
––
150
––
Vred
enda
l: Site
clea
ranc
eNe
w lab
our c
entre
De
sign
445
– –
––
150
––
Cere
s: Si
te cle
aran
ceNe
w lab
our c
entre
De
sign
540
– –
––
150
––
Volks
rust:
Site
clea
ranc
eNe
w lab
our c
entre
De
sign
445
– –
–29
715
0–
– Ca
rltonv
ille: S
ite C
leara
nce
New
labou
r cen
tre
Desig
n37
– –
––
178
––
Secu
nda:
Site
clear
ance
New
labou
r cen
tre
Desig
n1 9
59–
––
–15
0–
– Ta
ung:
Site
clear
ance
New
labou
r cen
tre
Desig
n18
6–
–18
6–
––
– Se
curity
: Wen
dy ho
uses
Labo
ur ce
ntres
secu
rity W
endy
hous
esVa
rious
62–
–12
1515
16–
Secu
rity: W
endy
hous
esSe
curity
: Wen
dy ho
uses
at m
iniste
r's pa
rking
in
Labo
ria H
ouse
Va
rious
17–
–17
––
–17
Brok
horst
spru
it: Si
te cle
aran
ceNe
w lab
our c
entre
De
sign
200
– –
200
––
––
Lusik
isiki:
Site
clea
ranc
eNe
w lab
our c
entre
De
sign
66–
–66
––
––
Lebo
wakg
omo:
Site
clear
ance
New
labou
r cen
tre
Desig
n14
8–
–14
8–
––
– Sa
bie: S
ite cl
eara
nce
New
labou
r cen
tre
Desig
n19
1–
–19
1–
––
– Ca
rolin
a: Si
te cle
aran
ceNe
w lab
our c
entre
De
sign
191
– –
191
––
––
Kwam
hlang
a: Si
te cle
aran
ceNe
w lab
our c
entre
De
sign
191
– –
191
––
––
Durb
an la
bour
centr
e: Re
pairs
Elec
trical
and m
echa
nical
repa
irsVa
rious
2 690
2 690
–
––
––
– Ot
her la
bour
centr
esVa
rious
cons
tructi
on, s
uch a
s elec
trical
repa
irsVa
rious
225
– 22
6–
––
––

39
Vote18: Labour
Tabl
e 18.D
Sum
mar
y of e
xpen
ditu
re o
n in
frast
ruct
ure (
cont
inue
d)
Proj
ect n
ame
Ser
vice d
elive
ry
Curre
nt
Tota
l
Adju
sted
out
puts
pr
ojec
t sta
ge
proj
ect c
ost
Aud
ited
outc
ome
appr
opria
tion
Medi
um-te
rm ex
pend
iture
estim
ate
R tho
usan
d 20
08/09
20
09/10
20
10/11
20
11/12
20
12/13
20
13/14
20
14/15
Ma
inte
nanc
e
Preto
ria, S
ilver
ton: S
helte
red
emplo
ymen
t facto
ry he
ad of
fice:
Seco
nd fo
llow-
on re
pair a
nd
maint
enan
ce pr
ogra
mme
Maint
aining
shelt
ered
emplo
ymen
t hea
d offic
e to
be oc
cupa
tiona
l hea
lth an
d safe
ty co
mplia
nt Te
nder
24 40
673
9 23
275
75 9
765 9
762 4
773 5
09
Preto
ria he
ad of
fice,
Labo
ria H
ouse
: Fir
st fol
low-o
n rep
air an
d ma
inten
ance
prog
ramm
e
Maint
aining
head
offic
e buil
ding t
o be
occu
patio
nal h
ealth
and s
afety
comp
liant
Cons
tructi
on21
128
622
5 585
5 140
4 406
1 000
3 000
3 870
Kimb
erley
shelt
ered
emplo
ymen
t fac
tory:
Seco
nd fo
llow-
on re
pair a
nd
maint
enan
ce pr
ogra
mme
Maint
aining
shelt
ered
emplo
ymen
t facto
ries t
o be
occu
patio
nal h
ealth
and s
afety
comp
liant
Tend
er8 7
6397
8 65
13 1
503 9
84–
––
Bloe
mfon
tein:
shelt
ered
em
ploym
ent fa
ctory:
Sec
ond f
ollow
-on
repa
ir and
main
tenan
ce
prog
ramm
e
Maint
aining
shelt
ered
emplo
ymen
t facto
ries t
o be
occu
patio
nal h
ealth
and s
afety
comp
liant
Tend
er5 8
803 6
01
1 770
134
375
––
–
Potch
efstro
om sh
elter
ed
emplo
ymen
t facto
ry: R
epair
and
maint
enan
ce pr
ogra
mme
Maint
aining
shelt
ered
emplo
ymen
t facto
ries t
o be
occu
patio
nal h
ealth
and s
afety
comp
liant
Tend
er1 6
4933
0 –
––
––
–
Uping
ton an
d Kur
uman
labo
ur
centr
e and
Kim
berle
y she
ltere
d em
ploym
ent fa
ctory:
Rep
air an
d ma
inten
ance
prog
ramm
e
Maint
aining
shelt
ered
emplo
ymen
t facto
ries t
o be
occu
patio
nal h
ealth
and s
afety
comp
liant
Tend
er8 8
292 9
72
57–
––
––
Geor
ge la
bour
centr
e: Re
pair a
nd
maint
enan
ce pr
ogra
mme
Maint
aining
labo
ur ce
ntre t
o be o
ccup
ation
al he
alth a
nd sa
fety c
ompli
ant
Tend
er1 4
2642
3 –
––
––
–
East
Lond
on la
bour
centr
e and
sh
elter
ed em
ploym
ent fa
ctory:
Re
pair a
nd m
ainten
ance
pr
ogra
mme
Maint
aining
shelt
ered
emplo
ymen
t facto
ries t
o be
occu
patio
nal h
ealth
and s
afety
comp
liant
Tend
er7 5
2775
4 –
––
––
–
Piete
rmar
itzbu
rg an
d she
ltere
d em
ploym
ent fa
ctory:
Rep
air an
d ma
inten
ance
prog
ramm
e
Maint
aining
shelt
ered
emplo
ymen
t facto
ries t
o be
occu
patio
nal h
ealth
and s
afety
comp
liant
Tend
er4 8
8153
3 –
––
––
–
Preto
ria sh
elter
ed em
ploym
ent
factor
y and
labo
ur ce
ntre:
Repa
ir an
d main
tenan
ce pr
ogra
mme
Maint
aining
shelt
ered
emplo
ymen
t facto
ries t
o be
occu
patio
nal h
ealth
and s
afety
comp
liant
Tend
er9 0
3169
1 6
413 7
023 4
08–
––
Phala
borw
a, Ho
edsp
ruit a
nd
Sesh
ego l
abou
r cen
tres:
Repa
ir and
ma
inten
ance
prog
ramm
e
Maint
aining
labo
ur ce
ntre t
o be o
ccup
ation
al he
alth a
nd sa
fety c
ompli
ant
Tend
er5 2
2034
0 20
4–
––
––
Witb
ank,
Lyde
nbur
g and
Ko
matip
oort
labou
r cen
tres:
Repa
ir an
d main
tenan
ce pr
ogra
mme
Maint
aining
labo
ur ce
ntre t
o be o
ccup
ation
al he
alth a
nd sa
fety c
ompli
ant
Tend
er9 6
341 0
97
19–
––
––

40
2012 Estimates of National Expenditure
Tabl
e 18.D
Sum
mar
y of e
xpen
ditu
re o
n in
frast
ruct
ure (
cont
inue
d)
Proj
ect n
ame
Serv
ice d
elive
ry
Curre
nt
Tota
l
Adju
sted
outp
uts
proj
ect s
tage
pr
ojec
t cos
t A
udite
d ou
tcom
e ap
prop
riatio
n Me
dium
-term
expe
nditu
re es
timat
e R
thous
and
2008
/09
2009
/10
2010
/11
2011
/12
2012
/13
2013
/14
2014
/15
Wes
tern C
ape l
abou
r cen
tre an
d sh
elter
ed em
ploym
ent fa
ctory:
Re
pair a
nd m
ainten
ance
pr
ogra
mme
Maint
aining
shelt
ered
emplo
ymen
t facto
ries t
o be
occu
patio
nal h
ealth
and s
afety
comp
liant
Tend
er21
324
2 899
54
1–
––
––
Durb
an M
ason
ic Gr
ove:
Emer
genc
y re
pair a
nd m
ainten
ance
prog
ramm
e Ma
intain
ing la
bour
centr
e to b
e occ
upati
onal
healt
h and
safet
y com
plian
t Te
nder
6 084
1 632
–
––
––
–
Gaute
ng S
outh:
Rep
air an
d ma
inten
ance
prog
ramm
e Ma
intain
ing sh
elter
ed em
ploym
ent fa
ctorie
s to
be oc
cupa
tiona
l hea
lth an
d safe
ty co
mplia
nt Te
nder
20 45
85 0
26
1 200
920
––
––
Shelt
ered
emplo
ymen
t facto
ries:
Repa
ir and
main
tenan
ce
prog
ramm
e
Maint
aining
shelt
ered
emplo
ymen
t facto
ries t
o be
occu
patio
nal h
ealth
and s
afety
comp
liant
Vario
us95
648
12 93
4 14
752
––
––
–
Tota
l 31
1 780
37 63
9 26
878
16 92
022
145
10 39
210
963
7 396

Vote 18: Labour
41
Table 18.E Expenditure by labour center per province Subprogramme Adjusted Audited outcome appropriation Medium-term expenditure estimate R thousand 2008/09 2009/10 2010/11 2011/12 2012/13 2013/14 2014/15 Eastern Cape 74 330 86 014 97 442 127 410 101 858 108 501 117 090 Provincial Office: East London 21 246 26 869 24 256 35 896 25 607 27 440 29 646 Aliwal North 1 792 2 302 2 531 3 251 2 761 2 919 3 136 Butterworth 2 022 2 124 2 708 3 060 2 934 3 102 3 332 Cradock 1 733 1 872 1 950 2 513 2 082 2 304 2 493 East London 7 314 8 622 10 833 13 647 11 057 11 700 12 646 Fort Beaufort 1 688 1 756 1 819 2 413 1 947 2 160 2 333 Graaff-Reinet 1 652 2 056 2 027 2 583 2 076 2 297 2 482 Grahamstown 2 121 2 397 2 528 3 378 2 713 2 972 3 218 King Williamstown 4 021 4 218 5 389 6 792 5 512 5 830 6 288 Lusikisiki 2 244 2 449 3 135 3 498 3 293 3 481 3 734 Maclear 2 018 2 265 2 726 2 944 2 917 3 084 3 321 Mdantsane 1 971 2 127 2 397 3 080 2 506 2 751 2 973 Mount Ayliff 2 001 2 182 2 478 2 414 2 366 2 600 2 797 Port Elizabeth 10 188 11 126 15 327 20 735 15 928 16 869 18 272 Queenstown 3 450 3 931 4 947 5 987 5 203 5 500 5 924 Uitenhage 4 439 4 789 6 317 7 963 6 549 6 829 7 355 Mthatha 4 430 4 929 6 074 7 255 6 403 6 664 7 140 Free State 46 280 57 031 59 018 85 697 66 695 72 267 75 540 Provincial Office: Bloemfontein 22 099 19 908 17 543 29 926 19 843 21 632 22 408 Bethlehem 1 609 2 709 2 997 4 316 3 368 3 613 3 748 Bloemfontein 6 471 9 179 9 737 12 855 10 887 11 621 12 139 Ficksburg 1 302 2 012 2 350 3 446 2 614 2 806 2 905 Harrismith 1 504 2 308 2 163 3 082 2 476 2 655 2 825 Kroonstad 1 904 1 982 3 037 3 965 3 516 3 776 3 911 Petrusburg 1 616 2 443 2 033 3 037 2 683 2 879 3 086 Phuthaditjhaba 2 127 2 671 3 316 4 564 3 494 3 737 3 986 Sasolburg 2 208 3 209 3 859 4 428 4 330 4 633 4 958 Botshabelo 1 515 2 263 2 537 3 202 2 866 3 206 3 343 Welkom 2 647 6 588 7 440 10 000 8 306 9 169 9 593 Zastron 1 278 1 759 2 005 2 878 2 314 2 542 2 638 Gauteng 107 027 149 237 157 139 214 054 171 220 181 995 190 852 Provincial Office: Johannesburg 22 945 54 623 38 677 62 525 42 913 46 212 48 413 Alberton 2 192 2 259 2 849 4 094 3 188 3 391 3 558 Atteridgeville 1 269 1 803 2 006 2 550 2 073 2 205 2 305 Benoni 3 176 3 460 4 931 6 522 5 199 5 522 5 804 Boksburg 2 517 2 803 3 660 4 335 3 798 3 980 4 239 Brakpan 1 790 2 094 2 754 3 885 3 056 3 248 3 413 Bronkhorstspruit 1 714 2 372 2 539 3 278 2 705 2 867 3 013 Carletonville 1 340 2 072 3 019 4 158 3 377 3 588 3 772 Garankuwa 1 871 2 272 2 613 3 305 2 818 2 985 3 140 Germiston 6 572 7 175 9 815 14 210 10 741 11 431 11 990 Johannesburg 15 341 16 908 19 385 22 775 21 114 22 364 23 618 Kempton Park 3 340 3 805 5 271 6 510 5 550 5 895 6 195 Krugersdorp 3 470 3 840 4 782 6 301 5 221 5 546 5 827 Mamelodi 2 066 2 754 2 306 3 299 1 589 1 697 1 774 Nigel 1 424 1 645 1 924 2 721 2 090 2 673 2 330 Pretoria 9 387 9 836 14 691 17 472 16 029 16 981 17 922 Randburg 2 021 2 228 2 566 3 323 2 717 2 877 3 027
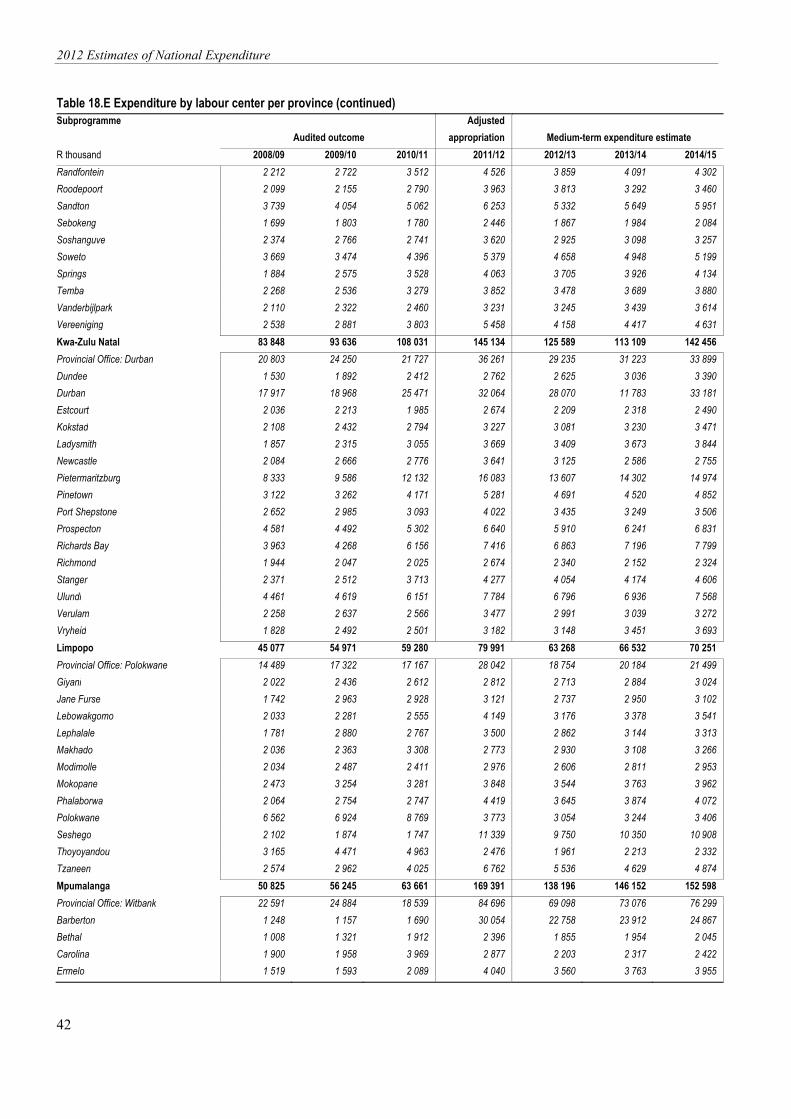
2012 Estimates of National Expenditure
42
Table 18.E Expenditure by labour center per province (continued) Subprogramme Adjusted Audited outcome appropriation Medium-term expenditure estimate R thousand 2008/09 2009/10 2010/11 2011/12 2012/13 2013/14 2014/15 Randfontein 2 212 2 722 3 512 4 526 3 859 4 091 4 302 Roodepoort 2 099 2 155 2 790 3 963 3 813 3 292 3 460 Sandton 3 739 4 054 5 062 6 253 5 332 5 649 5 951 Sebokeng 1 699 1 803 1 780 2 446 1 867 1 984 2 084 Soshanguve 2 374 2 766 2 741 3 620 2 925 3 098 3 257 Soweto 3 669 3 474 4 396 5 379 4 658 4 948 5 199 Springs 1 884 2 575 3 528 4 063 3 705 3 926 4 134 Temba 2 268 2 536 3 279 3 852 3 478 3 689 3 880 Vanderbijlpark 2 110 2 322 2 460 3 231 3 245 3 439 3 614 Vereeniging 2 538 2 881 3 803 5 458 4 158 4 417 4 631 Kwa-Zulu Natal 83 848 93 636 108 031 145 134 125 589 113 109 142 456 Provincial Office: Durban 20 803 24 250 21 727 36 261 29 235 31 223 33 899 Dundee 1 530 1 892 2 412 2 762 2 625 3 036 3 390 Durban 17 917 18 968 25 471 32 064 28 070 11 783 33 181 Estcourt 2 036 2 213 1 985 2 674 2 209 2 318 2 490 Kokstad 2 108 2 432 2 794 3 227 3 081 3 230 3 471 Ladysmith 1 857 2 315 3 055 3 669 3 409 3 673 3 844 Newcastle 2 084 2 666 2 776 3 641 3 125 2 586 2 755 Pietermaritzburg 8 333 9 586 12 132 16 083 13 607 14 302 14 974 Pinetown 3 122 3 262 4 171 5 281 4 691 4 520 4 852 Port Shepstone 2 652 2 985 3 093 4 022 3 435 3 249 3 506 Prospecton 4 581 4 492 5 302 6 640 5 910 6 241 6 831 Richards Bay 3 963 4 268 6 156 7 416 6 863 7 196 7 799 Richmond 1 944 2 047 2 025 2 674 2 340 2 152 2 324 Stanger 2 371 2 512 3 713 4 277 4 054 4 174 4 606 Ulundi 4 461 4 619 6 151 7 784 6 796 6 936 7 568 Verulam 2 258 2 637 2 566 3 477 2 991 3 039 3 272 Vryheid 1 828 2 492 2 501 3 182 3 148 3 451 3 693 Limpopo 45 077 54 971 59 280 79 991 63 268 66 532 70 251 Provincial Office: Polokwane 14 489 17 322 17 167 28 042 18 754 20 184 21 499 Giyani 2 022 2 436 2 612 2 812 2 713 2 884 3 024 Jane Furse 1 742 2 963 2 928 3 121 2 737 2 950 3 102 Lebowakgomo 2 033 2 281 2 555 4 149 3 176 3 378 3 541 Lephalale 1 781 2 880 2 767 3 500 2 862 3 144 3 313 Makhado 2 036 2 363 3 308 2 773 2 930 3 108 3 266 Modimolle 2 034 2 487 2 411 2 976 2 606 2 811 2 953 Mokopane 2 473 3 254 3 281 3 848 3 544 3 763 3 962 Phalaborwa 2 064 2 754 2 747 4 419 3 645 3 874 4 072 Polokwane 6 562 6 924 8 769 3 773 3 054 3 244 3 406 Seshego 2 102 1 874 1 747 11 339 9 750 10 350 10 908 Thoyoyandou 3 165 4 471 4 963 2 476 1 961 2 213 2 332 Tzaneen 2 574 2 962 4 025 6 762 5 536 4 629 4 874 Mpumalanga 50 825 56 245 63 661 169 391 138 196 146 152 152 598 Provincial Office: Witbank 22 591 24 884 18 539 84 696 69 098 73 076 76 299 Barberton 1 248 1 157 1 690 30 054 22 758 23 912 24 867 Bethal 1 008 1 321 1 912 2 396 1 855 1 954 2 045 Carolina 1 900 1 958 3 969 2 877 2 203 2 317 2 422 Ermelo 1 519 1 593 2 089 4 040 3 560 3 763 3 955

Vote 18: Labour
43
Table 18.E Expenditure by labour center per province (continued) Subprogramme Adjusted Audited outcome appropriation Medium-term expenditure estimate R thousand 2008/09 2009/10 2010/11 2011/12 2012/13 2013/14 2014/15 Groblersdal 1 442 1 602 1 852 2 870 2 624 2 768 2 901 Kamhlushwa 1 282 1 609 2 514 3 291 2 655 2 792 2 924 Kwamhlanga 1 393 1 600 2 465 3 343 2 597 2 730 2 860 Lydenburg 1 343 1 441 2 068 2 742 2 302 2 423 2 536 Middelburg 2 158 2 763 3 741 4 926 4 044 4 267 4 478 Nelspruit 3 186 3 583 4 798 6 271 5 124 5 558 5 678 Piet Retief 2 179 2 063 3 180 3 710 3 311 3 493 3 666 Sabie 1 445 1 646 1 983 2 807 2 104 2 211 2 310 Secunda 1 977 2 353 3 521 4 491 3 882 4 106 4 314 Standerton 1 315 1 527 2 399 2 677 2 461 2 558 2 682 Witbank 4 839 5 145 6 940 8 201 7 617 8 225 8 661 North West 46 535 51 570 55 049 76 344 60 583 65 961 69 539 Provincial Office: Mmabatho 19 979 21 011 18 619 31 752 21 899 24 122 25 380 Brits 2 499 3 179 4 451 5 364 4 739 5 065 5 350 Christiana 1 894 1 971 1 998 2 681 2 193 2 356 2 484 Klerksdorp 4 343 5 066 6 118 7 781 6 479 6 945 7 332 Lichtenburg 2 362 2 690 3 431 3 862 3 605 3 853 4 068 Mafikeng 3 350 4 057 5 033 6 445 5 227 5 759 6 078 Mogwase 1 991 1 973 2 027 2 680 2 208 2 374 2 503 Potchefstroom 2 455 2 322 3 134 3 539 3 320 3 801 4 008 Rustenburg 3 077 4 384 5 224 6 403 5 642 6 038 6 379 Taung 2 584 2 926 2 138 2 761 2 334 2 506 2 644 Vryburg 2 001 1 991 2 876 3 075 2 938 3 141 3 314 Northern Cape 28 545 34 929 38 776 54 607 41 709 46 036 56 015 Provincial Office: Kimberley 12 800 15 254 16 369 26 486 18 454 20 513 21 673 Calvinia 1 544 2 134 2 148 2 897 2 231 2 377 2 506 De Aar 1 737 1 918 2 276 2 483 2 333 2 486 2 620 Kimberley 4 692 5 944 7 310 9 022 7 400 8 539 9 015 Kuruman 2 007 2 568 2 610 3 404 2 817 2 900 3 028 Postmasburg 1 637 1 900 2 288 3 238 2 240 2 387 2 516 Springbok 1 918 2 173 2 548 3 002 2 670 2 849 10 456 Upington 2 210 3 038 3 227 4 076 3 564 3 984 4 202 Western Cape 65 588 69 403 77 545 107 472 84 662 90 827 95 573 Provincial Office: Cape Town 22 645 21 799 20 923 35 867 23 993 26 168 27 436 Beaufort West 1 867 1 775 2 156 2 853 2 163 2 304 2 426 Bellville 7 432 7 977 10 227 12 119 11 167 11 871 12 524 Cape Town 11 298 12 988 14 505 18 298 15 578 16 601 17 504 George 3 712 5 016 5 785 7 700 6 238 6 657 7 009 Knysna 1 923 2 054 2 264 3 115 2 508 2 684 2 824 Mitchell's Plein 2 274 2 550 3 036 3 941 2 888 3 082 3 247 Mossel Bay 1 880 1 801 2 180 3 186 2 413 2 586 2 718 Oudtshoorn 1 601 1 784 2 666 3 147 2 781 2 967 3 122 Paarl 2 686 2 845 3 119 4 093 3 341 3 568 3 759 Somerset West 3 000 3 041 3 888 4 837 4 189 4 457 4 698 Vredenburg 2 442 2 796 3 404 3 925 3 718 3 957 4 169 Worcester 2 828 2 977 3 392 4 389 3 683 3 926 4 138 Total 548 055 653 036 715 941 1 060 100 853 781 891 380 969 914

2012 Estimates of National Expenditure
44

Estim
ates o
f Natio
na
l expen
ditu
re
National TreasuryDepartment:
REPUBLIC OF SOUTH AFRICA
national treasury
N a t i o n a l T r e a s u r y
estimates of national expenditure
Private Bag X115, Pretoria, 0001, Tel: +27 12 395 6697, Fax: +27 12 315 5126