Vote 12 Public Service and Administration - National … budget/2012/enebooklets/Vot… · National...
62
National Treasury ESTIMATES OF NATIONAL EXPENDITURE VOTE 12 Public Service and Administration National Treasury Department: REPUBLIC OF SOUTH AFRICA national treasury
Transcript of Vote 12 Public Service and Administration - National … budget/2012/enebooklets/Vot… · National...
N a t i o n a l T r e a s u r y
estimates of national expenditure
vote 12 Public Service and Administration
National TreasuryDepartment:
REPUBLIC OF SOUTH AFRICA
national treasury
Final Budget 2012 Votes Covers_Print.indd 12 2012/02/20 9:07 AM

Estim
ates o
f Natio
na
l expen
ditu
re
Estimates of
National Expenditure
2012
National Treasury
Republic of South Africa
22 February 2012

ISBN: 978-0-621-40578-1
RP: 01/2012
The Estimates of National Expenditure 2012 e-publications are compiled with the latest available information from departmental and other sources. Some of this information is unaudited or subject to revision. The Estimates of National Expenditure e-publications for individual votes are available on www.treasury.gov.za. Compared to the abridged version of the Estimates of National Expenditure, these publications contain more comprehensive coverage of goods and services, transfers and subsidies, and public entities. Additional tables are included containing information on the main and adjusted appropriation, with revised spending estimates for the current financial year, on skills training, conditional grants to provinces and municipalities, public private partnerships and information on donor funding. Expenditure information at the level of service delivery is also included, where appropriate.

Foreword The current global economic context is characterised by high levels of uncertainty. Against this backdrop, South Africa’s development depends largely on government improving its level and quality of service delivery in support of the inclusive and equitable economic roadmap, as contained in the new growth path. The 2012 Budget is an important tool of government for giving effect to these objectives, and this Budget allocates resources to specific interventions that will be actioned over the period of the medium term expenditure framework (MTEF). Growth in spending focuses particularly on infrastructure development, job creation, enterprise support and the enhancement of local government delivery.
South Africa’s fiscal stance and public spending programmes are focused on long term structural transformation. Over the next three years of the MTEF period, government priorities will continue to be realised within a sustainable fiscal trajectory, which balances current needs with intergenerational equity. In line with this, spending baselines have undergone rigorous review, areas of inefficiency and lower priority have been identified, and funds have been redirected towards government’s key priorities, both new and existing. This has been done in recognition of the relationship between the composition of spending and fiscal sustainability over the long term. Here, the balance between consumption and investment is extremely important. Even the distribution of consumption spending between wages, goods and services and transfers is significant, as is the balance between the functional categories expenditure (such as education, health and economic services). Underspending on key priorities undermines the aims of the spending proposed within MTEF Budgets.
Since introducing the functional approach to budget decision-making in 2009, transparency and coordination in budgeting has been enhanced, largely due to the participation by the stakeholders responsible for delivery across all spheres of government. South African budget reforms, especially the intensified focus on budget trade-offs and the composition of expenditure, will lead to greater accountability and improved control.
It is not enough to demonstrate a change in the composition of budgeted expenditure; nor is it enough to pinpoint the specific actions required and proposed within the Budget. Success will only be achieved when we can demonstrate that a shift in the composition of actual expenditure has taken place, together with the achievement of improved delivery targets.
This year, the layout of this publication has been altered substantially. The focus is on linking more closely expenditure planned with targeted performance. Specific focus is on the outcomes to which institutions contribute and the output and other performance measures supporting them. The sections covering employee numbers, personnel budgets and the purpose and key activities of each subprogramme within a vote are now more prominent, giving expression to the budget and service delivery. This publication still indicates details per vote of the allocation of new monies, monies reprioritised between or within budget programmes, and Cabinet approved budget reductions over the period ahead. Compared to the abridged version of the Estimates of National Expenditure, the e-publications for each vote contain more comprehensive coverage of goods and services, transfers and subsidies, and public entities. Additional tables are included, containing information on: the main and adjusted appropriation, with revised spending estimates for the current financial year; skills training; conditional grants to provinces and municipalities; public private partnerships; and donor funding. Expenditure information at the level of service delivery is also included, where appropriate.
The expenditure estimates of departments are the outcome of a rigorous administrative and executive process. Treasury budget analysts, under the guidance of the Ministers’ Committee on the Budget, follow a wide-ranging intergovernmental consultative process, working closely with the policy and budget teams of departments and entities to ensure that government priorities are appropriately funded within the available resource envelope. The Treasury is grateful for the contribution of these teams. Appreciation is also due to the people in the Treasury team, who worked with great diligence to produce a high quality document that provides a comprehensive account of government’s spending and performance plans.
Lungisa Fuzile Director General: National Treasury

Introduction
The Estimates of National Expenditure publications The Estimates of National Expenditure publications are important accountability documents, which set out the details in relation to planned expenditure and planned performance at the time of the tabling of the Budget. Estimates of National Expenditure publications continue to make a significant contribution to the changes relating to budgeting by programme. As part of these ongoing efforts, several changes have been made to the 2012 Estimates of National Expenditure publications. Departments still provide information on the key objectives of each subprogramme within a programme, and note the activities carried out, the number of personnel responsible for undertaking these activities and the funding allocations supporting this. This year in the 2012 publications, information on expenditure and performance is more closely linked under the ’expenditure trends’ section, with a brief discussion on the impact of budget allocations on the achievement of outputs over the seven-year period. In addition, an explanation of the personnel trends, per programme by salary level, over the seven years in relation to compensation of employees has also been included. Finally, information on Cabinet approved cost reduction measures and other budget reprioritisation has been included per programme.
The 2012 abridged Estimates of National Expenditure publication, and the separate Estimates of National Expenditure e-publications for each vote are the product of an extensive consultative review process of budgets and policy, and policy implementation by programme, and include the latest improvements in non-financial performance information. These publications provide the details of the spending estimates for the next three financial years (2012/13 to 2014/15), expenditure outcomes for the past three years (2008/09 to 2010/11) and revised estimates for the current financial year (2011/12). Information is provided on performance targets over the seven year period as well as changes in these, as they relate to trends in planned expenditure.
The e-publications for individual votes contain more comprehensive coverage of goods and services, transfers and subsidies, and public entities. Additional tables are included containing information on: the main and adjusted appropriation, with revised spending estimates for the current financial year; skills training; conditional grants to provinces and municipalities; public private partnerships; and donor funding. Expenditure information at the level of service delivery is also included, where appropriate.
A consolidated account, summarising the Estimates of National Expenditure publication information across votes, is provided in the form of a narrative and summary tables in the Introduction chapter, which is included in the front pages of the abridged version of the Estimates of National Expenditure. A write-up containing the explanation of the information that is contained in each section of the publications has also been included in the abridged version of the Estimates of National Expenditure. Like the separate Estimates of National Expenditure e-publications for each vote, the abridged Estimates of National Expenditure publication is also available on www.treasury.gov.za.

Public Service and Administration
National Treasury
Republic of South Africa
Contents
Budget summary ............................................................................................................................... 1
Aim .................................................................................................................................................. 1
Programme purposes ....................................................................................................................... 1
Strategic overview: 2008/09 – 2014/15 ............................................................................................ 2
Selected performance indicators .................................................................................................... 3
Expenditure estimates ..................................................................................................................... 4
Personnel information ...................................................................................................................... 6
Departmental receipts ...................................................................................................................... 7
Programme 1: Administration ......................................................................................................... 7
Programme 2: Human Resource Management and Development ............................................... 9
Programme 3: Labour Relations and Remuneration Management ............................................ 13
Programme 4: Public Sector Information and Communication Technology Management ..... 15
Programme 5: Service Delivery and Organisational Transformation ........................................ 18
Programme 6: Governance and International Relations ............................................................. 22
Other departments within the vote ................................................................................................ 25
Public entities and other agencies................................................................................................. 32
Additional tables .............................................................................................................................. 43
1
Vote 12 Public Service and Administration
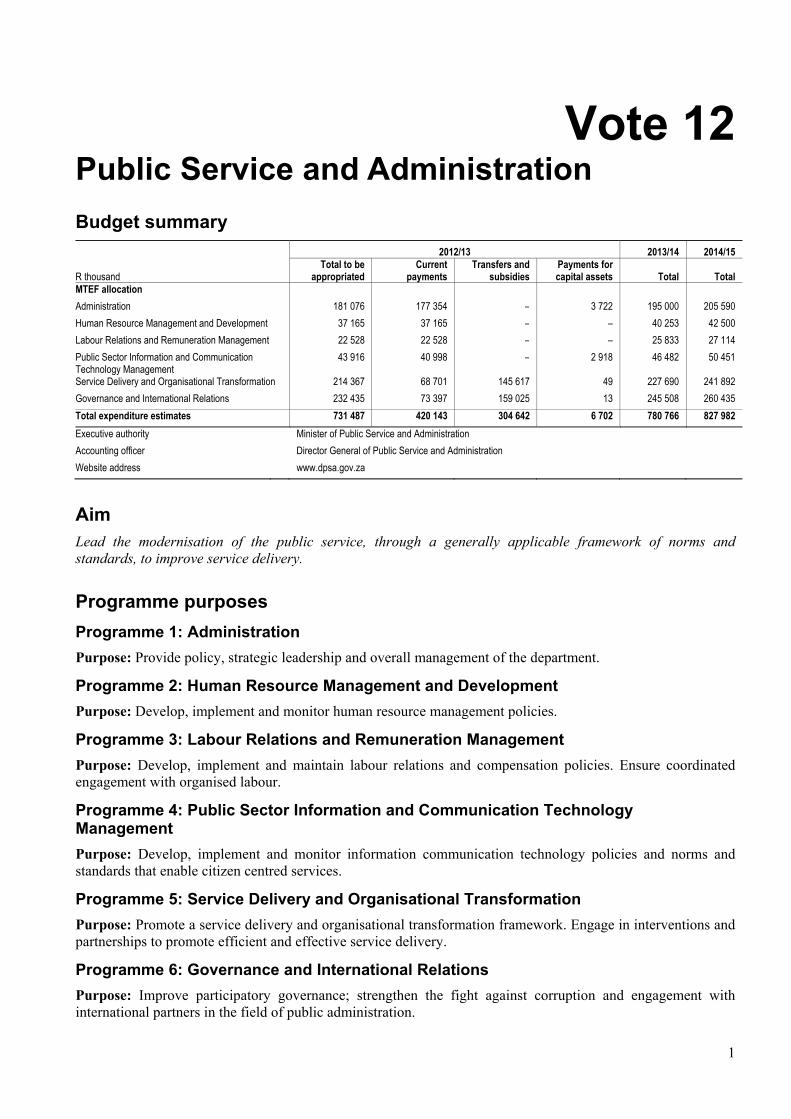
Budget summary 2012/13 2013/14 2014/15
R thousand Total to be
appropriated Current
payments Transfers and
subsidies Payments for capital assets Total Total
MTEF allocation
Administration 181 076 177 354 – 3 722 195 000 205 590
Human Resource Management and Development 37 165 37 165 – – 40 253 42 500
Labour Relations and Remuneration Management 22 528 22 528 – – 25 833 27 114
Public Sector Information and Communication Technology Management
43 916 40 998 – 2 918 46 482 50 451
Service Delivery and Organisational Transformation 214 367 68 701 145 617 49 227 690 241 892
Governance and International Relations 232 435 73 397 159 025 13 245 508 260 435
Total expenditure estimates 731 487 420 143 304 642 6 702 780 766 827 982
Executive authority Minister of Public Service and Administration
Accounting officer Director General of Public Service and Administration
Website address www.dpsa.gov.za
Aim Lead the modernisation of the public service, through a generally applicable framework of norms and standards, to improve service delivery.
Programme purposes
Programme 1: Administration
Purpose: Provide policy, strategic leadership and overall management of the department.
Programme 2: Human Resource Management and Development
Purpose: Develop, implement and monitor human resource management policies.
Programme 3: Labour Relations and Remuneration Management
Purpose: Develop, implement and maintain labour relations and compensation policies. Ensure coordinated engagement with organised labour.
Programme 4: Public Sector Information and Communication Technology Management
Purpose: Develop, implement and monitor information communication technology policies and norms and standards that enable citizen centred services.
Programme 5: Service Delivery and Organisational Transformation
Purpose: Promote a service delivery and organisational transformation framework. Engage in interventions and partnerships to promote efficient and effective service delivery.
Programme 6: Governance and International Relations
Purpose: Improve participatory governance; strengthen the fight against corruption and engagement with international partners in the field of public administration.

2012 Estimates of National Expenditure
2
Strategic overview: 2008/09 – 2014/15 The Department of Public Service and Administration draws its mandate from section 195(1) of the Constitution, which sets out basic values and principles that the public service should adhere to, and from the Public Service Act (1994). In terms of the act, the Minister for Public Service and Administration is responsible for: establishing norms and standards relating to the functions of the public service; organisational structures and establishments of departments, and other organisational and governance arrangements in the public service; labour relations within the public service; conditions of service and other employment practices for employees; the health and wellness of employees; information management including electronic government in the public service; integrity, ethics, conduct and anti-corruption; and transformation, reform, innovation and any other matters relating to the improvement of the effectiveness and efficiency of the public service and its service delivery to the public.
Government and departmental outcomes In 2010, the minister was responsible for coordinating the drive for an effective, efficient and development oriented public service and a fair and inclusive citizenship (outcome 12), which has been translated into a delivery agreement for the period 2010 to 2014. The delivery agreement identifies interventions that should be implemented to fast-track the improvement of service delivery as specific outputs of the department: service delivery quality and access; effective systems, structures and processes; leveraging information and communication technology as a strategic resource; effective employment entry into public service and human resource development and cadre development; healthy, safe working environments for all public servants; appropriate governance structures and decision making; citizen engagement and public participation; as well as combating corruption in Africa and internationally.
The department will be working towards improved and more effective public sector accountability by ensuring that the Batho Pele principles are further entrenched in the public service.
The department continues to work closely with its entities, the State Information Technology Agency and Public Services Sector Education and Training Authority, to improve the effectiveness and efficiency of the public service and its service delivery to the public.
Medium term objectives The department’s medium term objectives are informed by the outputs of the delivery agreement for outcome 12, which represent its strategic objectives as well as government’s overall agenda for delivery. The department’s priorities in relation to the transformation and modernisation of the public service include: improving levels of compliance in departments; improving service delivery and ensuring more effective governance; fighting corruption in the public service; and contributing to the transformation of the public service internationally, especially in post-conflict countries, through lesson sharing and targeted interventions. In line with these objectives, specific interventions over the medium term include:
Performance management
The department will identify indicators for measuring the effectiveness of the performance management system, and use the data obtained to improve its efficiency. All senior managers will sign performance agreements and qualitative measures will be developed for assessing performance agreements.
Conditions of service
Conditions of service for public service employees will be improved through revising existing policies by March 2013. Home ownership will be promoted among public servants through the introduction of a housing scheme for government employees.
Service delivery quality and access
Service user satisfaction surveys will be conducted to assess the level of satisfaction with government services among citizens. A set of measures to assess whether the public service is being responsive to the needs of citizens will be developed to assist departments to improve waiting and turnaround times, especially at hospitals, offices of the Department of Home Affairs and vehicle licensing centres. Targets will be set and plans developed for a progressive reduction in the distances travelled by citizens to access government services.
Vote 12: Public Service and Administration
3
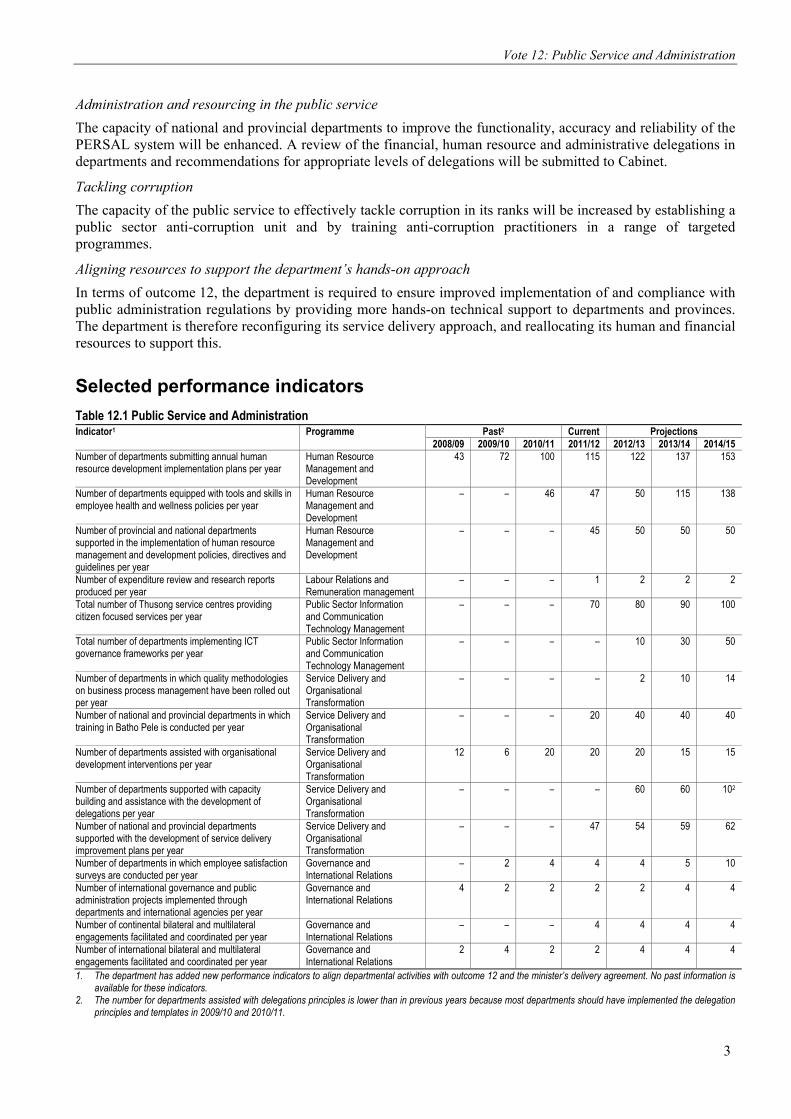
Administration and resourcing in the public service
The capacity of national and provincial departments to improve the functionality, accuracy and reliability of the PERSAL system will be enhanced. A review of the financial, human resource and administrative delegations in departments and recommendations for appropriate levels of delegations will be submitted to Cabinet.
Tackling corruption
The capacity of the public service to effectively tackle corruption in its ranks will be increased by establishing a public sector anti-corruption unit and by training anti-corruption practitioners in a range of targeted programmes.
Aligning resources to support the department’s hands-on approach
In terms of outcome 12, the department is required to ensure improved implementation of and compliance with public administration regulations by providing more hands-on technical support to departments and provinces. The department is therefore reconfiguring its service delivery approach, and reallocating its human and financial resources to support this.
Selected performance indicators
Table 12.1 Public Service and Administration Indicator1 Programme Past2 Current Projections 2008/09 2009/10 2010/11 2011/12 2012/13 2013/14 2014/15Number of departments submitting annual human resource development implementation plans per year
Human Resource Management and Development
43 72 100 115 122 137 153
Number of departments equipped with tools and skills in employee health and wellness policies per year
Human Resource Management and Development
– – 46 47 50 115 138
Number of provincial and national departments supported in the implementation of human resource management and development policies, directives and guidelines per year
Human Resource Management and Development
– – – 45 50 50 50
Number of expenditure review and research reports produced per year
Labour Relations and Remuneration management
– – – 1 2 2 2
Total number of Thusong service centres providing citizen focused services per year
Public Sector Information and Communication Technology Management
– – – 70 80 90 100
Total number of departments implementing ICT governance frameworks per year
Public Sector Information and Communication Technology Management
– – – – 10 30 50
Number of departments in which quality methodologies on business process management have been rolled out per year
Service Delivery andOrganisational Transformation
– – – – 2 10 14
Number of national and provincial departments in which training in Batho Pele is conducted per year
Service Delivery andOrganisational Transformation
– – – 20 40 40 40
Number of departments assisted with organisational development interventions per year
Service Delivery andOrganisational Transformation
12 6 20 20 20 15 15
Number of departments supported with capacity building and assistance with the development of delegations per year
Service Delivery andOrganisational Transformation
– – – – 60 60 102
Number of national and provincial departments supported with the development of service delivery improvement plans per year
Service Delivery and Organisational Transformation
– – – 47 54
59 62
Number of departments in which employee satisfaction surveys are conducted per year
Governance andInternational Relations
– 2 4 4 4 5 10
Number of international governance and public administration projects implemented through departments and international agencies per year
Governance andInternational Relations
4 2 2 2 2 4 4
Number of continental bilateral and multilateral engagements facilitated and coordinated per year
Governance and International Relations
– – – 4 4 4 4
Number of international bilateral and multilateral engagements facilitated and coordinated per year
Governance and International Relations
2 4 2 2 4 4 4
1. The department has added new performance indicators to align departmental activities with outcome 12 and the minister’s delivery agreement. No past information is available for these indicators.
2. The number for departments assisted with delegations principles is lower than in previous years because most departments should have implemented the delegation principles and templates in 2009/10 and 2010/11.
2012 Estimates of National Expenditure
4
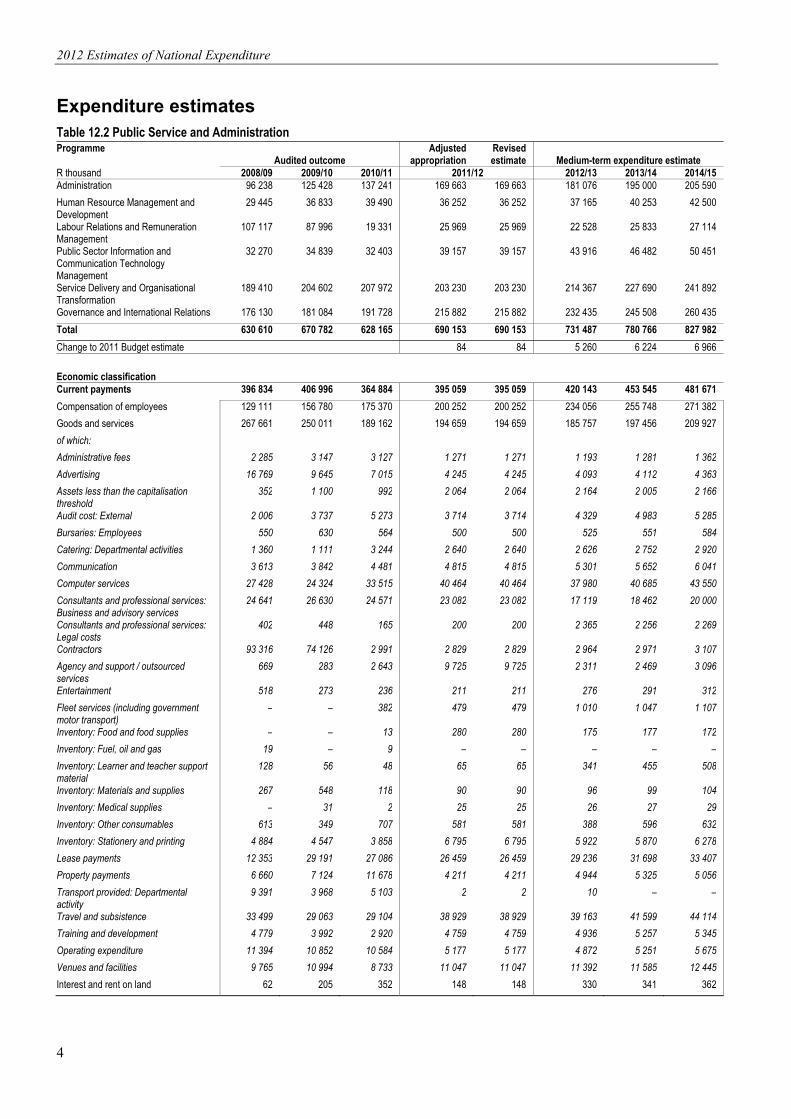
Expenditure estimates Table 12.2 Public Service and Administration Programme
Audited outcome Adjusted
appropriation Revised estimate Medium-term expenditure estimate
R thousand 2008/09 2009/10 2010/11 2011/12 2012/13 2013/14 2014/15 Administration 96 238 125 428 137 241 169 663 169 663 181 076 195 000 205 590
Human Resource Management and Development
29 445 36 833 39 490 36 252 36 252 37 165 40 253 42 500
Labour Relations and Remuneration Management
107 117 87 996 19 331 25 969 25 969 22 528 25 833 27 114
Public Sector Information and Communication Technology Management
32 270 34 839 32 403 39 157 39 157 43 916 46 482 50 451
Service Delivery and Organisational Transformation
189 410 204 602 207 972 203 230 203 230 214 367 227 690 241 892
Governance and International Relations 176 130 181 084 191 728 215 882 215 882 232 435 245 508 260 435
Total 630 610 670 782 628 165 690 153 690 153 731 487 780 766 827 982
Change to 2011 Budget estimate 84 84 5 260 6 224 6 966
Economic classification Current payments 396 834 406 996 364 884 395 059 395 059 420 143 453 545 481 671
Compensation of employees 129 111 156 780 175 370 200 252 200 252 234 056 255 748 271 382
Goods and services 267 661 250 011 189 162 194 659 194 659 185 757 197 456 209 927
of which:
Administrative fees 2 285 3 147 3 127 1 271 1 271 1 193 1 281 1 362
Advertising 16 769 9 645 7 015 4 245 4 245 4 093 4 112 4 363
Assets less than the capitalisation threshold
352 1 100 992 2 064 2 064 2 164 2 005 2 166
Audit cost: External 2 006 3 737 5 273 3 714 3 714 4 329 4 983 5 285
Bursaries: Employees 550 630 564 500 500 525 551 584
Catering: Departmental activities 1 360 1 111 3 244 2 640 2 640 2 626 2 752 2 920
Communication 3 613 3 842 4 481 4 815 4 815 5 301 5 652 6 041
Computer services 27 428 24 324 33 515 40 464 40 464 37 980 40 685 43 550
Consultants and professional services: Business and advisory services
24 641 26 630 24 571 23 082 23 082 17 119 18 462 20 000
Consultants and professional services: Legal costs
402 448 165 200 200 2 365 2 256 2 269
Contractors 93 316 74 126 2 991 2 829 2 829 2 964 2 971 3 107
Agency and support / outsourced services
669 283 2 643 9 725 9 725 2 311 2 469 3 096
Entertainment 518 273 236 211 211 276 291 312
Fleet services (including government motor transport)
– – 382 479 479 1 010 1 047 1 107
Inventory: Food and food supplies – – 13 280 280 175 177 172
Inventory: Fuel, oil and gas 19 – 9 – – – – –
Inventory: Learner and teacher support material
128 56 48 65 65 341 455 508
Inventory: Materials and supplies 267 548 118 90 90 96 99 104
Inventory: Medical supplies – 31 2 25 25 26 27 29
Inventory: Other consumables 613 349 707 581 581 388 596 632
Inventory: Stationery and printing 4 884 4 547 3 858 6 795 6 795 5 922 5 870 6 278
Lease payments 12 353 29 191 27 086 26 459 26 459 29 236 31 698 33 407
Property payments 6 660 7 124 11 678 4 211 4 211 4 944 5 325 5 056
Transport provided: Departmental activity
9 391 3 968 5 103 2 2 10 – –
Travel and subsistence 33 499 29 063 29 104 38 929 38 929 39 163 41 599 44 114
Training and development 4 779 3 992 2 920 4 759 4 759 4 936 5 257 5 345
Operating expenditure 11 394 10 852 10 584 5 177 5 177 4 872 5 251 5 675
Venues and facilities 9 765 10 994 8 733 11 047 11 047 11 392 11 585 12 445
Interest and rent on land 62 205 352 148 148 330 341 362
Vote 12: Public Service and Administration
5
Table 12.2 Public Service and Administration (continued)
Audited outcome Adjusted
appropriation Revised estimate Medium-term expenditure estimate
R thousand 2008/09 2009/10 2010/11 2011/12 2012/13 2013/14 2014/15
Economic classification Transfers and subsidies 223 020 254 343 256 210 291 067 291 067 304 642 321 152 340 387Provinces and municipalities 1 1 2 2 2 – – –
Departmental agencies and accounts 219 021 252 902 253 009 290 416 290 416 304 044 320 522 339 725
Foreign governments and international organisations
671 555 477 478 478 598 630 662
Non-profit institutions – – 1 – – – – –
Households 3 327 885 2 721 171 171 – – –Payments for capital assets 10 584 9 437 6 933 4 027 4 027 6 702 6 069 5 924
Machinery and equipment 10 068 9 273 6 933 3 893 3 893 6 457 5 013 4 784
Software and other intangible assets 516 164 – 134 134 245 1 056 1 140Payments for financial assets 172 6 138 – – – – –
Total 630 610 670 782 628 165 690 153 690 153 731 487 780 766 827 982
Expenditure trends
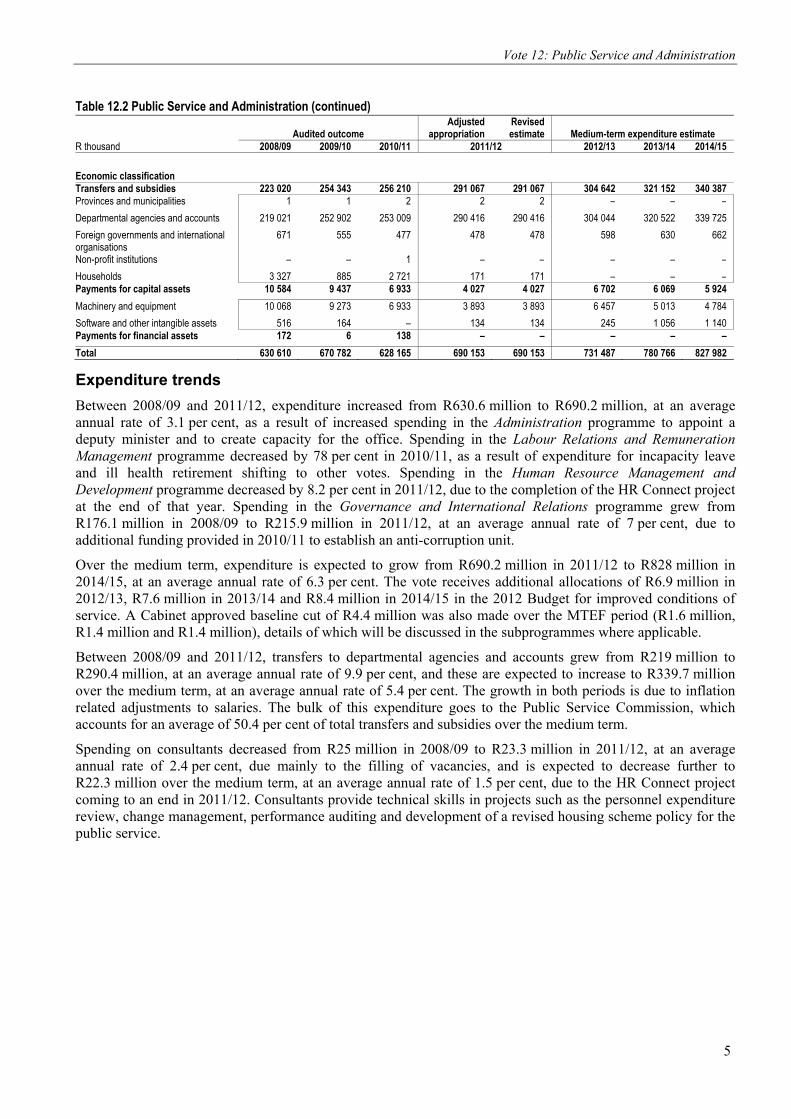
Between 2008/09 and 2011/12, expenditure increased from R630.6 million to R690.2 million, at an average annual rate of 3.1 per cent, as a result of increased spending in the Administration programme to appoint a deputy minister and to create capacity for the office. Spending in the Labour Relations and Remuneration Management programme decreased by 78 per cent in 2010/11, as a result of expenditure for incapacity leave and ill health retirement shifting to other votes. Spending in the Human Resource Management and Development programme decreased by 8.2 per cent in 2011/12, due to the completion of the HR Connect project at the end of that year. Spending in the Governance and International Relations programme grew from R176.1 million in 2008/09 to R215.9 million in 2011/12, at an average annual rate of 7 per cent, due to additional funding provided in 2010/11 to establish an anti-corruption unit.
Over the medium term, expenditure is expected to grow from R690.2 million in 2011/12 to R828 million in 2014/15, at an average annual rate of 6.3 per cent. The vote receives additional allocations of R6.9 million in 2012/13, R7.6 million in 2013/14 and R8.4 million in 2014/15 in the 2012 Budget for improved conditions of service. A Cabinet approved baseline cut of R4.4 million was also made over the MTEF period (R1.6 million, R1.4 million and R1.4 million), details of which will be discussed in the subprogrammes where applicable.
Between 2008/09 and 2011/12, transfers to departmental agencies and accounts grew from R219 million to R290.4 million, at an average annual rate of 9.9 per cent, and these are expected to increase to R339.7 million over the medium term, at an average annual rate of 5.4 per cent. The growth in both periods is due to inflation related adjustments to salaries. The bulk of this expenditure goes to the Public Service Commission, which accounts for an average of 50.4 per cent of total transfers and subsidies over the medium term.
Spending on consultants decreased from R25 million in 2008/09 to R23.3 million in 2011/12, at an average annual rate of 2.4 per cent, due mainly to the filling of vacancies, and is expected to decrease further to R22.3 million over the medium term, at an average annual rate of 1.5 per cent, due to the HR Connect project coming to an end in 2011/12. Consultants provide technical skills in projects such as the personnel expenditure review, change management, performance auditing and development of a revised housing scheme policy for the public service.
2012 Estimates of National Expenditure
6
Personnel information Table 12.3 Details of approved establishment and personnel numbers according to salary level1
Personnel post status as at 30 September 2011 Number of personnel posts filled / planned for on funded establishment Number of posts Number Number of posts
on approved of funded Additional to the establishment posts establishment Actual Mid-year2 Medium-term estimate
2008/09 2009/10 2010/11 2011/12 2012/13 2013/14 2014/15
Department 491 469 30 385 435 466 491 491 501 506
Salary level 1 – 6 143 140 17 117 131 147 143 143 144 145
Salary level 7 – 10 126 122 9 110 118 125 126 126 126 127
Salary level 11 – 12 107 104 4 79 96 92 107 107 114 116
Salary level 13 – 16 115 103 – 79 90 102 115 115 117 118
Administration 229 229 23 190 193 220 229 229 231 232
Salary level 1 – 6 99 99 11 93 87 97 99 99 100 101
Salary level 7 – 10 62 62 8 58 58 64 62 62 62 62
Salary level 11 – 12 34 34 4 22 28 29 34 34 35 35
Salary level 13 – 16 34 34 – 17 20 30 34 34 34 34
Human Resource Management and Development
52 52 2 68 78 49 52 52 54 54
Salary level 1 – 6 7 7 1 10 19 6 7 7 7 7
Salary level 7 – 10 12 12 1 12 12 11 12 12 12 12
Salary level 11 – 12 19 19 – 29 30 19 19 19 21 21
Salary level 13 – 16 14 14 – 17 17 13 14 14 14 14
Labour Relations and Remuneration Management
31 31 1 42 47 27 31 31 34 34
Salary level 1 – 6 4 4 1 4 4 3 4 4 4 4
Salary level 7 – 10 10 10 – 15 18 10 10 10 10 10
Salary level 11 – 12 9 9 – 12 12 8 9 9 11 11
Salary level 13 – 16 8 8 – 11 13 6 8 8 9 9
Public Sector Information and Communication Technology Management
22 – – 21 22 16 22 22 22 24
Salary level 1 – 6 3 – – 2 3 2 3 3 3 3
Salary level 7 – 10 4 – – 3 3 3 4 4 4 4
Salary level 11 – 12 3 – – 3 3 2 3 3 3 4
Salary level 13 – 16 12 – – 13 13 9 12 12 12 13
Service Delivery and Organisational Transformation
95 95 1 32 53 107 95 95 97 98
Salary level 1 – 6 18 18 1 4 9 30 18 18 18 18
Salary level 7 – 10 19 19 – 13 16 23 19 19 19 20
Salary level 11 – 12 29 29 – 5 13 27 29 29 30 30
Salary level 13 – 16 29 29 – 10 15 27 29 29 30 30
Governance and International Relations
62 62 3 32 42 47 62 62 63 64
Salary level 1 – 6 12 12 3 4 9 9 12 12 12 12
Salary level 7 – 10 19 19 – 9 11 14 19 19 19 19
Salary level 11 – 12 13 13 – 8 10 7 13 13 14 15
Salary level 13 – 16 18 18 – 11 12 17 18 18 18 18
1. Data has been provided by the department and may not necessarily reconcile with official government personnel data.2. As at 30 September 2011.
Vote 12: Public Service and Administration
7
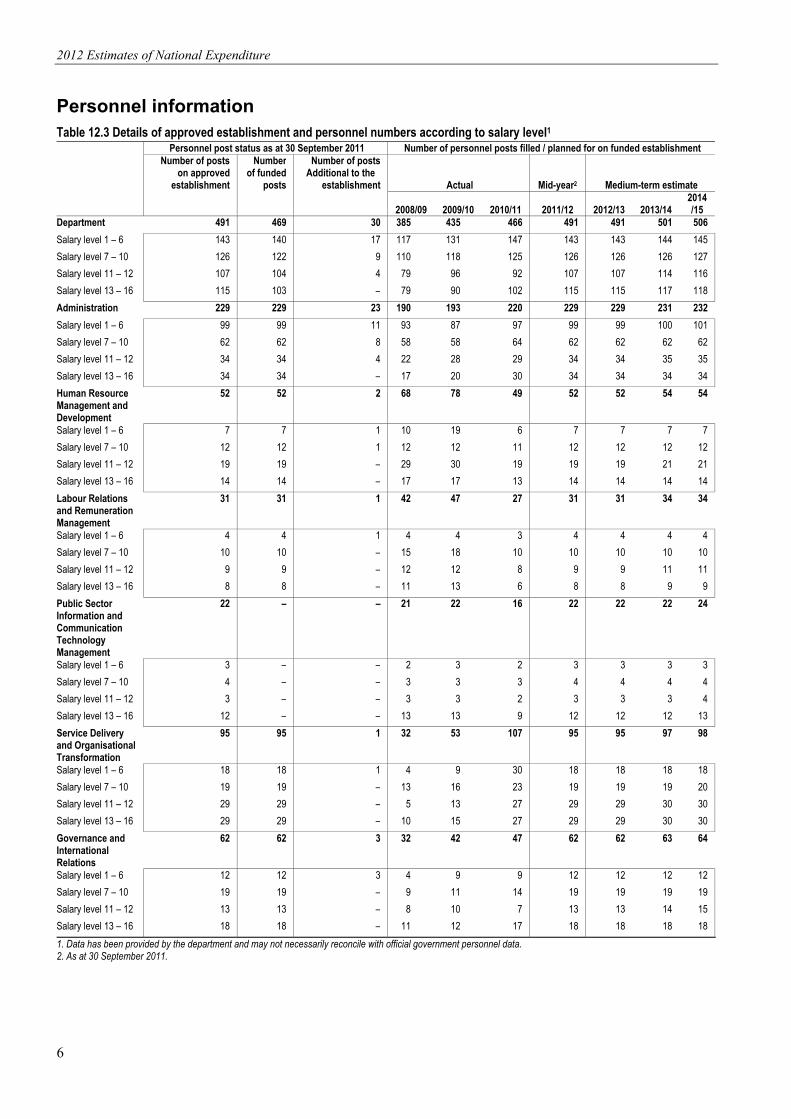
As at 30 September 2011, the department had an approved establishment of 491 posts and 30 posts created that were additional to the establishment. There were 59 vacant posts due to staff turnover. The number of filled posts grew from 385 in 2008/09 to 491 in 2011/12. Over the MTEF period, the number of filled posts is expected to increase to 506, due to the department’s expansion to accommodate the minister’s broader mandate in line with the delivery agreement. The ratio of support staff to line function staff is 1:2.
Departmental receipts Table 12.4 Receipts
Audited outcome
Adjusted estimate
Revised estimate Medium-term receipts estimate
R thousand 2008/09 2009/10 2010/11 2011/12 2012/13 2013/14 2014/15
Departmental receipts 962 2 242 2 098 740 740 766 801 831
Sales of goods and services produced by department
197 223 247 270 270 286 301 316
Sales by market establishments 147 178 194 220 220 230 240 250
of which:
Rental of open and covered parking 147 178 194 220 220 230 240 250
Administration fees 50 45 53 50 50 56 61 66
of which:
Commission insurance 50 45 53 50 50 55 60 65
Replacement of security cards – – – – – 1 1 1
Interest, dividends and rent on land 23 8 21 40 40 35 40 40
Interest 23 8 21 40 40 35 40 40
Sales of capital assets – 1 064 – – – – – –
Transactions in financial assets and liabilities
742 947 1 830 430 430 445 460 475
Total 962 2 242 2 098 740 740 766 801 831
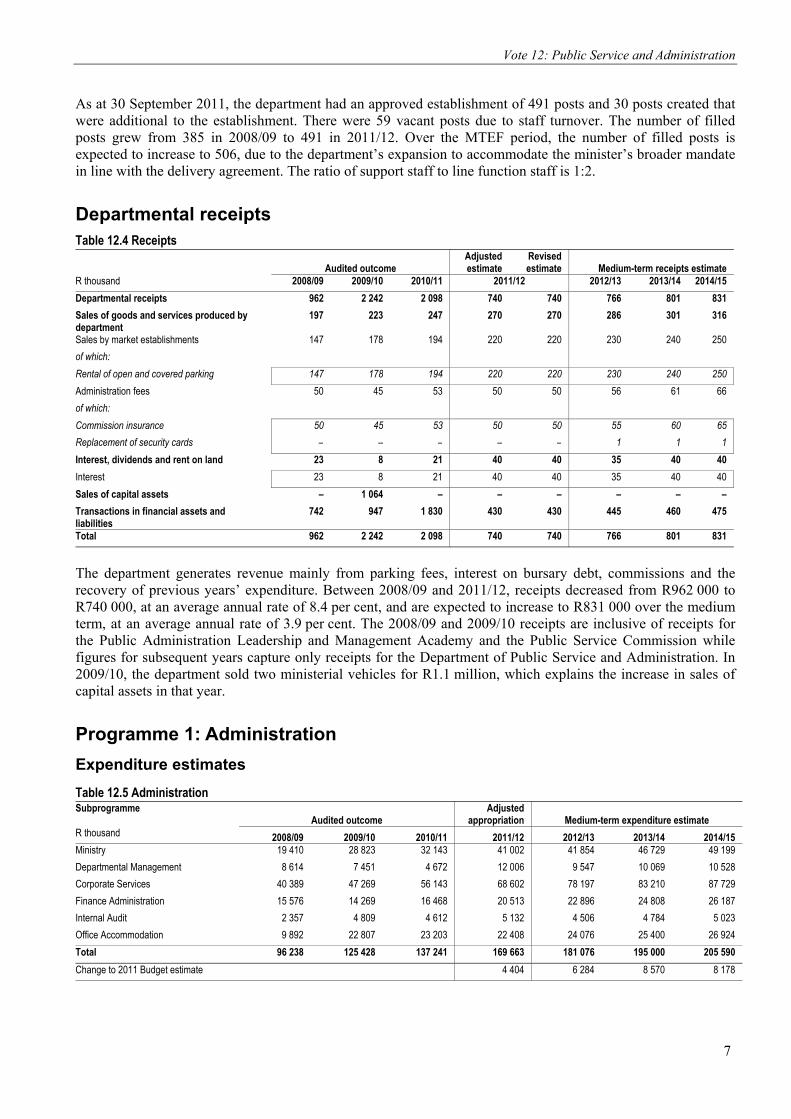
The department generates revenue mainly from parking fees, interest on bursary debt, commissions and the recovery of previous years’ expenditure. Between 2008/09 and 2011/12, receipts decreased from R962 000 to R740 000, at an average annual rate of 8.4 per cent, and are expected to increase to R831 000 over the medium term, at an average annual rate of 3.9 per cent. The 2008/09 and 2009/10 receipts are inclusive of receipts for the Public Administration Leadership and Management Academy and the Public Service Commission while figures for subsequent years capture only receipts for the Department of Public Service and Administration. In 2009/10, the department sold two ministerial vehicles for R1.1 million, which explains the increase in sales of capital assets in that year.
Programme 1: Administration
Expenditure estimates
Table 12.5 Administration Subprogramme
Audited outcome Adjusted
appropriation Medium-term expenditure estimate R thousand 2008/09 2009/10 2010/11 2011/12 2012/13 2013/14 2014/15 Ministry 19 410 28 823 32 143 41 002 41 854 46 729 49 199
Departmental Management 8 614 7 451 4 672 12 006 9 547 10 069 10 528
Corporate Services 40 389 47 269 56 143 68 602 78 197 83 210 87 729
Finance Administration 15 576 14 269 16 468 20 513 22 896 24 808 26 187
Internal Audit 2 357 4 809 4 612 5 132 4 506 4 784 5 023
Office Accommodation 9 892 22 807 23 203 22 408 24 076 25 400 26 924
Total 96 238 125 428 137 241 169 663 181 076 195 000 205 590
Change to 2011 Budget estimate 4 404 6 284 8 570 8 178

2012 Estimates of National Expenditure
8
Table 12.5 Administration (continued)
Audited outcome Adjusted
appropriation Medium-term expenditure estimate R thousand 2008/09 2009/10 2010/11 2011/12 2012/13 2013/14 2014/15 Economic classification
Current payments 91 517 120 833 133 656 165 967 177 354 191 889 202 801
Compensation of employees 47 417 57 903 65 660 85 206 98 758 107 703 113 053
Goods and services 44 068 62 747 67 754 80 680 78 453 84 031 89 582
of which:
Administrative fees 511 890 940 544 589 630 666
Advertising 3 035 1 280 1 522 2 274 2 202 2 164 2 301
Assets less than the capitalisation threshold
222 274 228 1 446 1 979 1 822 1 974
Audit cost: External 998 1 609 3 268 3 599 4 191 4 817 5 109
Bursaries: Employees 550 630 562 500 525 551 584
Catering: Departmental activities 285 574 664 1 152 1 191 1 293 1 370
Communication 1 681 1 563 1 906 1 866 1 990 2 169 2 307
Computer services 3 731 5 615 10 727 13 320 11 431 12 602 13 809
Consultants and professional services: Business and advisory services
1 082 2 505 495 2 432 1 051 1 101 1 175
Consultants and professional services: Legal costs
333 71 165 200 245 256 269
Contractors 827 1 703 1 494 1 856 1 821 1 911 2 003
Agency and support / outsourced services
– – 1 141 2 199 100 110 117
Entertainment 125 102 124 91 162 170 182
Fleet services (including government motor transport)
– – 345 479 441 471 501
Inventory: Food and food supplies – – 3 101 65 66 66
Inventory: Fuel, oil and gas – – 1 – – – –
Inventory: Learner and teacher support material
9 49 45 65 341 455 508
Inventory: Materials and supplies 219 93 109 90 96 99 104
Inventory: Medical supplies – 31 – 25 26 27 29
Inventory: Other consumables 486 294 603 539 364 572 606
Inventory: Stationery and printing 2 248 1 623 1 796 1 919 2 019 2 064 2 183
Lease payments 8 440 22 084 20 360 20 841 22 144 23 586 25 001
Property payments 2 862 3 524 4 504 3 491 3 454 3 825 4 054
Transport provided: Departmental activity
1 545 998 1 042 – – – –
Travel and subsistence 10 377 11 736 10 105 16 190 16 321 17 151 18 141
Training and development 1 143 976 668 1 324 1 364 1 464 1 553
Operating expenditure 1 759 2 613 3 647 3 055 2 792 2 896 3 114
Venues and facilities 1 600 1 910 1 290 1 082 1 549 1 759 1 856
Interest and rent on land 32 183 242 81 143 155 166
Transfers and subsidies 1 105 240 85 54 – – –
Provinces and municipalities 1 1 1 2 – – –
Foreign governments and international organisations
12 6 – – – – –
Households 1 092 233 84 52 – – –
Payments for capital assets 3 600 4 350 3 491 3 642 3 722 3 111 2 789
Machinery and equipment 3 484 4 350 3 491 3 642 3 622 2 961 2 609
Software and other intangible assets 116 – – – 100 150 180
Payments for financial assets 16 5 9 – – – –
Total 96 238 125 428 137 241 169 663 181 076 195 000 205 590

Vote 12: Public Service and Administration
9
Table 12.5 Administration (continued)
Audited outcome Adjusted
appropriation Medium-term expenditure estimate R thousand 2008/09 2009/10 2010/11 2011/12 2012/13 2013/14 2014/15
Details of transfers and subsidies
Foreign governments and international organisations
Current 12 6 – – – – –
Gifts and donations 12 6 – – – – –
Households
Other transfers to households
Current 1 092 233 84 52 – – –
Gifts and donations 5 – 2 – – – –
Claims against the state 95 – – – – – –
Employee social benefits 992 233 82 52 – – –
Provinces and municipalities
Municipalities
Municipal bank accounts
Current 1 1 1 2 – – –
Vehicle licenses 1 1 1 2 – – –
Expenditure trends
Expenditure increased from R96.2 million in 2008/09 to R169.7 million in 2011/12, at an average annual rate of 20.8 per cent. This was due to increased spending in the Ministry subprogramme, which grew from R19.4 million to R41 million, at an average annual rate of 28.3 per cent over this period, due to the appointment of a deputy minister and for creating capacity for ministerial support services. This, along with filling vacant posts, mostly at the senior management level, increased spending on compensation of employees between 2008/09 and 2011/12. Expenditure in the Office Accommodation subprogramme increased from R9.9 million in 2008/09 to R22.4 million in 2011/12, at an average annual rate of 31.3 per cent, due to the devolution of accommodation funds from the Department of Public Works.
Over the medium term, expenditure is expected to increase to R205.6 million in 2014/15, at an average annual rate of 6.6 per cent, due to additional funding for improved conditions of service. Spending in the Internal Audit subprogramme is expected to decrease from R5.1 million in 2011/12 to R4.5 million in 2012/13, due to the contract for the co-sourcing of the internal audit function with an external service provider coming to an end in 2011/12. This also explains the decrease in spending on consultants from R2.6 million in 2011/12 to R1.4 million in 2014/15, at an average annual rate of 18.1 per cent.
Programme 2: Human Resource Management and Development
Objectives and measures
• Provide support to departments in planning for human resource development and monitoring against set targets through a strategy to coordinate efforts initiated by various state organs on internships and learnerships aimed at providing work experience to youth and unemployed graduates.
• Promote the use of efficient human resource management policies, practices, norms and standards by developing a policy on compulsory capacity development and mandatory training days for senior management services by March 2013.
• Reduce the vacancy rate from the estimated baseline of 11 per cent to 5 per cent by March 2014 and improve the recruitment process by conducting research on current practices and best practices, developing appropriate interventions, identifying categories where special recruitment measures should be introduced, and developing guidelines on improving the practice of career management by March 2013.
• Strengthen the performance management development system for senior management services by reviewing and redrafting the performance management development system policy to align it with the outcome of the
2012 Estimates of National Expenditure
10
institutional performance assessment of the Department of Performance Monitoring and Evaluation by 2013.
• Strengthen, support and improve the human resource management practices for senior management services members to achieve a highly competent, dedicated, responsive and productive leadership cadre for enhanced service delivery by rendering ongoing support to departments on competency based assessments by March 2013.
• Increase the number of government departments implementing employee health and wellness policies from 46 in 2011/12 to 86 by March 2013 by developing the capacity to implement these policies through workshops, policy advocacy and communication sessions, organisational systems and governance initiatives as and when required over the MTEF period.
• Contribute to Cabinet’s target to increase the representation of women at senior management levels from 37.4 per cent as at March 2011 to 50 per cent by March 2014, and of disabled persons from 0.3 per cent as at March 2011 to 2 per cent by March 2014 by developing and communicating diversity management related strategies by March 2013.
• Produce 2 reports based on the analysis of the implementation of gender, disability and youth frameworks by all departments by March 2013 with the view to developing and communicating strategies to improve the recruitment and retention of women, persons living with disabilities and youth in the public service.
• Improve disability and gender mainstreaming and the implementation of strategies to facilitate the transformation of departments within the public service by capacitating gender and disability focal points through 1 national and 9 provincial workshops by March 2013.
• Modernise and enhance the effectiveness of public service human resource and financial systems by continually enhancing the human resource module of the integrated financial management system and finalising its implementation in 2 lead sites, starting with the rollout to the rest of the public service by March 2013.
Subprogrammes
• Management: Human Resource Management provides for administrative support and management of the programme. This subprogramme had a staff complement of 3 and a total budget of R2.8 million in 2011/12, of which 67 per cent was used for compensation of employees. In 2011/12, support was provided in the form of a performance assessment tool to measure organisational performance linked to the performance evaluation of heads of departments. Departments were also supported in the implementation of the human resource planning strategic framework. The implementation of the HR Connect skills database in the outstanding 55 departments will be completed by March 2012.
• Senior Management Services ensures that there is a professional management service in the public service. This is done by establishing and implementing competency based management through developing transversal employment policies, prescripts and guidelines, and other career practices for senior management service members. This subprogramme had a staff complement of 7 and a total budget of R4.6 million in 2011/12, of which 67.1 per cent was used for compensation of employees. In 2011/12, skills gaps of senior management services members were analysed in 46 departments. The senior management services handbook is currently being reviewed. The use of competency assessment results has been workshopped in 45 departments, and site visits were conducted in 2011/12 to support departments in implementing the assessments for senior management services. The cost of the project is estimated at R200 000. An expenditure cut of R5 000 will be implemented in 2012/13 on the use of venues and facilities.
• Human Resource Planning, Performance and Practice develops policies, prescripts, processes and systems that provide advice and implementation support to improve human resource planning, employment practices and employee performance management. This subprogramme had a staff complement of 15 and a total budget of R10.2 million in 2011/12, of which 63.6 per cent was used for compensation of employees. The original contract value to the department of the work for these 55 departments was R724 470. An expenditure cut of R27 000 will be implemented in the allocation for venues and facilities in 2012/13.
• Diversity Management develops policies and guidelines on employment equity in the public service that are intended to remove access barriers into and within the workplace for designated groups, and prevent direct

Vote 12: Public Service and Administration
11
and indirect discrimination against the designated groups. This subprogramme had a staff complement of 9 and a total budget of R4.8 million in 2011/12, of which 83 per cent was used for compensation of employees. In 2011/12: a template was developed and distributed to collect information on the status of gender mainstreaming in each department; a mid-year statistical report on gender representation at senior management services level based on PERSAL data was completed; the half-yearly report for the representation of race and gender in the public service was developed; and the employment equity guide was launched in September 2011. The activities were funded from the normal operational budget of the department. An expenditure cut of R13 000 will be implemented in 2012/13 on venues and facilities.
• Employee Health and Wellness promotes and manages health and wellness in the public service and improves the quality of work life through focused strategies and a holistic framework. This subprogramme had a staff complement of 6 and a total budget of R5.5 million in 2011/12, of which 61 per cent was used for compensation of employees. The following outputs were achieved in 2011/12: the steering committee on the development of a comprehensive integrated health risk assessment tool was reformed; 41 national departments and 6 provincial structures were supported on the implementation of employment, health and wellness policies; support was provided to KwaZulu-Natal, Gauteng and Mpumalanga on the implementation of sex-related HIV prevention programmes and the pilot phases on the implementation of a sex related HIV public expenditure tracking survey; and the quality of service delivery survey in KwaZulu-Natal was completed. R29 000 will be cut in 2012/13 on venues and facilities.
• Human Resource Development aims to improve the competency levels of public servants through capacity development activities such as internships, learnerships and skills programmes designed to ensure a constant pool of productive and contributing employees. This subprogramme had a staff complement of 7 and a total budget of R5.5 million in 2011/12, of which 67.2 per cent was used for compensation of employees. In 2011/12, the subprogramme participated in human resources development forums throughout the public service in an effort to support departments in their implementation of the human resources development strategic framework. A draft policy for the optimum use of training budgets was developed and presented at the human resources development management steering committee. Draft guidelines on e-learning were developed and will be presented at the Government Information Technology Officers’ Council. The allocated amount to venues and facilities will be cut by R4 000 in 2012/13.
• Integrated Financial Management Systems develops, implements and manages the human resources component of the integrated financial management system project. This subprogramme had a staff complement of 4 and a total budget of R2.8 million in 2011/12, of which 79.5 per cent was used for compensation of employees. In 2010/11, the development of the human resources management module of the integrated financial management system was completed and implemented in the Department of Public Service and Administration. The development and implementation cost of this project resides in National Treasury’s budget. No savings were identified in this subprogramme.
Expenditure estimates
Table 12.6 Human Resource Management and Development Subprogramme
Audited outcome Adjusted
appropriation Medium-term expenditure estimate R thousand 2008/09 2009/10 2010/11 2011/12 2012/13 2013/14 2014/15 Management: Human Resource Management
3 463 3 779 2 690 2 760 2 876 3 052 3 213
Senior Management Services 3 013 2 485 3 490 4 640 4 844 4 989 5 249
Human Resource Planning, Performances and Practice
9 605 16 117 18 288 10 227 10 283 11 199 12 074
Diversity Management 3 622 4 596 4 759 4 760 5 428 5 794 6 063
Employee Health and Wellness 4 517 5 050 4 039 5 531 5 696 6 021 6 369
Human Resource Development 4 333 3 339 4 317 5 516 4 878 5 354 5 443
Integrated Financial Management Systems
892 1 467 1 907 2 818 3 160 3 844 4 089
Total 29 445 36 833 39 490 36 252 37 165 40 253 42 500Change to 2011 Budget estimate 2 286 (397) (756) (1 059)

2012 Estimates of National Expenditure
12
Table 12.6 Human Resource Management and Development (continued)
Audited outcome Adjusted
appropriation Medium-term expenditure estimate R thousand 2008/09 2009/10 2010/11 2011/12 2012/13 2013/14 2014/15 Economic classification Current payments 29 119 36 744 39 294 36 134 37 165 40 253 42 500
Compensation of employees 17 273 18 125 22 146 25 119 27 348 29 996 31 586
Goods and services 11 838 18 615 17 124 10 997 9 788 10 227 10 881
of which:
Administrative fees 275 234 243 141 101 110 121
Advertising 313 99 18 45 77 34 36
Assets less than the capitalisation threshold
2 3 22 1 1 1 1
Audit cost: External 285 378 – – – – –
Catering: Departmental activities 46 64 335 616 462 490 520
Communication 330 355 361 495 527 565 599
Computer services 863 1 125 146 146 162 173 184
Consultants and professional services: Business and advisory services
2 895 10 309 11 699 1 675 208 139 147
Contractors 43 21 24 41 5 5 5
Entertainment 30 42 15 7 3 3 4
Fleet services (including government motor transport)
– – 4 – 91 97 102
Inventory: Food and food supplies – – 1 25 14 14 14
Inventory: Learner and teacher support material
116 1 – – – – –
Inventory: Materials and supplies – 17 – – – – –
Inventory: Other consumables 7 2 2 – – – –
Inventory: Stationery and printing 274 331 103 332 371 396 421
Lease payments 198 140 – 138 143 150 158
Transport provided: Departmental activity
– 52 100 – – – –
Travel and subsistence 3 285 2 649 2 612 3 798 3 959 4 698 4 756
Training and development 1 206 1 235 368 372 300 306 323
Operating expenditure 279 512 129 88 194 171 226
Venues and facilities 1 391 1 046 942 3 077 3 170 2 875 3 264
Interest and rent on land 8 4 24 18 29 30 33
Transfers and subsidies 2 2 64 81 – – –
Foreign governments and international organisations
– – – 3 – – –
Households 2 2 64 78 – – –
Payments for capital assets 324 87 126 37 – – –
Machinery and equipment 324 87 126 37 – – –
Payments for financial assets – – 6 – – – –
Total 29 445 36 833 39 490 36 252 37 165 40 253 42 500
Details of transfers and subsidies Foreign governments and international organisations
Current – – – 3 – – –
Gift to foreign dignitary – – – 3 – – –
Households
Other transfers to households
Current 2 2 64 78 – – –
Gifts and donations 2 – – – – – –Claim against the state – – 64 – – – –Employee social benefits – 2 – 78 – – –
Vote 12: Public Service and Administration
13
Expenditure trends
Expenditure increased from R29.4 million in 2008/09 to R36.3 million in 2011/12, at an average annual rate of 7.2 per cent. This is due mainly to allocations of R8.9 million to the Human Resource Planning subprogramme in 2009/10 and 2010/11 for the rollout of the HR Connect project to departments. The HR Connect project will be completed by the end of 2011/12, which explains the significant decline in spending on consultants and professional services in this period. Between 2008/09 and 2011/12, spending in the Integrated Financial Management Systems subprogramme increased from R892 000 to R2.8 million, at an average annual rate of 46.7 per cent, as a result of the development and implementation of the human resources management module of the integrated financial management system.
Over the medium term, expenditure is expected to increase to R42.5 million, at an average annual rate of 5.4 per cent, due to higher spending on compensation of employees to provide for improved conditions of service. The rising expenditure trend over the medium term is in line with performance projections for the programme over the same period. The funds will be used to increase the number of departments supported to implement employee health and wellness policies per year, from 25 in 2011/12 to 138 in 2014/15.
Programme 3: Labour Relations and Remuneration Management
Objectives and measures
• Advance and promote the achievement of stable multi-term remuneration arrangements in the public service by March 2013 through regular strategic analysis, engagement and negotiations with public sector trade unions at negotiation forums, including the Public Service Coordinating Bargaining Council, sector councils, and the National Economic Development and Labour Council, on an ongoing basis in 2012/13.
• Improve the personnel expenditure framework in support of promoting the effectiveness and efficiencies of personnel expenditure and sustainability of the wage bill by March 2013 through quarterly analysis of personnel expenditure, research and provision of policy advisory services on an ongoing basis in 2012/13.
• Improve the conditions of service for public service employees through the revision of existing policies such as the housing policy, long service recognition and the rearrangement of working time by March 2013.
• Improve efficiency in spending in the public service by reviewing the current remuneration policy framework in the Public Service Coordinating Bargaining Council by March 2013.
• Develop the Government Employees Housing Scheme and institutional framework with the objective of promoting home ownership in the public service by March 2015.
Subprogrammes
• Management: Labour Relations and Remuneration provides administrative support and management for the programme. This subprogramme had a staff complement of 3 and a total budget of R2.2 million in 2011/12, of which 67.8 per cent was used for compensation of employees. No savings were identified in this subprogramme.
• Remuneration and Market Analysis develops, implements and maintains policies, practices and systems on remuneration, including implementing the occupation specific dispensation. This subprogramme had a staff complement of 8 and a total budget of R9.2 million in 2011/12, of which 40.5 per cent was used for compensation of employees. The bid process for the appointment of a service provider to assist with the personnel expenditure review has been finalised and development work began in the fourth quarter of 2011/12. The personnel expenditure review is expected to begin in 2012/13, and expenditure on this is projected to be R4.5 million. No savings were identified in this subprogramme.
• Conditions of Service focuses on the development, implementation and maintenance of policies and practices on general and macro benefits, including the implementation of the occupation specific dispensation. This subprogramme had a staff complement of 12 and a total budget of R8.8 million in 2011/12, of which 57.9 per cent was used for compensation of employees. The performance audit on ill

2012 Estimates of National Expenditure
14
health managers will start in early 2012. The projected cost of the audit is R2.9 million. An expenditure cut of R10 000 will be implemented in 2012/13 on the use of venues and facilities.
• Labour Relations and Negotiations is responsible for the development, implementation and maintenance of policies and systems on labour relations issues for the public service and to ensure coordinated collective bargaining in the Public Service Coordinating Bargaining Council and the General Public Service Sectoral Bargaining Council. This subprogramme had a staff complement of 9 and a total budget of R5.7 million in 2011/12, of which 75.3 per cent was used for compensation of employees. An expenditure cut of R46 000 will be implemented in 2012/13 on venues and facilities.
Expenditure estimates
Table 12.7 Labour Relations and Remuneration Management Subprogramme
Audited outcome Adjusted
appropriation Medium-term expenditure estimate R thousand 2008/09 2009/10 2010/11 2011/12 2012/13 2013/14 2014/15
Management: Labour Relations and Remuneration
3 613 3 050 1 349 2 233 2 590 2 737 2 884
Remuneration and Market Analysis 4 241 4 712 4 205 9 233 5 601 6 805 7 163
Conditions of Service 94 076 75 160 5 928 8 764 8 889 10 091 10 474
Labour Relations and Negotiations 5 187 5 074 7 849 5 739 5 448 6 200 6 593
Total 107 117 87 996 19 331 25 969 22 528 25 833 27 114
Change to 2011 Budget estimate 2 696 (875) (32) (281)
Economic classification
Current payments 106 978 87 982 17 513 25 943 22 528 25 833 27 114
Compensation of employees 12 407 13 176 11 566 14 641 16 526 19 570 20 430
Goods and services 94 566 74 803 5 931 11 293 5 980 6 239 6 659
of which:
Administrative fees 165 362 128 65 72 70 76
Advertising 494 67 2 864 – 33 – –
Assets less than the capitalisation threshold
18 3 12 – – – –
Audit cost: External 192 305 – – – – –
Catering: Departmental activities 64 25 60 29 44 54 58
Communication 232 232 200 300 322 346 366
Computer services 706 822 62 51 54 57 62
Consultants and professional services: Business and advisory services
1 070 158 989 8 268 2 725 3 040 3 222
Consultants and professional services: Legal costs
45 377 – – – – –
Contractors 88 899 70 224 15 27 – – –
Entertainment 17 15 16 – 8 8 9
Fleet services (including government motor transport)
– – 4 – 68 73 78
Inventory: Food and food supplies – – 2 38 18 18 18
Inventory: Learner and teacher support material
3 6 1 – – – –
Inventory: Materials and supplies – 1 – – – – –
Inventory: Other consumables 10 6 – – – – –
Inventory: Stationery and printing 281 153 196 219 230 242 256
Lease payments 31 77 – 100 105 110 116
Transport provided: Departmental activity
– – 82 – – – –
Travel and subsistence 1 788 1 342 939 1 698 1 869 1 776 1 882
Training and development 85 172 138 274 291 308 326
Operating expenditure 44 130 75 70 52 56 59
Venues and facilities 422 326 148 154 89 81 131
Interest and rent on land 5 3 16 9 22 24 25

Vote 12: Public Service and Administration
15
Table 12.7 Labour Relations and Remuneration Management (continued)
Audited outcome Adjusted
appropriation Medium-term expenditure estimate R thousand 2008/09 2009/10 2010/11 2011/12 2012/13 2013/14 2014/15
Economic classification
Transfers and subsidies – – 1 671 – – – –
Households – – 1 671 – – – –
Payments for capital assets 139 14 122 26 – – –
Machinery and equipment 139 14 122 26 – – –
Payments for financial assets – – 25 – – – –
Total 107 117 87 996 19 331 25 969 22 528 25 833 27 114
Details of transfers and subsidies
Households
Other transfers to households
Current – – 1 671 – – – –
Gifts and donations – – 4 – – – –
Employee social benefits – – 1 667 – – – –
Expenditure trends
Expenditure decreased significantly from R107.1 million in 2008/09 to R26 million in 2011/12, at an average annual rate of 37.6 per cent. The decrease in expenditure was mainly in the Conditions of Service subprogramme, where spending decreased by R69.2 million over this period, due to the decentralisation of provisions for incapacity leave and ill health retirement to individual national departments.
Over the medium term, expenditure is expected to grow to R27.1 million, at an average annual rate of 1.4 per cent. The increase is mainly due to higher spending on compensation of employees to provide for improved conditions of service. The slower growth in expenditure is in line with performance projections for the programme over the same period. The targets for the programme are projected to remain constant over the medium term.
Over the medium term, R9 million is allocated for spending on consultants to assist with developing policies on improving conditions of service.
Programme 4: Public Sector Information and Communication Technology Management
Objectives and measures
• Contribute to the improvement of service delivery by: – validating ICT infrastructure at 100 connected Thusong service centres by March 2013 – completing the connectivity blueprint for connecting schools to ICT Infrastructure by March 2013 – implementing the next generation e-government platform by revising e-government policy and strategic
framework by March 2013 – conducting an audit of e-government and mobile government services by March 2013.
• Enhance IT governance by developing an ICT management framework and draft implementation guidelines for the public service by March 2013.
• Improve government’s IT security by: – developing the minimum information security standards framework by March 2013 – conducting research on the identity management framework by March 2013.
• Reduce government ICT costs over the MTEF period by:

2012 Estimates of National Expenditure
16
– consolidating and optimising IT infrastructure and service management through the development of a government wide ICT strategy and a shared services blueprint to assist departments and municipalities to improve security and reduce the costs of ICT by March 2013
– optimising network infrastructure, improving on the way software is being procured through a software transversal contract, and implementing a software licence audit by 2013.
• Connect government institutions and enable more effective service delivery by developing a broadband strategy for the public service by March 2013.
Subprogrammes
• Management: Public Sector Information and Communication Technology provides administrative support and management for the programme. This subprogramme had a staff complement of 3 and a total budget of R4.8 million in 2011/12, of which 78 per cent is used for goods and services. No savings were identified in this subprogramme.
• E-Government provides support and leadership to national and provincial departments and the State Information Technology Agency in the development of a government wide architecture and system integration plan. This subprogramme had a staff complement of 5 and a total budget of R4.1 million in 2011/12, of which 50.4 per cent was used for goods and services. In 2010/11, the Government Information Technology Officers’ Council was assisted to develop an ICT strategy for the public service, and terms of reference were developed and published for the development of an e-government policy, strategy and implementation. The development of the strategy is estimated to cost R500 000. No expenditure cuts were implemented in this subprogramme.
• Information and Communication Technology Policy and Planning develops policies, strategies and regulations on ICT across the public service, oversees the State Information Technology Agency, provides secretarial services to the Government Information Technology Officers’ Council, and oversees all ICT initiatives in the public service. This subprogramme had a staff complement of 6 and a total budget of R5.4 million in 2011/12, of which 56.1 per cent was used for compensation of employees. The following outputs were achieved in 2011: workshops were conducted for all Government Information Technology Officers’ Council members on strengthening IT functions in the public service and on COBIT, an IT governance framework and toolset. No savings were identified in this subprogramme.
• Information and Communication Technology Infrastructure and Operations supports all national and provincial departments on significant transversal projects and e-government projects. This subprogramme had a staff complement of 8 and a total budget of R24.9 million in 2011/12, of which 85.3 per cent was used for goods and services. The draft pre-consultative governance of ICT framework in the public service was developed in 2010/11. In the same year, the local area network cabling of all Thusong service centres in Gauteng was completed. In the Gauteng centres, post-development care of the infrastructure was completed and a very small aperture terminal was deployed. A cut of R506 000 in 2012/13 in computer services has been implemented in this subprogramme.
Expenditure estimates
Table 12.8 Public Sector Information and Communication Technology Management Subprogramme
Audited outcome Adjusted
appropriation Medium-term expenditure estimate R thousand 2008/09 2009/10 2010/11 2011/12 2012/13 2013/14 2014/15 Management: Public Sector Information and Communication Technology
4 553 4 024 2 759 4 830 5 801 6 107 6 454
E-Government 2 338 5 133 4 017 4 107 4 979 5 248 5 528
Information and Communication Technology Policy and Planning
6 040 6 055 3 652 5 351 5 512 5 792 6 929
Information and Communication Technology Infrastructure and Operations
19 339 19 627 21 975 24 869 27 624 29 335 31 540
Total 32 270 34 839 32 403 39 157 43 916 46 482 50 451
Change to 2011 Budget estimate (1 705) (462) (1 787) (662)
Vote 12: Public Service and Administration
17
Table 12.8 Public Sector Information and Communication Technology Management (continued)
Audited outcome Adjusted
appropriation Medium-term expenditure estimate R thousand 2008/09 2009/10 2010/11 2011/12 2012/13 2013/14 2014/15 Economic classification
Current payments 30 166 32 830 32 147 38 979 40 998 43 576 47 371
Compensation of employees 8 097 9 468 9 553 9 579 13 561 14 326 16 379
Goods and services 22 066 23 360 22 582 29 393 27 421 29 234 30 974
of which:
Administrative fees 101 109 99 75 80 76 81
Advertising 153 35 – 12 13 14 15
Assets less than the capitalisation threshold
8 359 18 84 89 94 99
Audit cost: External 105 156 562 – – – –
Catering: Departmental activities 76 58 186 197 218 234 248
Communication 238 215 239 209 227 246 260
Computer services 16 606 13 743 16 784 21 423 19 689 21 218 22 476
Consultants and professional services: Business and advisory services
724 5 946 2 315 2 400 2 520 2 646 2 808
Contractors 8 4 14 47 30 31 32
Agency and support / outsourced services
– – – 250 158 166 176
Entertainment 50 19 13 12 17 20 21
Fleet services (including government motor transport)
– – 2 – 49 54 57
Inventory: Food and food supplies – – 2 26 18 18 18
Inventory: Learner and teacher support material
– – 1 – – – –
Inventory: Materials and supplies 46 1 1 – – – –
Inventory: Other consumables 4 – 5 5 5 5 5
Inventory: Stationery and printing 117 143 126 514 540 568 602
Lease payments 56 41 – 70 74 78 84
Transport provided: Departmental activity
– – 125 – – – –
Travel and subsistence 2 120 1 437 948 2 720 2 849 2 848 3 019
Training and development 378 740 471 208 220 233 247
Operating expenditure 670 61 549 147 140 149 158
Venues and facilities 606 293 122 994 485 536 568
Interest and rent on land 3 2 12 7 16 16 18
Transfers and subsidies – 2 6 25 – – –
Households – 2 6 25 – – –
Payments for capital assets 2 104 2 007 241 153 2 918 2 906 3 080
Machinery and equipment 2 104 2 007 241 19 2 773 2 000 2 120
Software and other intangible assets – – – 134 145 906 960
Payments for financial assets – – 9 – – – –
Total 32 270 34 839 32 403 39 157 43 916 46 482 50 451
Details of transfers and subsidies
Households
Other transfers to households
Current – 2 6 25 – – –
Employee social benefits – 2 6 25 – – –
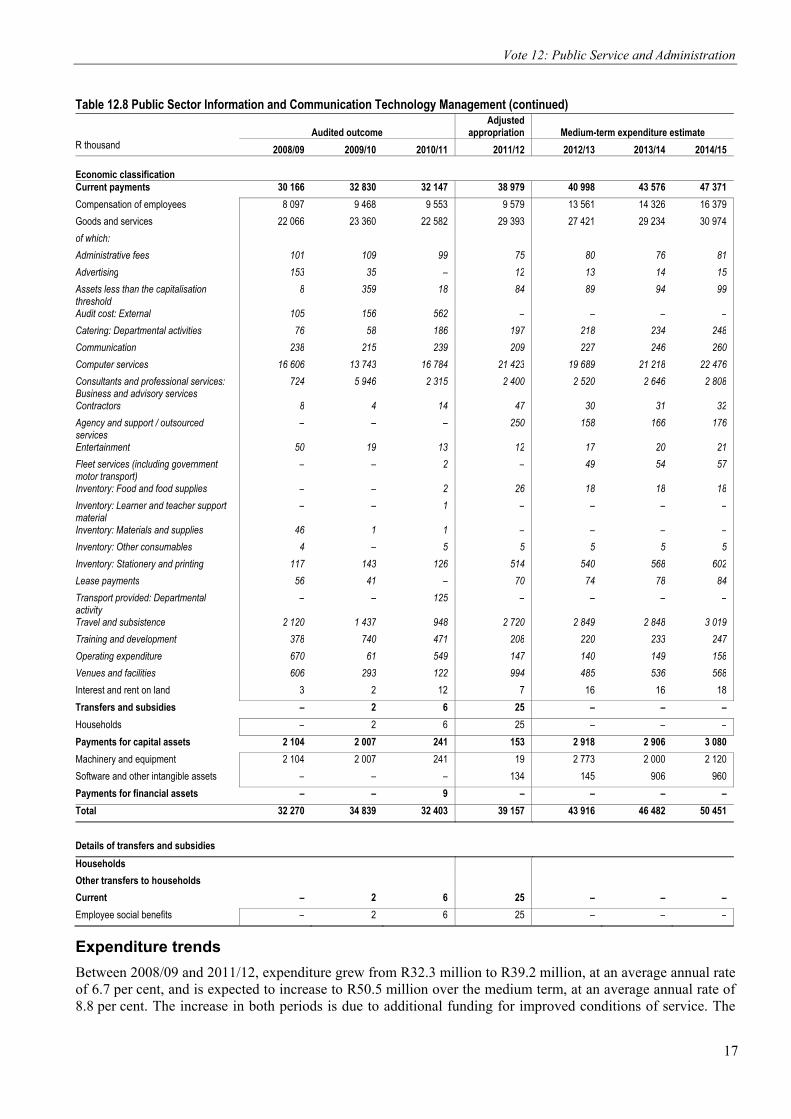
Expenditure trends
Between 2008/09 and 2011/12, expenditure grew from R32.3 million to R39.2 million, at an average annual rate of 6.7 per cent, and is expected to increase to R50.5 million over the medium term, at an average annual rate of 8.8 per cent. The increase in both periods is due to additional funding for improved conditions of service. The
2012 Estimates of National Expenditure
18
department’s target for the number of Thusong service centres providing citizen focused services per year increases from 70 in 2011/12 to 100 in 2014/15. Thus, over the medium term, 10 new Thusong service centres per year will be established, at an estimated total cost of R19 million per year. Over the medium term, R64 million is allocated to maintain existing centres.
This programme makes use of consultants to provide technical expertise related to ICT. In 2011/12, R2.4 million was provided for work related to the renewal and review of IT transversal tenders and a specialist technical architect was contracted to support the execution of the e-government project, government wide enterprise architecture and government wide IT plan. R8 million is allocated for consultants between 2012/13 and 2014/15 to assist with the development of a broadband policy for the public service, and audits on software licences, identity management and mobile government services.
Programme 5: Service Delivery and Organisational Transformation
Objectives and measures
• Contribute to the implementation of service delivery quality improvement initiatives by developing and assisting departments with the implementation of business process management frameworks and methodologies on service delivery planning, service delivery models, standard operating procedures, unit costing, service standards and service charters by March 2013.
• Institutionalise knowledge management in the public service by assisting 5 national departments to implement the knowledge management framework and coordinating the development of service delivery improvement plans for 40 national and 7 provincial departments by March 2013.
• Contribute to the improvement in the working culture of public servants by coordinating the implementation of change management interventions in national departments by March 2013.
• Empower managers to bring about change within their own area of operational control through the ongoing promotion of the deployment of senior managers to service delivery points through the Khaedu programme.
Subprogrammes
• Management: Service Delivery and Organisational Transformation provides administrative support to and management of the programme. This subprogramme had a staff complement of 3 and a total budget of R3 million in 2011/12, of which 61.2 per cent was used for compensation of employees. No savings were identified in this subprogramme.
• Service Delivery Planning coordinates and facilitates short term service delivery improvement initiatives. This subprogramme had a staff complement of 3 and a total budget of R1.6 million in 2011/12, of which 76.2 per cent was used for compensation of employees. In 2011/12, guidelines on determining unit costing were developed and consultations with other public service departments were held, and a framework and methodologies for unit costing were presented to the governance and administration cluster for discussion and further submission to Cabinet. In 2012/13, an expenditure cut of R28 000 was implemented on venues and facilities.
• Service Delivery Improvement Mechanisms supports interventions and partnerships which improve efficiency and effectiveness. This subprogramme had a staff complement of 14 and a total budget of R10.4 million in 2011/12, of which 62.4 per cent was used for compensation of employees. In 2011/12, the Batho Pele impact assessment concept document was developed and rolled out during the public service week, and a report with findings was compiled for approval and implementation. The draft national knowledge management framework has been finalised and the second edition of the journal, Service Delivery Review, was printed and published. An expenditure cut of R129 000 in 2012/13 on venues and facilities has been implemented.
• Organisational Development of the Public Sector focuses on the organisational development of the public sector. This subprogramme had a staff complement of 17 and a total budget of R13.1 million in 2011/12, of which 64.6 per cent was used for compensation of employees. In 2011/12, the following outputs were achieved: a Cabinet memorandum on delegation principles was completed and submitted to the Minister of Public Service and Administration for approval; the first draft of the functional analysis framework was
Vote 12: Public Service and Administration
19
consulted; a job evaluation rule base was finalised; a draft policy and procedures to support the updated Equate job evaluation system were developed; 36 national departments were assisted in aligning their organisational structures with their strategic objective, in line with the ministerial directive, and 36 requests from departments on changes of organisational structure were addressed; national training for mentor and training-the-trainer training for public service organisational structures development practitioners was conducted across the public service; and 8 out of 9 provincial executive committees were engaged on organisational development. An expenditure cut of R145 000 in 2012/13 on venues and facilities has been implemented.
• Community Development and Participation ensures the smooth coordination and implementation of the community development workers programme in the public service, and the promotion of citizen participation. This subprogramme had a staff complement of 7 and a total budget of R5 million in 2011/12, of which 58.1 per cent was used for compensation of employees. In 2011/12, the draft strategy for community development was completed and is to be submitted for approval, the analysis tool on policy on community participation in 3 key departments was completed and sent to 3 departments for consideration, a concept document on refocusing of community development was submitted to the minister for approval, a pilot survey and training on analysing capacity building of community development workers was undertaken in 2 provinces, a resource book on community development workers was developed in collaboration with the Public Administration Leadership and Management Academy, and a concept paper brochure on volunteerism in the public service was developed and submitted for approval. An expenditure cut of R149 000 in 2012/13 has been implemented in this subprogramme.
• Change Management System and Processes promotes cultural change in the public service and coordinates the dissemination of lessons for improving service delivery. This subprogramme had a staff complement of 7 and a total budget of R8.3 million in 2011/12, of which 54.9 per cent was used for compensation of employees. In 2011/12, revisions to the draft standard on waiting time for pensions, hospital queues and vehicle licensing centres began. The estimated cost of this project is R3 million. No savings over the medium term were identified in this subprogramme.
• Integrated Access Mechanisms facilitates community development through access to government services. This subprogramme had a staff complement of 3 and a total budget of R4 million in 2011/12, of which 66.1 per cent was used for compensation of employees. In 2011/12, a draft framework on branding and signage for public service outlets was completed, and a draft framework on the development of a queue management system to improve the speed at which government services are provided was finalised. An expenditure cut of R7 000 on venues and facilities will be implemented in 2012/13.
• Public Administration Leadership and Management Academy aims to enhance the quality, extent and impact of public sector management and leadership development through collaboration with other training service providers, compulsory training programmes, and the facilitation of training for all spheres of government. R188.3 million was transferred to the academy in 2011/12. No savings have been identified in this subprogramme.
• Centre for Public Service Innovation unlocks innovation in the public sector and creates an enabling environment for improved and innovative service delivery through capacity development activities. This subprogramme had a staff complement of 18 and a total budget of R14.8 million in 2011/12, of which 53.7 per cent was used for compensation of employees. In 2011, the Centre for Public Service Innovation successfully hosted the annual public sector innovation conference, finalised the All Africa public sector innovation awards and hosted the award ceremony in Nairobi, Kenya. The first edition of Ideas That Work: The Public Sector Innovation Journal was published and disseminated. No savings have been identified in this subprogramme.
• Public Service Education and Training Authority develops a coordinated framework for providing public service education and training. The Public Service Education and Training Authority had a staff complement of 46 in 2011/12and R21 million was transferred. No savings were identified in this subprogramme.
• Batho Pele manages and promotes Batho Pele programmes in the public service. This subprogramme had a staff complement of 7 and a total budget of R3.7 million in 2011/12, of which56.2 per cent was used for compensation of employees. A cut of R13 000 in 2012/13 on venues and facilities has been implemented.
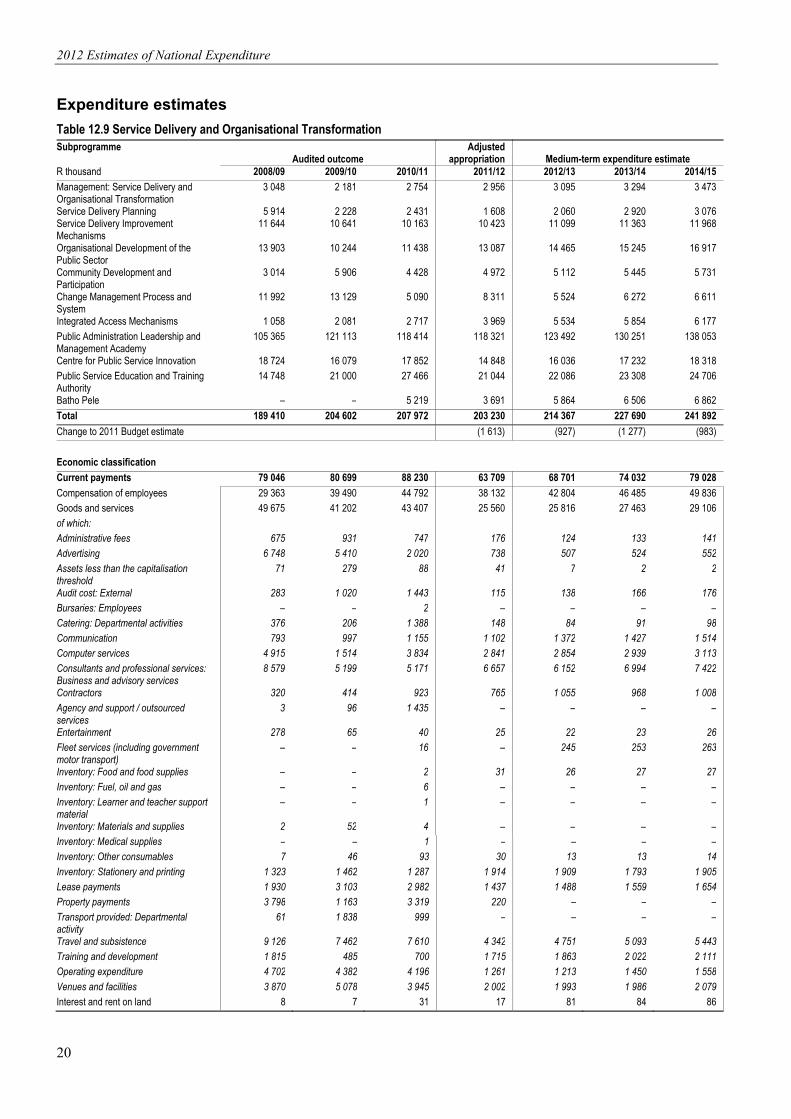
2012 Estimates of National Expenditure
20
Expenditure estimates
Table 12.9 Service Delivery and Organisational Transformation Subprogramme
Audited outcome Adjusted
appropriation Medium-term expenditure estimate R thousand 2008/09 2009/10 2010/11 2011/12 2012/13 2013/14 2014/15
Management: Service Delivery and Organisational Transformation
3 048 2 181 2 754 2 956 3 095 3 294 3 473
Service Delivery Planning 5 914 2 228 2 431 1 608 2 060 2 920 3 076Service Delivery Improvement Mechanisms
11 644 10 641 10 163 10 423 11 099 11 363 11 968
Organisational Development of the Public Sector
13 903 10 244 11 438 13 087 14 465 15 245 16 917
Community Development and Participation
3 014 5 906 4 428 4 972 5 112 5 445 5 731
Change Management Process and System
11 992 13 129 5 090 8 311 5 524 6 272 6 611
Integrated Access Mechanisms 1 058 2 081 2 717 3 969 5 534 5 854 6 177Public Administration Leadership and Management Academy
105 365 121 113 118 414 118 321 123 492 130 251 138 053
Centre for Public Service Innovation 18 724 16 079 17 852 14 848 16 036 17 232 18 318Public Service Education and Training Authority
14 748 21 000 27 466 21 044 22 086 23 308 24 706
Batho Pele – – 5 219 3 691 5 864 6 506 6 862
Total 189 410 204 602 207 972 203 230 214 367 227 690 241 892
Change to 2011 Budget estimate (1 613) (927) (1 277) (983)
Economic classification
Current payments 79 046 80 699 88 230 63 709 68 701 74 032 79 028
Compensation of employees 29 363 39 490 44 792 38 132 42 804 46 485 49 836Goods and services 49 675 41 202 43 407 25 560 25 816 27 463 29 106of which: Administrative fees 675 931 747 176 124 133 141Advertising 6 748 5 410 2 020 738 507 524 552Assets less than the capitalisation threshold
71 279 88 41 7 2 2
Audit cost: External 283 1 020 1 443 115 138 166 176Bursaries: Employees – – 2 – – – –Catering: Departmental activities 376 206 1 388 148 84 91 98Communication 793 997 1 155 1 102 1 372 1 427 1 514Computer services 4 915 1 514 3 834 2 841 2 854 2 939 3 113Consultants and professional services: Business and advisory services
8 579 5 199 5 171 6 657 6 152 6 994 7 422
Contractors 320 414 923 765 1 055 968 1 008Agency and support / outsourced services
3 96 1 435 – – – –
Entertainment 278 65 40 25 22 23 26Fleet services (including government motor transport)
– – 16 – 245 253 263
Inventory: Food and food supplies – – 2 31 26 27 27Inventory: Fuel, oil and gas – – 6 – – – –Inventory: Learner and teacher support material
– – 1 – – – –
Inventory: Materials and supplies 2 52 4 – – – –Inventory: Medical supplies – – 1 – – – –Inventory: Other consumables 7 46 93 30 13 13 14Inventory: Stationery and printing 1 323 1 462 1 287 1 914 1 909 1 793 1 905Lease payments 1 930 3 103 2 982 1 437 1 488 1 559 1 654Property payments 3 798 1 163 3 319 220 – – –Transport provided: Departmental activity
61 1 838 999 – – – –
Travel and subsistence 9 126 7 462 7 610 4 342 4 751 5 093 5 443Training and development 1 815 485 700 1 715 1 863 2 022 2 111Operating expenditure 4 702 4 382 4 196 1 261 1 213 1 450 1 558Venues and facilities 3 870 5 078 3 945 2 002 1 993 1 986 2 079Interest and rent on land 8 7 31 17 81 84 86

Vote 12: Public Service and Administration
21
Table 12.9 Service Delivery and Organisational Transformation (continued)
Audited outcome Adjusted
appropriation Medium-term expenditure estimate R thousand 2008/09 2009/10 2010/11 2011/12 2012/13 2013/14 2014/15
Economic classification
Transfers and subsidies 107 601 121 751 119 302 139 408 145 617 153 606 162 809
Provinces and municipalities – – 1 – – – –Departmental agencies and accounts 105 365 121 113 118 414 139 365 145 578 153 559 162 759Foreign governments and international organisations
3 – – 29 39 47 50
Non-profit institutions – – 1 – – – –Households 2 233 638 886 14 – – –
Payments for capital assets 2 740 2 152 398 113 49 52 55
Machinery and equipment 2 680 2 031 398 113 49 52 55Software and other intangible assets 60 121 – – – – –
Payments for financial assets 23 – 42 – – – –
Total 189 410 204 602 207 972 203 230 214 367 227 690 241 892
Details of transfers and subsidies
Departmental agencies and accounts Departmental agencies (non-business entities) Current 105 365 121 113 118 414 139 365 145 578 153 559 162 759
Public Administration Leadership and Management Academy
105 365 121 113 118 414 118 321 123 492 130 251 138 053
Public Sector Education Training Authority
– – – 21 044 22 086 23 308 24 706
Foreign governments and international organisations Current 3 – – 29 39 47 50
Gifts and donations 3 – – – – – –Commonwealth Association for Public Administration and Management
– – – 29 39 47 50
Non-profit institutions Current – – 1 – – – –
Gifts and donations – – 1 – – – –
Households Other transfers to households Current 2 233 638 886 14 – – –
Gifts and donations – 14 – – – – –Claims against the state 719 – – – – – –Employee social benefits 1 514 624 886 14 – – –
Provinces and municipalities Municipalities Municipal bank accounts Current – – 1 – – – –
– – 1 – – – –
Expenditure trends
Expenditure increased from R189.4 million in 2008/09 to R203.2 million in 2011/12, at an average annual rate of 2.4 per cent. The increase in expenditure was mainly in the Integrated Access Mechanisms subprogramme, due to expenditure relating to the geographic information systems project and funding provided for the completion of the community development indaba. Between 2008/09 and 2009/10, expenditure in the Public Administration Leadership and Management Academy subprogramme increased by R15.8 million, due to a once-off allocation for purchasing furniture and equipment for the new building of the academy in 2009/10. Expenditure in the Public Service Education and Training Authority subprogramme grew from R14.7 million in 2008/09 to R21 million in 2011/12, at an average annual rate of 12.6 per cent, to increase capacity required for the establishment of the Public Service Education and Training Authority.
Over the medium term, expenditure is expected to increase from R203.2 million to R241.9 million, at an average annual rate of 6 per cent. This is mainly due to allocations for improved conditions of service. The targets for the number of national and provincial departments that will be supported with the development of

2012 Estimates of National Expenditure
22
service delivery improvement plans are expected to increase from 47 in 2011/12 to 62 in 2014/15. The targets for the number of national and provincial departments in which training in Batho Pele is conducted per year are also projected to increase from 20 in 2011/12 to 40 in 2014/15, at a projected cost of R953 000 in 2011/12.
R20.6 million is allocated for the use of consultants between 2012/13 and 2014/15 to provide advisory services relating to the geographic information systems project and change management interventions.
Programme 6: Governance and International Relations
Objectives and measures
• Improve accountability and transparency in public sector programmes, policies and projects by implementing a monitoring and evaluation framework in selected national and provincial departments by March 2013.
• Contribute to the African Agenda and international best practices on the transformation of the public service and public administration by implementing the continental governance and public administration programme by March 2013.
• Tackle corruption in the public service and monitor compliance with national and international anti-corruption instruments across the public service by: – developing and implementing the public sector integrity management framework by March 2013 – rolling out training to law enforcement officials and anti-corruption practitioners by March 2013 – Investigating corruption related misconduct cases and ensuring disciplinary processes are instituted by
March 2013.
• Ensure that South Africa complies with the African Peer Review Mechanism by submitting the third progress implementation report to the African Union by July 2013.
• Contribute to the African public service and administration transformation agenda and access to international best practices by facilitating and coordinating South Africa’s participation in and contribution to continental and international governance and public administration forums over the MTEF period.
Subprogrammes
• Management: Governance and International Relations provides administrative support to and management of the programme. This subprogramme had a staff complement of 4 and a total budget of R4.9 million in 2011/12, of which 67.6 per cent was used for goods and services. The projected allocation to venues and facilities in 2012/13 has been cut by R10 000.
• Integrity and Ethics Management is responsible for establishing and implementing strategies for fighting corruption and improving ethical conduct in the public service. This subprogramme had a staff complement of 14 and a total budget of R13.3 million in 2011/12, of which 50 per cent was used for compensation of employees. In 2009/10 and 2010/11, the following outputs were achieved: the ethics and integrity framework was presented during Public Service week and will be submitted to Cabinet for approval; an anti-corruption e-learning programme was launched and 77 learners were enrolled on the programme, the department attended the second quarterly meeting of the Organisation for Economic Cooperation and Development working group and presented a progress report on the implementation of the action plan; and the department participated in the G20 anti-corruption working group and provided inputs on implementing the plan. The department is currently engaging with the Public Administration Leadership and Management Academy to develop an anti-corruption training curriculum. Expenditure for 2011/12 was lower than anticipated, due to capacity constraints and delays in finalising the organisational form of the Public Sector Anti-Corruption Unit. R13 000 has been cut from expenditure on venues and facilities in 2012/13.
• International Cooperation establishes and maintains bilateral and multilateral relations on governance and public administration by implementing global and continental programmes and projects for improving governance and public administration. This subprogramme had a staff complement of 19 and a total budget of R10.5 million in 2011/12, of which 69.3 per cent was used for compensation of employees. In 2011/12, the department: facilitated a study tour for a delegation from the Kenyan constitution implementation
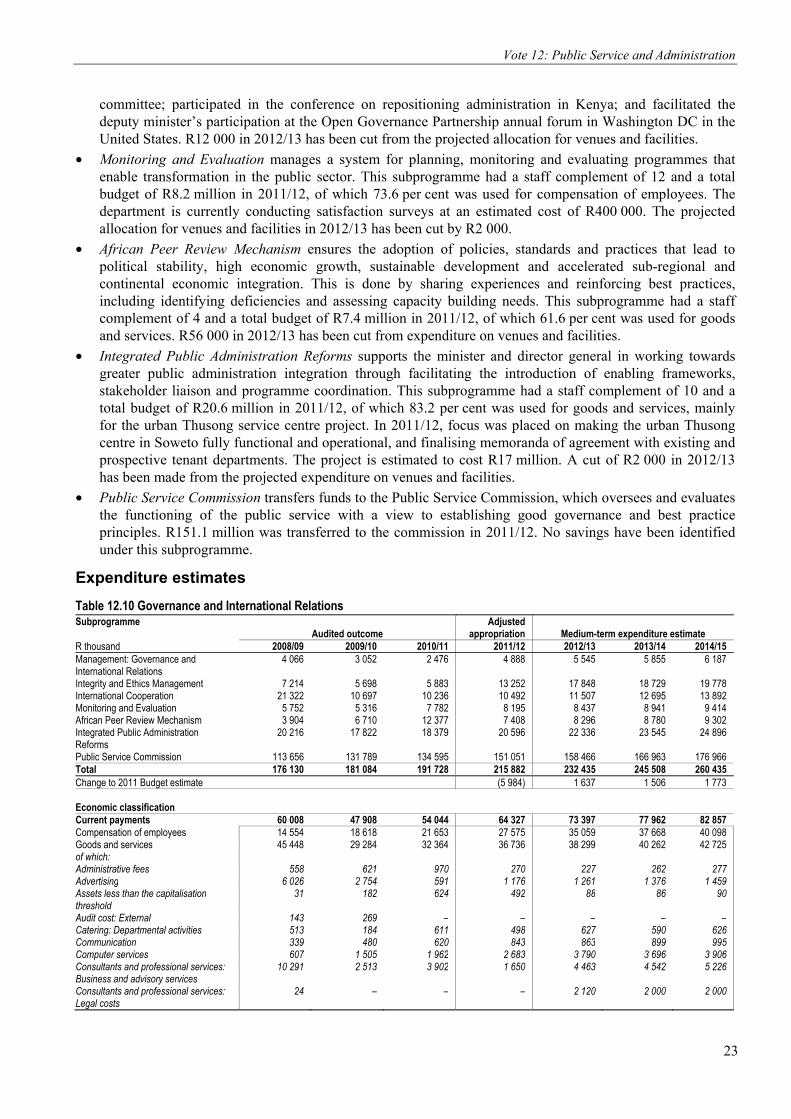
Vote 12: Public Service and Administration
23
committee; participated in the conference on repositioning administration in Kenya; and facilitated the deputy minister’s participation at the Open Governance Partnership annual forum in Washington DC in the United States. R12 000 in 2012/13 has been cut from the projected allocation for venues and facilities.
• Monitoring and Evaluation manages a system for planning, monitoring and evaluating programmes that enable transformation in the public sector. This subprogramme had a staff complement of 12 and a total budget of R8.2 million in 2011/12, of which 73.6 per cent was used for compensation of employees. The department is currently conducting satisfaction surveys at an estimated cost of R400 000. The projected allocation for venues and facilities in 2012/13 has been cut by R2 000.
• African Peer Review Mechanism ensures the adoption of policies, standards and practices that lead to political stability, high economic growth, sustainable development and accelerated sub-regional and continental economic integration. This is done by sharing experiences and reinforcing best practices, including identifying deficiencies and assessing capacity building needs. This subprogramme had a staff complement of 4 and a total budget of R7.4 million in 2011/12, of which 61.6 per cent was used for goods and services. R56 000 in 2012/13 has been cut from expenditure on venues and facilities.
• Integrated Public Administration Reforms supports the minister and director general in working towards greater public administration integration through facilitating the introduction of enabling frameworks, stakeholder liaison and programme coordination. This subprogramme had a staff complement of 10 and a total budget of R20.6 million in 2011/12, of which 83.2 per cent was used for goods and services, mainly for the urban Thusong service centre project. In 2011/12, focus was placed on making the urban Thusong centre in Soweto fully functional and operational, and finalising memoranda of agreement with existing and prospective tenant departments. The project is estimated to cost R17 million. A cut of R2 000 in 2012/13 has been made from the projected expenditure on venues and facilities.
• Public Service Commission transfers funds to the Public Service Commission, which oversees and evaluates the functioning of the public service with a view to establishing good governance and best practice principles. R151.1 million was transferred to the commission in 2011/12. No savings have been identified under this subprogramme.
Expenditure estimates
Table 12.10 Governance and International Relations Subprogramme
Audited outcome Adjusted
appropriation Medium-term expenditure estimate R thousand 2008/09 2009/10 2010/11 2011/12 2012/13 2013/14 2014/15 Management: Governance and International Relations
4 066 3 052 2 476 4 888 5 545 5 855 6 187
Integrity and Ethics Management 7 214 5 698 5 883 13 252 17 848 18 729 19 778International Cooperation 21 322 10 697 10 236 10 492 11 507 12 695 13 892Monitoring and Evaluation 5 752 5 316 7 782 8 195 8 437 8 941 9 414African Peer Review Mechanism 3 904 6 710 12 377 7 408 8 296 8 780 9 302Integrated Public Administration Reforms
20 216 17 822 18 379 20 596 22 336 23 545 24 896
Public Service Commission 113 656 131 789 134 595 151 051 158 466 166 963 176 966Total 176 130 181 084 191 728 215 882 232 435 245 508 260 435Change to 2011 Budget estimate (5 984) 1 637 1 506 1 773
Economic classification Current payments 60 008 47 908 54 044 64 327 73 397 77 962 82 857Compensation of employees 14 554 18 618 21 653 27 575 35 059 37 668 40 098Goods and services 45 448 29 284 32 364 36 736 38 299 40 262 42 725of which: Administrative fees 558 621 970 270 227 262 277Advertising 6 026 2 754 591 1 176 1 261 1 376 1 459Assets less than the capitalisation threshold
31 182 624 492 88 86 90
Audit cost: External 143 269 – – – – –Catering: Departmental activities 513 184 611 498 627 590 626Communication 339 480 620 843 863 899 995Computer services 607 1 505 1 962 2 683 3 790 3 696 3 906Consultants and professional services: Business and advisory services
10 291 2 513 3 902 1 650 4 463 4 542 5 226
Consultants and professional services: Legal costs
24 – – – 2 120 2 000 2 000

2012 Estimates of National Expenditure
24
Table 12.10 Governance and International Relations (continued)
Audited outcome Adjusted
appropriation Medium-term expenditure estimate R thousand 2008/09 2009/10 2010/11 2011/12 2012/13 2013/14 2014/15
Economic classification Current payments Contractors 3 219 1 760 521 93 53 56 59Agency and support / outsourced services
666 187 67 7 276 2 053 2 193 2 803
Entertainment 18 30 28 76 64 67 70Fleet services (including government motor transport)
– – 11 – 116 99 106
Inventory: Food and food supplies – – 3 59 34 34 29Inventory: Fuel, oil and gas 19 – 2 – – – –Inventory: Materials and supplies – 384 4 – – – –Inventory: Medical supplies – – 1 – – – –Inventory: Other consumables 99 1 4 7 6 6 7Inventory: Stationery and printing 641 835 350 1 897 853 807 911Lease payments 1 698 3 746 3 744 3 873 5 282 6 215 6 394Property payments – 2 437 3 855 500 1 490 1 500 1 002Transport provided: Departmental activity
7 785 1 080 2 755 2 10 – –
Travel and subsistence 6 803 4 437 6 890 10 181 9 414 10 033 10 873Training and development 152 384 575 866 898 924 785Operating expenditure 3 940 3 154 1 988 556 481 529 560Venues and facilities 1 876 2 341 2 286 3 738 4 106 4 348 4 547Interest and rent on land 6 6 27 16 39 32 34Transfers and subsidies 114 312 132 348 135 082 151 499 159 025 167 546 177 578Departmental agencies and accounts 113 656 131 789 134 595 151 051 158 466 166 963 176 966Foreign governments and international organisations
656 549 477 446 559 583 612
Households – 10 10 2 – – –Payments for capital assets 1 677 827 2 555 56 13 – –Machinery and equipment 1 337 784 2 555 56 13 – –Software and other intangible assets 340 43 – – – – –Payments for financial assets 133 1 47 – – – –Total 176 130 181 084 191 728 215 882 232 435 245 508 260 435
Details of transfers and subsidies Departmental agencies and accounts Departmental agencies (non-business entities) Current 113 656 131 789 134 595 151 051 158 466 166 963 176 966Public Service Commission 113 656 131 789 134 595 151 051 158 466 166 963 176 966Foreign governments and international organisations Current 656 549 477 446 559 583 612Gifts and donations – 8 – – – – –Commonwealth Association for Public Administration and Management
– – – 40 42 44 47
Organisation for Economic Cooperation and Development
179 161 141 200 300 311 324
African Association for Public Administration and Management
113 64 – 60 63 66 70
Centre for Training and Research in Administration for Development
332 316 313 110 116 122 129
International Institute of Administration Services
32 – 23 36 38 40 42
Households Other transfers to households Current – 10 10 2 – – –Gifts and donations – 1 – – – – –Employee social benefits – 9 10 2 – – –
Expenditure trends
Expenditure increased from R176.1 million in 2008/09 to R215.9 million in 2011/12, at an average annual rate of 7 per cent. This was mainly due to additional funding in 2010/11 in the African Peer Review Mechanism subprogramme provided to conclude the African Peer Review Mechanism country assessment report, as well as Integrated Public Administration Reforms subprogramme to implement the single public service project. Transfer payments to the Public Service Commission subprogramme increased from R113.7 million in 2008/09

Vote 12: Public Service and Administration
25
to R151.1 million in 2011/12, at an average annual rate of 9.9 per cent, due to additional funds received for capacity building for the integrity and anti-corruption branch.
Over the medium term, expenditure is projected to grow to R260.4 million, at an average annual rate of 6.5 per cent, due to additional allocations for establishing a special anti-corruption unit. The programme will intensify its fight against corruption by investigating corruption related misconduct cases and ensuring disciplinary processes are instituted by March 2013.
R20.4 million is projected over the medium term for use on consultants to provide legal and advisory services for the special anti-corruption unit.
Other departments within the vote
Public Service Commission
Strategic overview: 2008/09 – 2014/15 The Public Service Commission derives its mandate from sections 195 and 196 of the Constitution, which sets out its powers and functions, and the values and principles governing public administration that it should promote in order to entrench good governance and best practice principles.
The commission plays a significant role in dispute resolution and promoting sound labour relations and labour peace in the public service, including considering grievances lodged by employees and heads of department. The commission is seen as a body of appeal and is a final arbiter within the public service.
Medium term focus Recognising the importance of an efficient and effective administrative leadership, the commission will continue to focus on management practices that strengthen public service leadership. This is being done through: implementing the framework for the evaluation of heads of department, providing advice on the quality of the performance agreements of heads of department and reporting compliance trends to key stakeholders. The commission will also conduct human resource reviews that promote sound human resource management practices and contribute to creating a competent and productive workforce.
The fight against crime and corruption remains a priority area for government. The commission will give effect to its key medium term focus of strengthening measures to inculcate a culture of integrity in the public service by researching and evaluating professional ethics and corruption prevention, and research how to conduct lifestyle audits in the public service.
To promote professional ethics and contribute to creating an ethical public service, the commission will continue to investigate allegations of maladministration and corruption. The commission will also continue to manage senior managers’ conflicts of interest through the financial disclosure framework. The commission has managed the national anti-corruption hotline since 2003. The hotline has become an important public participation mechanism for reporting cases of alleged corruption in the public service. The successful investigation and prosecution of cases has resulted, in some instances, in the dismissal of employees found guilty of misconduct, and recovery of R110 million from the perpetrators’ large sums of money.
Performance Additional staff capacity for the handling of grievances and speeding up the investigation of cases lodged with the integrity and anti-corruption branch resulted in 1 273 public officials being charged with misconduct for corrupt activities: 600 were at the provincial level and 673 at the national level. Action taken against officials found guilty of misconduct included 226 suspended, 603 dismissed, 134 fined, 16 demoted, 330 issued final written warnings, and 190 subjected to criminal prosecution.
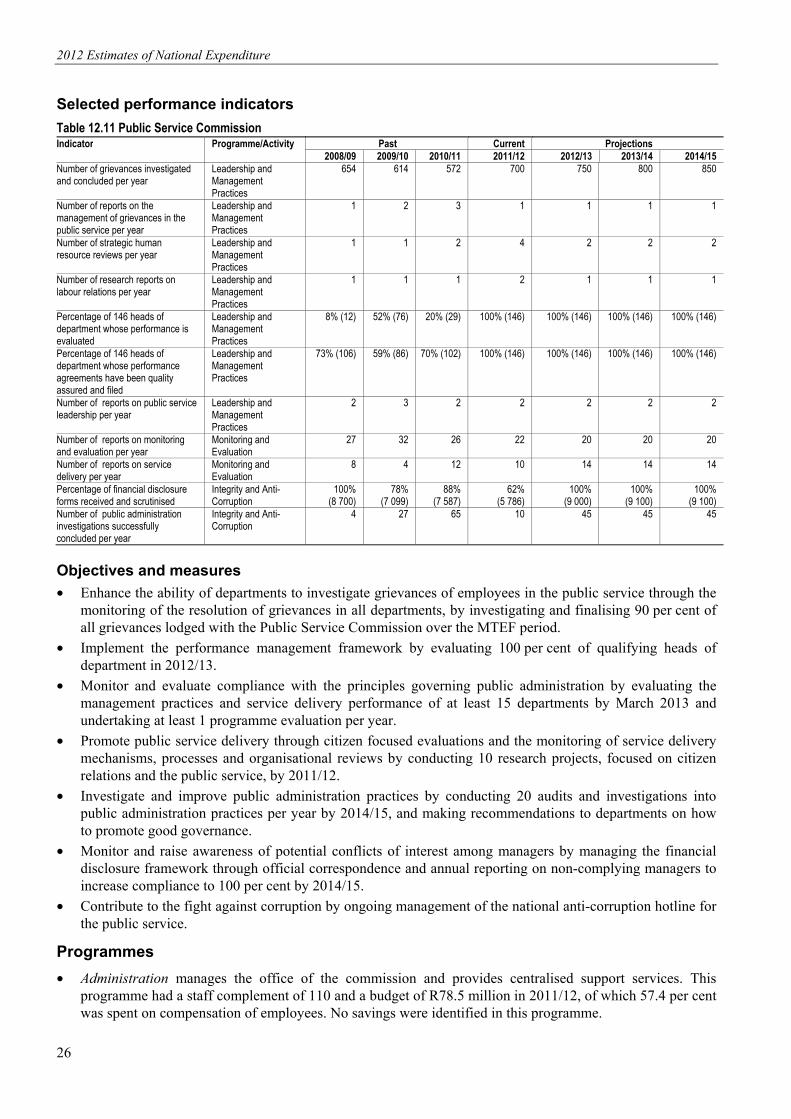
2012 Estimates of National Expenditure
26
Selected performance indicators
Table 12.11 Public Service Commission Indicator Programme/Activity Past Current Projections 2008/09 2009/10 2010/11 2011/12 2012/13 2013/14 2014/15Number of grievances investigated and concluded per year
Leadership and Management Practices
654 614 572 700 750 800 850
Number of reports on the management of grievances in the public service per year
Leadership and Management Practices
1 2 3 1 1 1 1
Number of strategic human resource reviews per year
Leadership and Management Practices
1 1 2 4 2 2 2
Number of research reports on labour relations per year
Leadership and Management Practices
1 1 1 2 1 1 1
Percentage of 146 heads of department whose performance is evaluated
Leadership and Management Practices
8% (12) 52% (76) 20% (29) 100% (146) 100% (146) 100% (146) 100% (146)
Percentage of 146 heads of department whose performance agreements have been quality assured and filed
Leadership and Management Practices
73% (106) 59% (86) 70% (102) 100% (146) 100% (146) 100% (146) 100% (146)
Number of reports on public service leadership per year
Leadership and Management Practices
2 3 2 2 2 2 2
Number of reports on monitoring and evaluation per year
Monitoring and Evaluation
27 32 26 22 20 20 20
Number of reports on service delivery per year
Monitoring and Evaluation
8 4 12 10 14 14 14
Percentage of financial disclosure forms received and scrutinised
Integrity and Anti-Corruption
100%(8 700)
78%(7 099)
88%(7 587)
62%(5 786)
100% (9 000)
100% (9 100)
100%(9 100)
Number of public administration investigations successfully concluded per year
Integrity and Anti-Corruption
4 27 65 10 45 45 45
Objectives and measures
• Enhance the ability of departments to investigate grievances of employees in the public service through the monitoring of the resolution of grievances in all departments, by investigating and finalising 90 per cent of all grievances lodged with the Public Service Commission over the MTEF period.
• Implement the performance management framework by evaluating 100 per cent of qualifying heads of department in 2012/13.
• Monitor and evaluate compliance with the principles governing public administration by evaluating the management practices and service delivery performance of at least 15 departments by March 2013 and undertaking at least 1 programme evaluation per year.
• Promote public service delivery through citizen focused evaluations and the monitoring of service delivery mechanisms, processes and organisational reviews by conducting 10 research projects, focused on citizen relations and the public service, by 2011/12.
• Investigate and improve public administration practices by conducting 20 audits and investigations into public administration practices per year by 2014/15, and making recommendations to departments on how to promote good governance.
• Monitor and raise awareness of potential conflicts of interest among managers by managing the financial disclosure framework through official correspondence and annual reporting on non-complying managers to increase compliance to 100 per cent by 2014/15.
• Contribute to the fight against corruption by ongoing management of the national anti-corruption hotline for the public service.
Programmes
• Administration manages the office of the commission and provides centralised support services. This programme had a staff complement of 110 and a budget of R78.5 million in 2011/12, of which 57.4 per cent was spent on compensation of employees. No savings were identified in this programme.

Vote 12: Public Service and Administration
27
• Leadership and Management Practices promotes sound public service leadership, human resource management, labour relations and labour practices. The programme comprises two subprogrammes: Labour Relations Improvements and Leadership and Human Resource Reviews. The programme had a staff complement of 47 and a budget of R23.8 million in 2011/12, of which 87 per cent was spent on compensation of employees. The programme will investigate and finalise 90 per cent of all grievances lodged with the commission in 2012/13. No savings were identified in this programme.
• Monitoring and Evaluation enables the commission to establish a high standard of service delivery, monitoring and good governance in the public service. The programme comprises two subprogrammes: Governance Monitoring and Service Delivery and Compliance Evaluations. The programme had a staff complement of 47and a budget of R23.2 million in 2011/12 of, which 83.9 per cent was spent on compensation of employees. The programme will monitor and evaluate at least 15 departments on management practices and service delivery performance per year. No savings were identified in this programme.
• Integrity and Anti-Corruption enables the commission to undertake public administration investigations, promote a high standard of ethical conduct among public servants and contribute to the drive to prevent and fight corruption. The programme comprises two subprogrammes: Public Administration Investigations and Professional Ethics. This programme had a staff complement of 49 and a budget of R25.5 million, of which 81.8 per cent was spent on compensation of employees. The programme will produce 1 report a year on professional ethics and corruption prevention. No savings were identified in this programme.
Expenditure estimates
Table 12.12 Public Service Commission Programme
Audited outcome Adjusted
appropriation Revised estimate
Medium-term expenditure estimate
R thousand 2008/09 2009/10 2010/11 2011/12 2012/13 2013/14 2014/15 Administration 59 352 72 433 70 885 78 517 78 517 81 102 84 970 90 593
Leadership and Management Practices 14 604 16 352 20 166 23 835 23 835 25 601 27 165 28 631
Monitoring and Evaluation 18 960 19 684 20 608 23 218 23 218 24 425 25 866 27 241
Integrity and Anti-Corruption 20 740 23 320 22 365 25 481 25 481 27 338 28 962 30 501
Total 113 656 131 789 134 024 151 051 151 051 158 466 166 963 176 966
Change to 2011 Budget estimate – – 1 270 1 330 –
Economic classification
Current payments 112 325 120 623 130 511 150 211 150 211 157 592 166 035 175 990
Compensation of employees 77 224 87 565 92 310 106 139 106 139 118 384 125 372 132 120
Goods and services 35 101 33 047 38 196 44 072 44 072 39 208 40 663 43 870
of which:
Administrative fees 343 125 32 62 62 77 82 86
Advertising 523 383 511 192 192 251 265 280
Assets less than the capitalisation threshold
458 174 372 773 773 689 728 768
Audit cost: External 1 665 1 959 3 529 5 916 5 916 1 860 1 264 2 362
Bursaries: Employees 68 173 275 639 639 651 687 725
Catering: Departmental activities 303 248 245 267 267 317 336 354
Communication 2 093 2 226 1 997 2 126 2 126 2 198 2 336 2 450
Computer services 2 196 3 312 4 069 4 514 4 514 4 206 4 442 4 682
Consultants and professional services: Business and advisory services
4 535 3 992 4 152 4 170 4 170 3 868 4 083 4 302
Consultants and professional services: Legal costs
7 150 436 10 10 28 29 31
Contractors 255 261 661 189 189 190 201 210
Agency and support / outsourced services
57 11 101 25 25 20 21 21
Entertainment 2 – – 2 2 35 38 38
Fleet services (including government motor transport)
– 3 – – – – – –

2012 Estimates of National Expenditure
28
Table 12.12 Public Service Commission (continued) Programme
Audited outcome Adjusted
appropriation Revised estimate
Medium-term expenditure estimate
R thousand 2008/09 2009/10 2010/11 2011/12 2012/13 2013/14 2014/15
Economic classification
Inventory: Learner and teacher support material
5 11 16 6 6 4 4 4
Inventory: Materials and supplies – – 1 – – 5 5 5
Inventory: Other consumables 24 51 16 74 74 88 93 97
Inventory: Stationery and printing 2 858 3 592 2 836 4 125 4 125 3 739 3 953 4 167
Lease payments 7 291 7 391 9 247 9 360 9 360 11 230 11 849 12 489
Property payments 1 814 2 151 2 498 2 241 2 241 905 955 1 008
Transport provided: Departmental activity
– – 774 – – – – –
Travel and subsistence 8 417 4 992 4 723 6 127 6 127 6 520 6 928 7 301
Training and development 590 494 3 1 204 1 204 1 248 1 225 1 291
Operating expenditure 1 074 881 555 459 459 485 513 540
Venues and facilities 523 467 1 147 1 591 1 591 594 626 659
Interest and rent on land – 11 5 – – – – –
Transfers and subsidies 35 10 142 679 45 45 48 53 56
Foreign governments and international organisations
35 33 41 45 45 48 53 56
Public corporations and private enterprises
– – 171 – – – – –
Households – 10 109 467 – – – – –
Payments for capital assets 1 290 968 2 757 795 795 826 875 920
Machinery and equipment 1 290 968 2 422 795 795 826 875 920
Software and other intangible assets – – 335 – – – – –
Payments for financial assets 6 56 77 – – – – –
Total 113 656 131 789 134 024 151 051 151 051 158 466 166 963 176 966
Expenditure trends
The spending focus over the medium term will be on strengthening measures to inculcate a culture of integrity in the public service by researching and evaluating professional ethics and corruption prevention. The commission will also carry out research on how to conduct lifestyle audits in the public service.
Between 2008/09 and 2011/12, expenditure grew from R113.7 million to R151.1 million, at an average annual rate of 9.9 per cent. This is as a result of additional funds received in 2011/12 for the additional staff capacity for handling grievances and speeding up the investigation of cases lodged with the integrity and anti-corruption branch. The increase in expenditure is in line with the programme’s performance in the same period. Between 2008/09 and 2011/12, the department focused its spending on improving its turnaround time with regard to cases lodged with it. As a result, the number of public administration investigations successfully concluded increased significantly in the same period.
Expenditure is expected to increase to R177 million in 2014/15, at an average annual rate of 5.4 per cent, due to additional funds received for improved conditions of service. The department has increased its target for the number of reports on service delivery per year from 10 in 2011/12 to 14 in 2014/15. The targets for the number of grievances investigated and concluded per year increase from 700 in 2011/12 to 850 in 2014/15. The department has budgeted R12.3 million between 2012/13 and 2014/15 for the use of consultants for internal auditing services.

Vote 12: Public Service and Administration
29
Personnel information Table 12.13 Details of approved establishment and personnel numbers according to salary level1
Personnel post status as at 30 September 2011 Number of personnel posts filled / planned for on funded establishment
Number of posts on
approved establishment
Number of funded posts
Number of posts additional to the
establishment
Actual Mid-year2 Medium-term estimate 2008/09 2009/10 2010/11 2011/12 2012/13 2013/14 2014/1
5
Department 253 253 – 223 237 226 208 253 253 253
Salary level 1 – 6 75 75 – 67 73 70 62 75 75 75
Salary level 7 – 10 71 71 – 60 66 58 62 71 71 71
Salary level 11 – 12 48 48 – 48 45 45 43 48 48 48
Salary level 13 – 16 59 59 – 48 53 53 41 59 59 59
Administration 117 117 – 98 105 100 99 117 117 117
Salary level 1 – 6 40 40 – 36 39 38 35 40 40 40
Salary level 7 – 10 43 43 – 33 39 33 38 43 43 43
Salary level 11 – 12 8 8 – 7 8 7 7 8 8 8
Salary level 13 – 16 26 26 – 22 19 22 19 26 26 26
Leadership and Management Practices
45 45 – 35 44 42 39 45 45 45
Salary level 1 – 6 11 11 – 11 11 11 7 11 11 11
Salary level 7 – 10 8 8 – 4 9 7 8 8 8 8
Salary level 11 – 12 15 15 – 17 13 15 14 15 15 15
Salary level 13 – 16 11 11 – 3 11 9 10 11 11 11
Monitoring ad Evaluation
45 45 – 45 44 43 31 45 45 45
Salary level 1 – 6 16 16 – 14 15 14 13 16 16 16
Salary level 7 – 10 6 6 – 8 5 5 5 6 6 6
Salary level 11 – 12 12 12 – 12 12 12 10 12 12 12
Salary level 13 – 16 11 11 – 11 12 12 3 11 11 11
Integrity and Anti-Corruption
46 46 – 45 44 41 39 46 46 46
Salary level 1 – 6 8 8 – 6 8 7 7 8 8 8
Salary level 7 – 10 14 14 – 15 13 13 11 14 14 14
Salary level 11 – 12 13 13 – 12 12 11 12 13 13 13
Salary level 13 – 16 11 11 – 12 11 10 9 11 11 11
1. Data has been provided by the department and may not necessarily reconcile with official government personnel data.
2. As at 30 September 2011.
The number of filled posts grew from 223 in 2008/09 to 226 in 2010/11. As at the 30 September 2011, the department had an establishment of 253 posts, and 45 vacancies. The vacancies were due to staff turnover among line function personnel and at lower levels. Over the MTEF period, the number of filled posts is expected to increase to 253, due to additional staff capacity required for handling grievances and speeding up the investigation of cases lodged with the integrity and anti-corruption branch. The ratio of support staff to line staff was 1:3.
Public Administration Leadership and Management Academy
Strategic overview: 2008/09 – 2014/15 In terms of the Public Service Amendment Act (2007), the Public Administration Leadership and Management Academy is a legislated training institution, mandated to provide or facilitate the provision of training to public servants. The training trading account is a mechanism within the academy for the partial recovery of the costs of training programmes.
Changes to policy and practice The calls for the further transformation of the academy seek to address the uncoordinated manner in which public sector training continues to be provided. The review and assessment of its performance and operations

2012 Estimates of National Expenditure
30
since its establishment in 2008 indicate that the academy will not achieve its expected results given its current organisational form and business model. A new strategic framework will address some of the significant shortcomings in the current organisational form and business model, including: the existing course fees tariff structure; the current over-reliance on outsourced training service providers; the need for a structured curriculum design and development process to better align training outcomes to the national developmental agenda; the need for structured relationships with institutions of higher learning and other public and private training providers; and the need to revise the academy’s mandate to enable it to provide training in the local government sphere without limitations.
It is envisaged that the academy’s transformation process will be completed over the MTEF period. Consultations with the minister and other key stakeholders are ongoing.
Focus over the medium term Over the medium term, the academy will continue to build leadership, management and administrative skills with a view to: improving service delivery quality and access; enhancing human resource management and promoting development; enhancing business processes, systems, decision rights and accountability; tackling corruption effectively; developing the academy into a high performance organisation. The first four objectives are related directly to the achievement of an efficient, effective and development oriented public service and an empowered, fair and inclusive citizenship (outcome 12).
New training model
In order to achieve the targets set for 2014/15, training and development interventions will have to be needs based, respond to government’s priority skills areas, support the national developmental agenda and contribute to increased performance. To achieve this, the identification of mandatory programmes and minimum compulsory annual training days will be undertaken for each public servant. The development of a policy to support this new training and development model and trajectory will be initiated, and all departments will be engaged on its implementation and effective monitoring measures.
New measures to be taken to achieve skills and cadre development include ensuring that all departments budget appropriately for their skills development activities, as well as providing a framework for the use of departmental training budgets in accordance with government priorities. These measures will be implemented over the medium term, in tandem with the completion of the academy’s further transformation process.The further transformation agenda calls for: a mandatory, more focused and better resourced training institution; curriculum focus on the political and philosophical content of government’s developmental agenda; and developing public service cadres who will acquire the requisite know-how and competencies for the effective implementation of government programmes
Selected performance indicators Indicators are reported under the training trading account, in the public entities section below.
Objectives and measures
• Improve the capacity of the state to deliver services by raising the skills levels of civil servants through the competency based training of 38 000 persons trained per year by 2014/15.
• Improve the quality of training by accrediting 6 courses per year on a rolling schedule between 2012/13 and 2014/15.
Programmes • Administration facilitates the overall management of the academy and provides support services for its
organisational functions. The programme has a staff complement of 59 and a total budget of R69.3million in 2011/12, of which 50.9 per cent will be used on goods and services.
• Public Sector Organisational and Staff Development facilitates transfer payment to the training trading account for management development and training public sector employees.
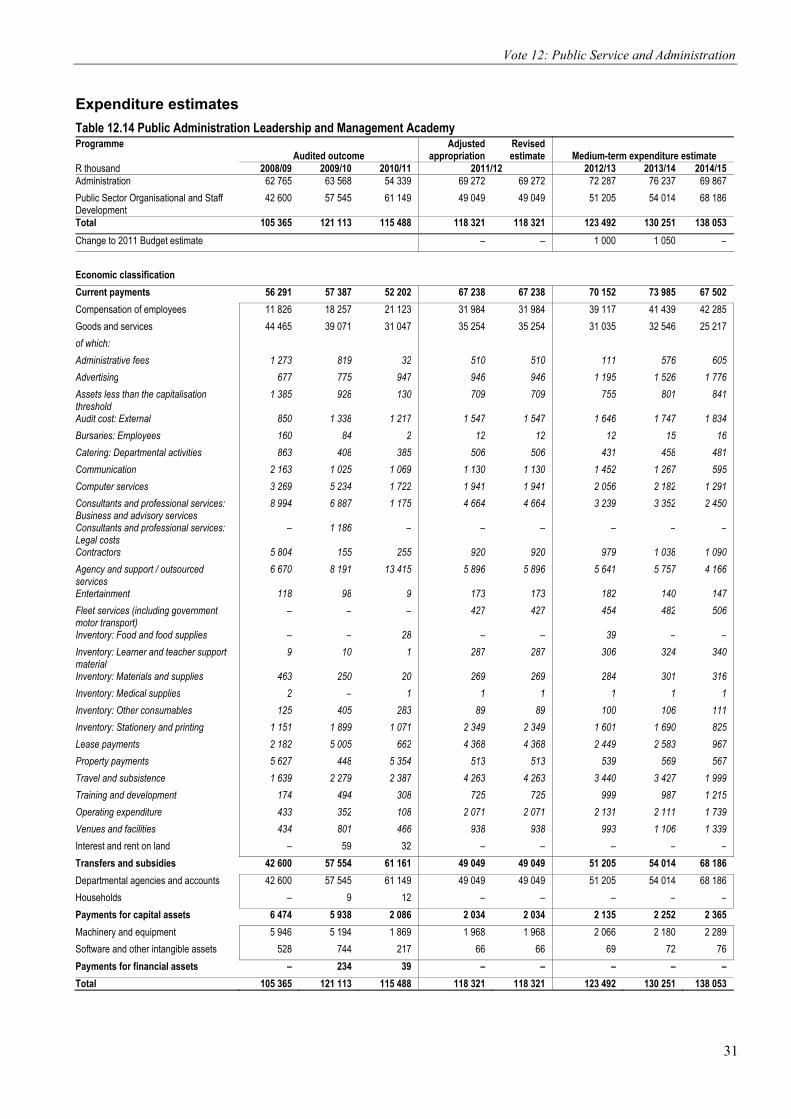
Vote 12: Public Service and Administration
31
Expenditure estimates
Table 12.14 Public Administration Leadership and Management Academy Programme
Audited outcome Adjusted
appropriation Revised estimate
Medium-term expenditure estimate
R thousand 2008/09 2009/10 2010/11 2011/12 2012/13 2013/14 2014/15 Administration 62 765 63 568 54 339 69 272 69 272 72 287 76 237 69 867
Public Sector Organisational and Staff Development
42 600 57 545 61 149 49 049 49 049 51 205 54 014 68 186
Total 105 365 121 113 115 488 118 321 118 321 123 492 130 251 138 053
Change to 2011 Budget estimate – – 1 000 1 050 –
Economic classification
Current payments 56 291 57 387 52 202 67 238 67 238 70 152 73 985 67 502
Compensation of employees 11 826 18 257 21 123 31 984 31 984 39 117 41 439 42 285
Goods and services 44 465 39 071 31 047 35 254 35 254 31 035 32 546 25 217
of which:
Administrative fees 1 273 819 32 510 510 111 576 605
Advertising 677 775 947 946 946 1 195 1 526 1 776
Assets less than the capitalisation threshold
1 385 928 130 709 709 755 801 841
Audit cost: External 850 1 338 1 217 1 547 1 547 1 646 1 747 1 834
Bursaries: Employees 160 84 2 12 12 12 15 16
Catering: Departmental activities 863 408 385 506 506 431 458 481
Communication 2 163 1 025 1 069 1 130 1 130 1 452 1 267 595
Computer services 3 269 5 234 1 722 1 941 1 941 2 056 2 182 1 291
Consultants and professional services: Business and advisory services
8 994 6 887 1 175 4 664 4 664 3 239 3 352 2 450
Consultants and professional services: Legal costs
– 1 186 – – – – – –
Contractors 5 804 155 255 920 920 979 1 038 1 090
Agency and support / outsourced services
6 670 8 191 13 415 5 896 5 896 5 641 5 757 4 166
Entertainment 118 98 9 173 173 182 140 147
Fleet services (including government motor transport)
– – – 427 427 454 482 506
Inventory: Food and food supplies – – 28 – – 39 – –
Inventory: Learner and teacher support material
9 10 1 287 287 306 324 340
Inventory: Materials and supplies 463 250 20 269 269 284 301 316
Inventory: Medical supplies 2 – 1 1 1 1 1 1
Inventory: Other consumables 125 405 283 89 89 100 106 111
Inventory: Stationery and printing 1 151 1 899 1 071 2 349 2 349 1 601 1 690 825
Lease payments 2 182 5 005 662 4 368 4 368 2 449 2 583 967
Property payments 5 627 448 5 354 513 513 539 569 567
Travel and subsistence 1 639 2 279 2 387 4 263 4 263 3 440 3 427 1 999
Training and development 174 494 308 725 725 999 987 1 215
Operating expenditure 433 352 108 2 071 2 071 2 131 2 111 1 739
Venues and facilities 434 801 466 938 938 993 1 106 1 339
Interest and rent on land – 59 32 – – – – –
Transfers and subsidies 42 600 57 554 61 161 49 049 49 049 51 205 54 014 68 186
Departmental agencies and accounts 42 600 57 545 61 149 49 049 49 049 51 205 54 014 68 186
Households – 9 12 – – – – –
Payments for capital assets 6 474 5 938 2 086 2 034 2 034 2 135 2 252 2 365
Machinery and equipment 5 946 5 194 1 869 1 968 1 968 2 066 2 180 2 289
Software and other intangible assets 528 744 217 66 66 69 72 76
Payments for financial assets – 234 39 – – – – –
Total 105 365 121 113 115 488 118 321 118 321 123 492 130 251 138 053
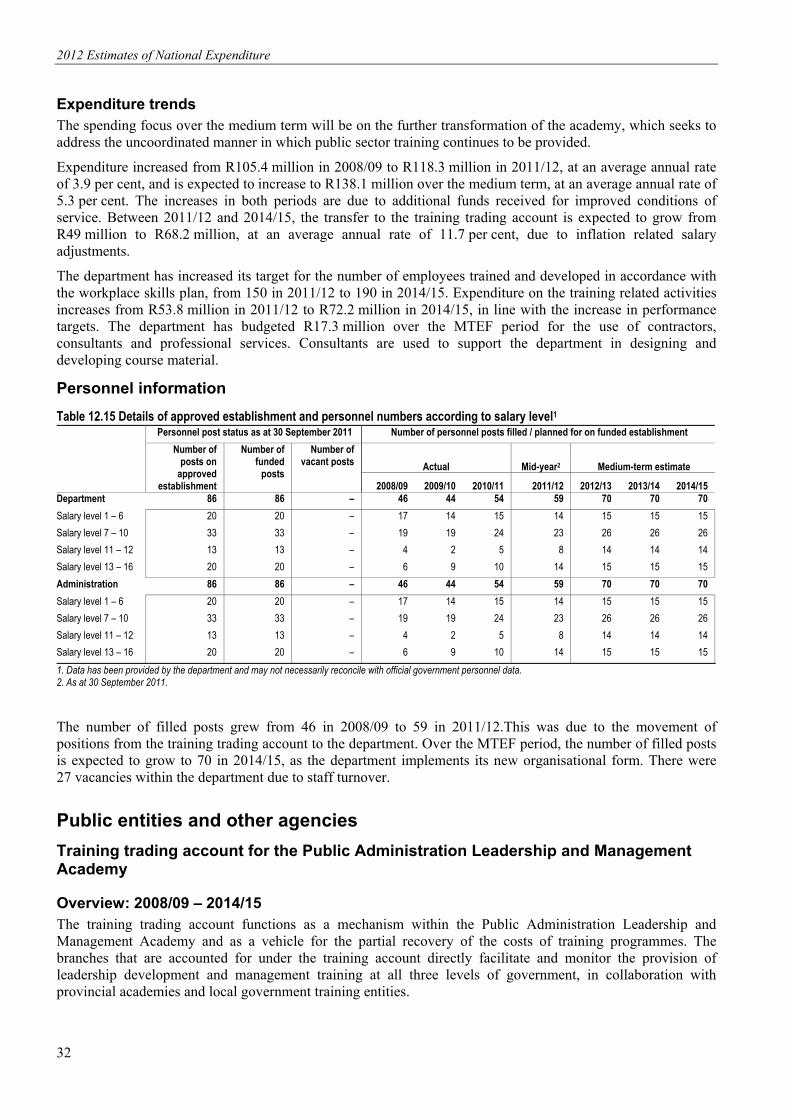
2012 Estimates of National Expenditure
32
Expenditure trends The spending focus over the medium term will be on the further transformation of the academy, which seeks to address the uncoordinated manner in which public sector training continues to be provided.
Expenditure increased from R105.4 million in 2008/09 to R118.3 million in 2011/12, at an average annual rate of 3.9 per cent, and is expected to increase to R138.1 million over the medium term, at an average annual rate of 5.3 per cent. The increases in both periods are due to additional funds received for improved conditions of service. Between 2011/12 and 2014/15, the transfer to the training trading account is expected to grow from R49 million to R68.2 million, at an average annual rate of 11.7 per cent, due to inflation related salary adjustments.
The department has increased its target for the number of employees trained and developed in accordance with the workplace skills plan, from 150 in 2011/12 to 190 in 2014/15. Expenditure on the training related activities increases from R53.8 million in 2011/12 to R72.2 million in 2014/15, in line with the increase in performance targets. The department has budgeted R17.3 million over the MTEF period for the use of contractors, consultants and professional services. Consultants are used to support the department in designing and developing course material.
Personnel information
Table 12.15 Details of approved establishment and personnel numbers according to salary level1 Personnel post status as at 30 September 2011 Number of personnel posts filled / planned for on funded establishment
Number of posts on
approved establishment
Number of funded
posts
Number of vacant posts
Actual Mid-year2 Medium-term estimate
2008/09 2009/10 2010/11 2011/12 2012/13 2013/14 2014/15 Department 86 86 – 46 44 54 59 70 70 70
Salary level 1 – 6 20 20 – 17 14 15 14 15 15 15
Salary level 7 – 10 33 33 – 19 19 24 23 26 26 26
Salary level 11 – 12 13 13 – 4 2 5 8 14 14 14
Salary level 13 – 16 20 20 – 6 9 10 14 15 15 15
Administration 86 86 – 46 44 54 59 70 70 70
Salary level 1 – 6 20 20 – 17 14 15 14 15 15 15
Salary level 7 – 10 33 33 – 19 19 24 23 26 26 26
Salary level 11 – 12 13 13 – 4 2 5 8 14 14 14
Salary level 13 – 16 20 20 – 6 9 10 14 15 15 15
1. Data has been provided by the department and may not necessarily reconcile with official government personnel data.2. As at 30 September 2011.
The number of filled posts grew from 46 in 2008/09 to 59 in 2011/12.This was due to the movement of positions from the training trading account to the department. Over the MTEF period, the number of filled posts is expected to grow to 70 in 2014/15, as the department implements its new organisational form. There were 27 vacancies within the department due to staff turnover.
Public entities and other agencies
Training trading account for the Public Administration Leadership and Management Academy
Overview: 2008/09 – 2014/15 The training trading account functions as a mechanism within the Public Administration Leadership and Management Academy and as a vehicle for the partial recovery of the costs of training programmes. The branches that are accounted for under the training account directly facilitate and monitor the provision of leadership development and management training at all three levels of government, in collaboration with provincial academies and local government training entities.

Vote 12: Public Service and Administration
33
Performance In 2010/11 the academy trained 7 920 public sector officials in a number of management courses, in line with the targeted training sessions for the year. In the same year, key strategic relations for research were established with the Department of Environmental Affairs, the Centre for Public Service Innovation and the National Research Foundation. The academy was able to produce and present two research papers that inform public sector capacity building needs, in line with targets. Over the MTEF period, the academy is expected to develop a business case which will inform the future strategic direction of the trading account. This is expected to lead to a threefold increase in the number of public sector officials trained in leadership development programmes and to maintain the performance levels of the other programmes.
Selected performance indicators Table 12.16 Public Administration Leadership and Management Academy training trading account Indicator Programme/Activity/Objective Past Current Projections
2008/09 2009/10 2010/11 2011/12 2012/13 2013/14 2014/15
Number of public sector officials trained in leadership development programmes in accordance with approved training programmes per year
Public Sector Organisational and Staff Development
2 997 2 246 3 287 2 0001 6 000 7 000 8 000
Number of public sector officials trained in management programmes in accordance with approved training programmes per year
Public Sector Organisational and Staff Development
11 509 12 047 7 920 4 000 4 000 5 000 6 000
Number of public sector officials trained in administration programmes in accordance with approved training programmes per year
Public Sector Organisational and Staff Development
– – – 1 000 700 1000 1 100
Number of Public Administration Leadership and Management Academy research projects undertaken per year in order to inform public sector capacity building needs and interventions
Public Sector Organisational and Staff Development
– – – 2 2 3 4
Number of front line public sector officials trained per year
Public Sector Organisational and Staff Development
183 1 116 1 500 1 700 1 500 1 600 1 700
Number of e-Learning training interventions developed and implemented per year
Public Sector Organisational and Staff Development
1 8 10 10 10 10 15
Number of senior management service members participating in the Khaedu programme and placed to service delivery points in South Africa per year
Public Sector Organisational and Staff Development
329 324 300 300 300 300 350
Number of approved Public Administration Leadership and Management Academy courses customised for implementation by partner countries, in accordance with approved agreements
Public Sector Organisational and Staff Development
– – 2 2 2 2 2
1. This drop is due to the training programmes being under review, and the subsequent completion of the accreditation process.
Programmes/activities/objectives Table 12.17 Public Administration Leadership and Management Academy Training Trading Account
Revised estimate
Audited outcome Medium-term estimate R thousand 2008/09 2009/10 2010/11 2011/12 2012/13 2013/14 2014/15 Public sector organisational and staff development
137 126 170 577 150 812 163 169 143 223 161 304 190 880
Total expense 137 126 170 577 150 812 163 169 143 223 161 304 190 880
The Training Trading Account for the Public Administration Leadership and Management Academy had a total budget of R163.2 million in 2011/12, of which 64.1 per cent was used for goods and services.
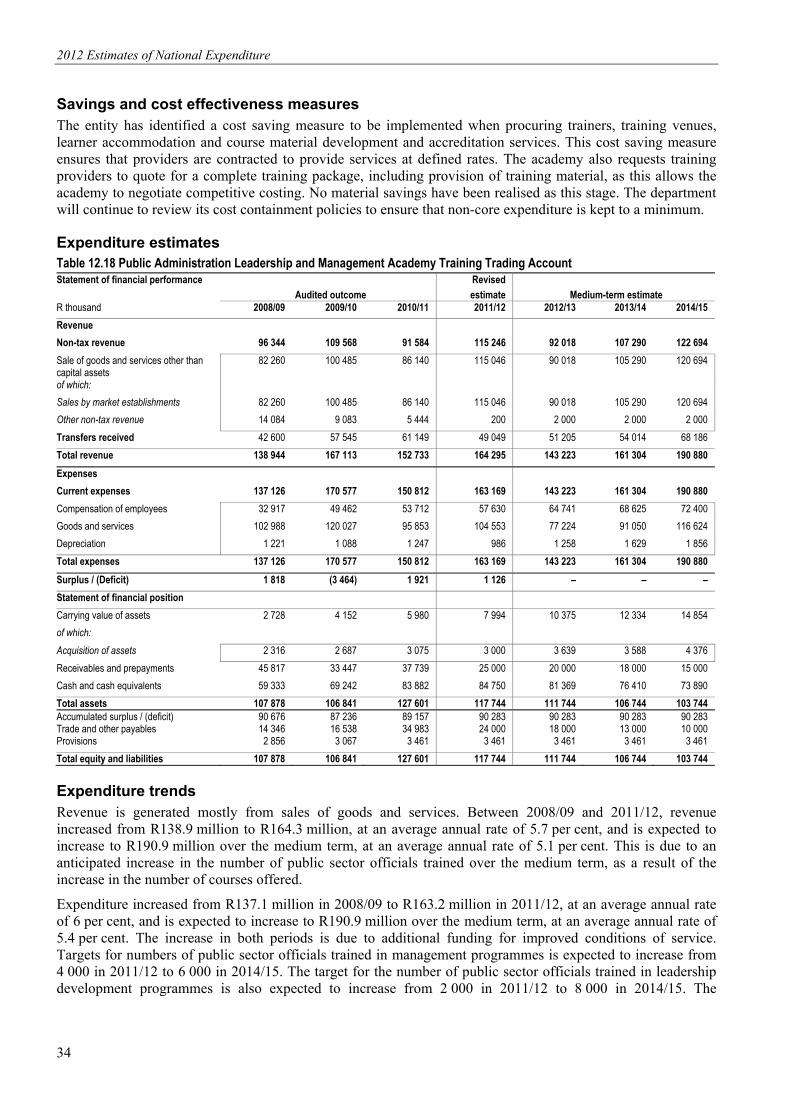
2012 Estimates of National Expenditure
34
Savings and cost effectiveness measures The entity has identified a cost saving measure to be implemented when procuring trainers, training venues, learner accommodation and course material development and accreditation services. This cost saving measure ensures that providers are contracted to provide services at defined rates. The academy also requests training providers to quote for a complete training package, including provision of training material, as this allows the academy to negotiate competitive costing. No material savings have been realised as this stage. The department will continue to review its cost containment policies to ensure that non-core expenditure is kept to a minimum.
Expenditure estimates Table 12.18 Public Administration Leadership and Management Academy Training Trading Account Statement of financial performance Revised
Audited outcome estimate Medium-term estimate R thousand 2008/09 2009/10 2010/11 2011/12 2012/13 2013/14 2014/15
Revenue
Non-tax revenue 96 344 109 568 91 584 115 246 92 018 107 290 122 694
Sale of goods and services other than capital assets
82 260 100 485 86 140 115 046 90 018 105 290 120 694
of which:
Sales by market establishments 82 260 100 485 86 140 115 046 90 018 105 290 120 694
Other non-tax revenue 14 084 9 083 5 444 200 2 000 2 000 2 000
Transfers received 42 600 57 545 61 149 49 049 51 205 54 014 68 186
Total revenue 138 944 167 113 152 733 164 295 143 223 161 304 190 880
Expenses
Current expenses 137 126 170 577 150 812 163 169 143 223 161 304 190 880
Compensation of employees 32 917 49 462 53 712 57 630 64 741 68 625 72 400
Goods and services 102 988 120 027 95 853 104 553 77 224 91 050 116 624
Depreciation 1 221 1 088 1 247 986 1 258 1 629 1 856
Total expenses 137 126 170 577 150 812 163 169 143 223 161 304 190 880
Surplus / (Deficit) 1 818 (3 464) 1 921 1 126 – – –
Statement of financial position
Carrying value of assets 2 728 4 152 5 980 7 994 10 375 12 334 14 854
of which:
Acquisition of assets 2 316 2 687 3 075 3 000 3 639 3 588 4 376
Receivables and prepayments 45 817 33 447 37 739 25 000 20 000 18 000 15 000
Cash and cash equivalents 59 333 69 242 83 882 84 750 81 369 76 410 73 890
Total assets 107 878 106 841 127 601 117 744 111 744 106 744 103 744Accumulated surplus / (deficit) 90 676 87 236 89 157 90 283 90 283 90 283 90 283Trade and other payables 14 346 16 538 34 983 24 000 18 000 13 000 10 000Provisions 2 856 3 067 3 461 3 461 3 461 3 461 3 461
Total equity and liabilities 107 878 106 841 127 601 117 744 111 744 106 744 103 744
Expenditure trends Revenue is generated mostly from sales of goods and services. Between 2008/09 and 2011/12, revenue increased from R138.9 million to R164.3 million, at an average annual rate of 5.7 per cent, and is expected to increase to R190.9 million over the medium term, at an average annual rate of 5.1 per cent. This is due to an anticipated increase in the number of public sector officials trained over the medium term, as a result of the increase in the number of courses offered.
Expenditure increased from R137.1 million in 2008/09 to R163.2 million in 2011/12, at an average annual rate of 6 per cent, and is expected to increase to R190.9 million over the medium term, at an average annual rate of 5.4 per cent. The increase in both periods is due to additional funding for improved conditions of service. Targets for numbers of public sector officials trained in management programmes is expected to increase from 4 000 in 2011/12 to 6 000 in 2014/15. The target for the number of public sector officials trained in leadership development programmes is also expected to increase from 2 000 in 2011/12 to 8 000 in 2014/15. The

Vote 12: Public Service and Administration
35
expenditure items affected by these activities are consultants, communications and advertising. The estimated cost of these outputs in 2012/13 is R40.5 million.
The trading account has allocated R1.5 million over the medium term for the use of consultants to provide support for designing and developing course material.
Personnel information
Table 12.19 Public Administration Leadership and Management Academy training trading account Personnel post status as at 30 September 2011 Number of personnel posts filled / planned for on funded establishment
Number of posts on
approved establishment
Number of funded posts
Number ofvacant posts
Actual Mid-year1 Medium-term estimate
2008/09 2009/10 2010/11 2011/12 2012/13 2013/14 2014/15 Executive management 14 14 – 17 18 17 14 14 14 14Senior management 17 17 2 32 23 26 17 17 17 17Middle management 37 37 10 41 35 45 37 37 37 37Professionals 16 16 3 13 16 14 16 16 16 16Skilled 12 12 3 30 11 22 12 12 12 12Semi-skilled 25 25 5 11 12 22 25 25 25 25Very low skilled 16 16 1 5 7 9 16 16 16 16Total 137 137 24 149 122 155 137 137 137 137Compensation (R thousand)
32 917 49 462 53 712 57 630 64 741 68 625 72 400
Unit cost (R thousand)
221 405 347 421 473 501 528
1. As at 30 September 2011. As at 30 September 2011, the training trading account had an establishment of 137 posts. The number of filled posts decreased from 149 in 2008/09 to 137 in 2011/12, as a result of the movement of positions from the trading account to the department. Over the MTEF period, filled posts are expected to remain constant at 137. There were 24 vacancies within the trading account, due to staff turnover. Most of the movement was in the public sector organisational development
State Information Technology Agency
Overview: 2008/09 – 2014/15 The State Information Technology Agency was established in 1999 to consolidate and coordinate the state’s IT resources, save costs through economies of scale, increase delivery capabilities and improve interoperability. The agency was established in terms of the State Information Technology Agency Act (1998), and is funded on a cost recovery basis through its provision of services such as infrastructure, hosting, data centres and procurement.
In March 2010, in response to the crisis the organisation found itself in Cabinet approved a turnaround framework, to be implemented between 2010/11 and 2013/2014. The strategy was developed to address significant problems of poor governance and procurement practices and weak execution of regulatory functions. The strategy also seeks to address the concerns raised by client departments about poor service delivery and the high costs of the agency’s services and products. The agency will focus on improving revenue growth as part of its cost recovery initiative.
The biggest challenge in the implementation of the strategy in its turnaround year was that the agency had to strike a balance between fixing the organisation internally and improving customers’ experience. The processes that were initiated as part of the strategy are to continue and in 2012/13, the agency will try to build on the successes achieved in the strategy’s foundation year. The re-engineering of the agency’s supply chain management capability has started to pay off through the systematic reduction of backlogs. The agency is now better placed to become an efficient and effective acquirer of information products and services on behalf of government. As the primary partner for the implementation of an integrated financial management system, the agency is also able to gain better insight into the business of government, and the role and use of IT in government.
The entity generates revenue by charging departments and other government institutions a fee for services rendered and does not receive any appropriated funding. Using its revenues, the agency has financed its own
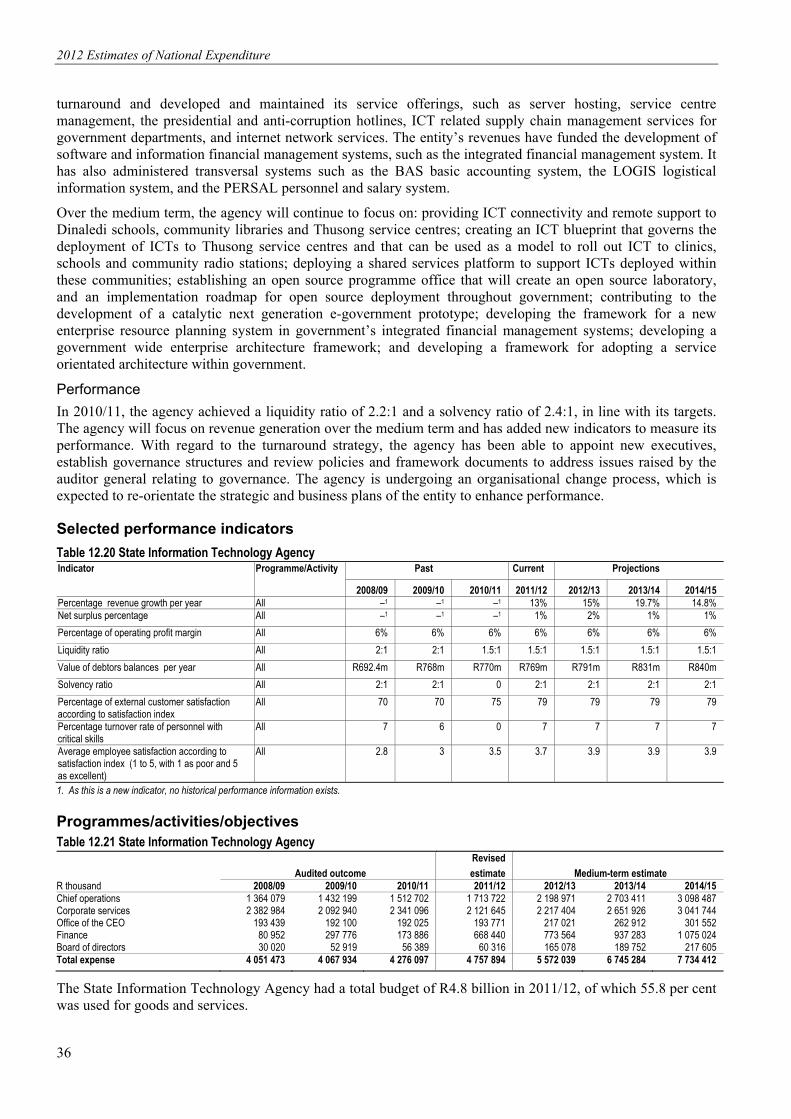
2012 Estimates of National Expenditure
36
turnaround and developed and maintained its service offerings, such as server hosting, service centre management, the presidential and anti-corruption hotlines, ICT related supply chain management services for government departments, and internet network services. The entity’s revenues have funded the development of software and information financial management systems, such as the integrated financial management system. It has also administered transversal systems such as the BAS basic accounting system, the LOGIS logistical information system, and the PERSAL personnel and salary system.
Over the medium term, the agency will continue to focus on: providing ICT connectivity and remote support to Dinaledi schools, community libraries and Thusong service centres; creating an ICT blueprint that governs the deployment of ICTs to Thusong service centres and that can be used as a model to roll out ICT to clinics, schools and community radio stations; deploying a shared services platform to support ICTs deployed within these communities; establishing an open source programme office that will create an open source laboratory, and an implementation roadmap for open source deployment throughout government; contributing to the development of a catalytic next generation e-government prototype; developing the framework for a new enterprise resource planning system in government’s integrated financial management systems; developing a government wide enterprise architecture framework; and developing a framework for adopting a service orientated architecture within government.
Performance In 2010/11, the agency achieved a liquidity ratio of 2.2:1 and a solvency ratio of 2.4:1, in line with its targets. The agency will focus on revenue generation over the medium term and has added new indicators to measure its performance. With regard to the turnaround strategy, the agency has been able to appoint new executives, establish governance structures and review policies and framework documents to address issues raised by the auditor general relating to governance. The agency is undergoing an organisational change process, which is expected to re-orientate the strategic and business plans of the entity to enhance performance.
Selected performance indicators
Table 12.20 State Information Technology Agency Indicator Programme/Activity Past Current Projections
2008/09 2009/10 2010/11 2011/12 2012/13 2013/14 2014/15 Percentage revenue growth per year All –1 –1 –1 13% 15% 19.7% 14.8%Net surplus percentage All –1 –1 –1 1% 2% 1% 1%
Percentage of operating profit margin All 6% 6% 6% 6% 6% 6% 6%
Liquidity ratio All 2:1 2:1 1.5:1 1.5:1 1.5:1 1.5:1 1.5:1
Value of debtors balances per year All R692.4m R768m R770m R769m R791m R831m R840m
Solvency ratio All 2:1 2:1 0 2:1 2:1 2:1 2:1
Percentage of external customer satisfaction according to satisfaction index
All 70 70 75 79 79 79 79
Percentage turnover rate of personnel with critical skills
All 7 6 0 7 7 7 7
Average employee satisfaction according to satisfaction index (1 to 5, with 1 as poor and 5 as excellent)
All 2.8 3 3.5 3.7 3.9 3.9 3.9
1. As this is a new indicator, no historical performance information exists.
Programmes/activities/objectives Table 12.21 State Information Technology Agency
Revised
Audited outcome estimate Medium-term estimate R thousand 2008/09 2009/10 2010/11 2011/12 2012/13 2013/14 2014/15 Chief operations 1 364 079 1 432 199 1 512 702 1 713 722 2 198 971 2 703 411 3 098 487Corporate services 2 382 984 2 092 940 2 341 096 2 121 645 2 217 404 2 651 926 3 041 744Office of the CEO 193 439 192 100 192 025 193 771 217 021 262 912 301 552Finance 80 952 297 776 173 886 668 440 773 564 937 283 1 075 024Board of directors 30 020 52 919 56 389 60 316 165 078 189 752 217 605Total expense 4 051 473 4 067 934 4 276 097 4 757 894 5 572 039 6 745 284 7 734 412
The State Information Technology Agency had a total budget of R4.8 billion in 2011/12, of which 55.8 per cent was used for goods and services.

Vote 12: Public Service and Administration
37
Savings and cost effectiveness measures The agency aims to reduce costs by: creating a shared services centre that will reduce the duplication of administrative functions; adopting a standard operating environment to reduce costs and developing and implementing an IT asset management strategy to ensure the optimal use of assets; providing a syndicated disaster recovery capacity for government to ensure operating efficiency; ensuring preferential procurement pricing for equipment; and developing cost effective and flexible procurement practices, such as strategic sourcing and performance based contracts that will allow government to obtain greater value for its ICT expenditure. No material savings have been achieved to date.
Expenditure estimates Table 12.22 State Information Technology Agency
Statement of financial performance Revised
Audited outcome estimate Medium-term estimate R thousand 2008/09 2009/10 2010/11 2011/12 2012/13 2013/14 2014/15 Revenue
Non-tax revenue 4 161 980 4 099 673 4 461 775 4 856 288 5 683 014 6 804 384 7 814 256
Sale of goods and services other than capital assets
3 933 571 3 941 773 4 302 403 4 762 238 5 584 731 6 701 678 7 706 929
of which:
IT services revenue 3 933 571 3 941 773 4 302 403 4 762 238 5 584 731 6 701 678 7 706 929
Infrastructure (mainframe, network) 228 409 157 900 159 372 94 050 98 283 102 706 107 327
Total revenue 4 161 980 4 099 673 4 461 775 4 856 288 5 683 014 6 804 384 7 814 256
Expenses
Current expenses 4 005 951 4 050 111 4 198 282 4 719 630 5 528 882 6 722 301 7 703 362
Compensation of employees 1 432 387 1 709 646 1 695 475 1 902 836 2 179 846 2 639 343 2 993 270
Goods and services 2 327 468 2 105 216 2 328 771 2 656 515 3 167 530 3 862 959 4 460 513
Depreciation 172 412 177 512 135 499 160 279 181 506 220 000 249 580
Interest, dividends and rent on land 73 684 57 737 38 537 – – – –
Total expenses 4 051 473 4 067 934 4 276 097 4 757 894 5 572 039 6 745 284 7 734 412
Surplus / (Deficit) 110 507 31 739 185 678 98 394 110 975 59 100 79 844
Statement of financial position
Carrying value of assets 615 991 517 222 408 589 1 148 079 1 888 186 1 858 593 2 075 400
of which:
Acquisition of assets 198 506 86 048 29 249 902 849 1 055 200 439 439 231 411
Inventory 19 584 67 634 58 404 60 000 60 000 60 000 60 000
Receivables and prepayments 918 419 854 470 765 360 775 000 815 032 968 038 1 105 744
Cash and cash equivalents 984 717 1 085 152 1 577 925 812 985 202 250 132 344 (20 898)
Taxation 73 274 144 621 99 444 79 006 50 000 50 000 50 000
Derivatives financial instruments – 96 321 32 965 29 006 – – –
Total assets 2 611 985 2 765 420 2 942 687 2 904 076 3 015 468 3 068 975 3 270 246
Accumulated surplus / (deficit) 851 135 882 875 1 068 554 1 166 948 1 277 923 1 337 023 1 416 867
Capital and reserves 625 334 627 335 627 334 627 335 627 334 627 334 627 334
Borrowings 10 400 10 400 5 200 – – – –
Trade and other payables 955 792 1 037 655 1 066 531 850 000 953 957 933 677 1 040 889
Taxation – – – – 14 151 22 984 31 051
Provisions 169 325 110 835 142 103 230 787 142 103 147 958 154 106
Total equity and liabilities 2 611 986 2 669 100 2 909 722 2 875 070 3 015 468 3 068 976 3 270 247
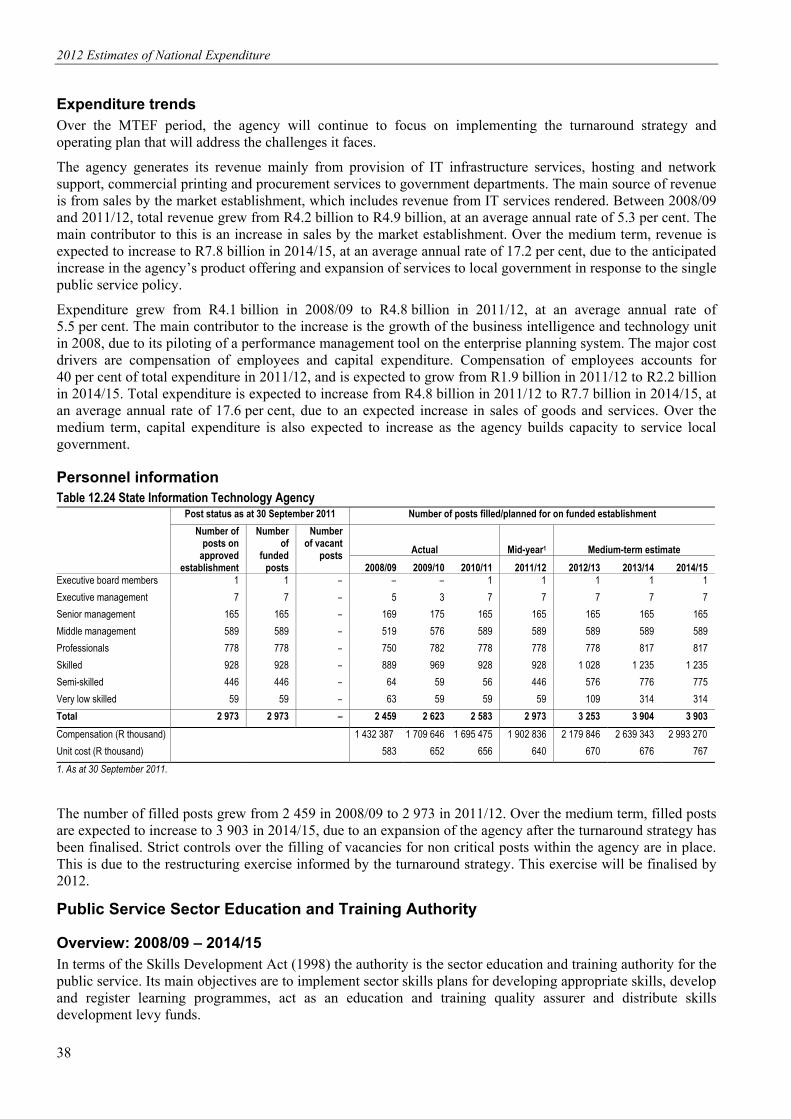
2012 Estimates of National Expenditure
38
Expenditure trends Over the MTEF period, the agency will continue to focus on implementing the turnaround strategy and operating plan that will address the challenges it faces.
The agency generates its revenue mainly from provision of IT infrastructure services, hosting and network support, commercial printing and procurement services to government departments. The main source of revenue is from sales by the market establishment, which includes revenue from IT services rendered. Between 2008/09 and 2011/12, total revenue grew from R4.2 billion to R4.9 billion, at an average annual rate of 5.3 per cent. The main contributor to this is an increase in sales by the market establishment. Over the medium term, revenue is expected to increase to R7.8 billion in 2014/15, at an average annual rate of 17.2 per cent, due to the anticipated increase in the agency’s product offering and expansion of services to local government in response to the single public service policy.
Expenditure grew from R4.1 billion in 2008/09 to R4.8 billion in 2011/12, at an average annual rate of 5.5 per cent. The main contributor to the increase is the growth of the business intelligence and technology unit in 2008, due to its piloting of a performance management tool on the enterprise planning system. The major cost drivers are compensation of employees and capital expenditure. Compensation of employees accounts for 40 per cent of total expenditure in 2011/12, and is expected to grow from R1.9 billion in 2011/12 to R2.2 billion in 2014/15. Total expenditure is expected to increase from R4.8 billion in 2011/12 to R7.7 billion in 2014/15, at an average annual rate of 17.6 per cent, due to an expected increase in sales of goods and services. Over the medium term, capital expenditure is also expected to increase as the agency builds capacity to service local government.
Personnel information Table 12.24 State Information Technology Agency
Post status as at 30 September 2011 Number of posts filled/planned for on funded establishment
Number of posts on
approved establishment
Number of
funded posts
Number of vacant
posts Actual Mid-year1 Medium-term estimate
2008/09 2009/10 2010/11 2011/12 2012/13 2013/14 2014/15 Executive board members 1 1 – – – 1 1 1 1 1
Executive management 7 7 – 5 3 7 7 7 7 7
Senior management 165 165 – 169 175 165 165 165 165 165
Middle management 589 589 – 519 576 589 589 589 589 589
Professionals 778 778 – 750 782 778 778 778 817 817
Skilled 928 928 – 889 969 928 928 1 028 1 235 1 235
Semi-skilled 446 446 – 64 59 56 446 576 776 775
Very low skilled 59 59 – 63 59 59 59 109 314 314
Total 2 973 2 973 – 2 459 2 623 2 583 2 973 3 253 3 904 3 903
Compensation (R thousand) 1 432 387 1 709 646 1 695 475 1 902 836 2 179 846 2 639 343 2 993 270
Unit cost (R thousand) 583 652 656 640 670 676 767
1. As at 30 September 2011.
The number of filled posts grew from 2 459 in 2008/09 to 2 973 in 2011/12. Over the medium term, filled posts are expected to increase to 3 903 in 2014/15, due to an expansion of the agency after the turnaround strategy has been finalised. Strict controls over the filling of vacancies for non critical posts within the agency are in place. This is due to the restructuring exercise informed by the turnaround strategy. This exercise will be finalised by 2012.
Public Service Sector Education and Training Authority
Overview: 2008/09 – 2014/15 In terms of the Skills Development Act (1998) the authority is the sector education and training authority for the public service. Its main objectives are to implement sector skills plans for developing appropriate skills, develop and register learning programmes, act as an education and training quality assurer and distribute skills development levy funds.

Vote 12: Public Service and Administration
39
The authority’s projects are aligned to the national skills development strategy and support the new economic growth path, the industrial policy action plan, rural development, skills to support the green economy, and skills development in education and health. They are also aimed at contributing to capacity building and skills development in institutions dedicated to the fight against crime and corruption, all of which are key government priorities.
The authority continues to perform under conditions of constrained financial resources. It has, however, been able to source R35.8 million in conditional funding from the National Skills Fund to support its 2011/12 outcome oriented goals and objectives. Funding constraints have forced the authority to trim its number of planned projects, and a flagship project for military veterans has been put on hold until the end of 2011/12 at least.
Until the end of 2010/11, the entity’s funding formed part of the Department of Public Service and Administration vote and, as from 2011/12, the Department of Public Service and Administration started making transfer payments to the entity. The funding provided to the Public Service Education Training Authority is used to implement the national skills development strategy, in order to improve the level of skills and competence in the public service and for other government imperatives, such as the rural youth development strategy and the national skills accord.
The authority’s priority over the medium term is to improve the level of skills and competence in the public service sector by implementing the national skills development strategy. The authority has identified skills development interventions in trade and artisanship, professional placements, work-integrated learning, internships, learnerships, adult basic education and training and work experience placements. The authority will undertake the following particular projects: emerging provider development (45 small business organisations); the development of partnership strategies with further education training and higher education institutions for delivering programmes; the accreditation of providers including the recognition of prior learning; sectoral centres; and adult education and training.
In line with the national priority of skills development in rural areas, the authority has set aside resources to implement the rural youth development project and other government wide strategies. The authority has discretionary reserves of R8.5 million, which it intends using to fund projects to address skills gaps identified in the sector skills plan.
Performance In 2010/11, the learning programme unit exceeded its target by assisting 3 211 workers to enter learning programmes, against a target of 2 000, of whom 950 have completed the learning programmes. The training authority also ensured that it retained its accreditation as the public service education and training quality assurer. The authority accredited 33 service providers, developed 24 qualifications and certified 25 moderators, meeting its target in this regard.
The authority is presently undergoing a change process that is expected to lead to a new strategic direction and new business and funding models for the organisation. In terms of the envisaged plan over the MTEF period, the future authority will change in focus from training to assist lower level entry into the labour market, to training for entrance into more skilled jobs.
Selected performance indicators
Table 12.25 Public Service Sector Education and Training Authority Indicator Programme/ Activity Past Current Projected 2008/09 2009/10 2010/11 2011/12 2012/13 2013/14 2014/15 Number of workers assisted to enter scarce and critical skills programmes through learnerships, apprenticeships, bursaries and skills programmes per year
Discretionary grants 700 1 300 2 000 2 500 2 500 2 500 2 500
Sector skills plan update Transfers and subsidies –1 –1 –1 1 1 1 1Raising the qualification bar for under-qualified public service employees
Transfers and subsidies –1 –1 –1 1 000 1 000 1 000 1 000
Encourage workplace based skills development - mentors and evidence collection facilitators
Transfers and subsidies –1 –1 –1 200 200 200 200
Artisanship training Transfers and subsidies –1 –1 –1 100 500 500 500

2012 Estimates of National Expenditure
40
Table 12.25 Public Service Sector Education and Training Authority (continued) Indicator Programme/Activity Past Current Projected 2008/09 2009/10 2010/11 2011/12 2012/13 2013/14 2014/15 Establish and support cooperatives in rural areas
Transfers and subsidies –1 –1 –1 24 24 7 7
Capacitate public further education and training in all 9 provinces towards accreditation
Transfers and subsidies –1 –1 –1 20 20 20 20
Facilitate learnerships Transfers and subsidies –1 –1 –1 200 200 200 200
Facilitate learnerships Transfers and subsidies –1 –1 –1 85 100 130 150
Train and develop education and training development practitioners, skills development facilitators, mentors and evidence collectors facilitators
Transfers and subsidies –1 –1 –1 100 200 200 200
Equip and empower public further education and training colleges for greater contribution and access to skills
Transfers and subsidies –1 –1 –1 5 5 5 5
Develop qualifications to support occupation-specific career path in public service
Transfers and subsidies –1 –1 –1 6 4 1 1
Accredit and support private training providers
Transfers and subsidies –1 –1 –1 4 3 4 4
Develop qualification matrix Transfers and subsidies –1 –1 –1 1 1 1 1
Register assessors and moderators Transfers and subsidies –1 –1 –1 150 300 340 360
Register qualifications with the Quality Council for Trades and Occupations
Transfers and subsidies –1 – 1 –1 – 6 8 9
1. The training authority developed new indicators in line with its new strategic plan as it commences to operate for the first time as an independent entity.
Programmes/activities/objectives Table 12.26 Public Service Sector Education and Training Authority
Revised
Audited outcome estimate Medium-term estimate
R thousand 2008/09 2009/10 2010/11 2011/12 2012/13 2013/14 2014/15
Administration 10 3 594 157 24 503 24 863 26 340 27 436
Transfers and subsidies 241 56 911 42 601 876 878 1 270
Total expense 251 3 650 1 068 67 104 25 739 27 218 28 706
The Public Service Sector Education and Training Authority had a total budget of R67.1 million in 2011/12, of which 63.5 per cent was used for transfers and subsidies.
Savings and cost effectiveness measures In 2010/11, the procurement process was centralised to streamline the entity’s activities. The organisation has since aligned divisional business processes to reduce unnecessary travel and subsistence expenses. Expenditure on this item is expected to decrease from R570 000 in 2011/12 to R114 000 in 2014/15, as a result of this measure. Following a skills audit in 2010/11, the entity has identified internal capacity to reduce use of consultants. Expenditure in this item is expected to decrease from R235 000 in 2011/12 to R133 000 in 2014/15. Instead of purchasing, the entity is exploring the possibility of repairing existing office equipment and furniture and fittings. Office refreshments and entertainment allowances have been reduced significantly. The entity advertises as far as possible on the skills portal website, which is cheaper than other modes of advertising.
Expenditure estimates Table 12.27 Public Service Sector Education and Training Authority
Statement of financial performance Revised Audited outcome estimate Medium-term estimate
R thousand 2008/09 2009/10 2010/11 2011/12 2012/13 2013/14 2014/15
Revenue
Non-tax revenue 306 41 4 8 2 459 2 656 2 754
Other non-tax revenue 306 41 4 8 2 459 2 656 2 754
Transfers received 1 182 956 2 142 58 640 23 877 25 175 26 644
Total revenue 1 488 998 2 146 58 648 26 336 27 831 29 398
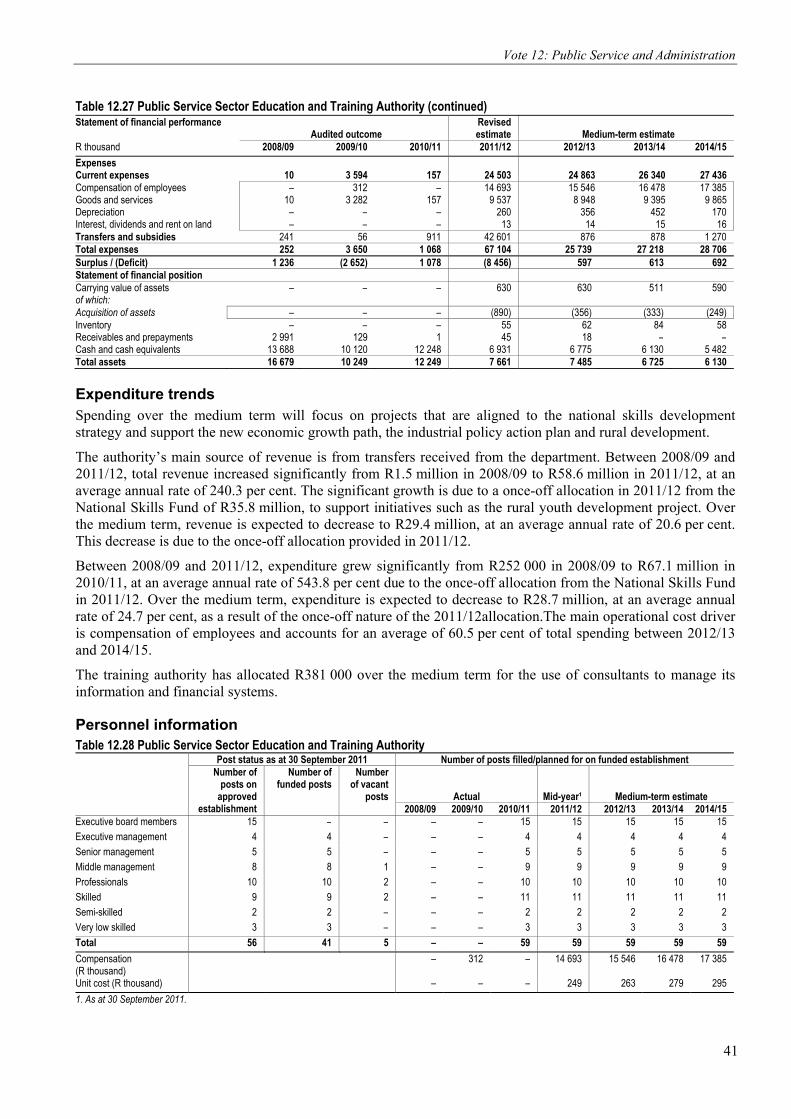
Vote 12: Public Service and Administration
41
Table 12.27 Public Service Sector Education and Training Authority (continued)
Statement of financial performance Revised Audited outcome estimate Medium-term estimate
R thousand 2008/09 2009/10 2010/11 2011/12 2012/13 2013/14 2014/15
Expenses Current expenses 10 3 594 157 24 503 24 863 26 340 27 436Compensation of employees – 312 – 14 693 15 546 16 478 17 385Goods and services 10 3 282 157 9 537 8 948 9 395 9 865Depreciation – – – 260 356 452 170Interest, dividends and rent on land – – – 13 14 15 16Transfers and subsidies 241 56 911 42 601 876 878 1 270Total expenses 252 3 650 1 068 67 104 25 739 27 218 28 706Surplus / (Deficit) 1 236 (2 652) 1 078 (8 456) 597 613 692Statement of financial position Carrying value of assets – – – 630 630 511 590of which: Acquisition of assets – – – (890) (356) (333) (249)Inventory – – – 55 62 84 58Receivables and prepayments 2 991 129 1 45 18 – –Cash and cash equivalents 13 688 10 120 12 248 6 931 6 775 6 130 5 482Total assets 16 679 10 249 12 249 7 661 7 485 6 725 6 130
Expenditure trends Spending over the medium term will focus on projects that are aligned to the national skills development strategy and support the new economic growth path, the industrial policy action plan and rural development.
The authority’s main source of revenue is from transfers received from the department. Between 2008/09 and 2011/12, total revenue increased significantly from R1.5 million in 2008/09 to R58.6 million in 2011/12, at an average annual rate of 240.3 per cent. The significant growth is due to a once-off allocation in 2011/12 from the National Skills Fund of R35.8 million, to support initiatives such as the rural youth development project. Over the medium term, revenue is expected to decrease to R29.4 million, at an average annual rate of 20.6 per cent. This decrease is due to the once-off allocation provided in 2011/12.
Between 2008/09 and 2011/12, expenditure grew significantly from R252 000 in 2008/09 to R67.1 million in 2010/11, at an average annual rate of 543.8 per cent due to the once-off allocation from the National Skills Fund in 2011/12. Over the medium term, expenditure is expected to decrease to R28.7 million, at an average annual rate of 24.7 per cent, as a result of the once-off nature of the 2011/12allocation.The main operational cost driver is compensation of employees and accounts for an average of 60.5 per cent of total spending between 2012/13 and 2014/15.
The training authority has allocated R381 000 over the medium term for the use of consultants to manage its information and financial systems.
Personnel information Table 12.28 Public Service Sector Education and Training Authority
Post status as at 30 September 2011 Number of posts filled/planned for on funded establishmentNumber of
posts on approved
establishment
Number offunded posts
Number of vacant
posts Actual Mid-year¹ Medium-term estimate 2008/09 2009/10 2010/11 2011/12 2012/13 2013/14 2014/15
Executive board members 15 – – – – 15 15 15 15 15Executive management 4 4 – – – 4 4 4 4 4Senior management 5 5 – – – 5 5 5 5 5Middle management 8 8 1 – – 9 9 9 9 9Professionals 10 10 2 – – 10 10 10 10 10Skilled 9 9 2 – – 11 11 11 11 11Semi-skilled 2 2 – – – 2 2 2 2 2Very low skilled 3 3 – – – 3 3 3 3 3
Total 56 41 5 – – 59 59 59 59 59
Compensation (R thousand)
– 312 – 14 693 15 546 16 478 17 385
Unit cost (R thousand) – – – 249 263 279 295
1. As at 30 September 2011.

2012 Estimates of National Expenditure
42
Historically, the training authority has never had its own staff, and has depended on employees seconded from the department. As at 30 September 2011, the authority had an establishment of 56 posts. There were 5 vacancies within the entity, most of them within the learning programmes and education and training quality assurance units. The ratio of support to line staff was 1:6. Over the MTEF period, filled posts are expected to increase to 59 as the training authority increases its establishment due to anticipated organisational growth.

Vote 12: Public Service and Administration
43
Additional tables Table 12.A Summary of expenditure trends and estimates per programme and economic classification Programme Appropriation Audited Appropriation Revised
Main Adjusted outcome Main Additional Adjusted estimateR thousand 2010/11 2010/11 2011/12 2011/12 Administration 140 531 148 675 137 241 165 259 4 404 169 663 169 663Human Resource Management and Development
40 836 43 365 39 490 33 966 2 286 36 252 36 252
Labour Relations and Remuneration Management
21 707 23 708 19 331 23 273 2 696 25 969 25 969
Public Sector Information and Communication Technology Management
42 011 40 506 32 403 40 862 (1 705) 39 157 39 157
Service Delivery and Organisational Transformation
204 664 203 213 207 972 204 843 (1 613) 203 230 203 230
Governance and International Relations 201 735 199 186 191 728 221 866 (5 984) 215 882 215 882
Total 651 484 658 653 628 165 690 069 84 690 153 690 153
Economic classification
Current payments 376 913 378 473 364 884 396 516 (1 457) 395 059 395 059
Compensation of employees 174 430 183 631 175 370 208 792 (8 540) 200 252 200 252
Goods and services 202 483 194 628 189 162 187 724 6 935 194 659 194 659
Interest and rent on land – 214 352 – 148 148 148
Transfers and subsidies 271 626 275 371 256 210 290 891 176 291 067 291 067
Provinces and municipalities 1 1 2 – 2 2 2
Departmental agencies and accounts 271 229 273 047 253 009 290 416 – 290 416 290 416
Foreign governments and international organisations
396 599 477 475 3 478 478
Non-profit institutions – – 1 – – – –
Households – 1 724 2 721 – 171 171 171
Payments for capital assets 2 945 4 809 6 933 2 662 1 365 4 027 4 027
Machinery and equipment 2 623 4 567 6 933 2 528 1 365 3 893 3 893
Software and other intangible assets 322 242 – 134 – 134 134
Payments for financial assets – – 138 – – – –
Total 651 484 658 653 628 165 690 069 84 690 153 690 153
Table 12.B Summary of expenditure on training Adjusted Audited outcome appropriation Medium-term expenditure estimate 2008/09 2009/10 2010/11 2011/12 2012/13 2013/14 2014/15
Compensation of employees (R thousand) 129 111 156 780 175 370 200 252 234 056 255 748 271 382
Training expenditure (R thousand) 3 701 2 634 3 422 3 314 4 112 4 297 4 421
Training as percentage of compensation 2.9% 1.7% 2.0% 1.7% 1.8% 1.7% 1.6%
Total number trained in department (headcount) 202 211 217 176
of which:
Employees receiving bursaries (headcount) 45 42 37 20
Learnerships (headcount) – 5 – –
Internships (headcount) 25 25 – 11
Households receiving bursaries (R thousand) – – – – – – –
Households receiving bursaries (headcount) – – – –
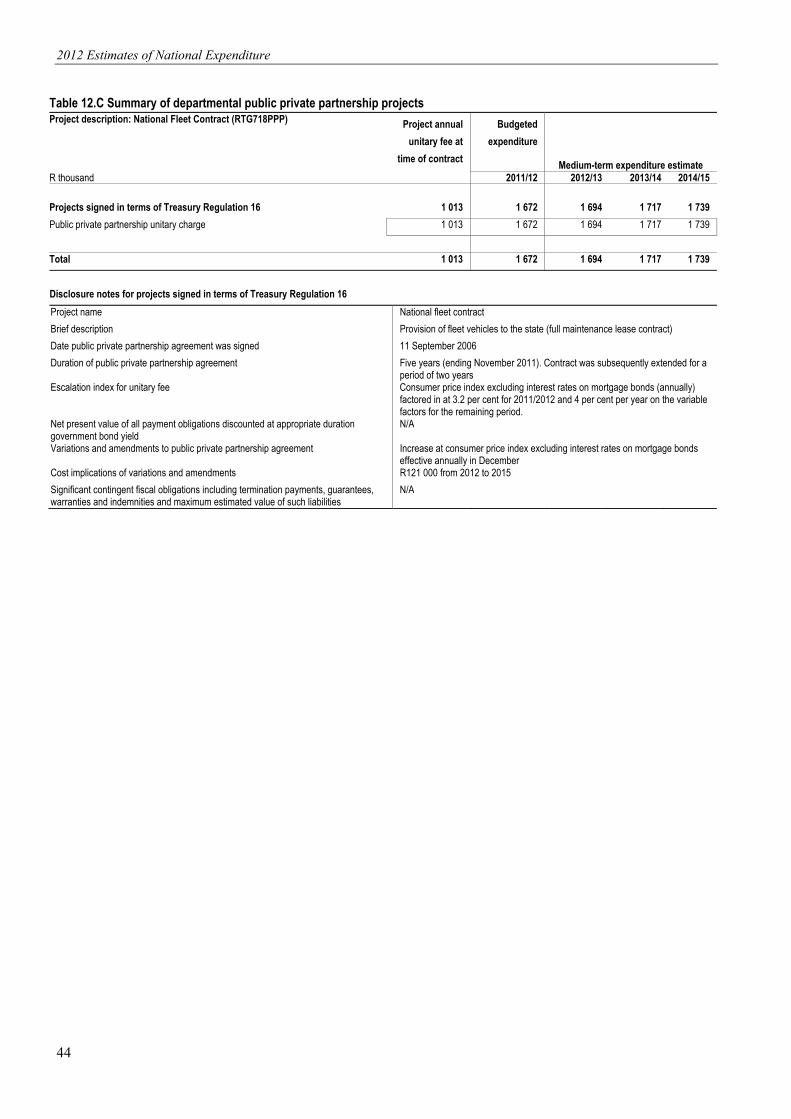
2012 Estimates of National Expenditure
44
Table 12.C Summary of departmental public private partnership projects Project description: National Fleet Contract (RTG718PPP) Project annual
unitary fee at
time of contract
Budgeted
expenditure
Medium-term expenditure estimateR thousand 2011/12 2012/13 2013/14 2014/15
Projects signed in terms of Treasury Regulation 16 1 013 1 672 1 694 1 717 1 739
Public private partnership unitary charge 1 013 1 672 1 694 1 717 1 739
Total 1 013 1 672 1 694 1 717 1 739
Disclosure notes for projects signed in terms of Treasury Regulation 16
Project name National fleet contract
Brief description Provision of fleet vehicles to the state (full maintenance lease contract)
Date public private partnership agreement was signed 11 September 2006
Duration of public private partnership agreement Five years (ending November 2011). Contract was subsequently extended for a period of two years
Escalation index for unitary fee Consumer price index excluding interest rates on mortgage bonds (annually) factored in at 3.2 per cent for 2011/2012 and 4 per cent per year on the variable factors for the remaining period.
Net present value of all payment obligations discounted at appropriate duration government bond yield
N/A
Variations and amendments to public private partnership agreement Increase at consumer price index excluding interest rates on mortgage bonds effective annually in December
Cost implications of variations and amendments R121 000 from 2012 to 2015
Significant contingent fiscal obligations including termination payments, guarantees, warranties and indemnities and maximum estimated value of such liabilities
N/A

45
Tabl
e 12
.D S
umm
ary
of d
onor
fund
ing
D
onor
Pr
ojec
t D
epar
tmen
tal
Prog
ram
me
Perio
d of
co
mm
itmen
t A
mou
nt
com
mitt
ed
Mai
n ec
onom
ic
clas
sific
atio
n
Spen
ding
focu
s
Aud
ited
outc
ome
Estim
ate
Med
ium
-term
exp
endi
ture
estim
ate
R th
ousa
nd
2008
/09
2009
/10
2010
/11
2011
/12
2012
/13
2013
/14
2014
/15
Fore
ign
in C
ash
C
anad
ian
Inte
rnat
iona
l Dev
elop
men
t Age
ncy
Anti-
corru
ptio
n ca
paci
ty b
uild
ing
prog
ram
me
Gov
erna
nce
and
Inte
rnat
iona
l R
elat
ions
2006
to 2
007
21 2
87G
oods
and
se
rvic
es
Stre
ngth
ened
co
mpe
tenc
ies
in
the
publ
ic s
ervi
ce
to p
reve
nt, d
etec
t, in
vest
igat
e an
d m
onito
r cor
rupt
ion
and,
whe
re
nece
ssar
y, h
ave
law
enf
orce
men
t of
ficia
ls p
rose
cute
. In
crea
sed
the
publ
ic s
ervi
ce’s
un
ders
tand
ing
of
corru
ptio
n.
Dev
elop
ed tr
aini
ng
mat
eria
l and
tra
ined
offi
cial
s
–70
63
827
3 29
93
427
––
Roy
al D
anis
h Em
bass
yBu
sine
ss a
nti-
corru
ptio
n tra
inin
g pr
ogra
mm
e
Gov
erna
nce
and
Inte
rnat
iona
l R
elat
ions
2006
to 2
007
6 16
3G
oods
and
se
rvic
es
Incr
ease
d ca
paci
ty
to fi
ght c
orru
ptio
n in
the
publ
ic s
ecto
r. R
epor
t on
the
busi
ness
sur
vey
agai
nst c
orru
ptio
n
–6
163
––
––
–
Deu
tsch
e G
esel
lsch
aftf
ürIn
tern
atio
nale
Zusa
mm
enar
beit
Se
nior
m
anag
emen
t se
rvic
e co
mpe
tenc
y as
sess
men
t
Hum
an
Res
ourc
e M
anag
emen
t an
d D
evel
opm
ent
2007
to 2
008
1 08
0G
oods
and
se
rvic
es
Fina
lised
co
mpu
lsor
y co
mpe
tenc
y as
sess
men
t in
stru
men
ts fo
r se
nior
m
anag
emen
t se
rvic
e m
embe
rs
225
747
––
––
–
Deu
tsch
e G
esel
lsch
aftf
ürIn
tern
atio
nale
Zusa
mm
enar
beit
H
R C
onne
ct
Hum
an
Res
ourc
e M
anag
emen
t an
d D
evel
opm
ent
2008
to 2
010
2 04
9G
oods
and
se
rvic
es
Impl
emen
ted
phas
es 2
and
3 o
f H
R C
onne
ct.
Cha
nged
or
gani
satio
nal
stru
ctur
e, u
pdat
ed
new
job
title
s an
d de
fined
dep
artm
ent
uniq
ue jo
b pr
ofile
s on
Per
sal.
Dis
tribu
ted
and
capt
ured
sur
vey
form
s
527
1 52
2–
––
––
Vote 12: Public Service and Administration
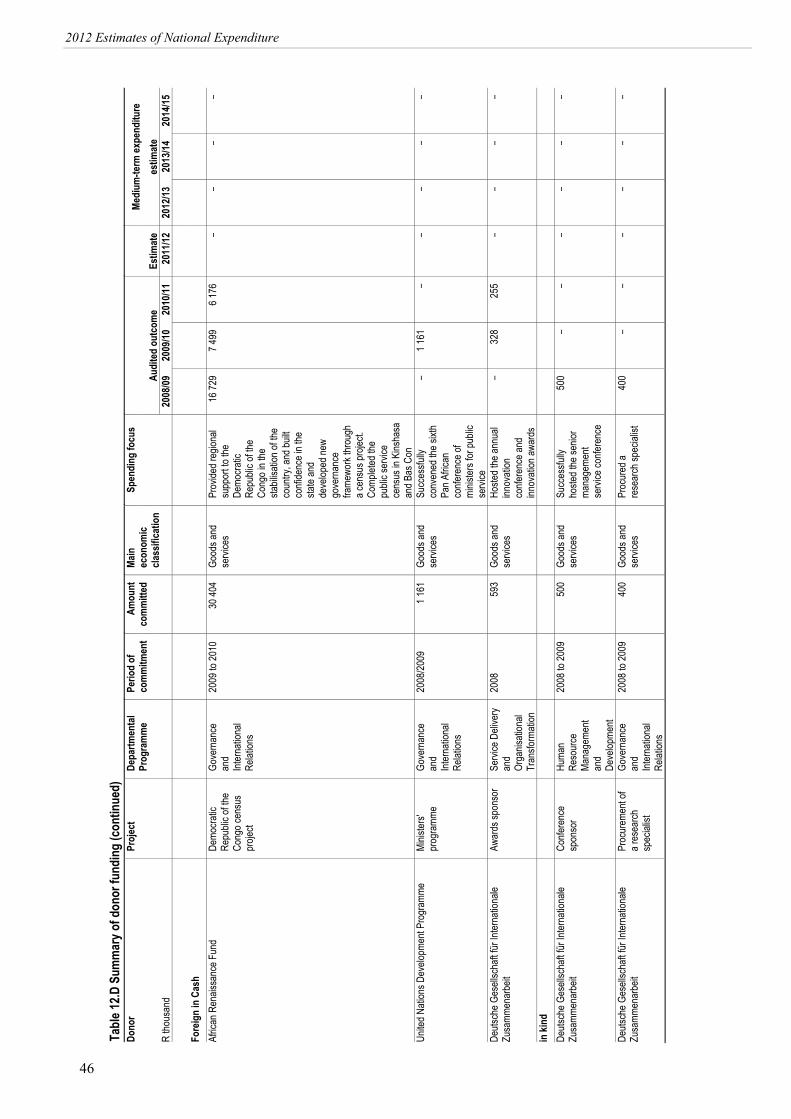
46
2012 Estimates of National Expenditure
Tabl
e 12
.D S
umm
ary
of d
onor
fund
ing
(con
tinue
d)
D
onor
Pr
ojec
t D
epar
tmen
tal
Prog
ram
me
Perio
d of
co
mm
itmen
t A
mou
nt
com
mitt
ed
Mai
n ec
onom
ic
clas
sific
atio
n
Spen
ding
focu
s
Aud
ited
outc
ome
Estim
ate
Med
ium
-term
exp
endi
ture
estim
ate
R th
ousa
nd
2008
/09
2009
/10
2010
/11
2011
/12
2012
/13
2013
/14
2014
/15
Fore
ign
in C
ash
Afric
an R
enai
ssan
ce F
und
Dem
ocra
tic
Rep
ublic
of t
he
Con
go c
ensu
s pr
ojec
t
Gov
erna
nce
and
Inte
rnat
iona
l R
elat
ions
2009
to 2
010
30 4
04G
oods
and
se
rvic
es
Prov
ided
regi
onal
su
ppor
t to
the
Dem
ocra
tic
Rep
ublic
of t
he
Con
go in
the
stab
ilisat
ion
of th
e co
untry
, and
bui
lt co
nfid
ence
in th
e st
ate
and
deve
lope
d ne
w
gove
rnan
ce
fram
ewor
k th
roug
h a
cens
us p
roje
ct.
Com
plet
ed th
e pu
blic
ser
vice
ce
nsus
in K
insh
asa
and
Bas
Con
16 7
297
499
6 17
6–
––
–
Uni
ted
Nat
ions
Dev
elop
men
t Pro
gram
me
Min
iste
rs'
prog
ram
me
Gov
erna
nce
and
Inte
rnat
iona
l R
elat
ions
2008
/200
91
161
Goo
ds a
nd
serv
ices
Su
cces
sful
ly
conv
ened
the
sixt
h Pa
n Af
rican
co
nfer
ence
of
min
iste
rs fo
r pub
lic
serv
ice
–1
161
––
––
–
Deu
tsch
e G
esel
lsch
aftf
ürIn
tern
atio
nale
Zusa
mm
enar
beit
Aw
ards
spo
nsor
Serv
ice
Del
iver
y an
d O
rgan
isat
iona
l Tr
ansf
orm
atio
n
2008
593
Goo
ds a
nd
serv
ices
H
oste
d th
e an
nual
in
nova
tion
conf
eren
ce a
nd
inno
vatio
n aw
ards
–32
825
5–
––
–
in k
ind
Deu
tsch
e G
esel
lsch
aftf
ürIn
tern
atio
nale
Zusa
mm
enar
beit
C
onfe
renc
e sp
onso
r H
uman
R
esou
rce
Man
agem
ent
and
Dev
elop
men
t
2008
to 2
009
500
Goo
ds a
nd
serv
ices
Su
cces
sful
ly
host
ed th
e se
nior
m
anag
emen
t se
rvic
e co
nfer
ence
500
––
––
––
Deu
tsch
e G
esel
lsch
aftf
ürIn
tern
atio
nale
Zusa
mm
enar
beit
Pr
ocur
emen
t of
a re
sear
ch
spec
ialis
t
Gov
erna
nce
and
Inte
rnat
iona
l R
elat
ions
2008
to 2
009
400
Goo
ds a
nd
serv
ices
Pr
ocur
ed a
re
sear
ch s
peci
alis
t 40
0–
––
––
–
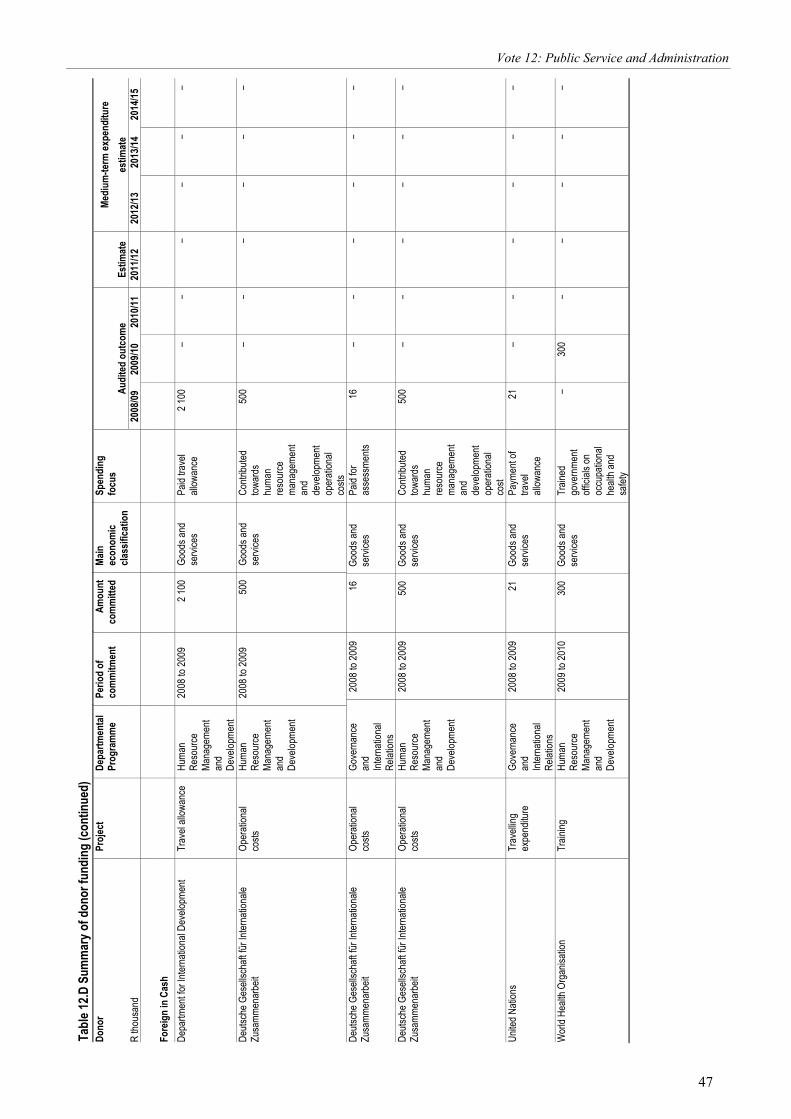
47
Vote 12: Public Service and Administration
Tabl
e 12
.D S
umm
ary
of d
onor
fund
ing
(con
tinue
d)
D
onor
Pr
ojec
t D
epar
tmen
tal
Prog
ram
me
Perio
d of
co
mm
itmen
t A
mou
nt
com
mitt
ed
Mai
n ec
onom
ic
clas
sific
atio
n
Spen
ding
fo
cus
Med
ium
-term
exp
endi
ture
estim
ate
A
udite
d ou
tcom
e Es
timat
e R
thou
sand
20
08/0
920
09/1
020
10/1
120
11/1
220
12/1
320
13/1
4 20
14/1
5
Fore
ign
in C
ash
Dep
artm
ent f
or In
tern
atio
nal D
evel
opm
ent
Trav
el a
llow
ance
Hum
an
Res
ourc
e M
anag
emen
t an
d D
evel
opm
ent
2008
to 2
009
2 10
0G
oods
and
se
rvic
es
Paid
trav
el
allo
wan
ce
2 10
0–
––
––
–
Deu
tsch
e G
esel
lsch
aftf
ürIn
tern
atio
nale
Zusa
mm
enar
beit
O
pera
tiona
l co
sts
Hum
an
Res
ourc
e M
anag
emen
t an
d D
evel
opm
ent
2008
to 2
009
500
Goo
ds a
nd
serv
ices
C
ontri
bute
d to
war
ds
hum
an
reso
urce
m
anag
emen
t an
d de
velo
pmen
t op
erat
iona
l co
sts
500
––
––
– –
Deu
tsch
e G
esel
lsch
aftf
ürIn
tern
atio
nale
Zusa
mm
enar
beit
O
pera
tiona
l co
sts
Gov
erna
nce
and
Inte
rnat
iona
l R
elat
ions
2008
to 2
009
16G
oods
and
se
rvic
es
Paid
for
asse
ssm
ents
16
––
––
– –
Deu
tsch
e G
esel
lsch
aftf
ürIn
tern
atio
nale
Zusa
mm
enar
beit
O
pera
tiona
l co
sts
Hum
an
Res
ourc
e M
anag
emen
t an
d D
evel
opm
ent
2008
to 2
009
500
Goo
ds a
nd
serv
ices
C
ontri
bute
d to
war
ds
hum
an
reso
urce
m
anag
emen
t an
d de
velo
pmen
t op
erat
iona
l co
st
500
––
––
– –
Uni
ted
Nat
ions
Tr
avel
ling
expe
nditu
re
Gov
erna
nce
and
Inte
rnat
iona
l R
elat
ions
2008
to 2
009
21G
oods
and
se
rvic
es
Paym
ent o
f tra
vel
allo
wan
ce
21–
––
––
–
Wor
ld H
ealth
Org
anis
atio
nTr
aini
ng
Hum
an
Res
ourc
e M
anag
emen
t an
d D
evel
opm
ent
2009
to 2
010
300
Goo
ds a
nd
serv
ices
Tr
aine
d go
vern
men
t of
ficia
ls o
n oc
cupa
tiona
l he
alth
and
sa
fety
–30
0–
––
– –

48
2012 Estimates of National Expenditure
Tabl
e 12
.D S
umm
ary
of d
onor
fund
ing
(con
tinue
d)
D
onor
Pr
ojec
t D
epar
tmen
tal
Prog
ram
me
Perio
d of
co
mm
itmen
t A
mou
nt
com
mitt
ed
Mai
n ec
onom
ic
clas
sific
atio
n
Spen
ding
fo
cus
Med
ium
-term
exp
endi
ture
estim
ate
A
udite
d ou
tcom
e Es
timat
e
R th
ousa
nd
2008
/09
2009
/10
2010
/11
2011
/12
2012
/13
2013
/14
2014
/15
Fore
ign
in C
ash
JHPI
EGO
Cor
pora
tion
Incr
ease
d ca
paci
ty
Hum
an
Res
ourc
e M
anag
emen
t an
d D
evel
opm
ent
2009
to 2
010
469
Goo
ds a
nd
serv
ices
In
crea
sed
the
capa
city
for t
he
heal
th a
nd
wel
lnes
s po
licy
with
rega
rd to
th
e im
plem
enta
tion
and
acce
ss to
co
nfid
entia
lity
coun
selin
g an
d te
stin
g of
HIV
an
d Ai
ds in
the
publ
ic s
ecto
r
–46
9–
––
––
Loca
l
in c
ash
Spor
tsm
an's
War
ehou
seIn
daba
pr
ojec
t H
uman
R
esou
rce
Man
agem
ent
and
Dev
elop
men
t
2007
/08
100
Goo
ds a
nd
serv
ices
Su
cces
sful
ly
com
plet
ed th
e In
daba
pro
ject
––
––
––
–
Gov
ernm
ent E
mpl
oyee
s M
edic
al S
chem
e Em
ploy
ee
heal
th a
nd
wel
lnes
s da
y
Hum
an
Res
ourc
e M
anag
emen
t an
d D
evel
opm
ent
2007
/08
110
Goo
ds a
nd
serv
ices
H
oste
d th
e em
ploy
ee
heal
th a
nd
wel
lnes
s da
y
––
––
––
–

49
Vote 12: Public Service and Administration
Tabl
e 12
.D S
umm
ary
of d
onor
fund
ing
(con
tinue
d)
D
onor
Pr
ojec
t D
epar
tmen
tal
Prog
ram
me
Perio
d of
co
mm
itmen
t A
mou
nt
com
mitt
ed
Mai
n ec
onom
ic
clas
sific
atio
n Sp
endi
ng
focu
s
M
ediu
m-te
rm e
xpen
ditu
re
estim
ate
Aud
ited
outc
ome
Estim
ate
R th
ousa
nd
2008
/09
2009
/10
2010
/11
2011
/12
2012
/13
2013
/14
2014
/15
Fore
ign
in C
ash
Byte
s H
arge
s G
loba
l for
um V
G
over
nanc
e an
d In
tern
atio
nal
Rel
atio
ns
2007
/08
223
Goo
ds a
nd s
ervi
ces
Hos
ted
the
glob
al fo
rum
V
––
––
––
–
Gau
teng
pro
vinc
ial g
over
nmen
tG
loba
l for
um V
G
over
nanc
e an
d In
tern
atio
nal
Rel
atio
ns
2007
/08
470
Goo
ds a
nd s
ervi
ces
Hos
ted
the
glob
al fo
rum
V
––
––
––
–
in k
ind
Sanl
am
Seni
or
man
agem
ent
serv
ices
co
nfer
ence
Hum
an
Res
ourc
e M
anag
emen
t an
d D
evel
opm
ent
2007
/08
120
0G
oods
and
ser
vice
sSu
cces
sful
ly
host
ed th
e an
nual
sen
ior
man
agem
ent
serv
ice
conf
eren
ce
––
––
––
–
Inte
rnet
Caf
é (C
ape
Tow
n)Se
nior
m
anag
emen
t se
rvic
es
conf
eren
ce
Hum
an
Res
ourc
e M
anag
emen
t an
d D
evel
opm
ent
2007
/08
35G
oods
and
ser
vice
sSu
cces
sful
lyho
sted
the
annu
al s
enio
r m
anag
emen
t se
rvic
es
conf
eren
ce
––
––
––
–
Sout
h Af
rican
Airw
ays
Trav
el ra
nds
Adm
inis
tratio
n20
08 to
200
99
Goo
ds a
nd s
ervi
ces
Use
d So
uth
Afric
an A
irway
s tra
vel r
ands
pr
ovid
ed to
the
depa
rtmen
t
9–
––
––
–
Mic
roso
ft Aw
ards
spo
nsor
Se
rvic
e D
eliv
ery
and
Org
anis
atio
nal
Tran
sfor
mat
ion
2008
to 2
009
313
Goo
ds a
nd s
ervi
ces
Con
tribu
ted
tow
ards
the
host
ing
of th
e C
entre
for
Publ
ic S
ervi
ce
Inno
vatio
n aw
ards
313
––
––
––
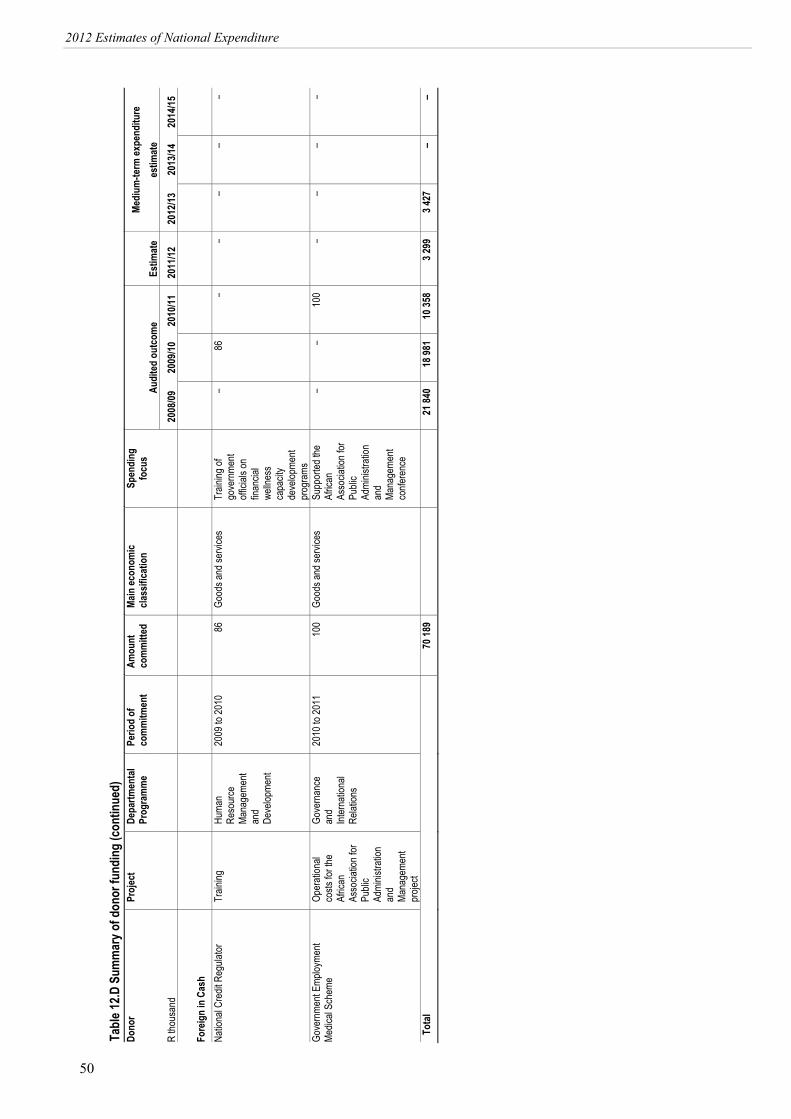
50
2012 Estimates of National Expenditure
Tabl
e 12
.D S
umm
ary
of d
onor
fund
ing
(con
tinue
d)
D
onor
Pr
ojec
t D
epar
tmen
tal
Prog
ram
me
Perio
d of
co
mm
itmen
t A
mou
nt
com
mitt
ed
Mai
n ec
onom
ic
clas
sific
atio
n Sp
endi
ng
focu
s
M
ediu
m-te
rm e
xpen
ditu
re
estim
ate
Aud
ited
outc
ome
Estim
ate
R th
ousa
nd
2008
/09
2009
/10
2010
/11
2011
/12
2012
/13
2013
/14
2014
/15
Fore
ign
in C
ash
Nat
iona
l Cre
dit R
egul
ator
Trai
ning
H
uman
R
esou
rce
Man
agem
ent
and
Dev
elop
men
t
2009
to 2
010
86G
oods
and
ser
vice
sTr
aini
ng o
f go
vern
men
t of
ficia
ls o
n fin
anci
al
wel
lnes
s ca
paci
ty
deve
lopm
ent
prog
ram
s
–86
––
––
–
Gov
ernm
ent E
mpl
oym
ent
Med
ical
Sch
eme
Ope
ratio
nal
cost
s fo
r the
Af
rican
As
soci
atio
n fo
r Pu
blic
Ad
min
istra
tion
and
Man
agem
ent
proj
ect
Gov
erna
nce
and
Inte
rnat
iona
l R
elat
ions
2010
to 2
011
100
Goo
ds a
nd s
ervi
ces
Supp
orte
d th
e Af
rican
As
soci
atio
n fo
r Pu
blic
Ad
min
istra
tion
and
Man
agem
ent
conf
eren
ce
––
100
––
––
Tota
l
70 1
89
21 8
4018
981
10 3
583
299
3 42
7–
–

Estim
ates o
f Natio
na
l expen
ditu
re
National TreasuryDepartment:
REPUBLIC OF SOUTH AFRICA
national treasury
N a t i o n a l T r e a s u r y
estimates of national expenditure
Private Bag X115, Pretoria, 0001, Tel: +27 12 395 6697, Fax: +27 12 315 5126