Vortex Lines within Low-Level Mesocyclones Obtained from ...pmm116/pubs/2008/MRSDRT08MWR.pdf ·...
23
Vortex Lines within Low-Level Mesocyclones Obtained from Pseudo-Dual-Doppler Radar Observations PAUL MARKOWSKI,* ERIK RASMUSSEN, JERRY STRAKA, # ROBERT DAVIES-JONES, @ YVETTE RICHARDSON,* AND ROBERT J. TRAPP & * Department of Meteorology, The Pennsylvania State University, University Park, Pennsylvania Rasmussen Systems, Mesa, Colorado # School of Meteorology, University of Oklahoma, Norman, Oklahoma @ National Severe Storms Laboratory, Norman, Oklahoma & Department of Earth and Atmospheric Sciences, Purdue University, West Lafayette, Indiana (Manuscript received 24 July 2007, in final form 4 January 2008) ABSTRACT Vortex lines passing through the low-level mesocyclone regions of six supercell thunderstorms (three nontornadic, three tornadic) are computed from pseudo-dual-Doppler airborne radar observations ob- tained during the Verification of the Origins of Rotation in Tornadoes Experiment (VORTEX). In every case, at least some of the vortex lines emanating from the low-level mesocyclones form arches, that is, they extend vertically from the cyclonic vorticity maximum, then turn horizontally (usually toward the south or southwest) and descend into a broad region of anticyclonic vertical vorticity. This region of anticyclonic vorticity is the same one that has been observed almost invariably to accompany the cyclonic vorticity maximum associated with the low-level mesocyclone; the vorticity couplet straddles the hook echo of the supercell thunderstorm. The arching of the vortex lines and the orientation of the vorticity vector along the vortex line arches, compared to the orientation of the ambient (barotropic) vorticity, are strongly suggestive of baroclinic vorticity generation within the hook echo and associated rear-flank downdraft region of the supercells, and subsequent lifting of the baroclinically altered/generated vortex lines by an updraft. Dis- cussion on the generality of these findings, possible implications for tornadogenesis, and the similarity of the observed vortex lines to vortex lines in larger-scale convective systems are included as well. 1. Introduction Vortex lines (also sometimes called vortex filaments) are lines tangent to the vorticity vector, analogous to the streamline in a velocity vector field (Dutton 1986, p. 364; Pedlosky 1987, p. 25; Kundu 1990, p. 120). 1 Vortex lines can aid the visualization of the three-dimensional vorticity field. The three-dimensional perspective pro- vided by vortex lines can expose dynamics that may not be as apparent in inspections of only one vorticity com- ponent at a time. For example, the dynamics of midlevel mesocyclogenesis in supercell thunderstorms is easily demonstrated by way of vortex lines (Davies- Jones 1984; Rotunno and Klemp 1985; Fig. 1). Vortex line analyses in phenomena like thunderstorms are complicated by the baroclinic generation of vorticity by the horizontal buoyancy gradients that accompany pre- cipitation regions and vertical drafts. In the presence of significant baroclinic vorticity generation, vortex lines may not even closely approximate material lines (Helmholtz’ theorem). Nonetheless, vortex line analy- ses can be enlightening in that they can suggest plau- sible methods of vorticity generation and reorientation (e.g., observations of vortex rings might lead one to surmise that a local buoyancy extremum is present and responsible for the generation of the rings). Although the vertical component of vorticity tends to be empha- sized in supercell thunderstorm and tornado studies, there is some merit in systematically inspecting the dis- tribution and orientation of three-dimensional vortex 1 What are referred to as “vortex lines” herein are termed “vor- ticity lines” by Lugt (1996, p. 90). Lugt defines a vortex line as an isolated vorticity line within a wind field that is otherwise irrota- tional. Corresponding author address: Dr. Paul Markowski, 503 Walker Building, University Park, PA 16802. E-mail: [email protected] SEPTEMBER 2008 MARKOWSKI ET AL. 3513 DOI: 10.1175/2008MWR2315.1 © 2008 American Meteorological Society
Transcript of Vortex Lines within Low-Level Mesocyclones Obtained from ...pmm116/pubs/2008/MRSDRT08MWR.pdf ·...

Vortex Lines within Low-Level Mesocyclones Obtained from Pseudo-Dual-DopplerRadar Observations
PAUL MARKOWSKI,* ERIK RASMUSSEN,� JERRY STRAKA,# ROBERT DAVIES-JONES,@
YVETTE RICHARDSON,* AND ROBERT J. TRAPP&
*Department of Meteorology, The Pennsylvania State University, University Park, Pennsylvania�Rasmussen Systems, Mesa, Colorado
#School of Meteorology, University of Oklahoma, Norman, Oklahoma@National Severe Storms Laboratory, Norman, Oklahoma
&Department of Earth and Atmospheric Sciences, Purdue University, West Lafayette, Indiana
(Manuscript received 24 July 2007, in final form 4 January 2008)
ABSTRACT
Vortex lines passing through the low-level mesocyclone regions of six supercell thunderstorms (threenontornadic, three tornadic) are computed from pseudo-dual-Doppler airborne radar observations ob-tained during the Verification of the Origins of Rotation in Tornadoes Experiment (VORTEX). In everycase, at least some of the vortex lines emanating from the low-level mesocyclones form arches, that is, theyextend vertically from the cyclonic vorticity maximum, then turn horizontally (usually toward the south orsouthwest) and descend into a broad region of anticyclonic vertical vorticity. This region of anticyclonicvorticity is the same one that has been observed almost invariably to accompany the cyclonic vorticitymaximum associated with the low-level mesocyclone; the vorticity couplet straddles the hook echo of thesupercell thunderstorm. The arching of the vortex lines and the orientation of the vorticity vector along thevortex line arches, compared to the orientation of the ambient (barotropic) vorticity, are strongly suggestiveof baroclinic vorticity generation within the hook echo and associated rear-flank downdraft region of thesupercells, and subsequent lifting of the baroclinically altered/generated vortex lines by an updraft. Dis-cussion on the generality of these findings, possible implications for tornadogenesis, and the similarity of theobserved vortex lines to vortex lines in larger-scale convective systems are included as well.
1. Introduction
Vortex lines (also sometimes called vortex filaments)are lines tangent to the vorticity vector, analogous tothe streamline in a velocity vector field (Dutton 1986, p.364; Pedlosky 1987, p. 25; Kundu 1990, p. 120).1 Vortexlines can aid the visualization of the three-dimensionalvorticity field. The three-dimensional perspective pro-vided by vortex lines can expose dynamics that may notbe as apparent in inspections of only one vorticity com-
ponent at a time. For example, the dynamics ofmidlevel mesocyclogenesis in supercell thunderstormsis easily demonstrated by way of vortex lines (Davies-Jones 1984; Rotunno and Klemp 1985; Fig. 1). Vortexline analyses in phenomena like thunderstorms arecomplicated by the baroclinic generation of vorticity bythe horizontal buoyancy gradients that accompany pre-cipitation regions and vertical drafts. In the presence ofsignificant baroclinic vorticity generation, vortex linesmay not even closely approximate material lines(Helmholtz’ theorem). Nonetheless, vortex line analy-ses can be enlightening in that they can suggest plau-sible methods of vorticity generation and reorientation(e.g., observations of vortex rings might lead one tosurmise that a local buoyancy extremum is present andresponsible for the generation of the rings). Althoughthe vertical component of vorticity tends to be empha-sized in supercell thunderstorm and tornado studies,there is some merit in systematically inspecting the dis-tribution and orientation of three-dimensional vortex
1 What are referred to as “vortex lines” herein are termed “vor-ticity lines” by Lugt (1996, p. 90). Lugt defines a vortex line as anisolated vorticity line within a wind field that is otherwise irrota-tional.
Corresponding author address: Dr. Paul Markowski, 503Walker Building, University Park, PA 16802.E-mail: [email protected]
SEPTEMBER 2008 M A R K O W S K I E T A L . 3513
DOI: 10.1175/2008MWR2315.1
© 2008 American Meteorological Society
MWR2315

lines in observed and simulated storms. A lengthier dis-cussion on the benefits of vortex line analysis appears inStraka et al. (2007).
Vortex line analyses appear relatively infrequentlywithin the body of severe local storms literature. Inaddition to the previously cited theoretical and numeri-cal modeling studies of midlevel mesocyclogenesis byDavies-Jones (1984) and midlevel and low-level meso-cyclogenesis by Rotunno and Klemp (1985), respec-tively, Walko (1993) and Wicker and Wilhelmson(1995) presented vortex lines in their three-dimensionalsimulations of tornadogenesis. As one would expect,the vortex lines were nearly erect in the tornadoes,turned horizontally at the base of the tornadoes, andthen extended horizontally several kilometers from thetornadoes along the surface. Weisman and Davis (1998)presented vortex lines in their investigation of the gen-esis of line-end vortices in mesoscale convective sys-tems. The counterrotating mesoscale vortices com-monly found at opposite ends of quasi-linear convectiveline segments were joined by “arching” vortex lines thatrose out of the cyclonic vortex to the north (in the caseof westerly mean vertical shear and a north–south con-vective line orientation), turned horizontally and ex-tended many tens of kilometers to the south, and thendescended into the anticyclonic vortex. More recently,Nolan (2004) showed that three-dimensional Lagran-gian vortex methods (Chorin 1996) could be used tosimulate mesocyclogenesis as an alternative to the tra-ditional approach of simulating the dynamics with anEulerian grid. We are unaware of any attempts to con-struct vortex lines in observed convective storms (usingpresumably dual-Doppler–derived three-dimensional
wind fields) with the exception of the recent supercellthunderstorm studies by Majcen et al. (2006) andStraka et al. (2007).
The origins of midlevel and low-level rotation in su-percell thunderstorms have been reviewed by Davies-Jones and Brooks (1993), Rotunno (1993), and Davies-Jones et al. (2001). [Herein, “low level” refers to alti-tudes nominally �1000 m AGL. Davies-Jones et al.(2001) referred to these altitudes as “near ground.” Thedistinction between low-level and midlevel mesocy-clones is discussed further in section 4.] Midlevel verti-cal vorticity having relatively high correlation with ver-tical velocity (negative correlation, in the case of a “left-moving” storm)—what most would probably considerthe defining characteristic of a supercell thunderstorm(i.e., a rotating updraft)—can be envisioned as arisingfrom the tilting of vortex lines having a significantstreamwise component by an “isentropic mountain”(Davies-Jones 1984; Fig. 1). The vortex lines are quasi-horizontal in the ambient environment owing to thepresence of large mean vertical wind shear. On theother hand, baroclinic vorticity generation is present inconvective storms, at least somewhere, owing to thepresence of horizontal buoyancy gradients (if therewere no buoyancy gradients there could be no buoyantupdraft in the first place). In addition to the updraft, theevaporation of rain, the melting of graupel and hail, andeven the direct contribution to negative buoyancy bythe mass of hydrometeors themselves unavoidably leadto horizontal buoyancy gradients and baroclinic vortic-ity generation. Given this addition of baroclinic vortic-ity (Dutton 1986, p. 390; Davies-Jones 1996; Davies-Jones et al. 2001) to the barotropic vorticity (defined as
FIG. 1. (a) Effect of a localized vertical displacement “peak” (i.e., hump in an isentropic surface) on vortex lines when the meanvorticity � and mean storm-relative flow v � c are perpendicular (purely crosswise vorticity). The peak draws up loops of vortex lines(shown slightly above, instead of in, the surface for clarity), giving rise to cyclonic vorticity on the right side of the peak (relative to theshear vector S) and anticyclonic vorticity on the left side. [Solenoidal effects (not included in the drawing) actually divert the vortexlines around the right (left) side of a warm (cool) peak, relative to the mean vorticity vector, but do not alter the result.] Theenvironmental flow across the expanding peak produces maximum updraft upstream (storm-relative frame) of the peak due to theupslope component of the vertical velocity. In this case, there is no correlation between vertical velocity and vertical vorticity. (b) Asin (a), but for the other extreme when vorticity is purely streamwise (i.e., � is parallel to v � c). Here, the upslope (downslope) sideof the peak is also the cyclonic (anticyclonic) side, and the vertical velocity and vertical vorticity are positive correlated. (FromDavies-Jones 1984.)
3514 M O N T H L Y W E A T H E R R E V I E W VOLUME 136

the vorticity that has resulted from the amplificationand reorientation of the initial ambient vorticity of thevertically sheared environment over the lifetime of thestorm), particularly at low levels within the rain-cooledoutflow of storms where significant buoyancy gradientswould most likely be found [prior modeling and obser-vational evidence that at least some of the air feedingmesocyclones near the ground originates in the rain-cooled outflow (e.g., Klemp and Rotunno 1983)], oneprobably would not expect the vortex lines passingthrough low-level mesocyclones necessarily to have thesame configuration or orientation as those passingthrough the midlevel mesocyclone, such as in Fig. 1.Along these lines, Davies-Jones (1982a,b) proposedthat a downdraft was actually a prerequisite for thedevelopment of low-level rotation in environments inwhich vertical vorticity was initially negligible near theground [also see the reviews by Davies-Jones andBrooks (1993) and Davies-Jones et al. (2001)], a notionthat has been verified in numerical simulations (e.g.,Rotunno and Klemp 1985; Walko 1993) and is consis-tent with the nearly countless observations of rear-flankdowndrafts (RFDs), hook echoes, and “clear slots” inclose proximity to tornadoes (Lemon and Doswell1979; Markowski 2002a).
If downdrafts are important for the amplification oflow-level vertical vorticity in supercell thunderstorms,the vortex line distribution in the vicinity of low-levelmesocyclones should provide insights into the role ofthe downdrafts. Dual-Doppler wind syntheses andthree-dimensional numerical simulations of supercellsalmost invariably have revealed a region of anticyclonicvorticity on the opposite side of the hook echo as thecyclonic vorticity region associated with the low-levelmesocyclone or tornado (Markowski 2002a). These ob-servations may be indications that vorticity tilting in thevicinity of the RFD, which has a close association withthe hook echo, is important in the intensification oflow-level rotation within supercell storms. A vortex lineanalysis should shed insight into how this couplet isproduced, and in turn, the likely means by which low-level rotation is intensified near the time of tornado-genesis. The RFD is emphasized in this article, hope-fully not unduly, because the horizontal gradient of ver-tical velocity commonly found in proximity to low-levelmesocyclones and tornadoes (Markowski 2002a) is amaximum along the interface separating the RFD andupdraft. We do not wish to imply that forward-flankdowndrafts (FFDs; Lemon and Doswell 1979) are un-important to the overall vorticity budget of low-levelmesocyclones. In numerical simulations of supercellthunderstorms, the horizontal buoyancy gradient alongthe forward-flank gust front is an important source of
storm-scale horizontal vorticity and is crucial for thedevelopment of low-level mesocyclones (Klemp andRotunno 1983; Rotunno and Klemp 1985) [althoughrecent observations (e.g., Shabbott and Markowski2006; Beck et al. 2006; Frame et al. 2008) have raisedquestions about the extensiveness of horizontal vortic-ity generation within some storms]. We believe, how-ever, that the much stronger downward velocities of theRFD, in contrast to those in the FFD (the forward-flank outflow is more nearly hydrostatic), particularlyin the lowest kilometer (e.g., dramatic cloud erosion iscommonly observed in conjunction with intensifyingRFDs; Markowski 2002a), lend the RFD to be a morelikely mechanism for the generation of near-ground cy-clonic vertical vorticity. In the absence of preexistingvertical vorticity at the ground, the development of ro-tation at the ground requires positive vorticity tiltingwithin air parcels that are sinking toward the ground(Davies-Jones 1982a,b; Davies-Jones and Brooks 1993;Davies-Jones et al. 2001).
In this paper we present vortex lines in the low-levelmesocyclone regions of supercells using data obtainedfrom airborne Doppler radars during the Verificationof the Origins of Rotation in Tornadoes Experiment(VORTEX; Rasmussen et al. 1994). This work is in-tended to provide insight into the likely importance ofbaroclinic versus barotropic vorticity, particularly in theRFD region, in the amplification of low-level rotationin supercells. The data and wind retrieval method aredescribed in section 2. The observations are presentedin section 3. Some discussion and interpretation of thefindings are provided in section 4. A summary andsome final remarks appear in section 5.
2. Data and methodology
Six supercells were analyzed, all of which were ob-served during VORTEX-95 (Table 1). Of these, threewere nontornadic (29 April, 12 May, 22 May) and threewere tornadic (16 May, 31 May, 8 June). All six caseshave been documented by a number of investigatorsusing airborne Doppler radar observations (Table 1provides a complete listing). The analyses of the 12May, 16 May, 31 May, and 8 June cases utilized datafrom the Electra Doppler Radar (ELDORA) systemon the National Center for Atmospheric Research(NCAR) Electra aircraft (Hildebrand et al. 1994). Theanalyses of the 29 April and 22 May cases relied on dataobtained by the National Oceanic and AtmosphericAdministration (NOAA) P-3 tail radar. The relativelysmall unambiguous velocity of the P-3 tail radar (�12.9m s�1; by comparison, the unambiguous velocity ofELDORA was �78.8 m s�1) resulted in severe speck-
SEPTEMBER 2008 M A R K O W S K I E T A L . 3515
ling of radial velocities in the middle to upper portionsof the storms observed by the P-3 tail radar. Dealiasingwas not attempted at altitudes above 5.5 km.
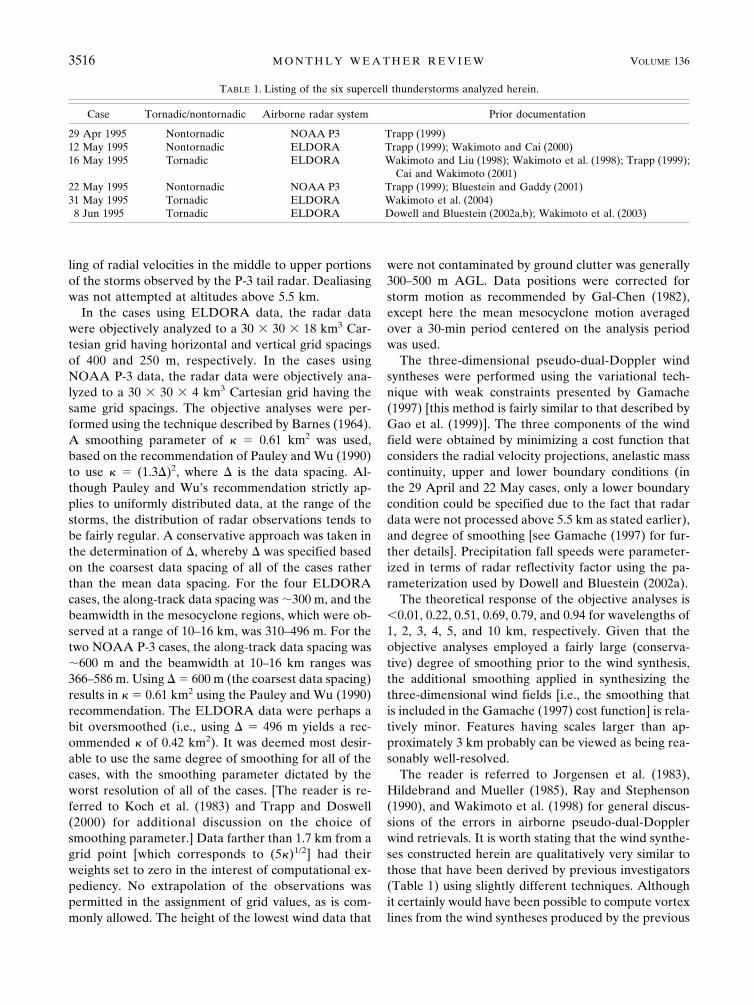
In the cases using ELDORA data, the radar datawere objectively analyzed to a 30 � 30 � 18 km3 Car-tesian grid having horizontal and vertical grid spacingsof 400 and 250 m, respectively. In the cases usingNOAA P-3 data, the radar data were objectively ana-lyzed to a 30 � 30 � 4 km3 Cartesian grid having thesame grid spacings. The objective analyses were per-formed using the technique described by Barnes (1964).A smoothing parameter of � � 0.61 km2 was used,based on the recommendation of Pauley and Wu (1990)to use � � (1.3�)2, where � is the data spacing. Al-though Pauley and Wu’s recommendation strictly ap-plies to uniformly distributed data, at the range of thestorms, the distribution of radar observations tends tobe fairly regular. A conservative approach was taken inthe determination of �, whereby � was specified basedon the coarsest data spacing of all of the cases ratherthan the mean data spacing. For the four ELDORAcases, the along-track data spacing was �300 m, and thebeamwidth in the mesocyclone regions, which were ob-served at a range of 10–16 km, was 310–496 m. For thetwo NOAA P-3 cases, the along-track data spacing was�600 m and the beamwidth at 10–16 km ranges was366–586 m. Using � � 600 m (the coarsest data spacing)results in � � 0.61 km2 using the Pauley and Wu (1990)recommendation. The ELDORA data were perhaps abit oversmoothed (i.e., using � � 496 m yields a rec-ommended � of 0.42 km2). It was deemed most desir-able to use the same degree of smoothing for all of thecases, with the smoothing parameter dictated by theworst resolution of all of the cases. [The reader is re-ferred to Koch et al. (1983) and Trapp and Doswell(2000) for additional discussion on the choice ofsmoothing parameter.] Data farther than 1.7 km from agrid point [which corresponds to (5�)1/2] had theirweights set to zero in the interest of computational ex-pediency. No extrapolation of the observations waspermitted in the assignment of grid values, as is com-monly allowed. The height of the lowest wind data that
were not contaminated by ground clutter was generally300–500 m AGL. Data positions were corrected forstorm motion as recommended by Gal-Chen (1982),except here the mean mesocyclone motion averagedover a 30-min period centered on the analysis periodwas used.
The three-dimensional pseudo-dual-Doppler windsyntheses were performed using the variational tech-nique with weak constraints presented by Gamache(1997) [this method is fairly similar to that described byGao et al. (1999)]. The three components of the windfield were obtained by minimizing a cost function thatconsiders the radial velocity projections, anelastic masscontinuity, upper and lower boundary conditions (inthe 29 April and 22 May cases, only a lower boundarycondition could be specified due to the fact that radardata were not processed above 5.5 km as stated earlier),and degree of smoothing [see Gamache (1997) for fur-ther details]. Precipitation fall speeds were parameter-ized in terms of radar reflectivity factor using the pa-rameterization used by Dowell and Bluestein (2002a).
The theoretical response of the objective analyses is0.01, 0.22, 0.51, 0.69, 0.79, and 0.94 for wavelengths of1, 2, 3, 4, 5, and 10 km, respectively. Given that theobjective analyses employed a fairly large (conserva-tive) degree of smoothing prior to the wind synthesis,the additional smoothing applied in synthesizing thethree-dimensional wind fields [i.e., the smoothing thatis included in the Gamache (1997) cost function] is rela-tively minor. Features having scales larger than ap-proximately 3 km probably can be viewed as being rea-sonably well-resolved.
The reader is referred to Jorgensen et al. (1983),Hildebrand and Mueller (1985), Ray and Stephenson(1990), and Wakimoto et al. (1998) for general discus-sions of the errors in airborne pseudo-dual-Dopplerwind retrievals. It is worth stating that the wind synthe-ses constructed herein are qualitatively very similar tothose that have been derived by previous investigators(Table 1) using slightly different techniques. Althoughit certainly would have been possible to compute vortexlines from the wind syntheses produced by the previous
TABLE 1. Listing of the six supercell thunderstorms analyzed herein.
Case Tornadic/nontornadic Airborne radar system Prior documentation
29 Apr 1995 Nontornadic NOAA P3 Trapp (1999)12 May 1995 Nontornadic ELDORA Trapp (1999); Wakimoto and Cai (2000)16 May 1995 Tornadic ELDORA Wakimoto and Liu (1998); Wakimoto et al. (1998); Trapp (1999);
Cai and Wakimoto (2001)22 May 1995 Nontornadic NOAA P3 Trapp (1999); Bluestein and Gaddy (2001)31 May 1995 Tornadic ELDORA Wakimoto et al. (2004)
8 Jun 1995 Tornadic ELDORA Dowell and Bluestein (2002a,b); Wakimoto et al. (2003)
3516 M O N T H L Y W E A T H E R R E V I E W VOLUME 136

investigators, it was deemed desirable to use identicalobjective analysis and wind synthesis methods and pa-rameters for all of the vortex line analyses presentedherein, given the sensitivity of vorticity (and evengreater sensitivity of vortex lines) to small-scale detailsin the wind field.
The three-dimensional vorticity components werecomputed at each grid point using second-order, cen-tered differences, except along data boundaries whereone-sided differences were used. The vorticity compo-nents were lightly smoothed with a one-step Leise filter(Leise 1982), after which vortex lines were computedusing a fourth-order Runge–Kutta integration. Thefinescale structure of the vortex lines is, as one wouldsurmise, fairly sensitive to the degree to which the vor-ticity components are smoothed; however, the qualita-tive characteristics of the vortex lines (e.g., whethervortex lines form loops, arches, or erupt vertically fromnear the ground to mid- to upper levels) are fairly ro-bust for reasonable degrees of smoothing (see appen-dix).
The vortex lines presented in section 3 pass throughand near to the center of the vertical vorticity maximumat 1 km AGL, which we also occasionally refer to as thelow-level mesocyclone; one vortex line passes throughthe vertical vorticity maximum, and four additional vor-tex lines pass through points surrounding the verticalvorticity maximum (these points form a 1 km � 1 kmsquare centered on the vorticity maximum, with theexception of the 22 May case, for which a 2 km � 2 kmsquare was used owing to the mesocyclone core beingnearly twice as large as in the other cases). When pos-sible, an additional, sixth vortex line originating in theambient environment ahead of the storm gust frontsalso is shown for each case. In the nontornadic cases,vortex lines are shown at the time of maximum low-level vertical vorticity (tornadogenesis “failure”) iden-tified by prior investigators [Wakimoto and Cai (2000)for the 12 May case (0034:39–0041:15 UTC 13 May);2
Trapp (1999) in the 29 April (0026:22–0030:59 UTC 30April) and 22 May (2355:11–0000:58 UTC) cases]. Forthe tornadic cases, vortex lines are shown prior to tor-nadogenesis (generally 10–20 min before tornadogen-esis) as well as at the time of tornadogenesis. It also isworth mentioning that the location of the tornado is notnecessarily coincident with the vertical vorticity maxi-mum retrieved in the three-dimensional wind syntheses(e.g., Wakimoto et al. 2004), which only retain meso-
cyclone-scale kinematic features. Only the vortex linesclustered around the mesocyclone center were com-puted; no attempt to construct vortex lines through thecenter of the tornado was undertaken since the torna-does were not resolved by the airborne radars.
3. Observations
a. Nontornadic supercell cases: 12 May, 29 April,22 May
Figures 2–5 depict the radar reflectivity, storm-relative wind vectors, and vertical vorticity at 1 kmAGL, in addition to vortex lines passing through andnear to the low-level vertical vorticity maximum, for the12 May, 29 April, and 22 May nontornadic supercellcases, respectively. A vortex line originating in the am-bient boundary layer south of the gust front also isshown for the 12 May and 29 April cases (lack of dual-Doppler observations in the ambient environment pre-cluded the calculation of an environmental vortex linein the 22 May case). The environmental hodographs foreach case are presented in Fig. 6.
In all three nontornadic supercell cases, the low-levelmesocyclones are associated with vertical vorticitymaxima well in excess of 1 � 10�2 s�1. The strongestlow-level mesocyclone is analyzed in the 12 May storm,with a peak vertical vorticity of approximately 5 � 10�2
s�1 at 1 km AGL (Fig. 2a).3 The weakest low-levelmesocyclone at the time of tornadogenesis failure isanalyzed in the 22 May case, with a peak vertical vor-ticity of approximately 2 � 10�2 s�1 at 1 km AGL (Fig.5a), although it is worth noting that the core radius ofthe low-level mesocyclone of the 22 May storm is al-most twice as wide as that analyzed in the 12 May stormat the times analyzed herein; thus, the 12 May and 22May mesocyclones have more similar circulations.
Almost all of the vortex lines passing through thelow-level mesocyclone in the 12 May storm extend afew kilometers upward from the cyclonic vorticitymaximum, but then turn southwestward and descendinto a broad region of low-level anticyclonic verticalvorticity found in the trailing portion of the hook echo(Figs. 2b,c). In other words, the couplet of oppositelysigned vertical vorticity (reviewed in section 1) thatseems to be a ubiquitous characteristic of supercellhook echo regions is joined by vortex line “arches.”These vortex lines bear a striking resemblance to thevortex lines originating in the cold pools of mesoscale
2 Trapp (1999) analyzed the 12 May 1995 case at earlier times(2252 and 2256 UTC analysis times were presented) using NOAAP-3 data (the 0034–0041 UTC period is analyzed herein usingELDORA data).
3 The maximum low-level (0–1 km AGL) vertical vorticity ana-lyzed by Trapp (1999) in his 2252 and 2256 UTC analyses of the12 May case was approximately 2.5 � 10�2 s�1.
SEPTEMBER 2008 M A R K O W S K I E T A L . 3517

convective systems simulated by Weisman and Davis(1998), which are subsequently drawn upward by up-drafts, leading to the formation of counterrotating line-end vortices. This similarity will be revisited in sec-tion 4.
The vortex lines that originate in the boundary layerof the ambient environment south of the gust front inthe 12 May case point generally toward the north (Figs.2b,c), consistent with the environmental hodograph ob-tained from inflow soundings (Fig. 6a; excluding a shal-low layer within �200 m of the ground, in which theenvironmental horizontal vorticity points toward thesouthwest). The environmental vortex line displayed inFig. 2c ascends abruptly from south to north, enteringthe midlevel updraft and mesocyclone region severalkilometers above the ground. The differences in theconfigurations of the environmental vortex line and thevortex lines passing through the low-level vorticitymaximum (e.g., the horizontal component of the envi-ronmental vorticity points in roughly the opposite di-rection to the horizontal component of the vorticitythat defines the vortex line arches emanating from thelow-level vertical vorticity maximum) might imply thatdifferent dynamical processes were important to theproduction of vertical vorticity at different altitudes.This issue also is reserved for section 4.
Additional vortex lines also are constructed at selectlocations northwest (upstream) of the aforementionedvortex lines (Fig. 3). These vortex lines also formarches, but the apexes of the arches extend to progres-sively lower altitudes the farther northwest one looks.The vortex line farthest northwest in Fig. 3 is inclinedvery little with respect to the horizontal, and the viewfrom above (Fig. 3a) indicates that this vortex linenearly forms a closed loop (the endpoints of this vortexline extend below the data horizon), with the orienta-tion of the vorticity along this vortex line suggestive ofa local maximum of downdraft and/or negative buoy-ancy being nearly encircled by this vortex line. Indeed,
←
FIG. 2. (a) Equivalent radar reflectivity factor (dBZe; shaded) at1.0 km AGL at 0034:39–0041:15 UTC 13 May 1995. Storm-relativewind vectors and vertical vorticity contours (10�2 s�1 contourinterval; the zero contour is suppressed and negative contours aredashed) at the same altitude also are overlaid. (b) Equivalentradar reflectivity factor and isovorts at 1.0 km AGL as in (a),along with the projections of select vortex lines (bold solid lines)onto the ground. The region enclosed by the square in (a) isenlarged. The direction of the vorticity vector is indicated by thearrow heads. Five of the vortex lines pass through points centeredon and surrounding the vertical vorticity maximum at 1.0 km. Asixth vortex line originates in the environment ahead of the gustfront. (c) As in (b), but a three-dimensional perspective is shown.
3518 M O N T H L Y W E A T H E R R E V I E W VOLUME 136

a local downdraft maximum was observed in this loca-tion (Fig. 3a).
In the 29 April and 22 May nontornadic cases, similarevidence of vortex line arches is present, although per-
FIG. 3. As in Figs. 2b,c, but only a pair of select vortex lines inthe outflow to the west of the low-level mesocyclone are shown, inaddition to the vortex line passing through the center of the vor-ticity maximum at 1 km AGL and a vortex line originating in theenvironment (cf. Figs. 2b,c). In (a), select vertical velocity con-tours at 1 km AGL also are overlaid to show the position of a localdowndraft maximum (white dashed contours of �2.5, �5.0, �7.5,and �10.0 m s�1 are shown).
FIG. 4. As in Fig. 2, but for 0026:22–0030:59 UTC 30 Apr 1995.
SEPTEMBER 2008 M A R K O W S K I E T A L . 3519

haps to a lesser degree. In the 29 April case (Figs. 4b,c),only the vortex line passing through the southeasternpart of the low-level mesocyclone forms an arch in amanner similar to the majority of vortex lines con-structed for the 12 May case. In the 22 May case (Figs.5b,c), only the vortex lines passing through the westernpart of the low-level mesocyclone form such arches (be-cause of overlapping vortex lines, it might be somewhatdifficult to see that the vortex line arches enter thewestern part of the low-level mesocyclone in Figs. 5b,c).The differences in the exact number of vortex lines thatform arches should not be overinterpreted (the numberof vortex lines passing through even a tiny area is infi-nite unless a convention is applied that relates the spac-ing of lines to the strength of the field), as it is some-what arbitrary in that more vortex line arches couldhave been drawn if the points surrounding the low-levelvertical vorticity maximum through which the vortexlines passed were adjusted from case to case, dependingon the size and horizontal structure of the low-levelmesocyclone. Instead, vortex lines were drawn throughthe exact same arrangement of points surrounding thelow-level mesocyclones in each case (one point cen-tered on the vertical vorticity maximum, with four ad-ditional points surrounding the vertical vorticity maxi-mum, as discussed in section 2). Furthermore, and per-haps more importantly, recall that the top of the dataregion in the 29 April and 22 May cases was 4 km,compared to 18 km in the 12 May case. One cannotknow where the vortex lines that exit the relativelyshallow domains in the 29 April and 22 May caseswould go after reaching an altitude of 4 km.
Similar to the 12 May case, the horizontal componentof the environmental vorticity in the 29 April case(which points toward the northeast; Fig. 6b) points inroughly the opposite direction as the horizontal com-ponent of the vorticity that defines the vortex line archemanating from the low-level vertical vorticity maxi-mum (Fig. 4b). In the 22 May case, although no ambientvortex line in the near-storm environment could becomputed from the dual-Doppler observations, hodo-graphs obtained from soundings launched in the storminflow showed a horizontal vorticity orientation thatveered significantly with height, from southwestwardpointing in the lowest few hundred meters to north-northeastward pointing at 1 km (Fig. 6c); the orienta-tion of the horizontal vorticity in the vortex line archesevident in Fig. 5c was approximately parallel to thehorizontal vorticity at �500 m but differed substantiallyfrom the orientation of the environmental horizontalvorticity in the 0–300-m layer and above 800 m (Fig.6c).
FIG. 5. As in Fig. 2, but for 2355:11–0000:58 UTC 22–23 May1995. A vortex line originating in the environment ahead of thegust front could not be drawn owing to limited observations.
3520 M O N T H L Y W E A T H E R R E V I E W VOLUME 136

b. Tornadic supercell cases: 16 May, 31 May,8 June
Figures 7–12 depict vortex lines and low-level radarreflectivity, storm-relative wind vectors, and verticalvorticity for the 16 May, 31 May, and 8 June tornadicsupercell cases. The supercells produced F3, F0, and F2tornadoes, respectively.4
For each case, analyses are presented both at thetime of tornadogenesis as well as at an earlier time (theexact lead time varies from case to case). The readermay find it interesting that the vertical vorticity maximaat 1 km AGL are not systematically larger in the tor-nadic cases, even at the time of tornadogenesis (Figs.8a, 10a, 12a), compared to the nontornadic cases (Figs.2a, 4a, 5a). In fact, this might be considered one of themost important findings of VORTEX: tornadic andnontornadic supercells have surprising kinematic simi-
larities at scales larger than the tornado (e.g., the me-socyclone scale) (Trapp 1999; Wakimoto and Cai 2000).
Vortex line arches are observed in all of the tornadiccases, just as they are for the nontornadic cases. In allthree tornadic cases, as is found for the nontornadiccases, the orientation of the low-level environmentalhorizontal vorticity (Fig. 6d–f), relatively isolated ex-ceptions in shallow layers aside, differs significantlyfrom the orientation of the horizontal vorticity associ-ated with the vortex line arches. The environmentalvorticity tends to point northward, whereas the vortexlines that form arches tend to turn southward or west-ward after emanating from the low-level vertical vor-ticity maxima (Figs. 7–12b,c).
Some tendency exists for the arches to be more com-mon prior to tornadogenesis. In the 16 May case, ananalysis derived approximately 29 min prior to torna-dogenesis (2301:40–2307:00 UTC) reveals that the vor-tex lines passing through the center and to the south ofthe low-level vertical vorticity maximum abruptly turnsouthwestward below 3 km AGL, where they then de-scend and exit the bottom of the data domain 3–7 kmfrom the vertical vorticity maximum (Figs. 7b,c). Dur-
4 The 8 June 1995 supercell produced a number of significanttornadoes (the most intense was rated F5 by R. Wakimoto) incyclic fashion. The analyses presented herein were obtained dur-ing and just prior to the development of the first tornado. SeeDowell and Bluestein (2002a) for further details.
FIG. 6. Storm-relative hodographs depicting the environmental winds in the following cases: (a) 12 May, (b) 29Apr, (c) 22 May, (d) 16 May, (e) 31 May, and (f) 8 Jun 1995. Numerals along the hodographs indicate heights aboveground level in km. Open circles are placed on the hodographs at an altitude of 500 m. The orientation of theenvironmental horizontal vorticity vector (�h) at 1 km AGL is indicated with a bold arrow in (a)–(f). The 12 May,22 May, 16 May, and 8 Jun 1995 cases are identical to those presented by Wakimoto and Cai (2000), Bluestein andGaddy (2001), Wakimoto et al. (1998), and Dowell and Bluestein (2002a), respectively.
SEPTEMBER 2008 M A R K O W S K I E T A L . 3521

FIG. 7. As in Fig. 2, but for 2301:40–2307:00 UTC 16 May 1995. FIG. 8. As in Fig. 2, but for 2331:00–2336:00 UTC 16 May 1995.
3522 M O N T H L Y W E A T H E R R E V I E W VOLUME 136

FIG. 9. As in Fig. 2, but for 2218:00–2222:00 UTC 31 May 1995. FIG. 10. As in Fig. 2, but for 2236:40–2244:32 UTC 31 May1995.
SEPTEMBER 2008 M A R K O W S K I E T A L . 3523
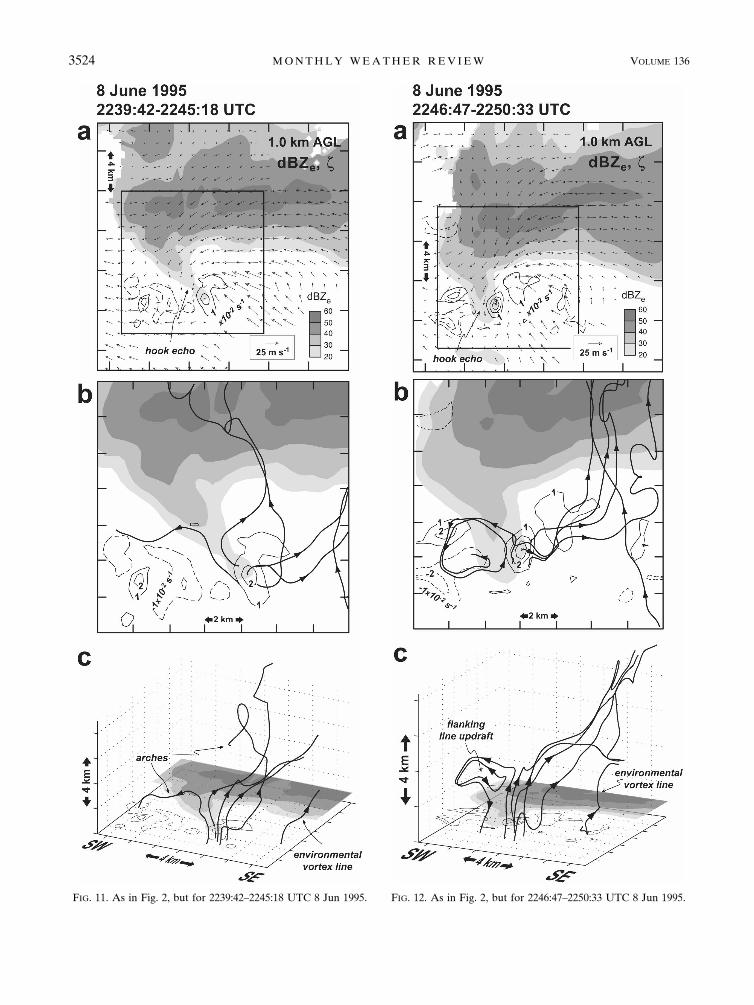
FIG. 11. As in Fig. 2, but for 2239:42–2245:18 UTC 8 Jun 1995. FIG. 12. As in Fig. 2, but for 2246:47–2250:33 UTC 8 Jun 1995.
3524 M O N T H L Y W E A T H E R R E V I E W VOLUME 136

ing the analysis period in which tornadogenesis oc-curred (2331:00–2336:00 UTC), the vortex lines on theeastern flank of the low-level mesocyclone form arches,whereas the vortex line passing through the center ofthe low-level vertical vorticity maximum is fairly up-right and extends all the way to the storm summit (Figs.8b,c).
In the 31 May case, almost all of the vortex linespassing through the low-level vertical vorticity maxi-mum 19 min before tornadogenesis (2218:00–2222:00UTC) form short arches, with the vertical planes con-taining the arches being oriented from east-southeast towest-northwest, or approximately normal to the majoraxis of the echo appendage on the rear flank of thestorm (Figs. 9b,c). During the analysis period contain-ing tornadogenesis (2236:40–2244:32 UTC), almost allof the vortex lines reach the storm summit (Figs. 10b,c).The lone vortex line arch originates in the northwesternflank of the low-level mesocyclone and extends above 8km before turning back toward the ground, where itenters a broad region of anticyclonic vertical vorticityto the rear of the hook echo. The environmental vortexline displayed during this analysis period enters themidlevel updraft and mesocyclone (Fig. 10c) in a man-ner similar to that observed in the 12 May case (Fig. 2c).
Relatively limited vortex line arching appears in the8 June pretornadic analysis period (2239:42–2245:18UTC; Figs. 11b,c), which is only 7 min prior to theanalysis period (analyses are not available at earliertimes) during which tornadogenesis occurred (2246:47–2250:33 UTC; Fig. 12). The vortex line originating inthe southwestern portion of the low-level vertical vor-ticity maximum rises to an altitude of nearly 4.5 km,then turns toward the west and descends into a regionof anticyclonic vertical vorticity to the rear of the storm(Figs. 11b,c). Another vortex line during the pretor-nadic analysis period, originating in the southeasternportion of the low-level mesocyclone, turns toward thenorth-northwest and descends within the main precipi-tation core, exiting the domain approximately 3 kmAGL. During the analysis period in which tornadogen-esis occurs, almost all of the vortex lines reach thestorm summit (although these vortex lines tilt north-eastward with height), with the lone exception beingthe vortex line that originates in the southwestern por-tion of the low-level mesocyclone (Figs. 12b,c). Thisvortex line erupts vertically out of the low-level verticalvorticity maximum, then abruptly turns horizontallyand makes one and a half counterclockwise loops hav-ing a radius of roughly 1.5 km before descending to thebottom of the data domain and entering a region ofanticyclonic vertical vorticity immediately west of thecyclonic vertical vorticity maximum. The vortex line
encircled a relative maximum in the midlevel verticalvelocity field (not shown) that apparently was associ-ated with a flanking line updraft. The orientation of thehorizontal vorticity along the “looping” portion of thevortex line is consistent with the presence of a relativemaximum of buoyancy and updraft at the center of theloop. This vortex line serves as a nice example of howcomplex vortex line distributions and configurationscan be.
Regarding the tendency for arches to be more com-mon prior to tornadogenesis, as the low-level vorticityintensifies, the vortex lines passing through the vorticitymaximum ought to become more vertical, with the sum-mits of the arches extending to higher altitudes. [Strakaet al. (2007) also found that arches give way to vortexlines extending deeply and vertically as their vorticesintensified, with the prominence of the arch structuresbeing a function of time in their simulation.] Two pos-sible reasons for why arching vortex lines are less com-monly observed as tornadogenesis nears might be thatthe apexes of the arches are simply too high for us toobserve, or that by the time the arches are lifted to suchhigh altitudes, their configurations have been signifi-cantly modified by additional baroclinic effects or tur-bulence, the latter of which can cause vortex lines to besevered and reattached to other lines instantaneously aslong as there are no loose ends at any time (additionaldiscussion is provided in section 4e). Both effects pre-vent the vortex lines from behaving as material lines.Furthermore, in each case, vortex lines have beendrawn through the same 1 km � 1 km lattice of gridpoints centered on the vorticity maximum at 1 km. Ifthis region is extended to the periphery of the vortex,where vertical vorticity is not as large, additional arch-ing vortex lines are observed, even at the time of tor-nadogenesis (e.g., Fig. 13).
4. Discussion
a. Vortex line arches observed in prior supercellstudies
These are not the first observations of vortex linearches. Similar vortex line configurations have beenfound in the Dimmitt, Texas, tornadic supercell inter-cepted during VORTEX on 2 June 1995 (Straka et al.2007), in a nontornadic supercell observed by a pair ofDoppler On Wheels (Wurman et al. 1997) radars on 12June 2004 (Majcen et al. 2006), and even in the simu-lations of the 20 May 1977 Del City, Oklahoma, super-cell by Rotunno and Klemp (1985), as evidenced by thevortex line shown in their Fig. 9 (Fig. 14). [Presumablyother investigators who have simulated supercells using
SEPTEMBER 2008 M A R K O W S K I E T A L . 3525
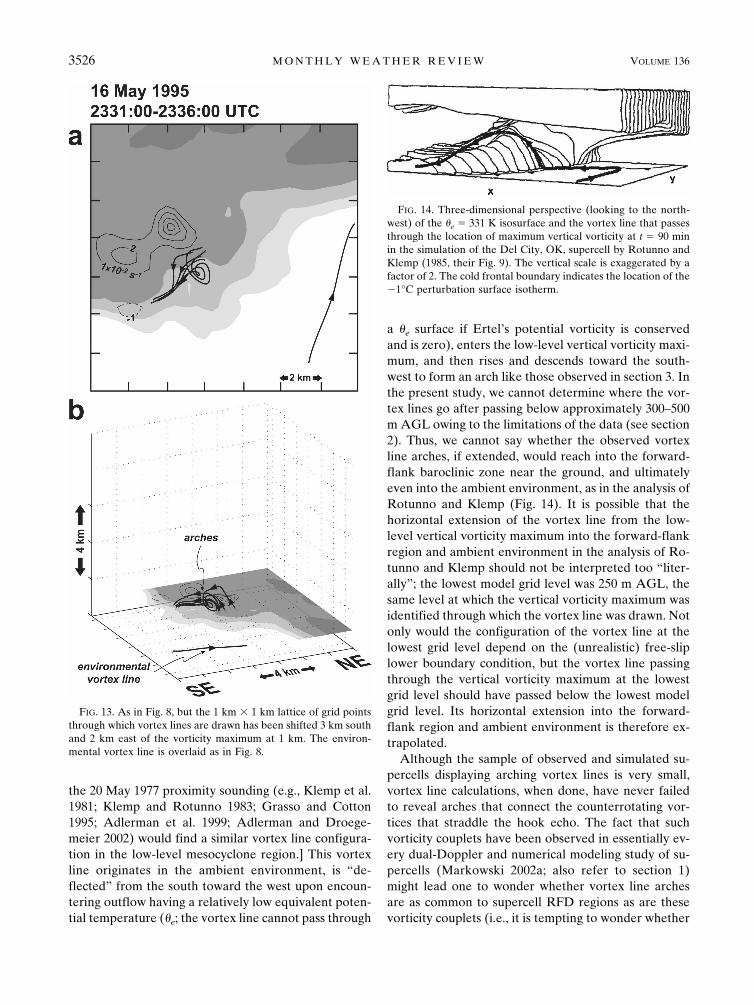
the 20 May 1977 proximity sounding (e.g., Klemp et al.1981; Klemp and Rotunno 1983; Grasso and Cotton1995; Adlerman et al. 1999; Adlerman and Droege-meier 2002) would find a similar vortex line configura-tion in the low-level mesocyclone region.] This vortexline originates in the ambient environment, is “de-flected” from the south toward the west upon encoun-tering outflow having a relatively low equivalent poten-tial temperature (�e; the vortex line cannot pass through
a �e surface if Ertel’s potential vorticity is conservedand is zero), enters the low-level vertical vorticity maxi-mum, and then rises and descends toward the south-west to form an arch like those observed in section 3. Inthe present study, we cannot determine where the vor-tex lines go after passing below approximately 300–500m AGL owing to the limitations of the data (see section2). Thus, we cannot say whether the observed vortexline arches, if extended, would reach into the forward-flank baroclinic zone near the ground, and ultimatelyeven into the ambient environment, as in the analysis ofRotunno and Klemp (Fig. 14). It is possible that thehorizontal extension of the vortex line from the low-level vertical vorticity maximum into the forward-flankregion and ambient environment in the analysis of Ro-tunno and Klemp should not be interpreted too “liter-ally”; the lowest model grid level was 250 m AGL, thesame level at which the vertical vorticity maximum wasidentified through which the vortex line was drawn. Notonly would the configuration of the vortex line at thelowest grid level depend on the (unrealistic) free-sliplower boundary condition, but the vortex line passingthrough the vertical vorticity maximum at the lowestgrid level should have passed below the lowest modelgrid level. Its horizontal extension into the forward-flank region and ambient environment is therefore ex-trapolated.
Although the sample of observed and simulated su-percells displaying arching vortex lines is very small,vortex line calculations, when done, have never failedto reveal arches that connect the counterrotating vor-tices that straddle the hook echo. The fact that suchvorticity couplets have been observed in essentially ev-ery dual-Doppler and numerical modeling study of su-percells (Markowski 2002a; also refer to section 1)might lead one to wonder whether vortex line archesare as common to supercell RFD regions as are thesevorticity couplets (i.e., it is tempting to wonder whether
FIG. 13. As in Fig. 8, but the 1 km � 1 km lattice of grid pointsthrough which vortex lines are drawn has been shifted 3 km southand 2 km east of the vorticity maximum at 1 km. The environ-mental vortex line is overlaid as in Fig. 8.
FIG. 14. Three-dimensional perspective (looking to the north-west) of the �e � 331 K isosurface and the vortex line that passesthrough the location of maximum vertical vorticity at t � 90 minin the simulation of the Del City, OK, supercell by Rotunno andKlemp (1985, their Fig. 9). The vertical scale is exaggerated by afactor of 2. The cold frontal boundary indicates the location of the�1°C perturbation surface isotherm.
3526 M O N T H L Y W E A T H E R R E V I E W VOLUME 136

vortex line arches are a ubiquitous trait of supercellthunderstorms).
b. Inferences about baroclinic vorticity generation
The vortex line arches evident in all six supercellsbear a striking resemblance to the vortex lines com-puted by Weisman and Davis (1998) in their numericalmodeling study of the formation of line-end vortices inmesoscale convective systems (Fig. 15). Weisman andDavis found that counterrotating vortices arise on op-posite ends of a finite-length convective line owing tothe lifting of vortex lines that are baroclinically gener-ated within the horizontal buoyancy gradient of thecold pool.5 It is tempting to draw the same conclusion inthe present study: baroclinic vorticity generation almostcertainly led to the development of the vortex linearches observed in the supercell low-level mesocycloneand RFD region. This conclusion is supported by anumber of observations: (i) the environmental vorticitypoints in markedly different directions (often in theexact opposite direction) compared to the orientationof the horizontal vorticity component that defines thevortex line arches emanating from the low-level verticalvorticity maxima; (ii) the horizontal vorticity compo-nent at the apexes of the arches tends to point in thesame direction as vorticity that would be baroclinically
generated by buoyancy gradients in the RFD region,assuming the buoyancy isopleths in the RFD region areapproximately parallel to the rear-flank gust front; (iii)if only the tilting of barotropic vorticity by a downdraftwere involved in the production of the observed low-level mesocyclones, vortex lines should form U shapesrather than arches. Let us expand a bit on this last pointbelow.
If the ambient, barotropic vorticity is dominated bythe horizontal component (in the limit of a horizontallyhomogeneous environment, ambient vertical vorticityis absent and vortex lines are horizontal), the tilting ofvortex lines by an updraft produces midlevel verticalvorticity (the degree to which the cyclonic vertical vor-ticity maximum is in phase with the midlevel verticalvelocity maximum depends on the degree to which theambient horizontal vorticity is streamwise, as shown inFig. 1) but no significant vertical vorticity near theground (Fig. 16a). Tilting of the ambient vorticity bythe horizontal vertical velocity gradients associatedwith an updraft alone is not effective at producing ver-tical vorticity near the ground because air is rising awayfrom the surface as horizontal vorticity is tilted into thevertical. But if a downdraft is involved in the tiltingprocess, then vertical vorticity can be advected towardthe surface as it is produced via tilting (Davies-Jonesand Brooks 1993; Grasso and Cotton 1995; Adlermanet al. 1999), yielding significant vertical vorticity next tothe ground (Fig. 16b), and perhaps even a tornado if thevorticity is further amplified by stretching. For thesereasons, as pointed out in section 1, it has been arguedthat a downdraft is needed for tornadogenesis whenpreexisting rotation is absent near the ground (Davies-Jones 1982a,b). (This conclusion depends on eddies be-ing too weak to transport vertical vorticity downwardagainst the flow. Furthermore, once a tornado is estab-lished, the tilting of surface-layer horizontal vorticity bythe extreme vertical velocity gradient associated withthe tornado updraft itself probably contributes to thenear-ground vertical vorticity in a significant way. How-ever, such abrupt upward turning of streamlines, strongpressure gradients, and large vertical velocities are notpresent next to the ground prior to tornadogenesis;thus, such tilting in the absence of a downdraft cannotbe invoked to explain the amplification of near-groundvertical vorticity that results in tornadogenesis.) If onlyambient, barotropic vorticity is involved in the afore-mentioned process, then the vortex lines that passthrough the low-level mesocyclone and connect thecounterrotating vorticity extrema that are routinely ob-served to straddle the hook echo and RFD would formU shapes, not arches [Fig. 16b; also see Fig. 5 of Weis-man and Davis (1998)]. Thus, although it is dynamically
5 Weisman and Davis (1998) also found that when environmen-tal horizontal vorticity is large, tilting of environmental vortexlines also can produce significant vertical vortices in the same waythat supercell thunderstorm updrafts acquire vertical vorticity.
FIG. 15. Vortex line structure in a numerical simulation of aquasi-linear convective system with line-end vortices, from Weis-man and Davis (1998, their Fig. 9). The vortex lines are denotedby the thick solid lines, with the direction of the vorticity vectorindicated by the arrow heads. Vectors denote the surface windflow. The surface cold pool (potential temperature perturbationsless than 1 K) is shaded.
SEPTEMBER 2008 M A R K O W S K I E T A L . 3527

possible to develop strong near-ground rotation andeven a tornado from the tilting of ambient, barotropicvorticity, as has been shown by Davies-Jones (2000a,2007) and Markowski et al. (2003),6 the observations ofvortex lines arches, if they apply generally, would indi-cate that baroclinic vorticity generation in the RFD re-gion is important in the amplification of low-level ver-tical vorticity in observed supercells.
Three-dimensional numerical simulations haveshown that baroclinic vorticity generation within theforward-flank outflow also is important in the genera-tion of low-level rotation (Klemp and Rotunno 1983;Rotunno and Klemp 1985), as reviewed in section 1;however, the orientation of the vortex line arches ob-served in the present sample of supercells, while cer-tainly not excluding the possibility of significant hori-zontal vorticity generation in the forward-flank out-flow, strongly suggest baroclinic generation in the RFDregion [refer to (ii) in the third paragraph of this sec-tion]. Forward-flank baroclinity alone cannot produce
an arch that straddles the hook echo unless the trajec-tory of an air parcel coming out of the forward-flankoutflow follows an arch itself [i.e., this trajectory wouldhave to exit the updraft to the rear (typically west orsouthwest) after rising a short distance]. In our consid-eration, this would require a rather exotic three-dimensional wind field. Forward-flank baroclinity cer-tainly could extend the “foot” of the cyclonic “leg” of avortex line arch into the forward-flank baroclinic zonealong the ground, but we cannot envision how a vortexline arch that straddles the hook echo could result fromanything other than the lifting of baroclinic vortex linesthat originate in the RFD outflow. The reader also isreferred back to Fig. 3, for example, which shows vortexlines upstream of the arches. The vortex lines, one ofwhich nearly forms a closed loop around a relativedowndraft maximum, are suggestive of baroclinic vor-ticity generation in the RFD/hook echo region.
The idea that baroclinic vorticity generation in theRFD/hook echo region is important to the develop-ment of near-ground rotation in supercells has beenadvanced by Davies-Jones and Brooks (1993), Davies-Jones (1996, 2000b), Adlerman et al. (1999), andDavies-Jones et al. (2001). More recently, Davies-Jones(2006), in agreement with numerical simulations byStraka et al. (2007), demonstrated how a relative mini-mum in the buoyancy field, like that observed within
6 Baroclinic vorticity was present in the Davies-Jones (2000a,2007) and Markowski et al. (2003) simulations, but only barotro-pic vorticity contributed to the tornadoes in these simulations.The baroclinic vorticity could not be converted to vertical vortic-ity via tilting owing to the axisymmetry used in these idealizedsimulations.
FIG. 16. (a) Tilting of ambient (barotropic) horizontal vorticity by an updraft producesmidlevel vertical vorticity. In the above case, the ambient horizontal vorticity has a significantstreamwise component so that the midlevel vertical vorticity maximum lies within the updraft.Vertical vorticity cannot arise next to the ground because air is rising away from the groundas vertical vorticity is being generated by the tilting effect. (b) If a downdraft develops, verticalvorticity can be advected toward the surface as it is produced via tilting, resulting in significantvertical vorticity next to the ground. If baroclinity is absent (and turbulent diffusion is ne-glected), vortex lines are frozen in the fluid and are redistributed by the downdraft as materiallines. In this case, the vortex line passing through the low-level vertical vorticity maximumtakes a U shape rather than an arch. A couplet of counterrotating vortices straddles thedowndraft maximum. Of course, the very presence of a downdraft implies that at least somesolenoidal effects are unavoidable, even if the downdraft is driven solely by dynamic pressureperturbations. Just as the presence of a warm isentropic peak in Fig. 1 actually diverts vortexlines toward the right as the lines are lifted by the peak (refer to the Fig. 1 caption), vortexlines would actually be diverted toward the left (i.e., in the opposite direction) in the caseabove. This is not easily shown in the figure above, nor does it dramatically alter the mainresult, which is a U-shaped vortex line at low levels.
3528 M O N T H L Y W E A T H E R R E V I E W VOLUME 136

the RFD/hook echo region of a supercell, producesbaroclinic vortex rings that descend to the ground (Figs.17a,b) and, if they interact with a nearby updraft, theleading edges of the rings subsequently can be liftedsuch that the vortex lines form arches (Fig. 17c). Thevortex line arches that arise from this baroclinic processare similar to those found in the supercells we haveobserved, which lends much credence to the aforemen-tioned hypothesis for the role of RFD/hook echo baro-clinity in the generation of near-ground rotation in su-percells. In some ways, these ideas are similar to one ofFujita’s (1985) microburst conceptual models (Fig. 18),but in Fujita’s model, the vortex rings spread out at theground and do not interact with a localized updraft suchthat the leading edges of the vortex rings are lifted toproduce a vorticity couplet.
c. Relationship between midlevel mesocyclones andlow-level mesocyclones
A generalized depiction of vortex lines in the vicinityof a low-level mesocyclone is shown in Fig. 19. Theportrayal has been inferred from the sample of super-cells surveyed herein (Figs. 2–12, particularly Fig. 3,which displays vortex lines upstream of the vortex linearches that emanate from the low-level vertical vortic-ity maximum), and is superimposed on a photograph ofa generic supercell thunderstorm in order to facilitatevisualization. The portrayal also conforms to the obser-vational and numerical modeling findings of Straka etal. (2007). Although the descending, baroclinically gen-erated vortex lines shown in Fig. 19 are drawn as closed
loops, as if encircling a local buoyancy minimum in theRFD (e.g., Fig. 17), the arching process does not de-pend on the vortex lines forming closed loops. The re-sults would be qualitatively similar in the case of abuoyancy minimum in the hook echo/RFD that wasconterminous with the negative buoyancy and down-draft in the forward reaches of the storm, such that thevortex lines that ultimately formed arches were notclosed loops on their rear sides, but rather extended farinto the precipitation region and out of the photograph.
We take the opportunity here to discuss what occa-sionally has been, in our experience, a confusing ormisunderstood relationship between the low-level andmidlevel mesocyclone. We prefer to avoid rigid distinc-tions between the two if at all possible. We believe the
FIG. 18. Fujita’s (1985) conceptual model of a microburst andan attendant vortex ring.
FIG. 17. One possible way by which a couplet of vertical vorticity can be produced by a purely baroclinic process in an environmentcontaining no ambient vorticity (neither vertical nor horizontal). (a) Baroclinically generated vortex rings encircle a buoyancy minimumthat extends throughout a vertical column (such a region of negative buoyancy might be found in the hook echo/RFD region of asupercell, for example); the presence of negative buoyancy causes the rings to sink toward the ground as they are generated. (b) If thevortex rings are swept forward as they descend toward the ground owing to the additional presence of rear-to-front flow through thebuoyancy minimum, the vortex rings become tilted upward on their downstream sides (a vertical velocity gradient is present within thecolumn because buoyancy is a minimum in the center of the column and increases with increasing distance from the center of thecolumn). (c) If the leading edge of the vortex rings can be lifted by an updraft in close proximity to the buoyancy minimum (an updraftis typically found in close proximity to the hook echo/RFD region of a supercell, for example), then the vortex rings can be tilted furtherand stretched upward, leading to arching vortex lines and a couplet of cyclonic (“C”) and anticyclonic (“A”) vertical vorticity thatstraddles the buoyancy minimum and associated downdraft. Note the similarity to Fig. 15. (Adapted from Straka et al. 2007.)
SEPTEMBER 2008 M A R K O W S K I E T A L . 3529

more meaningful distinction in the generation of verti-cal vorticity is between the tilting of horizontal vorticitythat involves only an updraft versus tilting that involvesboth an updraft and a downdraft. When only an updraftis involved in the tilting of horizontal vorticity (whetherit be environmental horizontal vorticity or storm-generated horizontal vorticity, e.g., that which might begenerated in the forward-flank region), air is rising astilting produces vertical vorticity (the vertical advectionof vertical vorticity has the opposite sign of the tilting),as discussed in section 4b. Significant vertical vorticitycan be generated above the ground, but not at theground. Even a low-level mesocyclone, if one defines“low-level” nominally as 500–1000 m AGL, could arise
from the tilting of environmental horizontal vorticity ifthe horizontal vorticity is very large and the updraftvery strong. On the other hand, if a downdraft is in-volved in the tilting process, air can be sinking towardthe ground while tilting is producing vertical vorticity(section 4b). Thus, significant vertical vorticity can beachieved at the ground.
Summarizing, in the early stages of a supercell’s life,vertical vorticity in the mesocyclone comes from thetilting of environmental horizontal vorticity (the“midlevel” versus “low-level” distinction is somewhatarbitrary—the altitude at which “significant” verticalvorticity appears decreases as the environmental hori-zontal vorticity increases and is subjective anyway). In
FIG. 19. Idealized evolution of vortex rings and arches inferred from the sample of supercellssurveyed herein, superimposed on a photograph of a supercell thunderstorm (courtesy of JimMarquis; view is from the south). The numerals 1–4 can indicate either a single vortex line seenat four different times in a sequence, or four different vortex lines at a single time but indifferent stages of evolution. An environmental vortex line also is shown to illustrate, sche-matically, the relationship between the midlevel and low-level mesocyclone. None of thevortex lines have been derived from an actual three-dimensional wind synthesis of the stormappearing in the photograph; the vortex lines simply have been drawn atop a photo of asupercell thunderstorm (one that could easily represent a number of generic supercell thun-derstorms) by compositing vortex lines computed from actual three-dimensional wind syn-theses in the sample of supercells herein. The evolution also conforms with the evolutionfound in the Straka et al. (2007) idealized numerical simulations. Although the descending,baroclinically generated vortex lines shown above are drawn as closed loops, as if encirclinga local buoyancy minimum in the RFD, the arching process does not depend on the vortexlines forming closed loops. The results would be qualitatively similar in the case of a buoyancyminimum in the hook echo/RFD that was conterminous with the negative buoyancy anddowndraft in the forward reaches of the storm, such that the vortex lines that ultimatelyformed arches were not closed loops on their rear sides, but rather extended far into theprecipitation region and out of the photograph.
3530 M O N T H L Y W E A T H E R R E V I E W VOLUME 136
Fig 19 live 4/C

later stages, once storm-scale buoyancy gradients ariseat low levels but before significant vertical vorticity ispresent at the ground, the vertical vorticity in themidlevel mesocyclone as well as low-level mesocyclonelikely comes from tilting of the ambient environmentalhorizontal vorticity as well as additional horizontal vor-ticity that might be generated baroclinically by way ofstorm-scale buoyancy gradients. Once a mature super-cell is established, with significant rotation extending allthe way to the surface (and downdrafts necessarily hav-ing played a critical role in arriving at this state), thevertical vorticity in the midlevel mesocyclone as well aslow-level mesocyclone comes from both the ambientenvironment as well as from near the ground via verti-cal advection. Some of the vortex lines traced backwardfrom the midlevel vertical vorticity maximum extendhorizontally into the ambient environment and othersextend vertically through the vertical vorticity maxi-mum at the lowest data level. Some of the vortex linestraced forward from the midlevel vertical vorticitymaximum extend to the storm summit and others formarches that bend back toward the trailing part of thehook echo where anticyclonic vertical vorticity ispresent. Notice that the illustration in Fig. 19 depicts amidlevel mesocyclone that contains a vortex line thatextends into the ambient environment as well as onethat forms an arch.
d. Paradoxical observations of weak cold pools intornadic supercells
What we believe to be one of the outstanding mys-teries is why, if baroclinic generation of vorticity in theRFD region is as important as the vortex line analysesseem to suggest, there is so much growing evidencefrom field observations that strong cold pools and ex-cessive negative buoyancy at the surface are detrimen-tal to tornadogenesis (Markowski 2002b; Markowski etal. 2002; Shabbott and Markowski 2006; Grzych et al.2007). For example, the 8 June 1995 tornadic supercellstudied herein has been shown to have possessed onlyvery small (2 K) temperature deficits at the surface(Dowell and Bluestein 2002a; Markowski et al. 2002).Moreover, climatological studies (Rasmussen andBlanchard 1998; Thompson et al. 2003) show that tor-nadic supercells are favored in environments having alarge boundary layer relative humidity, which wouldtend to limit the production of exceptionally cold out-flow and associated baroclinity. [Of course, cold out-flow can be produced by the entrainment of potentiallycold midlevel environmental air, independent of theboundary layer relative humidity. Moreover, the melt-ing of ice is enhanced in humid conditions. However,these effects do not appear to completely mask the con-
tribution to outflow strength from the evaporation ofrain within the boundary layer, as evidenced by signif-icant correlations between observed cold pool strengthand environmental boundary layer relative humidity(Markowski et al. 2002; Shabbott and Markowski2006).] We are not in a position to answer this questionat this point, but perhaps supercell baroclinity is an-other “Goldilocks” problem whereby at least somebaroclinity is crucial (all thunderstorms have at leastsome baroclinity, as discussed in section 1), but toomuch, especially near the ground, is detrimental in thatlarge near-ground baroclinity would imply very cold airnear the ground and thus rapid gust front motion rela-tive to the main updraft, which might undercut it(Brooks et al. 1993) or inhibit the vorticity stretchingrequired by tornadogenesis (Leslie and Smith 1978;Markowski et al. 2003). In terms of Fig. 17, if the down-draft air containing the vortex rings is too negativelybuoyant, then perhaps the end result is something re-sembling Fujita’s microburst model (Fig. 18) ratherthan significant lifting of the leading edge of the vortexrings to produce vertical vorticity (Fig. 17c). It goeswithout saying that thermodynamic observations abovethe ground would be invaluable in trying to assess theoverall importance of baroclinic vorticity generationwithin supercell thunderstorms. We currently lack athree-dimensional, let alone four-dimensional, concep-tual model of the range of thermodynamic characteris-tics in supercell thunderstorms and how these wouldimpact vorticity generation and reorientation in waysthat might be important for tornadogenesis.
e. Effects of turbulence on the vortex lines
Finally, a few comments regarding the effects of tur-bulence on the vortex lines are warranted. Althoughthe effects of subgrid-scale turbulence on supercell dy-namics are of secondary importance (if they were not,numerical simulations would be very sensitive to theturbulence parameterization), turbulence can have animportant effect on the vortex lines. As described byMorton (1984), cross-diffusion of vorticity allows “sur-gery” of vortex lines (see his Figs. 10i, iii). Lines can besevered and reattached to other lines instantaneously aslong as there are no loose ends at any time (� • � � 0).Although Morton is dealing with viscous diffusion, asimilar process can occur with subgrid-scale turbulence.We cannot observe what is happening locally with thevortex lines at the unresolved scales, thus when twooppositely directed lines come very close together, thesurgery may be performed on our “smooth lines.” Thelikelihood of cross-diffusion of vortex lines altering oursimple concept of their configuration increases withtime after the rings of baroclinic vorticity are gener-
SEPTEMBER 2008 M A R K O W S K I E T A L . 3531

ated; as time increases, there is a greater likelihood forhaving a lifted arching vortex line find itself in closeproximity to midlevel vortex lines that might have adifferent orientation. This effect might partly contrib-ute to the greater tendency to observe prominentarches early in the tornadogenesis process.
5. Summary and conclusions
Pseudo-dual-Doppler radar observations were usedto construct vortex lines within the low-level mesocy-clone regions of six supercells (three nontornadic, threetornadic) near the time of maximum low-level rotation.The main findings and conclusions are summarized asfollows:
1) Some vortex lines originating in the low-level verti-cal vorticity maximum extended to the storm sum-mit, whereas others formed arches that connectedthe vertical vorticity maximum to the commonly ob-served region of anticyclonic vertical vorticity on theopposite flank of the hook echo of the supercell.
2) At least some vortex line arches emanate from thelow-level mesocyclone in every case at every analy-sis time; vortex line arches are a robust trait of thesample of supercells studied herein.
3) The arching of the vortex lines and the orientationof the vorticity vector along the vortex line arches,compared to the orientation of the ambient (baro-tropic) vorticity, are strongly suggestive of baro-clinic vorticity generation within the hook echo andassociated rear-flank downdraft region of the super-cells, and subsequent lifting of the baroclinically al-tered vortex lines by an updraft, rather than ambientvortex lines alone being tilted by either an updraftor downdraft to produce a low-level vertical vortic-ity maximum.7
Although the tornadogenesis problem is horriblynonlinear and is complicated by the presence of bothbarotropic and baroclinic vorticity, each likely varyingsignificantly from case to case in terms of orientation,
magnitude, distribution, etc., we believe that vortex lineanalysis can provide a beneficial perspective. We ea-gerly await future analyses in order to evaluate whetherthe findings of the present study extend to a largersample of supercells. We also believe that a priority offuture field experiments should be the collection ofthermodynamic observations above the ground (per-haps even extending several kilometers above the sur-face) to better characterize the three-dimensionalbuoyancy field, given the apparent importance of baro-clinic processes despite the general lack of strong coldpools beneath the most prolific tornadic storms. Finally,it also is interesting to ponder whether the dynamicsshown by Davies-Jones (1996) and Weisman and Davis(1998) to lead to mesoscale vortices in larger-scale con-vective systems operate on a wide range of scales; thatis, is it possible that the same fundamental dynamicalprocess (baroclinic vortex lines generated in a cooldowndraft and subsequently lifted by an updraft) canproduce vortices that range in size and intensity frombookend vortices to near-ground mesocyclones to tor-nadoes?
Acknowledgments. We are grateful to Drs. DavidDowell, Hanne Murphey, and Roger Wakimoto forproviding edited ELDORA data for the 12 May 1995,16 May 1995, 31 May 1995, and 8 June 1995 cases. Wethank the three anonymous reviewers for their sugges-tions for improving the paper. Support from the Na-tional Science Foundation (Grants ATM-9617318,ATM-0003689, ATM-0338661, ATM-0340693, ATM-0437512, and ATM-0644533) also is acknowledged.
APPENDIX
Sensitivity of Vortex Lines to Smoothing andGrid Parameters
The sensitivity of the vortex line configurations to thesmoothing and grid parameters was explored exten-sively. Figure A1 presents some examples, whereby theBarnes smoothing parameter � was doubled (to 1.22km2), the horizontal grid spacing was doubled (to 800m), and vorticity components were left unsmoothedprior to vortex line calculations (i.e., a one-step Leisefilter was not applied to the vorticity components afterderiving them from the three-dimensional wind re-trieval). Not surprisingly, the finescale structure of thevortex lines is fairly sensitive to the smoothing and gridspacing; however, the qualitative characteristics of thevortex lines (e.g., whether vortex lines form loops orarches) are fairly robust.
7 Environmental vortex lines might be tilted abruptly by therear-flank gust front to produce significant low-level vertical vor-ticity along a fairly long corridor extending (typically southward,in the Northern Hemisphere in the case of a cyclonically rotatingsupercell) far from the low-level mesocyclone center. Our conclu-sion refers to the vortex lines that pass through or near to thecenter of the low-level vertical vorticity maximum found at ornear the low-level mesocyclone center, rather than the environ-mental vortex lines that are lifted by the trailing gust front toproduce a relative maximum in vertical vorticity along a signifi-cant length of the trailing gust front.
3532 M O N T H L Y W E A T H E R R E V I E W VOLUME 136

REFERENCES
Adlerman, E. J., and K. K. Droegemeier, 2002: The sensitivity ofnumerically simulated cyclic mesocyclogenesis to variationsin model physical and computational parameters. Mon. Wea.Rev., 130, 2671–2691.
——, ——, and R. Davies-Jones, 1999: A numerical simulation ofcyclic mesocyclogenesis. J. Atmos. Sci., 56, 2045–2069.
Barnes, S. L., 1964: A technique for maximizing details in numeri-cal weather map analysis. J. Appl. Meteor., 3, 396–409.
Beck, J. R., J. L. Schroeder, and J. M. Wurman, 2006: High-resolution dual-Doppler analyses of the 29 May 2001 Kress,Texas, cyclic supercell. Mon. Wea. Rev., 134, 3125–3148.
Bluestein, H. B., and S. G. Gaddy, 2001: Airborne pseudo-dual-Doppler analysis of a rear-inflow jet and deep convergencezone within a supercell. Mon. Wea. Rev., 129, 2270–2289.
Brooks, H. E., C. A. Doswell III, and R. P. Davies-Jones, 1993:Environmental helicity and the maintenance and evolution of
low-level mesocyclones. The Tornado: Its Structure, Dynam-ics, Prediction, and Hazards, Geophys. Monogr., Vol. 79,Amer. Geophys. Union, 97–104.
Cai, H., and R. M. Wakimoto, 2001: Retrieved pressure field andits influence on the propagation of a supercell thunderstorm.Mon. Wea. Rev., 129, 2695–2713.
Chorin, A. J., 1996: Vortex methods. Computational Fluid Dy-namics, M. Lesiuer et al., Eds., Elsevier, 67–108.
Davies-Jones, R. P., 1982a: A new look at the vorticity equationwith application to tornadogenesis. Preprints, 12th Conf. onSevere Local Storms, San Antonio, TX, Amer. Meteor. Soc.,249–252.
——, 1982b: Observational and theoretical aspects of tornadogen-esis. Intense Atmospheric Vortices, L. Bengtsson and J. Light-hill, Eds., Springer-Verlag, 175–189.
——, 1984: Streamwise vorticity: The origin of updraft rotation insupercell storms. J. Atmos. Sci., 41, 2991–3006.
——, 1996: Formulas for the barotropic and baroclinic compo-
FIG. A1. Three-dimensional perspective of vortex lines at 0034:39–0041:15 UTC 13 May1995 for a variety of smoothing and grid parameters. Equivalent radar reflectivity factor(dBZe; shaded) and vertical vorticity contours (10�2 s�1 contour interval; the zero contouris suppressed and negative contours are dashed) at 1.0 km AGL also are plotted: (a) � � 0.61km2, 400-m horizontal grid spacing, vorticity components smoothed with one-step Leise filter(as in Fig. 2c); (b) � � 0.61 km2, 400-m horizontal grid spacing, vorticity components receivedno additional smoothing prior to vortex line calculations; (c) � � 0.61 km2, 800-m horizontalgrid spacing, vorticity components smoothed with one-step Leise filter; (d) � � 1.22 km2,400-m horizontal grid spacing, vorticity components smoothed with one-step Leise filter.
SEPTEMBER 2008 M A R K O W S K I E T A L . 3533

nents of vorticity with applications to vortex formation nearthe ground. Preprints, Seventh Conf. on Mesoscale Processes,Reading, United Kingdom, Amer. Meteor. Soc., 14–16.
——, 2000a: Can the hook echo instigate tornadogenesis barotro-pically? Preprints, 20th Conf. on Severe Local Storms, Or-lando, FL, Amer. Meteor. Soc., 269–272.
——, 2000b: A Lagrangian model for baroclinic genesis of meso-scale vortices. Part I: Theory. J. Atmos. Sci., 57, 715–736.
——, 2006: Tornadogenesis in supercell storms: What we knowand what we don’t know. Preprints, Symp. on the Challengesof Severe Convective Storms, Atlanta, GA, Amer. Meteor.Soc., 2.2. [Available online at http://ams.confex.com/ams/pdfpapers/104563.pdf.]
——, 2008: Can a descending rain curtain in a supercell instigatetornadogenesis barotropically? J. Atmos. Sci., 65, 2469–2497.
——, and H. E. Brooks, 1993: Mesocyclogenesis from a theoreti-cal perspective. The Tornado: Its Structure, Dynamics, Pre-diction, and Hazards, Geophys. Monogr., Vol. 79, Amer.Geophys. Union, 105–114.
——, R. J. Trapp, and H. B. Bluestein, 2001: Tornadoes and tor-nadic storms. Severe Convective Storms, Meteor. Monogr.,No. 28, Amer. Meteor. Soc., 126–221.
Dowell, D. C., and H. B. Bluestein, 2002a: The 8 June 1995McLean, Texas, storm. Part I: Observations of cyclic torna-dogenesis. Mon. Wea. Rev., 130, 2626–2648.
——, and ——, 2002b: The 8 June 1995 McLean, Texas, storm.Part II: Cyclic tornado formation, maintenance, and dissipa-tion. Mon. Wea. Rev., 130, 2649–2670.
Dutton, J. A., 1986: Dynamics of Atmospheric Motion. Dover, 640pp.
Frame, J., P. Markowski, Y. Richardson, J. Straka, and J. Wur-man, 2008: Polarimetric and dual-Doppler radar observationsof the Lipscomb County, Texas, supercell thunderstorm on23 May 2002. Mon. Wea. Rev., in press.
Fujita, T. T., 1985: The downburst. Satellite and Mesometeorol-ogy Research Project, University of Chicago, 122 pp.
Gal-Chen, T., 1982: Errors in fixed and moving frames of refer-ence: Applications for conventional and Doppler radaranalysis. J. Atmos. Sci., 39, 2279–2300.
Gamache, J. F., 1997: Evaluation of a fully three-dimensional varia-tional Doppler analysis technique. Preprints, 28th Conf. on Ra-dar Meteorology, Austin, TX, Amer. Meteor. Soc., 422–423.
Gao, J., M. Xue, A. Shapiro, and K. K. Droegemeier, 1999: Avariational method for the analysis of three-dimensional windfields from two Doppler radars. Mon. Wea. Rev., 127, 2128–2142.
Grasso, L. D., and W. R. Cotton, 1995: Numerical simulation of atornado vortex. J. Atmos. Sci., 52, 1192–1203.
Grzych, M. L., B. D. Lee, and C. A. Finley, 2007: Thermodynamicanalysis of supercell rear-flank downdrafts from ProjectANSWERS. Mon. Wea. Rev., 135, 240–246.
Hildebrand, P. H., and C. K. Mueller, 1985: Evaluation of meteo-rological airborne Doppler radar. Part I: Dual-Doppler analysesof air motions. J. Atmos. Oceanic Technol., 2, 362–380.
——, C. A. Walther, C. L. Frush, J. Testud, and F. Baudin, 1994:The ELDORA/ASTRAIA airborne Doppler weather radar:Goals, design, and first field tests. Proc. IEEE, 82, 1873–1890.
Jorgensen, D. P., P. H. Hildebrand, and C. L. Frush, 1983: Feasi-bility test of an airborne pulse-Doppler meteorological radar.J. Appl. Meteor., 22, 744–757.
Klemp, J. B., and R. Rotunno, 1983: A study of the tornadic re-gion within a supercell thunderstorm. J. Atmos. Sci., 40, 359–377.
——, R. B. Wilhelmson, and P. S. Ray, 1981: Observed and nu-merically simulated structure of a mature supercell thunder-storm. J. Atmos. Sci., 38, 1558–1580.
Koch, S. E., M. DesJardins, and P. J. Kocin, 1983: An interactiveBarnes objective map analysis scheme for use with satelliteand conventional data. J. Climate Appl. Meteor., 22, 1487–1503.
Kundu, P. K., 1990: Fluid Mechanics. Academic Press, 638 pp.Leise, J. A., 1982: A multidimensional scale-telescoped filter and
data extension package. NOAA Tech. Memo. ERL WPL-82,19 pp. [Available from NOAA Office of Oceanic and Atmo-spheric Research, Silver Spring Metro Center, Bldg 3, Room11627, Silver Spring, MD 20910.]
Lemon, L. R., and C. A. Doswell, 1979: Severe thunderstorm evo-lution and mesocyclone structure as related to tornadogen-esis. Mon. Wea. Rev., 107, 1184–1197.
Leslie, L. M., and R. K. Smith, 1978: The effect of vertical stabilityon tornadogenesis. J. Atmos. Sci., 35, 1281–1288.
Lugt, H. J., 1996: Introduction to Vortex Theory. Vortex FlowPress, 627 pp.
Majcen, M., P. Markowski, Y. Richardson, and J. Wurman, 2006:A dual-Doppler analysis of a nontornadic supercell observedon 12 June 2004 using ground-based Doppler radars. Pre-prints, 23rd Conf. on Severe Local Storms, St. Louis, MO,Amer. Meteor. Soc., 15.2. [Available online at http://ams.confex.com/ams/pdfpapers/115382.pdf.]
Markowski, P. M., 2002a: Hook echoes and rear-flank down-drafts: A review. Mon. Wea. Rev., 130, 852–876.
——, 2002b: Mobile mesonet observations on 3 May 1999. Wea.Forecasting, 17, 430–444.
——, J. M. Straka, and E. N. Rasmussen, 2002: Direct surfacethermodynamic observations within the rear-flank down-drafts of nontornadic and tornadic supercells. Mon. Wea.Rev., 130, 1692–1721.
——, ——, and ——, 2003: Tornadogenesis resulting from thetransport of circulation by a downdraft: Idealized numericalsimulations. J. Atmos. Sci., 60, 795–823.
Morton, B. R., 1984: The generation and decay of vorticity. Geo-phys. Astrophys. Fluid Dyn., 28, 277–308.
Nolan, D. S., 2004: Vortex sheets, vortex rings, and a mesocy-clone. Preprints, 22nd Conf. on Severe Local Storms, Hyan-nis, MA, Amer. Meteor. Soc., 14.1. [Available online athttp://ams.confex.com/ams/pdfpapers/81516.pdf.]
Pauley, P. M., and X. Wu, 1990: The theoretical, discrete, andactual response of the Barnes objective analysis scheme forone- and two-dimensional fields. Mon. Wea. Rev., 118, 1145–1164.
Pedlosky, J., 1987: Geophysical Fluid Dynamics. Springer, 710 pp.Rasmussen, E. N., and D. O. Blanchard, 1998: A baseline clima-
tology of sounding-derived supercell and tornado forecastparameters. Wea. Forecasting, 13, 1148–1164.
——, J. M. Straka, R. P. Davies-Jones, C. A. Doswell, F. H. Carr,M. D. Eilts, and D. R. MacGorman, 1994: Verification of theorigins of rotation in tornadoes experiment: VORTEX. Bull.Amer. Meteor. Soc., 75, 995–1006.
Ray, P. S., and M. Stephenson, 1990: Assessment of the geometricand temporal errors associated with airborne Doppler radarmeasurements of a convective storm. J. Atmos. Oceanic Tech-nol., 7, 206–217.
Rotunno, R., 1993: Supercell thunderstorm modeling and theory.The Tornado: Its Structure, Dynamics, Prediction, and Haz-ards, Geophys. Monogr., Vol. 79, Amer. Geophys. Union,143–159.
3534 M O N T H L Y W E A T H E R R E V I E W VOLUME 136

——, and J. B. Klemp, 1985: On the rotation and propagation ofsimulated supercell thunderstorms. J. Atmos. Sci., 42, 271–292.
Shabbott, C. J., and P. M. Markowski, 2006: Surface in situ obser-vations within the outflow of forward-flank down drafts ofsupercell thunderstorms. Mon. Wea. Rev., 134, 1422–1441.
Straka, J. M., E. N. Rasmussen, R. P. Davies-Jones, and P. M.Markowski, 2007: An observational and idealized numericalexamination of low-level counter-rotating vortices toward therear flank of supercells. Electron. J. Severe Storms Meteor., 2,1–22.
Thompson, R. L., R. Edwards, J. A. Hart, K. L. Elmore, and P. M.Markowski, 2003: Close proximity soundings within supercellenvironments obtained from the rapid update cycle. Wea.Forecasting, 18, 1243–1261.
Trapp, R. J., 1999: Observations of nontornadic low-level meso-cyclones and attendant tornadogenesis failure duringVORTEX. Mon. Wea. Rev., 127, 1693–1705.
——, and C. A. Doswell, 2000: Radar data objective analysis. J.Atmos. Oceanic Technol., 17, 105–120.
Wakimoto, R. M., and C. Liu, 1998: The Garden City, Kansas,storm during VORTEX 95. Part II: The wall cloud and tor-nado. Mon. Wea. Rev., 126, 393–408.
——, and H. Cai, 2000: Analysis of a nontornadic storm duringVORTEX 95. Mon. Wea. Rev., 128, 565–592.
——, C. Liu, and H. Cai, 1998: The Garden City, Kansas, stormduring VORTEX 95. Part I: Overview of the storm life cycleand mesocyclogenesis. Mon. Wea. Rev., 126, 372–392.
——, H. V. Murphey, D. C. Dowell, and H. B. Bluestein, 2003:The Kellerville Tornado during VORTEX: Damage surveyand Doppler radar analyses. Mon. Wea. Rev., 131, 2197–2221.
——, ——, and H. Cai, 2004: The San Angelo, Texas, supercell of31 May 1995: Visual observations and tornadogenesis. Mon.Wea. Rev., 132, 1269–1293.
Walko, R. L., 1993: Tornado spin-up beneath a convective cell:Required basic structure of the near-field boundary layerwinds. The Tornado: Its Structure, Dynamics, Prediction, andHazards, Geophys. Monogr., Vol. 79, Amer. Geophys.Union, 89–95.
Weisman, M. L., and C. A. Davis, 1998: Mechanisms for the gen-eration of mesoscale vortices within quasi-linear convectivesystems. J. Atmos. Sci., 55, 2603–2622.
Wicker, L. J., and R. B. Wilhelmson, 1995: Simulation and analy-sis of tornado development and decay within a three-dimensional supercell thunderstorm. J. Atmos. Sci., 52, 2675–2703.
Wurman, J., J. Straka, E. Rasmussen, M. Randall, and A. Zahrai,1997: Design and deployment of a portable, pencil-beam,pulsed, 3-cm Doppler radar. J. Atmos. Oceanic Technol., 14,1502–1512.
SEPTEMBER 2008 M A R K O W S K I E T A L . 3535