Volunteer recruitment and retention in online citizen ... · science projects using marketing...
29
Volunteer recruitment and retention in online citizen science projects using marketing strategies: lessons from Season Spotter Alycia Crall, Margaret Kosmala, Rebecca Cheng, Jonathan Brier, Darlene Cavalier, Sandra Henderson and Andrew D. Richardson Citizen science continues to grow, potentially increasing competition among projects to recruit and retain volunteers interested in participating. Using web analytics, we examined the ability of a marketing campaign to broaden project awareness, while driving engagement and retention in an online, crowdsourced project. The campaign challenged audiences to support the classification of >9,000 pairs of images. The campaign was successful due to increased engagement, but it did not increase the time participants spent classifying images. Engagement over multiple days was significantly shorter during the campaign. We provide lessons learned to improve targeted recruitment and retention of participants in online projects. Abstract Citizen science; Public engagement with science and technology Keywords Introduction The number of citizen science projects has grown significantly in the past two decades, emerging as a valuable resource for conducting research across a variety of fields [Kullenberg and Kasperowski, 2016]. Public engagement in these projects can range from spending less than a minute classifying an image online to engaging in multiple steps of the scientific process (e.g., asking questions, collecting data, analyzing data, disseminating findings; Bonney et al. [2009b]). As citizen science continues to grow, there may be growing demand for participation resulting in increased competition among projects to recruit and retain those interested in engaging in the activities associated with these projects [Sauermann and Franzoni, 2015]. Researchers have begun examining participant motivations in an effort to determine best practices for recruiting and retaining volunteers. These studies reveal a range of intrinsic and extrinsic motivators and demonstrate great diversity in what drives participation. Projects requiring data collection in the field have shown volunteers motivated by environmental conservation and social interaction with like-minded individuals [Bradford and Israel, 2004; Crall et al., 2013; Wright et al., 2015], whereas contributing to science and interest in science emerge as Article Journal of Science Communication 16(01)(2017)A01 1
Transcript of Volunteer recruitment and retention in online citizen ... · science projects using marketing...
Volunteer recruitment and retention in online citizenscience projects using marketing strategies: lessons fromSeason Spotter
Alycia Crall, Margaret Kosmala, Rebecca Cheng, Jonathan Brier,Darlene Cavalier, Sandra Henderson and Andrew D. Richardson
Citizen science continues to grow, potentially increasing competitionamong projects to recruit and retain volunteers interested in participating.Using web analytics, we examined the ability of a marketing campaign tobroaden project awareness, while driving engagement and retention in anonline, crowdsourced project. The campaign challenged audiences tosupport the classification of >9,000 pairs of images. The campaign wassuccessful due to increased engagement, but it did not increase the timeparticipants spent classifying images. Engagement over multiple days wassignificantly shorter during the campaign. We provide lessons learned toimprove targeted recruitment and retention of participants in onlineprojects.
Abstract
Citizen science; Public engagement with science and technologyKeywords
Introduction The number of citizen science projects has grown significantly in the past twodecades, emerging as a valuable resource for conducting research across a varietyof fields [Kullenberg and Kasperowski, 2016]. Public engagement in these projectscan range from spending less than a minute classifying an image online toengaging in multiple steps of the scientific process (e.g., asking questions,collecting data, analyzing data, disseminating findings; Bonney et al. [2009b]). Ascitizen science continues to grow, there may be growing demand for participationresulting in increased competition among projects to recruit and retain thoseinterested in engaging in the activities associated with these projects [Sauermannand Franzoni, 2015].
Researchers have begun examining participant motivations in an effort todetermine best practices for recruiting and retaining volunteers. These studiesreveal a range of intrinsic and extrinsic motivators and demonstrate great diversityin what drives participation. Projects requiring data collection in the field haveshown volunteers motivated by environmental conservation and social interactionwith like-minded individuals [Bradford and Israel, 2004; Crall et al., 2013; Wrightet al., 2015], whereas contributing to science and interest in science emerge as
Article Journal of Science Communication 16(01)(2017)A01 1
primary motivators in online environments [Raddick et al., 2010; Cox et al., 2015b;Curtis, 2015; Land-Zandstra et al., 2015].
Online and crowdsourced citizen science projects, those requiring data collection ordata processing tasks to be distributed across the crowd, represent a type of citizenscience that appeals to many motivations [Cox et al., 2015b]. These projects spandiverse fields, including astronomy, archaeology, neurology, climatology, physics,and environmental science and exhibit a great deal of heterogeneity in their design,implementation, and level of participant engagement [Franzoni and Sauermann,2014]. They can support volunteers interested in only making minimumcontributions at one point in time, which might be more appealing than projectsrequiring leaving one’s home, a long-term commitment, or financial obligations[Jochum and Paylor, 2013]. Opportunities for limited engagement may facilitaterecruitment of new volunteers interesting in contributing to a worthy cause whilepotentially finding participants motivated to stay with a project long-term.
Volunteer retention in crowdsourced projects is one of the keys to project success asresearch has demonstrated that a small percentage of volunteers provide adisproportionately large share of the contributions [Sauermann and Franzoni,2015]. These individuals invest more in the projects not just through their dataprocessing contributions but also through their interaction with other projectmembers (volunteers and researchers). Through this engagement, they help forman online community dedicated to delivering notable project outcomes. Thesededicated volunteers likely have a significant role in the retention of othervolunteers by providing social connections among individuals with similarinterests and motivations [Wenger, McDermott and Snyder, 2002; Wiggins andCrowston, 2010].
Collective action theory has been applied in this context, where a group withcommon interests takes actions to reach collective goals [Triezenberg et al., 2012].Based on this theory, projects could launch campaigns that seek participation fromexisting members interested in advancing the target goals of the collective. Socialmedia and other online platforms could facilitate communications across memberswhile potentially drawing new recruits into the community [Triezenberg et al.,2012]. However, little research has examined the ability of a marketing campaignusing traditional or social media channels to support re-engagement of existingmembers or the recruitment and retention of new volunteers into these projects[Robson et al., 2013].
Crimmins et al. [2014] examined the ability of six email blasts to registeredparticipants of Nature’s Notebook, a citizen science program of the USA NationalPhenology Network, to increase participation in the project. Participation requiresmaking observations of phenological events at a field site of one’s choosing anduploading those data to an online data repository. The targeted campaign resultedin a 184% increase in the number of observations made (N=2,144) and alsoincreased the number of active participants [Crimmins et al., 2014]. The study didnot look at recruitment of individuals not already registered with the project orother methods of recruitment outside the email listserv, but it demonstrated asuccessful approach for re-engaging an existing audience.
JCOM 16(01)(2017)A01 2
Robson et al. [2013] compared social networking marketing strategies to moretraditional media promotions for a citizen science project named Creek Watch.Participation required downloading an application to a smartphone from theproject website and using it to take a picture of a local water body and make simpleobservations. The study found that social networking and press releases wereequally effective means for increasing project awareness (i.e., traffic to projectwebsite) and recruitment (i.e., download of data collection app from website) butthat targeting local groups with interest in the topic was most effective at increasingdata collection. The study did not, however, examine retention rates associatedwith the project before and during the campaign.
We built on the efforts of these previous studies to more fully examine the ability ofmultiple marketing strategies to increase project awareness and drive projectrecruitment and retention in an online crowdsourced citizen science project (SeasonSpotter). We used web analytics, commonly used by businesses to develop andguide online marketing strategies to drive consumer behavior, to inform our study.We wanted to know which marketing strategies used in the campaign were mosteffective at driving traffic to Season Spotter and whether the campaign couldincrease and sustain project engagement over time.
Materials andmethods
About Season Spotter
Season Spotter is one of 42 projects hosted on the online citizen science platform,the Zooniverse (www.zooniverse.org). The Zooniverse currently has over 1.4million participants that engage in these projects, performing big data processingtasks across a variety of scientific fields [Masters et al., 2016]. The Season Spotterproject (launched on July 21, 2015) supports the analysis of images uploaded to theZooniverse from the PhenoCam network [Kosmala et al., 2016]. The network usesdigital cameras to capture seasonal changes in plants over time across 300 sites, amajority of which are located in North America [Richardson et al., 2009; Sonnentaget al., 2012; Brown et al., 2016]. Participants that engage in the Season Spotterproject can do one of two tasks: classify images (answer a series of questions aboutone image or two images side by side) or mark images (draw a line around aspecified area or object in an image). Each image is classified and marked bymultiple volunteers to ensure data quality before being retired. Prior to launchingour marketing campaign on March 3, 2016, approximately 7,000 volunteers hadclassified 105,000 images, and marked 45,000 images.
Initial recruitment to the project and ongoing outreach efforts directed potentialparticipants to the project’s landing page (www.SeasonSpotter.org; Figure 1). Callto action buttons on the site allow site visitors to select whether they want toclassify or mark images or visit Season Spotter’s Facebook(www.facebook.com/seasonspotter), Twitter (www.twitter.com/seasonspotter), orblog pages (www.seasonspotter.wordpress.com). A click to classify or mark imagestakes visitors to pages within the Zooniverse where they perform these tasks(Figure 1). Once in the Zooniverse, visitors can also click tabs to learn more aboutthe research (Research tab), read frequently asked questions (FAQ tab), participatein a discussion forum with other volunteers and the research team (Talk tab), or beredirected to the project’s blog site where researchers provide project updates (Blogtab). Prior to launching the campaign, our Facebook and Twitter accounts were
JCOM 16(01)(2017)A01 3
connected to our blog site so that twice-weekly blog posts automatically posted tothose accounts. No additional posts or tweets were sent out prior to the campaign.
Marketing campaign
We conducted our marketing campaign from March 3 to April 4, 2016. Thecampaign challenged targeted audiences to complete the classification of 9,512pairs of spring images in one month to produce the data needed to address aresearch question being included in an upcoming manuscript submission [Kosmalaet al., 2016]. Our study did not have funding to examine the motivations ordemographics of current Season Spotter participants, but we identified audiencesto target based on external research for participation in other Zooniverse projects[Raddick et al., 2010; Raddick et al., 2013; Cox et al., 2015b]. In addition to theZooniverse, we partnered with another project (Project Budburst;www.budburst.org) ran by one of our affiliate organizations, the NationalEcological Observatory Network (NEON; www.neonscience.org), to promote thecampaign.
We also partnered with SciStarter (www.scistarter.com) for campaign promotion.SciStarter serves as a web-based aggregator of information, videos, and blogs oncitizen science projects globally. The organization helps connect volunteers toprojects that interest them using targeted marketing strategies (Twitter, Facebook,newsletter, live events, multiple blogs through a syndicated blog network run bySciStarter, APIs to share the Project Finder). Project administrators can alsopurchase advertising space on the home page or targeted project pages. SeasonSpotter created a project page on SciStarter on November 24, 2015 (Figure 2).
For the duration of the campaign, we added a progress bar to SeasonSpotter.org sovisitors could see the progress in reaching the campaign goal (Figure 3). Citizenscience research has demonstrated the importance of providing continuousfeedback to volunteers [Bonney et al., 2009a; Crimmins et al., 2014]. Following bestpractices [Landing Page Conversion Course, 2013], we also highlighted the call toaction button on the landing page to direct visitors to participate in the target task(classify) instead of the non-target task (mark; Figure 3).
We followed typical online marketing practices for posting to social media accountsduring the campaign: pinning campaign announcement to top of Facebook andTwitter pages, using images and videos in posts, using popular hashtags, includingrelevant Twitter handles, using only two hashtags per tweet, and using a commoncampaign hashtag across tweets (#SpringSSchallenge; Lee, 2015; Moz, 2016b; Moz,2016a; Twitter Inc., 2016). We also disconnected automatic blog posting to Facebookand Twitter accounts to better track and analyze the effects of the campaign andsent out tweets targeting the campaign that were relevant to specific days (e.g.,#StPatricksDay; Table 1). We posted to Season Spotter’s blog, Facebook, andTwitter announcing the campaign using a specially designed campaign graphic(top of Figure 3). SciStarter used this same graphic for its banner and project pageads, which ran from March 7–25. During the campaign, Season Spotter posted 11times to Facebook and sent out 26 tweets compared to eight posts and six tweetsthe month prior to the campaign. While social media management sites (e.g.,Buffer) can automate delivery of posts at times of day followers are more likely to
JCOM 16(01)(2017)A01 4
see them, we manually submitted posts during our campaign to not interfere withour web analytics. Therefore, we posted at times staff were available to do so. Themarketing effort for each partner organization is provided in Table 2, and the reachof their existing audiences is provided in Figure 4.
To address the participant motivation of “interest in science” for other Zooniverseprojects, Season Spotter also hosted a three-hour Reddit.com Ask Me Anything(AMA) as part of the campaign on March 31 [Kosmala, Hufkens and Gray, 2016].Reddit is a social media platform (home to 234 million users and 8 billion monthlypage views) where users submit content that receives up or down votes from otherusers, which are then used to organize and promote content [Reddit Inc., 2016]. Thescience forum, or “subreddit” (www.reddit.com/r/science/), facilitates discussionsamong Reddit users with an interest in science. In science AMAs, members of thepublic ask questions of scientists in a moderated online discussion forum. Thescientists are asked to prioritize answering those questions receiving the mostup-votes by users. As part of the Season Spotter AMA, a description of the projectand research goals were provided on the Reddit host site along with a link toSeasonSpotter.org.
Analysis
We used Google Analytics to track and report website traffic to SeasonSpotter.org,the Season Spotter project pages on SciStarter, and the Season Spotter project pagesin the Zooniverse. To track the success of each independent marketing strategy, weassigned unique Urchin Traffic Monitor (UTM) parameters (tags added to a URL totrack clicks on a link in Google Analytics) to each link within a tweet, post, blog,newsletter, or email. Google Analytics provides the number of sessions (number ofgrouped interactions of a single user that take place on a website ending after 30minutes of inactivity), new users (number of users that have not visited the sitebefore a designated time period), page views (number of times a user views a page;there can be multiple page views per session), and unique page views (the numberof user sessions per page; there can be only one unique page view per individualper session).
All statistical analyses were performed using SPSS (Version 23). We comparedcampaign metrics associated with the flow of possible participation (awareness,conversion, recruitment, engagement, retention; Figure 1) at two points in time:one month prior to the campaign as an established baseline (February 8–March 2,2016) and the month of the campaign (March 3–April 4, 2016). For thesecomparisons, we conducted independent samples t-tests and used Levene’s test toexamine equality of variances. If variances were unequal, we used anapproximation of the t-statistic that assumes unequal variances. We assessed allvariables for normality using the Shapiro-Wilk test and right-skew transformed thedata using log10(x + 1) when needed to improve normality.
Awareness
We defined awareness as the number of contacts made through the campaign(Figure 1). To assess overall awareness, we summed the number of times Twitterput a campaign tweet in someone’s timeline or search results (Twitter impressions),
JCOM 16(01)(2017)A01 5
the number of times Facebook put a campaign post in a user’s newsfeed (Facebookpost reach), blog views, and the number of emails opened (not received) across allour partner and affiliate organizations. We recorded the number of views toSciStarter pages where the banner or project page ads were displayed. We alsoassigned a number of views to our Reddit AMA, which we estimatedconservatively at 30,000 based on existing data for science subreddit AMAs[Owens, 2014]. To determine whether project awareness increased during thecampaign, we conducted a t-test using metrics associated with Season Spotter’sFacebook and Twitter accounts (Twitter impressions, Twitter engagements,Facebook post reach).
Because SciStarter marketing sometimes directed individuals to the Season Spotterproject page on SciStarter instead of SeasonSpotter.org, we also conducted t-testanalysis using unique page views to the project page on SciStarter to see if thecampaign increased traffic to that site.
Conversion
We defined conversion as the number of times an individual arrived atSeasonSpotter.org either indirectly through SciStarter or directly from any of ourmarketing strategies (Figure 1). To calculate the conversion rate, we divided thenumber of sessions by the number of total views associated with each marketingstrategy. We also performed a two-way ANOVA to assess whether the number ofnew users or total sessions to SeasonSpotter.org was influenced by one of threereferral sources prior to or during the campaign: direct or organic, third party, orpartner. Direct referrals occur when a visitor types the URL directly into a browser,whereas organic referrals occur when a visitor finds a site through an Internetbrowser search. We identified third party referrals as those referrals not comingfrom one of our affiliate or partnering organizations, and partner referrals werethose coming from one of our partnering organizations (Figure 4). To assessincreases in new users to SeasonSpotter.org during the campaign, we conducted at-test analysis of new users per day.
Recruitment
We defined recruitment as the rate at which people visiting SeasonSpotter.orgclicked through to perform tasks in the Zooniverse (Figure 1). We added GoogleAnalytics’ event tracking code to SeasonSpotter.org to collect data on the number oftimes (events) a user clicked a call to action button on the website. For ourrecruitment analysis, we divided our data into campaign target events (classifyimages) and other non-target events (mark images or visit Season SpotterFacebook, Twitter, or blog pages). We calculated a recruitment conversion rate foreach day of the campaign as the total number of target or non-target events dividedby the total number of unique page views.
To determine if we sustained the same level of recruitment following the campaignas we did during the campaign, we ran a t-test to examine differences in thenumber of target events and non-target events that occurred during and one monthfollowing the campaign (April 5–May 4, 2016).
JCOM 16(01)(2017)A01 6
Engagement
We defined engagement as the number of target tasks (classify images) andnon-target tasks (mark images) completed for the project within the Zooniverse(Figure 1). We examined differences in means with a t-test prior to and during thecampaign for total number of classifications, total number of classification sessions(group of classifications in which the delay between two successive images is lessthan one hour), total number of participants classifying images, total number ofmarked images, total number of marking sessions, and total number of participantsmarking images.
Because SeasonSpotter.org is a separate website from the Zooniverse and we didnot link sessions or users on SeasonSpotter.org to sessions or users in theZooniverse, our level of granularity per user across platforms was reduced.However, Google Analytics tracking on the Zooniverse website provided data onwhat percentage of referrals to Season Spotter’s task pages came fromSeasonSpotter.org versus other referral locations. We summed the total number ofsessions from each referring source to the pages for classifying images (our target)within the Zooniverse prior to and during the campaign.
Retention
We examined two types of project retention in our analyses. Short-term retentionwas defined as the length of time an individual spends working on tasks duringone session. Long-term retention was defined as the number of days over which anindividual engaged with the project (i.e., number of days between a participant’sfirst and last classification), regardless of the number of classifications or time spentclassifying on individual days. Although our challenge was interested in increasedtime spent classifying images in the short term (the first measure of retention), theproject aimed to retain these volunteers in the long run after the campaignchallenge ended to continue supporting the project over its lifetime (the secondmeasure of retention).
For short-term retention, we examined differences in the total time spentclassifying and marking images in one session prior to and during the campaign.For long-term retention, we examined the number of days retained for users thatsigned on at any time during the campaign. We counted the number of daysretained up until 30 days after each participant’s first classification. To compare theretention rates of individuals that signed on during the campaign to a baseline, wealso calculated the number of days retained for individuals that did their firstclassification within the two months prior to the campaign (December 31,2015–February 1, 2016). We then calculated the number of days these individualswere retained up until 30 days after each participant’s first classification. Weperformed a log rank test to determine if there were differences in the retentiondistributions before and during the campaign. To examine the number of existingregistered users that may have re-engaged with the project as a result of thecampaign, we calculated the number of registered users that contributed to theproject during the campaign period that had not contributed for more than thirtydays before the campaign started.
JCOM 16(01)(2017)A01 7
Results We report results of t-test and ANOVA analyses as mean ± standard deviation.
Awareness
Through our marketing campaign, we made 254,101 contacts (Table 2). Thisnumber is likely an overestimate of the number of people reached because the sameindividual may have been exposed to multiple marketing strategies. Over thecourse of the campaign, the Season Spotter project gained two new Facebook pagelikes and 50 new Twitter followers.
More Twitter impressions occurred per tweet on Season Spotter’s account duringthe campaign (559 ± 464) compared to before (138 ± 19; t = −7.8, p ≤ .01).Engagements per tweet also significantly increased (µPRE = 0.2 ± 0.4;µDURING = 6.5 ± 7.1; t = −7.8, p ≤ .01), but our Facebook post reach did not(µPRE = 62 ± 41; µDURING = 42 ± 33; t = 1.2, p = 0.3). Tweets with ten or moreengagements during the campaign period included those launching the challenge,tagging other citizen science projects with a similar mission, referencing the AMA,and referencing a trending topic (Table 1). Therefore, targeted social mediastrategies used through the campaign were more effective than automaticallygenerated tweets and posts via the blog at reaching and engaging the audiencereached, at least on Twitter.
Marketing strategies employed by SciStarter also increased visitors to the SeasonSpotter project page each day during (33 ± 18) compared to before the campaign(23 ± 0; t = −5.1, p.01), further supporting the campaign’s effectiveness atincreasing project awareness.
Conversion
Our marketing campaign drove more daily users to SeasonSpotter.org (22 ± 13)than arrived before the campaign (1.5 ± 0.1; t = −3.0, p ≤ .01). Conversion ratesfor marketing strategies that directed individuals to SeasonSpotter.org averaged 1%(Table 2). Emails had the highest conversion rate (4%) with the project page adshosted on SciStarter having the lowest conversion rate (0.05%; Table 2). Facebookposts, tweets, and blog posts from SciStarter directed individuals to the SeasonSpotter project page on SciStarter. Therefore, the SciStarter project page is notdirectly comparable to other approaches. The conversion rate from the SciStarterproject page to SeasonSpotter.org was 13% with 1,395 views and 175click-throughs. Each campaign strategy therefore resulted in a small fraction ofindividuals made aware of the campaign visiting SeasonSpotter.org.
There was a statistically significant interaction when comparing the effects of thereferral source (direct/organic, partner, third party) on the number of sessionsprior to and during the campaign (F = 5.5, p ≤ .01, partial η2 = .03). Therefore, weperformed post hoc comparisons using the least significant difference (LSD)method. The difference in the number of sessions per day before and during thecampaign was significant for partner referrals (F = 12, p < .01, partial η2 = 0.03)but not direct and organic referrals (F = 1.2, p = 0.27, partial η2 = .00) or thirdparty referrals (F = .01, p = 0.94, partial η2 = .00; Table 3).
JCOM 16(01)(2017)A01 8
There was a statistically significant interaction when examining the effects of thereferral source on the number of new users prior to and during the campaign(F = 3.2, p < .05, partial η2 = .02). LSD results showed a statistical difference in thenumber of daily new users before and during the campaign for partner referrals(F = 5.6, p = .02, partial η2 = 0.02) but not from visitors referred directly ororganically (F = 1.5, p = .23, partial η2 = .00) or those referred from a third party(F = .02, p = .88, partial η2 = .00; Table 3). These results indicate that our campaignsuccessfully drove traffic to our site through our recruitment methods, and thattraffic arriving at Season Spotter via other means was unaffected by the campaign.
Recruitment
Recruitment analysis found that, on average, only 42.6% of visitors toSeasonSpotter.org clicked through to classify images in the Zooniverse. Of the rest,15.6% of visitors clicked through to other pages not targeted by our campaign.More target events occurred daily during the campaign (134 ± 487) compared tothe month following the campaign (4.2 ± 2.9; t = 5.6, p ≤ .01; Figure 5A). The sameheld true for non-target events (µDURING = 47 ± 147; µAFTER = 3.0 ± 1.7; t = 4.1,p ≤ .01; Figure 5A). We also found a significant difference between the number ofdaily sessions on Season Spotter’s classify pages in the Zooniverse one month priorto (1.9 ± 6.1) and during the campaign (76 ± 384; t = −6.1, p ≤ .01; Figure 5A).These data demonstrate that traffic driven to SeasponSpotter.org by the campaignresulted in increased clicks on the site’s call to action buttons. However, a lowrecruitment rate resulted in substantial loss of potential participants at this step inthe process (Figure 1).
Engagement
Volunteers classified the 9,512 pairs of spring images by March 23, meeting ourgoal before the official end of the campaign. At that time, we switched ourcampaign message for participants to begin classifying an additional 9,730 autumnimages and changed our progress bar to reflect the transition on SeasonSpotter.org.Over the course of the campaign, 1,598 registered Zooniverse users and 4,008unregistered users from 105 countries made 56,756 classifications.
Results showed statistically significant increases in the total number ofclassifications per day (µPRE = 237 ± 27; µDURING = 1512 ± 771; t = −4.1, p ≤ .01),classification sessions per day (µPRE = 18 ± 1.5; µDURING = 154 ± 76; t = −5.1,p ≤ .01), and the number of volunteers performing classifications each day(µPRE = 16 ± 1.3; µDURING = 143 ± 73; t = −5.0, p ≤ .01) during the campaigncompared with one month prior to the campaign (Figures 5B, 6). Although not atarget activity of the campaign, we also found significant increases in the totalnumber of images marked (µPRE = 149 ± 14; µDURING = 461 ± 145; t = −2.9,p = .01), marking sessions (µPRE = 19 ± 1.4; µDURING = 58 ± 19; t = −2.9, p = .01),and the number of volunteers marking images (µPRE = 18± 1.4; µDURING = 53± 18;t = −2.7, p = .01; Figures 5B, 6). These findings suggest that the campaign resultedin increased engagement in target and non-target associated activities.
JCOM 16(01)(2017)A01 9
Since the Season Spotter project was created, 75% of all referrals to the classificationpages in the Zooniverse have been from SeasonSpotter.org. The percentage ofreferrals coming from different sources shifts prior to and during the campaign(Figure 7). SeasonSpotter.org accounted for 46% of referrals one month prior to thecampaign, and the percentage increased to 68% during the campaign. Directreferrals likely account for regular visitors that have the Zooniverse project URLsaved in their web browser. We also saw the addition of referrals from emails andsocial media during the campaign while no referrals were driven from thesesources the month prior (Figure 7). These data demonstrate that increasedengagement in the Zooniverse resulted from increased traffic to SeasonSpotter.org.
We also found shifts in the percentage of visits to target and non-target SeasonSpotter pages within the Zooniverse (Figure 8). A lower percentage of visitors wentto the page to classify images before the campaign (36%) than during the campaign(59%). We saw increases in the percentage of total visits to the image markingpages before the campaign (45%) compared to during (29%). We also saw increasesin the absolute number of views to pages describing the research project (research;143 to 604), the project discussion forum (talk; 511 to 1554), frequency askedquestions (FAQ; 62 to 313), and project result pages (results; 0 to 115; Figure 8).
Retention
Analysis of short-term retention examined increases in time spent doing target andnon-target activities. Results showed no significant increases in the average time(in seconds) spent classifying images (µPRE = 755 ± 217; µDURING = 660 ± 110;t = 0.47, p = .64) or marking images (µPRE = 1035 ± 385; µDURING = 782 ± 92;t = −0.46, p = 0.7).
Analysis of long-term retention examined whether users returned to the projectfollowing their first classification session. Since the project started but prior to thecampaign, 7,089 participants had classified images, and 81% of those were notretained after their first classification session. During the campaign, 5,083 newparticipants did their first classification, and 94% of those were not retained aftertheir first classification session. The log rank test found that the retentiondistributions for the two on-boarding periods examined were significantly different(X2 = 1094; p < .01). Participants that had classified images before the campaignhad a median interval between first and last classification of four days compared toan interval of less than one day for participants during the campaign (Figure 9). Soalthough patterns of short-term retention did not change during the campaign,patterns of long-term retention did with a greater proportion of participants onlycontributing to the project for one classification session.
Our data also showed that 45% of registered volunteers that had not classified animage for at least 30 days prior to the campaign (N=1,848) re-engaged with theproject during the campaign period. Although we do not have direct cause andeffect data, we can safely assume these individuals re-engaged with the project as aresult of the campaign.
JCOM 16(01)(2017)A01 10
Discussion The rapid growth in citizen science may result in greater competition amongprojects to recruit volunteers and retain their participation [Sauermann andFranzoni, 2015]. This is especially true for crowdsourced projects with highattrition rates [Nov, Arazy and Anderson, 2011]. Our marketing campaign for theonline citizen science project Season Spotter was successful at meeting the target ofclassifying more than 9,000 pairs of images in less than a month. We also broughtincreased awareness to the project, re-engaged existing volunteers, and gained newparticipants that have been retained since the campaign ended. Lessons learnedfrom this campaign will not only support the future success of Season Spotter, butalso inform the success of other online citizen science projects.
Lesson 1: invest in growing your audience
Many citizen science projects have limited staff available to support outreachefforts or to maintain a constant social media presence [Chu, Leonard andStevenson, 2012; Sauermann and Franzoni, 2015]. However, the data from ourcampaign demonstrates that fairly minimal effort can result in dramatic increasesin participation, provided an appropriate audience is reached (Table 2). We wentfrom an average of 2,000 classifications completed per month to more than 55,000classifications during the month of our campaign. These findings are consistentwith those from the Nature’s Notebook study in which the project launched asuccessful year-long campaign utilizing just a week of combined staff time[Crimmins et al., 2014]. Considering this return on investment, projects should taketime early on to become familiar with using social media platforms and developingoutreach strategies for growing new and re-engaging existing audiences [Robsonet al., 2013].
The types of strategies employed should be diverse and consider the audienceneeding to be reached as well as existing project needs. Demographic data, forinstance, may show that Instagram is likely a more popular form of social mediathan Facebook for communicating with your volunteers. In our campaign, we sawmore engagement via Twitter than Facebook which suggests our social mediaactivities should focus on this platform.
Generally, to grow your audience, project surveys indicate that volunteers learnabout opportunities to participate through numerous channels [Chu, Leonard andStevenson, 2012; Robson et al., 2013]. Email has shown the greatest promise forreaching existing audiences [Crimmins et al., 2014], but project managers shouldalso consider what needs to be achieved as part of the outreach effort. For example,the Creek Watch study found that social media was better at supportingrecruitment efforts while engaging targeted community groups increased datacollection rates [Robson et al., 2013]. Projects should also consider whether or notparticipation needs to occur in short bursts or be sustained over long periods,which also helps determine appropriate recruitment and communication strategies.
Programs should seek ways to be creative with their outreach strategies and tapinto volunteer motivations. For example, the Reddit AMA was viewed by a largenumber of people with an interest in science and likely reached individuals thatmay have interest but do not currently contribute to citizen science projects. Inaddition, although not officially part of our research study, one of NEON’s
JCOM 16(01)(2017)A01 11
researchers posted a request to participate in the campaign on her personalFacebook page. This resulted in 40 hits to SeasonSpotter.org (a 10% conversionrate). Other researchers have recommended requesting contributions in the samemanner as walk or bike-a-thons where participants request involvement from closefriends and gain recognition for bringing in contributions [Chu, Leonard andStevenson, 2012]. Future research might examine the success of additionalmarketing platforms beyond those tested here and consider the role of personalsocial connections in distributing participation requests.
The importance of knowing and growing your audience is exemplified by the lowconversion rates across marketing strategies [Chaffey, 2016]. Considering this, it isimportant to increase the audience pool so that a low conversion rate still results inhigh numbers of participants. For example, the Zooniverse has a large pool ofregistered users that we reached out to in our campaign. Even though the emailsent out to these users had a conversion rate of only 4%, approximately 6,000individuals reached contributed to the campaign. This email resulted in thecompletion of our campaign goal the day after it went out, with approximately30,000 classifications made in less than 24 hours.
Many projects will not have access to a ready group of volunteers like theZooniverse. Having access to this community may have influenced the ability ofour findings to be broadly applicable across citizen science projects not similarlystructured. However, 71% of our campaign participants were not previousZooniverse users based on our data and this provides some indication thatimplementing campaigns would be effective for other online, crowdsourcedprojects not part of a similar platform. It is also important to note that whilesuccessful in our campaign, engaging an existing community that spans dozens ofprojects has the potential to result in stronger competition among projects orvolunteer burnout if too many requests are made of the volunteer community.More research is also needed on projects that require more of a volunteercommitment and require being physically present to volunteer. All new projects,whether online or in person, may find resources like SciStarter an effective meansto tap into existing audiences with interest in all types of citizen science projects.
Our campaign resulted in low retention rates with a majority of our volunteersparticipating in only one classification session and not returning. Sauermann andFranzoni [2015] found similar user patterns from their review of other Zooniverseprojects with 10% of participants contributing, on average, 79% of theclassifications. Therefore, considering the high turnover, high recruitment rates arenecessary to replace users continuously leaving the project. For the smallpercentage that do remain, providing online support through on-goingcommunications and periodic calls to action will be vital to re-engagement andlong-term retention. Continuous feedback on project successes and acknowledgingvolunteer contributions play a vital role in retention as well [Bonney et al., 2009a;Crimmins et al., 2014]. Highly engaged volunteers can also play a key role involunteer recruitment, which needs further study.
JCOM 16(01)(2017)A01 12
Lesson 2: continuously engage with your existing audience
Recruitment efforts may use extensive resources for a project [Cooper et al., 2007],so special effort needs to be made to retain those volunteers already makingcontributions. This needs to be considered from the onset of the project. Successfulstrategies rely on keeping past and present participants well-informed and creatinga shared sense of community [Chu, Leonard and Stevenson, 2012]. Projects can dothis continuously through blogs, newsletters, and online discussion forums buttargeted campaigns like ours might be necessary to re-engage members in makingcontributions [Dickinson et al., 2012].
During our campaign, we successfully increased traffic to SeasonSpotter.org, whichdrove increased engagement in the project. However, our data demonstrated asignificant drop in visits to the website following the campaign (Figure 5). Otherstudies have shown a decline in the frequency of participation even for highlyactive users with spikes in contributions occurring following media appearances byproject researchers, press releases, and targeted social media campaigns [Staffordet al., 2010; Morais, Raddick and Santos, 2013; Crimmins et al., 2014; Sauermannand Franzoni, 2015]. Therefore, project leaders must continue to engage with theiraudience to retain their participation while being cautious not to overburdenparticipants [Crimmins et al., 2014].
For the Zooniverse, peaks in engagement result when an email goes out to thecommunity announcing the launch of a new project or requesting participation tomeet a specific project need, as was the case for our campaign (Figure 6; Sauermannand Franzoni, 2015). This serves as a prime example of collective action theory,where a large online community is driven to action by a request to reach a targetgoal [Triezenberg et al., 2012]. Developing a community of participants such as thatfound within the Zooniverse takes time to establish and project leaders will need tobe patient and work strategically to grow such a community. Future researchshould examine how a marketing campaign influences project recruitment for newprojects with no audience and existing projects without access to an establishedcommunity of volunteers.
Lesson 3: collaborate when conducting outreach initiatives
Projects should seek to form partnerships with organizations that share commongoals to support their outreach efforts [Cooper et al., 2007; Purcell, Garibay andDickinson, 2012]. Season Spotter launched in July of 2015, making it only ninemonths old when we launched our campaign. Therefore, the potential audiencereach of Season Spotter by itself was low (Figure 4). Solely, Season Spotteraccounted for only 2% of the number of contacts made through the campaign. Byworking with our partners and affiliate organizations, we increased the reach ofour campaign by almost 45 times.
As mentioned previously, we had access to the Zooniverse’s expansive communityof 1.4 million registered users for our campaign. However, projects without accessto this number of users or new projects may need to tap into other existing citizenscience networks to support volunteer recruitment. Through its extensivemarketing efforts and audience reach (Figure 4), SciStarter also drove significant
JCOM 16(01)(2017)A01 13
recruitment to SeasonSpotter.org. It therefore provides a valuable tool for projectsseeking to connect with similar projects or reach out to a growing community ofmotivated volunteers. Although not utilized for this study, the Citizen ScienceAssociations in the United States, Europe, and Australia have growingmemberships of researchers and practitioners in the field of citizen science. Emaillistservs and discussion forums provided by these communities offer additionalopportunities to build on the existing networks of established projects. After a newaudience begins to grow, projects should take time to invest in understanding theirmotivations to participate and continue to participate to support efforts to drivefuture recruitment efforts.
Lesson 4: follow best practices for project design
For many years, marketing research has examined strategies for successfulrecruitment and retention of consumers such as designing social media messagesand websites to improve conversion rates. Our study applied some of thesestrategies to the design and analysis of our campaign, but there is likely much moreto be learned by applying marketing strategies to citizen science recruitment andretention efforts. Uchoa, Esteves and de Souza [2013] used principles frommarketing research to propose a framework supporting development of marketingstrategies and online collaboration tools for crowdsourced citizen science projects.The authors provide ways to support development of these systems by targetingfour dimensions: the crowd, collaboration, communication, and crowdware[Uchoa, Esteves and de Souza, 2013]. These dimensions integrate well into thelessons discussed previously and provide further insight into best practices forproject design. Design across all these dimensions needs to be an iterative processcontinuously adjusting to the needs of the community [Newman et al., 2011;Uchoa, Esteves and de Souza, 2013].
The crowd dimension requires project developers to understand participantmotivations, consider the ideal audience needed to target those motivations forperforming the necessary project tasks, and then identify target groups withmembers having those characteristics [Uchoa, Esteves and de Souza, 2013]. Withinthis dimension, best practices include supporting the development of a strategicplan for audience growth, while considering time and staff limitations; identifyingviable partners for network growth; and promoting volunteer satisfaction andretention by responding to their motivations [Stukas et al., 2009]. Our study waslimited by data provided by the motivations of volunteers within the Zooniversethat may or may not have contributed to our project. When resources are available,projects should seek to define the audience they need to reach and then understandthe audience once it exists while continuously assessing their needs andmotivations.
The collaboration dimension targets a project’s ability to deliver experiences thatattract and retain new recruits [Uchoa, Esteves and de Souza, 2013]. Attention hasto be placed on whether the benefit of participation is worth the cost, and projectsmust consider how they can provide diverse opportunities for participation. Futureresearch that extends beyond what we investigated here should address differencesin recruitment and retention between crowdsourced projects that offer theopportunity to volunteer briefly and conveniently to those projects requiring
JCOM 16(01)(2017)A01 14
training, equipment, travel, or other costs associated with participation. Projectsshould also consider how the repetition of simplified tasks in crowdsourcedenvironments might impact volunteer retention and how a platform like theZooniverse provides opportunities for volunteers to move between projectsover time.
The communication dimension supports the need to define appropriatecommunication strategies for reaching new audiences and for strengtheningexisting communities [Uchoa, Esteves and de Souza, 2013]. Many projects alreadycommunicate with volunteers via blogs, discussion forums, and social networking,but these projects need to periodically check in with the community to ensure thesemethods of communication continue to meet their needs [Newman et al., 2011].Projects should also consider how communications need to be structureddifferently to support recruitment versus retention.
The crowdware dimension supports the development of websites and apps withregard to usability, accessibility, and data security [Uchoa, Esteves and de Souza,2013]. Volunteer recruitment, retention, and ultimately project success may hingeon the usability of project interfaces [Newman et al., 2010]. The online citizenscience project eBird increased its number of annual observations from 200,000 in2005 to 1.3 million in 2010 by incorporating features requested by the usercommunity [Chu, Leonard and Stevenson, 2012].
Our findings further support the importance of considering all four dimensionsduring project design. As shown in Figure 1, someone made aware of the SeasonSpotter campaign had to go through a series of steps before reaching the targetclassification task. Our conversion rates showed a drop off in recruitment at eachstep with less than 50% of visitors to SeasonSpotter.org resulting in a click on one ofthe call to action buttons. Only 13% of visitors to Season Spotter’s project page onSciStarter clicked through to SeasonSpotter.org. Therefore, changes in the crowddimension (our marketing strategy) or the crowdware dimension (website design)might be implemented to increase conversion rates. For example, links provided inour campaign could have clicked directly through to the Zooniverse classificationpages instead of sending users to SeasonSpotter.org first. These findings havestrong implications for the design of citizen science projects, project aggregators,and marketing campaigns.
Lesson 5: increasing participation results in indirect impacts
Although our campaign specifically targeted participation in our challenge, thecampaign also resulted in several indirect impacts worth noting. The campaign,which drove increased engagement in the classification of images, also droveincreased engagement in image marking, a non-target task of the campaign. Thisfinding indicates that targeted campaigns that drive recruitment to a website for aspecific purpose may result in site visitors supporting additional goals of theproject as well.
The Zooniverse added 102 registered users through the Season Spotter projectduring our month-long campaign. Prior to this, the Zooniverse averaged 48 newaccounts created through Season Spotter each month, excluding the first three days
JCOM 16(01)(2017)A01 15
of the project, which brought in 71 new registered users. A larger pool of registeredusers in the Zooniverse means more potential recruits for other projects that arepart of the platform as well.
Through our study, we also found increased traffic to pages (FAQ, Research,Results, Talk) that support participant learning and networking with thecommunity. Generally, crowdsourcing projects tend to favor goals of dataproduction instead of participant learning [Masters et al., 2016] but recent studieshave shown that learning does occur through participation in these projects[Prather et al., 2013; Sauermann and Franzoni, 2015; Masters et al., 2016]. Learningoccurs even if the motivation to learn is low among participants [Raddick et al.,2010] and if projects were not designed with learning as a primary goal [Masterset al., 2016]. Learning can be supported through interactions among volunteer andscientist participation in online discussion forums and other communicationchannels [Cox et al., 2015a]. More research is needed on how access to learningfeatures within a crowdsourced environment can contribute to gains in knowledgeand skills of participants.
Conclusions Citizen science will continue to serve as a valuable tool for conducting scientificresearch at scales not possible using traditional approaches. Research in the field isjust beginning to unlock the diverse motivations that drive participation in theseprojects; realizing volunteer recruitment and retention are crucial to project success.We provided insights into how a targeted marketing campaign implemented acrossa group of partnering organizations supported the recruitment and retention ofvolunteers in an online, crowdsourced citizen science project. Our findingscorroborated other studies showing increased recruitment of new volunteers andre-engagement of existing volunteers using diverse outreach efforts. However, theability to sustain project engagement relies on projects maintaining continuouscommunications with their audiences. Projects should seek to develop long-termoutreach strategies prior to their launch while iteratively working to make projectdesign meet the needs of participants.
Acknowledgments The work for this project was funded by NSF Macrosystems Biology grantEF-1065029. We would like to thank the Zooniverse community for its support ofthis research and all the volunteers that contributed to Season Spotter (a full list ofvolunteer names is available online athttp://SeasonSpotter.org/contributors.html). Dennis Ward (NEON), LeslieGoldman (NEON), Rob Goulding (NEON), Kat Bevington (NEON), EvaLewandowski (SciStarter), Jill Nugent (SciStarter), and Daniel Arbuckle (SciStarter)helped promote the campaign through affiliate marketing channels. Dennis Wardand Koen Hufkens (Harvard University) provided web design support forSeasonSpotter.org. Colin Williams (NEON) designed the graphic art used in ourcampaign and assisted with figure formatting.
JCOM 16(01)(2017)A01 16
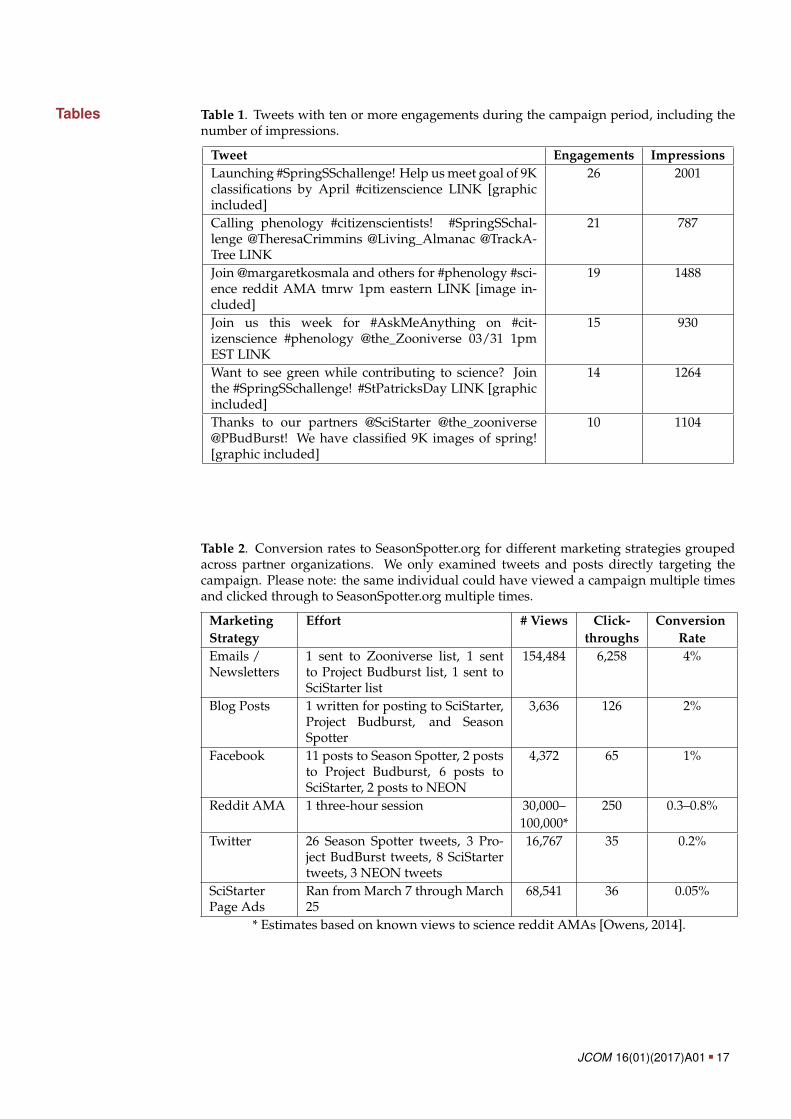
Tables Table 1. Tweets with ten or more engagements during the campaign period, including thenumber of impressions.
Tweet Engagements ImpressionsLaunching #SpringSSchallenge! Help us meet goal of 9Kclassifications by April #citizenscience LINK [graphicincluded]
26 2001
Calling phenology #citizenscientists! #SpringSSchal-lenge @TheresaCrimmins @Living_Almanac @TrackA-Tree LINK
21 787
Join @margaretkosmala and others for #phenology #sci-ence reddit AMA tmrw 1pm eastern LINK [image in-cluded]
19 1488
Join us this week for #AskMeAnything on #cit-izenscience #phenology @the_Zooniverse 03/31 1pmEST LINK
15 930
Want to see green while contributing to science? Jointhe #SpringSSchallenge! #StPatricksDay LINK [graphicincluded]
14 1264
Thanks to our partners @SciStarter @the_zooniverse@PBudBurst! We have classified 9K images of spring![graphic included]
10 1104
Table 2. Conversion rates to SeasonSpotter.org for different marketing strategies groupedacross partner organizations. We only examined tweets and posts directly targeting thecampaign. Please note: the same individual could have viewed a campaign multiple timesand clicked through to SeasonSpotter.org multiple times.
Marketing Effort # Views Click- ConversionStrategy throughs RateEmails /Newsletters
1 sent to Zooniverse list, 1 sentto Project Budburst list, 1 sent toSciStarter list
154,484 6,258 4%
Blog Posts 1 written for posting to SciStarter,Project Budburst, and SeasonSpotter
3,636 126 2%
Facebook 11 posts to Season Spotter, 2 poststo Project Budburst, 6 posts toSciStarter, 2 posts to NEON
4,372 65 1%
Reddit AMA 1 three-hour session 30,000– 250 0.3–0.8%100,000*
Twitter 26 Season Spotter tweets, 3 Pro-ject BudBurst tweets, 8 SciStartertweets, 3 NEON tweets
16,767 35 0.2%
SciStarterPage Ads
Ran from March 7 through March25
68,541 36 0.05%
* Estimates based on known views to science reddit AMAs [Owens, 2014].
JCOM 16(01)(2017)A01 17

Table 3. Contingency table showing mean ± standard deviation for sessions and new usersper day by referring source (direct/organic, partner, third party) one month prior to andduring the campaign. An asterisk represents a significant difference in pre and during cat-egory values.
Conversion Metric Category Direct/Organic Partner Third PartySessions PRE 4.2(±2.7) 1.2(±0.5)* 1.2(±0.5)
DURING 3.2(±2.6) 37(±296)* 1.1(±0.5)New Users PRE 2.2(±1.3) 1.1(±0.54)* 0.97(±0.60)
DURING 1.7(±1.6) 34(±282)* 1.0(±0.61)
Figures
Figure 1. The desired flow of participation in Season Spotter’s spring challenge. Throughthe marketing campaign, awareness of the challenge results in more visitors to SeasonSpot-ter.org directly or indirectly via SciStarter (i.e., conversion). Once on the landing page, visit-ors to the site click on the target call to action button to enter the Season Spotter project pageswithin the Zooniverse (i.e., recruitment) where they can begin image classifications (i.e., en-gagement). After the initial classification session, new recruits will continue to participatein the project over time (i.e., retention).
JCOM 16(01)(2017)A01 18
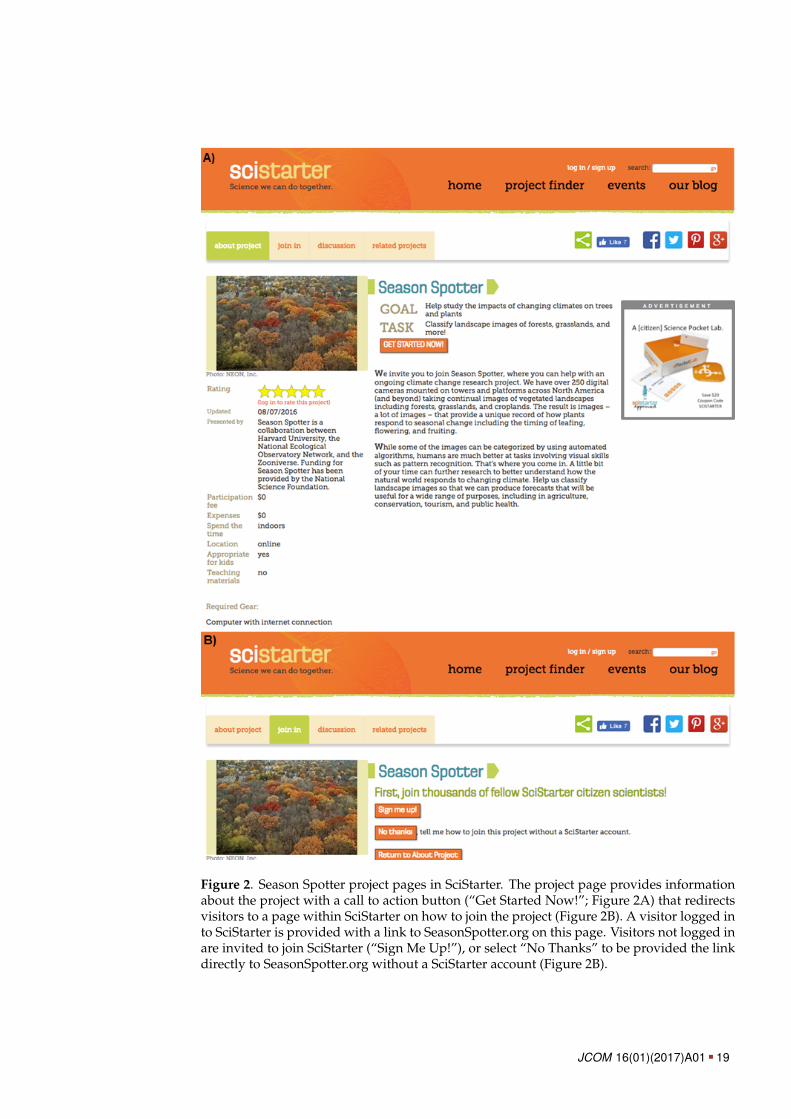
Figure 2. Season Spotter project pages in SciStarter. The project page provides informationabout the project with a call to action button (“Get Started Now!”; Figure 2A) that redirectsvisitors to a page within SciStarter on how to join the project (Figure 2B). A visitor logged into SciStarter is provided with a link to SeasonSpotter.org on this page. Visitors not logged inare invited to join SciStarter (“Sign Me Up!”), or select “No Thanks” to be provided the linkdirectly to SeasonSpotter.org without a SciStarter account (Figure 2B).
JCOM 16(01)(2017)A01 19
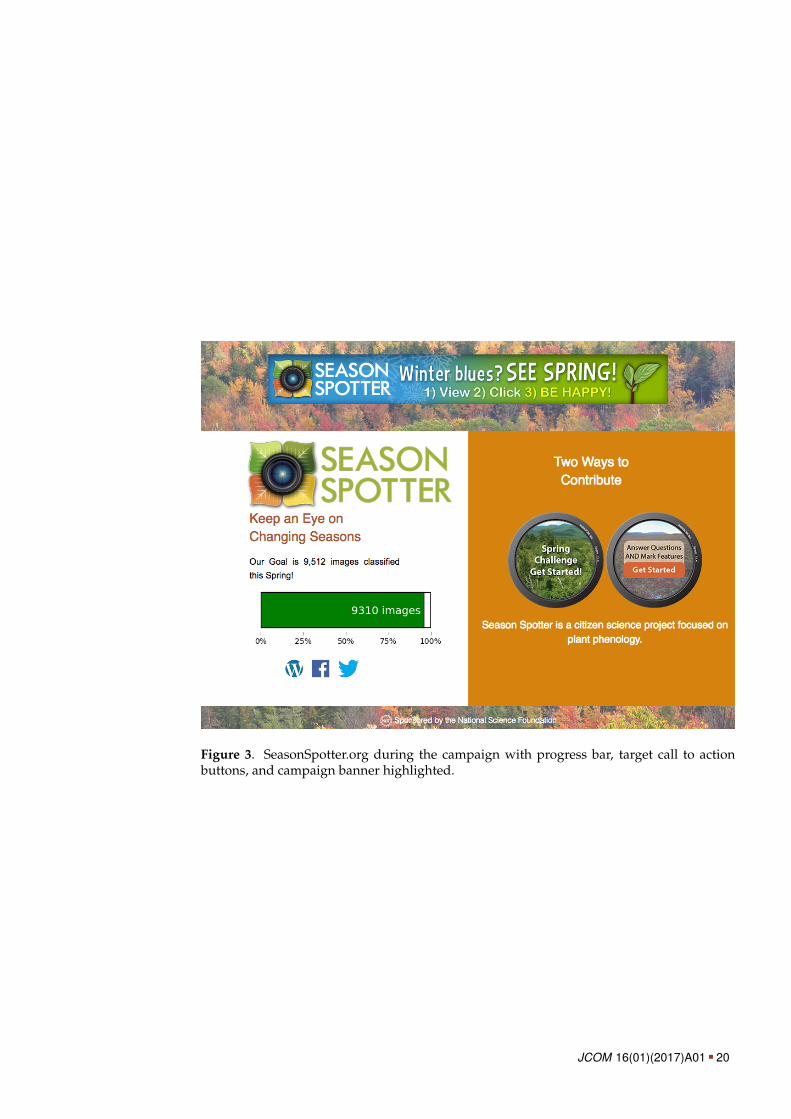
Figure 3. SeasonSpotter.org during the campaign with progress bar, target call to actionbuttons, and campaign banner highlighted.
JCOM 16(01)(2017)A01 20
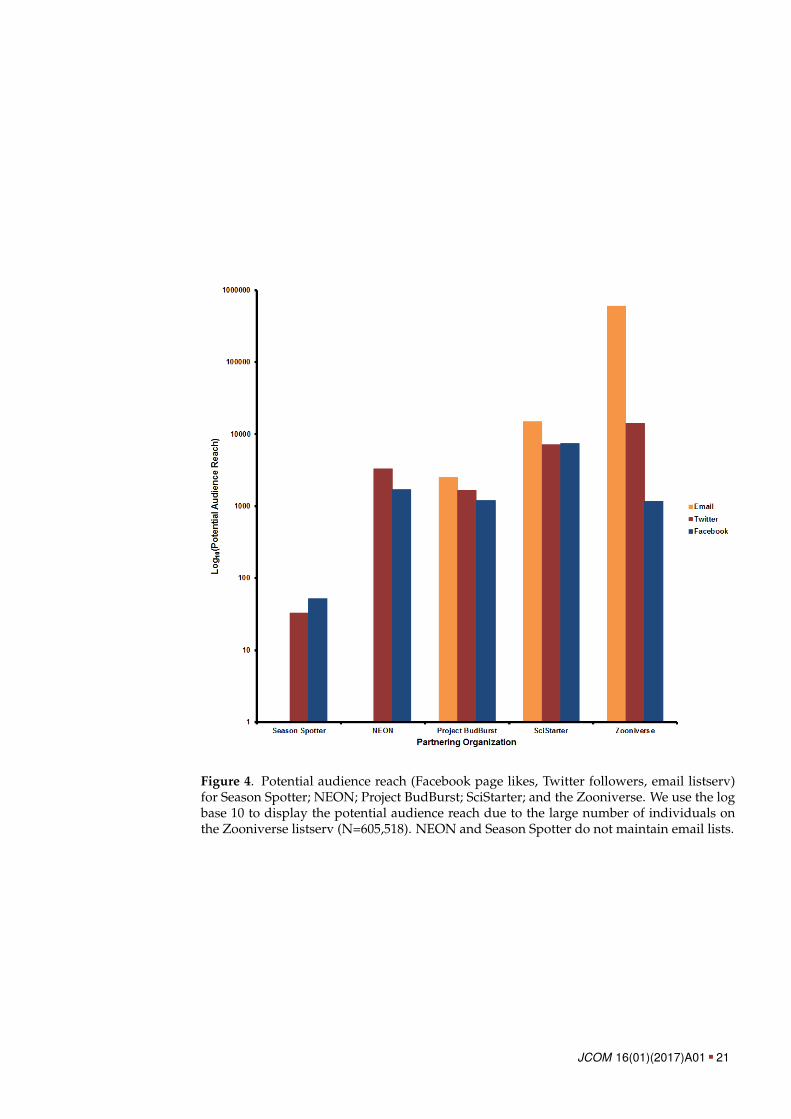
Figure 4. Potential audience reach (Facebook page likes, Twitter followers, email listserv)for Season Spotter; NEON; Project BudBurst; SciStarter; and the Zooniverse. We use the logbase 10 to display the potential audience reach due to the large number of individuals onthe Zooniverse listserv (N=605,518). NEON and Season Spotter do not maintain email lists.
JCOM 16(01)(2017)A01 21
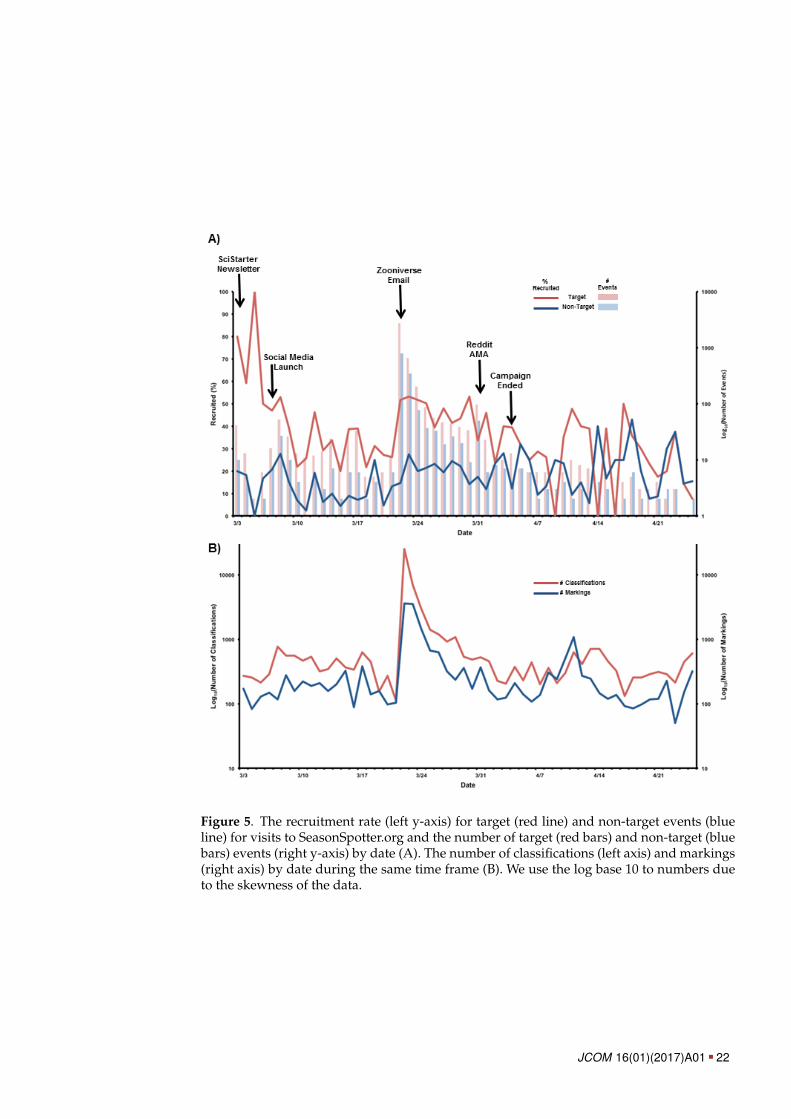
Figure 5. The recruitment rate (left y-axis) for target (red line) and non-target events (blueline) for visits to SeasonSpotter.org and the number of target (red bars) and non-target (bluebars) events (right y-axis) by date (A). The number of classifications (left axis) and markings(right axis) by date during the same time frame (B). We use the log base 10 to numbers dueto the skewness of the data.
JCOM 16(01)(2017)A01 22
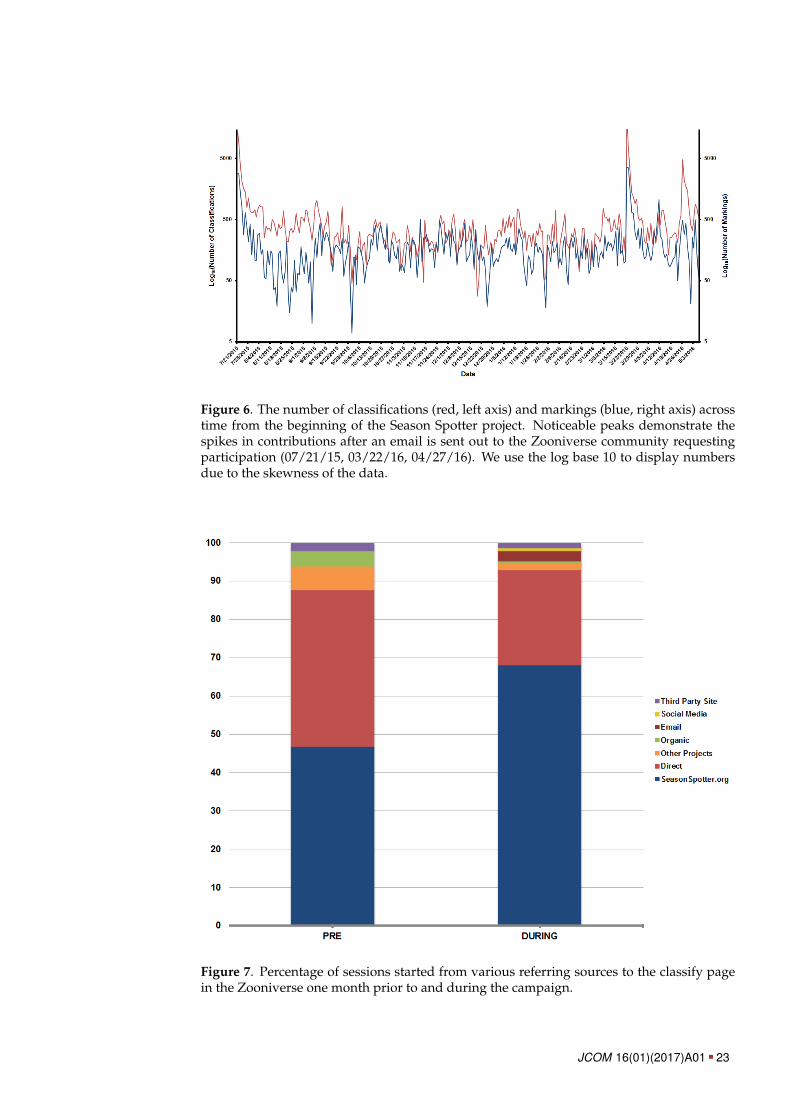
Figure 6. The number of classifications (red, left axis) and markings (blue, right axis) acrosstime from the beginning of the Season Spotter project. Noticeable peaks demonstrate thespikes in contributions after an email is sent out to the Zooniverse community requestingparticipation (07/21/15, 03/22/16, 04/27/16). We use the log base 10 to display numbersdue to the skewness of the data.
Figure 7. Percentage of sessions started from various referring sources to the classify pagein the Zooniverse one month prior to and during the campaign.
JCOM 16(01)(2017)A01 23
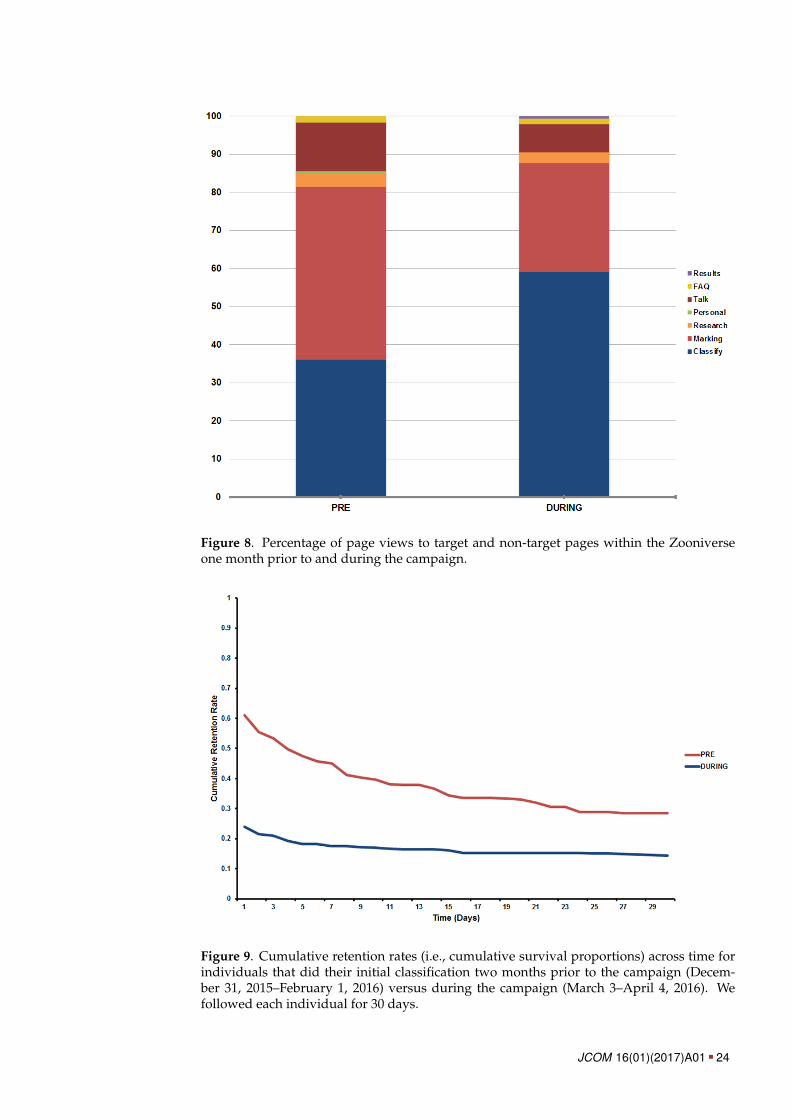
Figure 8. Percentage of page views to target and non-target pages within the Zooniverseone month prior to and during the campaign.
Figure 9. Cumulative retention rates (i.e., cumulative survival proportions) across time forindividuals that did their initial classification two months prior to the campaign (Decem-ber 31, 2015–February 1, 2016) versus during the campaign (March 3–April 4, 2016). Wefollowed each individual for 30 days.
JCOM 16(01)(2017)A01 24
References Bonney, R., Cooper, C. B., Dickinson, J., Kelling, S., Phillips, T., Rosenberg, K. V. andShirk, J. (2009a). ‘Citizen Science: a Developing Tool for Expanding ScienceKnowledge and Scientific Literacy’. BioScience 59 (11), pp. 977–984.DOI: 10.1525/bio.2009.59.11.9.
Bonney, R., Ballard, H., Jordan, R., McCallie, E., Phillips, T., Shirk, J. andWilderman, C. C. (2009b). Public Participation in Scientific Research: Defining theField and Assessing Its Potential for Informal Science Education. A CAISE InquiryGroup Report. Washington, DC, U.S.A.: Center for Advancement of InformalScience Education (CAISE). URL: http://www.informalscience.org/public-participation-scientific-research-defining-field-and-assessing-its-potential-informal-science.
Bradford, B. M. and Israel, G. D. (2004). Evaluating Volunteer Motivation for SeaTurtle Conservation in Florida. Gainesville, FL, U.S.A.: University of Florida,Agriculture Education, Communication Department, Institute of Agricultureand Food Sciences, AEC, 372.
Brown, T. B., Hultine, K. R., Steltzer, H., Denny, E. G., Denslow, M. W., Granados, J.,Henderson, S., Moore, D., Nagai, S., SanClements, M., Sánchez-Azofeifa, A.,Sonnentag, O., Tazik, D. and Richardson, A. D. (2016). ‘Using phenocams tomonitor our changing Earth: toward a global phenocam network’. Frontiers inEcology and the Environment 14 (2), pp. 84–93. DOI: 10.1002/fee.1222.
Chaffey, D. (2016). Ecommerce conversion rates. URL: http://www.smartinsights.com/ecommerce/ecommerce-analytics/ecommerce-conversion-rates/.
Chu, M., Leonard, P. and Stevenson, F. (2012). ‘Growing the Base for CitizenScience: Recruiting and Engaging Participants’. In: Citizen Science: PublicParticipation in Environmental Research. Ed. by J. L. Dickinson and R. Bonney.Ithaca, NY, U.S.A.: Cornell University Press, pp. 69–81.URL: http://www.cornellpress.cornell.edu/book/?GCOI=80140100107290.
Cooper, C. B., Dickinson, J., Phillips, T. and Bonney, R. (2007). ‘Citizen science as atool for conservation in residential ecosystems’. Ecology and Society 12 (2), p. 11.URL: http://www.ecologyandsociety.org/vol12/iss2/art11/.
Cox, J., Oh, E. Y., Simmons, B., Lintott, C. L., Masters, K. L., Greenhill, A.,Graham, G. and Holmes, K. (2015a). ‘Defining and Measuring Success in OnlineCitizen Science: A Case Study of Zooniverse Projects’. Computing in Science &Engineering 17 (4), pp. 28–41. DOI: 10.1109/MCSE.2015.65.
Cox, J., Oh, E. Y., Simmons, B., Graham, G., Greenhill, A., Lintott, C., Masters, K.and Woodcock, J. (2015b). Doing Good Online: An Investigation into theCharacteristics and Motivations of Digital Volunteers. SSRN.URL: http://ssrn.com/abstract=2717402.
Crall, A. W., Jordan, R., Holfelder, K., Newman, G. J., Graham, J. and Waller, D. M.(2013). ‘The impacts of an invasive species citizen science training program onparticipant attitudes, behavior, and science literacy’. Public Understanding ofScience 22 (6), pp. 745–764. DOI: 10.1177/0963662511434894. PMID: 23825234.
Crimmins, T. M., Weltzin, J. F., Rosemartin, A. H., Surina, E. M., Marsh, L. andDenny, E. G. (2014). ‘Focused Campaign Increases Activity Among Participantsin Nature’s Notebook, a Citizen Science Project’. Natural Sciences Education 43(1), pp. 64–72.
Curtis, V. (2015). ‘Motivation to Participate in an Online Citizen Science Game: aStudy of Foldit’. Science Communication 37 (6), pp. 723–746.DOI: 10.1177/1075547015609322.
JCOM 16(01)(2017)A01 25
Dickinson, J. L. and Bonney, R., eds. (2012). Citizen Science: Public Participation inEnvironmental Research. Ithaca, NY, U.S.A.: Cornell University Press.URL: http://www.cornellpress.cornell.edu/book/?GCOI=80140100107290.
Dickinson, J. L., Shirk, J., Bonter, D., Bonney, R., Crain, R. L., Martin, J., Phillips, T.and Purcell, K. (2012). ‘The current state of citizen science as a tool for ecologicalresearch and public engagement’. Frontiers in Ecology and the Environment 10 (6),pp. 291–297. DOI: 10.1890/110236.
Franzoni, C. and Sauermann, H. (2014). ‘Crowd science: The organization ofscientific research in open collaborative projects’. Research Policy 43 (1), pp. 1–20.DOI: 10.1016/j.respol.2013.07.005.
Jochum, V. and Paylor, J. (2013). New ways of giving time: Opportunities andchallenges in micro-Volunteering: A literature review. London, U.K.: NCVO.
Kosmala, M., Hufkens, K. and Gray, J. (2016). ‘Reddit AMA’. The Winnower.DOI: 10.15200/winn.145942.24206.
Kosmala, M., Crall, A., Cheng, R., Hufkens, K., Henderson, S. and Richardson, A.(2016). ‘Season Spotter: Using Citizen Science to Validate and Scale PlantPhenology from Near-Surface Remote Sensing’. Remote Sensing 8 (9), p. 726.DOI: 10.3390/rs8090726.
Kullenberg, C. and Kasperowski, D. (2016). ‘What is Citizen Science? AScientometric Meta-Analysis’. Plos One 11 (1), e0147152.DOI: 10.1371/journal.pone.0147152.
Land-Zandstra, A. M., Devilee, J. L. A., Snik, F., Buurmeijer, F. and van denBroek, J. M. (2015). ‘Citizen science on a smartphone: Participants’ motivationsand learning’. Public Understanding of Science 25 (1), pp. 45–60.DOI: 10.1177/0963662515602406.
Landing Page Conversion Course (2013). Part 3: Call-to-Action Placement and Design.URL: http://thelandingpagecourse.com/call-to-action-design-cta-buttons/.
Lee, K. (2015). How to Create a Social Media Marketing Strategy from Scratch.URL: https://blog.bufferapp.com/social-media-marketing-plan.
Masters, K., Oh, E. Y., Cox, J., Simmons, B., Lintott, C., Graham, G., Greenhill, A.and Holmes, K. (2016). ‘Science learning via participation in online citizenscience’. JCOM 15 (3), A07.URL: https://jcom.sissa.it/archive/15/03/JCOM_1503_2016_A07.
Morais, A. M. M., Raddick, J. and Santos, R. D. C. (2013). ‘Visualization andcharacterization of users in a citizen science project’. In: Proc. SPIE 8758,Next-Generation Analyst, p. 87580L. DOI: 10.1117/12.2015888.
Moz (2016a). Chapter 6: Facebook.URL: https://moz.com/beginners-guide-to-social-media/facebook.
— (2016b). Chapter 7: Twitter.URL: https://moz.com/beginners-guide-to-social-media/twitter.
Newman, G., Zimmerman, D., Crall, A., Laituri, M., Graham, J. and Stapel, L.(2010). ‘User-friendly web mapping: lessons from a citizen science website’.International Journal of Geographical Information Science 24 (12), pp. 1851–1869.DOI: 10.1080/13658816.2010.490532.
Newman, G., Graham, J., Crall, A. and Laituri, M. (2011). ‘The art and science ofmulti-scale citizen science support’. Ecological Informatics 6 (3), pp. 217–227.DOI: 10.1016/j.ecoinf.2011.03.002.
Nov, O., Arazy, O. and Anderson, D. (2011). ‘Technology-mediated citizen scienceparticipation: a motivational model’. In: Proceedings of the Fifth internationalAAAI Conference on Weblogs and Social Media. (Barcelona, Spain), pp. 249–256.
JCOM 16(01)(2017)A01 26
Owens, S. (7th October 2014). ‘The World’s Largest 2-Way Dialogue betweenScientists and the Public’. Scientific American.URL: https://www.scientificamerican.com/article/the-world-s-largest-2-way-dialogue-between-scientists-and-the-public/.
Prather, E. E., Cormier, S., Wallace, C. S., Lintott, C., Raddick, M. J. and Smith, A.(2013). ‘Measuring the Conceptual Understandings of Citizen ScientistsParticipating in Zooniverse Projects: A First Approach’. Astronomy EducationReview 12 (1), 010109, pp. 1–14. DOI: 10.3847/AER2013002.
Purcell, K., Garibay, C. and Dickinson, J. L. (2012). ‘A gateway to science for all:celebrate urban birds’. In: Citizen Science: Public Participation inEnvironmental Research. Ed. by J. L. Dickinson and R. Bonney. Ithaca, NY,U.S.A.: Cornell University Press.URL: http://www.cornellpress.cornell.edu/book/?GCOI=80140100107290.
Raddick, M. J., Bracey, G., Gay, P. L., Lintott, C. J., Murray, P., Schawinski, K.,Szalay, A. S. and Vandenberg, J. (2010). ‘Galaxy Zoo: Exploring the Motivationsof Citizen Science Volunteers’. Astronomy Education Review 9 (1), 010103,pp. 1–18. DOI: 10.3847/AER2009036. arXiv: 0909.2925.
Raddick, M. J., Bracey, G., Gay, P. L., Lintott, C. J., Cardamone, C., Murray, P.,Schawinski, K., Szalay, A. S. and Vandenberg, J. (2013). ‘Galaxy Zoo:Motivations of Citizen Scientists’. Astronomy Education Review 12 (1),pp. 010106–010101. DOI: 10.3847/AER2011021. arXiv: 1303.6886.
Reddit Inc. (2016). About Reddit. URL: https://about.reddit.com/.Richardson, A. D., Braswell, B. H., Hollinger, D. Y., Jenkins, J. P. and Ollinger, S. V.
(2009). ‘Near-surface remote sensing of spatial and temporal variation incanopy phenology’. Ecological Applications 19 (6), pp. 1417–1428.DOI: 10.1890/08-2022.1.
Robson, C., Hearst, M. A., Kau, C. and Pierce, J. (2013). ‘Comparing the use ofSocial Networking and Traditional Media Channels for Promoting CitizenScience’. Paper presented at the CSCW 2013. San Antonio, TX, U.S.A.
Sauermann, H. and Franzoni, C. (2015). ‘Crowd science user contribution patternsand their implications’. Proceedings of the National Academy of Sciences 112 (3),pp. 679–684. DOI: 10.1073/pnas.1408907112.
Sonnentag, O., Hufkens, K., Teshera-Sterne, C., Young, A. M., Friedl, M.,Braswell, B. H., Milliman, T., O’Keefe, J. and Richardson, A. D. (2012). ‘Digitalrepeat photography for phenological research in forest ecosystems’. Agriculturaland Forest Meteorology 152, pp. 159–177.DOI: 10.1016/j.agrformet.2011.09.009.
Stafford, R., Hart, A. G., Collins, L., Kirkhope, C. L., Williams, R. L., Rees, S. G.,Lloyd, J. R. and Goodenough, A. E. (2010). ‘Eu-Social Science: The Role ofInternet Social Networks in the Collection of Bee Biodiversity Data’. PLoS ONE5 (12), e14381. DOI: 10.1371/journal.pone.0014381.
Stukas, A. A., Worth, K. A., Clary, E. G. and Snyder, M. (2009). ‘The Matching ofMotivations to Affordances in the Volunteer Environment: An Index forAssessing the Impact of Multiple Matches on Volunteer Outcomes’. Nonprofitand Voluntary Sector Quarterly 38 (1), pp. 5–28. DOI: 10.1177/0899764008314810.
Triezenberg, H. A., Knuth, B. A., Yuan, Y. C. and Dickinson, J. L. (2012).‘Internet-Based Social Networking and Collective Action Models of CitizenScience: Theory Meets Possibility’. In: Citizen Science: Public Participation inEnvironmental Research. Ed. by J. L. Dickinson and R. Bonney. Ithaca, NY,U.S.A.: Cornell University Press, pp. 214–225.URL: http://www.cornellpress.cornell.edu/book/?GCOI=80140100107290.
JCOM 16(01)(2017)A01 27
Twitter Inc. (2016). Create your Twitter content strategy.URL: https://business.twitter.com/en/basics/what-to-tweet.html.
Uchoa, A. P., Esteves, M. G. P. and de Souza, J. M. (2013). ‘Mix4Crowds — Toward aframework to design crowd collaboration with science’. In: Proceedings of the2013 IEEE 17th International Conference on Computer Supported Cooperative Work inDesign (CSCWD), pp. 61–66. DOI: 10.1109/CSCWD.2013.6580940.
Wenger, E., McDermott, R. and Snyder, W. M. (2002). Cultivating Communities ofPractice. Boston, MA, U.S.A.: Harvard Business Review Press.
Wiggins, A. and Crowston, K. (2010). ‘Developing a Conceptual Model of VirtualOrganizations for Citizen Science’. International Journal of Organizational Designand Engineering 1 (1), pp. 148–162. DOI: 10.1504/IJODE.2010.035191.
Wright, D. R., Underhill, L. G., Keene, M. and Knight, A. T. (2015). ‘Understandingthe Motivations and Satisfactions of Volunteers to Improve the Effectiveness ofCitizen Science Programs’. Society & Natural Resources 28 (9), pp. 1013–1029.DOI: 10.1080/08941920.2015.1054976.
Authors Alycia Crall serves as a science educator and evaluator for the National EcologicalObservatory Network. She received her bachelor degrees in Environmental HealthScience and Ecology at the University of Georgia, her master’s degree in Ecology atColorado State University, and her Ph.D. in Environmental Studies at theUniversity of Wisconsin-Madison. Her research interests include citizen science,socio-ecological systems, informal science education, and program evaluation.E-mail: [email protected].
Margaret Kosmala is a global change ecologist with a focus on the temporaldynamics of populations, communities, and ecosystems at local to continentalscales. She creates and uses long-term and broad-scale datasets to answer questionsabout how human-driven environmental change affects plants and animals. Inorder to generate and process these large data sets, she creates and runs onlinecitizen science projects, practices crowdsourcing, runs experiments, employs datamanagement techniques, and designs and implements advanced statistical andcomputational models. E-mail: [email protected].
Rebecca Cheng, Ph.D. is a learning scientist and cognitive psychologist inhuman-computer interaction. She received her doctorate from George MasonUniversity, Fairfax, VA. In her research, she applied a cognitive-affective integratedframework, with eye tracking and scanpath analysis, to understand the gameplayprocess and science learning in Serious Educational Games.E-mail: [email protected].
Jonathan Brier is a Ph.D. student at the College of Information Studies at Universityof Maryland, advised by Andrea Wiggins. His research covers evaluation,development, and evolution of cyberinfrastructure and online communities.Currently, he is focused on the evaluation of the sustainability of onlinecommunities in the domain of citizen science. He advises the SciStarter citizenscience community, holds a MS in Information from the University of Michigan,and a BS in Media and Communication Technology from Michigan StateUniversity. E-mail: [email protected].
JCOM 16(01)(2017)A01 28
Darlene Cavalier is a Professor at Arizona State University, founder of SciStarter,founder of Science Cheerleader, and cofounder of ECAST: Expert and CitizenAssessment of Science and Technology. She is a founding Board Member of theCitizen Science Association, senior advisor at Discover Magazine, on the EPA’sNational Advisory Council for Environmental Policy and Technology, providesguidance to the White House’s OSTP and federal agencies, and is co- author of TheRightful Place of Science: Citizen Science, published by ASU.E-mail: [email protected].
Dr. Sandra Henderson is the Director of Citizen Science at the National EcologicalObservatory Network (NEON) in Boulder, Colorado. Her background is in climatechange science education with an emphasis on educator professional developmentand citizen science outreach programs. Before becoming a science educator, sheworked as a project scientist studying the effects of climate change on terrestrialecosystems. In 2013, she was honored by the White House for her work in citizenscience. E-mail: [email protected].
Andrew Richardson is an Associate Professor of Organismic and EvolutionaryBiology at Harvard University. His lab’s research focuses on global change ecology,and he is particularly interested in how different global change factors alterecosystem processes and biosphere-atmosphere interactions. His research has beenfunded by the National Science Foundation, NOAA, the Department of Energy,and NASA. Richardson has a Ph.D. from the School of Forestry and EnvironmentalStudies at Yale University, and an AB in Economics from Princeton University.E-mail: [email protected].
Crall, A., Kosmala, M., Cheng, R., Brier, J., Cavalier, D., Henderson, S. andHow to citeRichardson, A. D. (2017). ‘Volunteer recruitment and retention in online citizenscience projects using marketing strategies: lessons from Season Spotter’.JCOM 16 (01), A01.
This article is licensed under the terms of the Creative CommonsAttribution - NonCommercial - NoDerivativeWorks 4.0 License.ISSN 1824-2049. Published by SISSA Medialab. jcom.sissa.it
JCOM 16(01)(2017)A01 29