Analysis of VA Health Care Utilization among - Public Health

Voluntary private health insurance and health care utilization of
people aged 50+
PRELIMINARY VERSION
Anikó Bíró�
Central European University
March 30, 2011
Abstract
Does voluntary private health insurance coverage in�uence health care utilization in countries where
the coverage ratio with public health insurance is high? I estimate this e¤ect using the Survey of Health,
Ageing and Retirement in Europe. Handling the potential endogeneity of voluntary insurance coverage
and the large fraction of zero observations in the utilization models in�uences the empirical results. I
show that the e¤ect of private health insurance coverage on inpatient and outpatient care utilization is
not trivial even in countries with generous public health funding. The main �nding is that voluntary
private health insurance coverage increases dental care utilization, but decreases the visits to general
practitioners. Private insurance is estimated to have little and insigni�cant in�uence on the utilization
of inpatient care and outpatient specialist care. The magnitude of the e¤ect of voluntary private health
insurance on health care utilization varies with the characteristics of the health care systems.
JEL codes: C25, C35, G22, I11,
1 Introduction
In most of the European countries there is almost universal coverage with public health insurance, and more
than 50% of health expenditures are �nanced by the general government. Given this institutional background
does voluntary private health insurance (PHI) in�uence health care utilization? I focus on the utilization
of hospital, general practitioner (GP), specialist and dental care among people aged 50 and over. Due to
the age restriction the sample used is not representative for the whole population of the analyzed countries.
However, health care utilization increases on average with age, therefore the results can be indicative for
the overall health care systems. The utilization of the four types of health services is analyzed separately,
since insurance coverage and other individual characteristics have di¤erent in�uencing e¤ects on those. For
instance, utilization of hospital care is rather determined by the health condition of the patient than by the
individual utility maximizing behavior.
Despite the broad coverage with public insurance, the coverage rate with voluntary private health insur-
ance is still not negligible in the countries analyzed. Whether such private insurance increases health care
utilization or private care utilization, or decreases out-of-pocket expenditures is of interest for the insurance
�E-mail:[email protected]
1

companies and for the public policy, as well. In this paper I estimate the e¤ects of PHI on health care
utilization, and also analyze how these e¤ects vary with some institutional characteristics of the countries.
A seminal empirical paper analyzing the e¤ect of health insurance on the demand for medical care is
of Manning et al. (1987). Based on the RAND health insurance experiment conducted in the U.S., they
show that more generous health insurance plans increase the demand for outpatient services. Due to the
experimental design, the authors do not have to worry about the endogeneity of health insurance cover-
age. Gibbons and Wilcox-Gok (1998) also �nd positive e¤ect of health insurance coverage on health care
utilization probability, using the National Medical Expenditure Survey from the United States. In Europe
mandatory health insurance is more widespread, therefore private health insurance might have smaller role
in in�uencing health care utilization.
Two closely related papers which use European data are of Jones et al. (2006) and Paccagnella et al. (2008).
Jones et al. (2006) �nd a positive e¤ect of supplementary health insurance coverage on the probability of
visiting a specialist. Their results are based on samples of four countries from the European Community
Household Panel User Database (EHCP-UDB). My research di¤ers from theirs not only in the wider country
coverage of the sample used, but also in the di¤erent methodology and extended research question - I analyze
the e¤ect of PHI on hospital, GP and dental care utilization, as well. Paccagnella et al. (2008) give a detailed
analysis of the determinants of voluntary PHI coverage in Europe, based on the �rst wave of the SHARE
database.1 They also analyze the e¤ect of voluntary PHI on out-of-pocket expenditures, and �nd that this
e¤ect varies across countries. The demand for voluntary private health insurance, and its e¤ect on medical
expenditures based on the SHARE data are analyzed to some extent by Holly et al. (2005). They �nd some
evidence that voluntary PHI coverage may have a positive e¤ect on out-of-pocket medical expenditures.
My paper contributes to the literature in providing an international comparison about the utilization
enhancing e¤ect of voluntary private health insurance coverage. An additional novelty is to analyze the
e¤ect of voluntary private health insurance coverage on the utilization of medical services if health care
utilization is modelled as two-stage decision, and the endogeneity of PHI is taken into account. I identify the
e¤ect of PHI on health care utilization by using the assumption that only current employment characteristics
in�uence the utilization, whereas past employment characteristics in�uence PHI coverage.
Section 2 provides an overview of the health care institutions and the role of private health insurance
in the analyzed countries. The economic considerations underlying the empirical analysis are discussed in
Section 3. Section 4 presents the empirical models, and the data used is described in Section 5. Section 6
discusses the empirical results, and Section 7 concludes.
2 Institutional background
In the empirical analysis I investigate the e¤ect of voluntary PHI on health care utilization in eleven European
countries. Although all of these are developed countries and except for Switzerland these are EU member
states, there are still considerable di¤erences in the health care institutions. Some of these di¤erences are
related to health care �nancing and health care resources. The institutional background in�uences the
role PHI has. The demand for PHI, and its e¤ect on health care utilization depend among others on
the out-of-pocket cost of medical services. If the services are covered by the mandatory public insurance
then the out-of-pocket costs cannot be further reduced by the voluntary PHI. I return to further economic
considerations in Section 3.1Details about the Survey of Health, Ageing and Retirement in Europe (SHARE) database are provided in Section 5.
2

In this section I summarize some basic features of the health care systems in the analyzed countries. I
focus on those characteristics which might indicate the role PHI has in �nancing health care. In Table 1 I
present a selection of indicators related to the insurance markets and to the health care institutions. Except
for the data presented in the �rst column, all indicators are based on aggregate statistics provided by the
WHO.2 I give a detailed explanation in Section 5 how the PHI indicator was generated.
According to the calculated correlation coe¢ cients, PHI coverage is more prevalent among people aged
50 or over in those countries where the public health expenditure per inhabitant or relative to GDP is higher.
On the other hand, the correlation coe¢ cient with the ratio of health expenditures covered by public sources
is close to zero. Thus the demand for PHI seems to be uncorrelated with the generosity of the public health
care measured by the ratio of funding coming from the government. The positive correlation of coverage rate
with the last two public health expenditure indicators can be the result of the following in�uencing e¤ect:
more developed and widespread health care resources can increase not only the public health expenditures,
but also the demand for PHI coverage.
In Section 6.1 I present that even if a rich set of individual characteristics are controlled for, the country
dummies remain signi�cantly di¤erent from zero in the model of PHI coverage. Analyzing the in�uencing
mechanisms of private health insurance coverage in further details is out of the scope of this paper.
PHI coverage Public per Public health Public healthratio (%) total health expenditures per expenditures
in the sample expenditures (%) inhabitant ($ ppp) per GDP (%)AT 23.3 75.7 2,568 7.8BE 76.1 72.9 2,172 7.0DK 36.3 83.8 2,531 7.8FR 84.2 79.3 2,550 8.7DE 21.6 77.0 2,435 8.1GR 5.2 59.1 1,189 4.3IT 5.6 76.0 1,823 6.6NL 81.9 64.4 1,936 5.8ES 9.2 70.5 1,487 5.7SE 9.1 81.8 2,425 7.6CH 32.7 58.4 2,334 6.7Source SHARE WHO WHO WHO
Table 1: Heath insurance and health expenditure (HE) indicators, 2004
In the following I summarize some further health care system characteristics of the countries included.
These characteristics refer to year 2004, when the survey data I use was collected, and are based on
OECD (2004), Paccagnella et al. (2008), and Thomson et al. (2009).
Except for Switzerland, all analyzed countries have mandatory public health insurance. In Switzerland
there is mandatory insurance, but that is provided by private insurance companies. The coverage with the
mandatory insurance is almost universal in all countries except for Germany and Netherlands. In Germany
the civil servants, high earners, and self employed are exempt, whereas in the Netherlands the high earners
are exempt (prior to 2006).
Although there is almost universal coverage with the mandatory (public) health insurance, some cost
sharing arrangements still apply in all countries. These arrangements vary across the countries. It varies to
which services and to whom does the cost sharing apply, and also its magnitude di¤ers across the countries.2The WHO data are based on the WHO European health for all (HFA) database. In the WHO statistics the public health
expenditure measure for Switzerland includes the expenditures covered by mandatory private health insurance.
3

For example, in Austria and Sweden it applies to most services, whereas in Spain there is no cost sharing for
GP or specialist care. In some countries, as in Austria, Belgium, and Italy, those with low income or with
chronic health problems are exempt from the cost sharing.
Private health insurance can be the primary (principal or substitutive) health insurance for those not
covered by public insurance. Otherwise, PHI can have supplementary or complementary role. Supplementary
PHI covers services not insured by the public insurance. This is the most prevalent role of PHI in Europe.
Complementary PHI can be contracted to cover cost sharing for services not fully �nanced by the public
insurance. This is widespread in France, where the complementary PHI is even provided free of charge for
those with low income. In the following I call "voluntary private health insurance" all those private health
insurance contracts which do not have primary function. I give some additional statistics about voluntary
private health insurance coverage in Section 5.
3 Economic considerations
In this section I outline the economic considerations on how voluntary private health insurance coverage
can a¤ect health care utilization. My aim here is to provide some theoretical motivation to the empirical
analysis. The key point is that health insurance coverage can decrease the observed costs of health services
or can make higher quality of services available, both of which increase the demand for medical care.
An important assumption throughout this paper is that PHI coverage is predetermined. The main reason
for this assumption is that individuals above a given age are generally excluded from contracting PHI (details
can be found in Mossialos and Thomson (2004)). The decision about buying private health insurance is likely
to be made before age 50, during the earlier working life.3 This decision can be in�uenced by the insurance
costs and availability, and by the potential bene�ts of such a contract, which depends on risk-aversion, risk of
future health problems and potential health care expenditures (in�uenced also by the health care system). In
some countries the majority of health insurance policies are purchased by groups, rather than by individuals.
These groups are typically employment-based groups, which have a predominant role e.g. in the Netherlands
and in Sweden (according to Mossialos and Thomson (2004), Table 10).
Although PHI is predetermined in this model, some of the in�uencing factors of coverage are time-
invariant, like gender, education, cohort-e¤ects, or also the main features of the health care system, at least
in the short to middle run. Thus, it is possible to estimate the e¤ect of such time-invariant factors on the
likelihood of PHI coverage.
I assume that individuals maximize a deterministic utility function, which depends on consumption and
health. Future health is in�uenced by the utilization of health care. Decision about making an initial contact
with a physician or going to hospital is made by the individual. It is a subject of modelling assumption
whether the frequency of doctoral visits afterwards, and the length of hospital stay are basically determined
by the suppliers of health care or these are also decided by the patients.
Expenditure on consumption goods and on medical services are limited by income and wealth. The cost
of medical services depends on several factors: on the type or quality of the service, whether the individual
has private health insurance, and on the country-speci�c features of health care. In the empirical analysis I
control for the country-speci�c e¤ects by including country dummies in the utilization models, and allowing
country-speci�c e¤ect of some observables.
3The question about PHI coverage is not included in the second wave of the SHARE, but there is a question about changein health insurance coverage since the last interview. Although this question is not restricted to private insurance, 89% of therespondents report no change in coverage for health problems, which indicates little time variation in insurance coverage.
4
Assuming positive but diminishing marginal utility of consumption and health, and positive but dimin-
ishing marginal product of medical care on health, it can be derived that the demand for health care services
decreases with realized price and increases with service quality. Thus, according to a simple health care
demand model, private health insurance coverage is expected to increase the demand for health services.
This e¤ect can be due to moral hazard or to the access to services unavailable without PHI coverage.4 On
the other hand, if health care prices are generally low, and utilization is determined by health problems then
insurance coverage might have moderate e¤ect on utilization. As discussed in Section 6, the empirical results
a¢ rm the positive e¤ect of voluntary PHI on health care utilization only partially.
4 Empirical models
I estimate the insurance coverage and utilization models on a pooled sample of the analyzed countries. A
key modelling question is whether the partial e¤ects of exogenous variables are the same across countries.
Bago d�Uva and Jones (2009) reject the equality of income and education e¤ects on health care utilization
across European countries. However, some assumption of equality is needed in order to avoid the problem
of small country-speci�c samples. Apart from including country dummies in the empirical models, I allow
the e¤ect of income and wealth on utilization to be country-speci�c. The out-of-pocket costs of health care
services vary across countries, these di¤erences imply varying e¤ect of income and wealth on utilization. The
liquidity of certain wealth components, thus their e¤ect on health care utilization might also vary across
countries. The e¤ect of voluntary PHI on health care utilization is also allowed to be country speci�c.
I consider two categories of health demand models: those where the utilization is a result of a single
decision, and those where the decision is made in two stages. The reason behind the second type of models
is that many people do not utilize health care at all, and the e¤ect of observables on the probability of
utilization can be di¤erent from their e¤ect on the positive amount of utilization.
Following the model of Grossman (1972), most empirical health care models include a rich set of regressors
to capture health, and health production characteristics. This latter can include the price of health care,
and standard socioeconomic variables that a¤ect the availability of services, and capture tastes, preferences.
Such empirical models of health care demand are applied among others by Hunt-McCool et al. (1994) and
Gibbons and Wilcox-Gok (1998). This strand of the literature follows the consumer theory approach. The
other approach is based on the principal-agent set-up, where the initial contact is decided by the patient,
but afterwards the utilization is determined by the physician.
A detailed discussion about econometric issues in estimating medical care usage models is given by
Jones (2000). Basic issues are that the dependent variable is not continuous, there is a large number of zero
observations, which can be modelled with one-step or two-step models, and there are usually measurement
problems as well.
In my empirical analysis I account for the potential endogeneity of voluntary PHI, and also for the large
number of zero observations. The preferred speci�cation is a two-part model, which takes into account both
of the empirical di¢ culties: it models the endogenous PHI coverage and also the zero utilization decisions.
As a benchmark model, I assume that health care utilization is the result of a single decision, and treat
voluntary PHI as exogenous. The preferred speci�cation is a two-part model. In this approach I model
nonzero utilization and the amount of utilization separately, and consider the voluntary PHI indicator as
4Jones et al. (2006) di¤erentiate four in�uencing mechanisims of health insurance on utilization: 1. moral hazard e¤ect dueto reduced prices, 2. risk reduction e¤ect due to reduced �nancial uncertainty, 3. income transfer e¤ect (ex post transfer fromthe healthy to the ill), and 4. access e¤ect due to access to high quality services.
5

endogenous in both parts of the model. In this version of the model the e¤ects of the individual characteristics
are allowed to be di¤erent in the two parts of the utilization decision. For handling the endogeneity of PHI
I apply bivariate probit estimation, and the method of two-stage residual inclusion (2SRI) suggested by
Terza et al. (2008).
4.1 Benchmark model
As the benchmark case, I assume that health care utilization is a one-stage decision, and voluntary PHI
coverage is exogenous in this decision. This simple model will be compared to the preferred two-part
speci�cation. Since there is a large ratio of zero observations among the reported numbers of hospital
nights and of doctoral visits, assuming Poisson distribution would be unrealistic. I assume negative binomial
distribution, which �ts the data indeed relatively well.5
The benchmark utilization model is the following:
E [YjijXi; PHIi; "1ji] = exp(Xi�1jk + 1jkPHIi + "1ji); (1)
where index i refers to individual i, j = 1; 2; 3 di¤erentiate the parameters and variables according to the
dependent variable, and k is the country index: The dependent variable Y is either the number of doctoral
visits (GP and specialist visits) or hospital nights, PHI indicates the coverage with voluntary private health
insurance, and X is a vector of variables including a rich set of socioeconomic indicators that might in�uence
health care utilization through costs, potential bene�ts, and preferences. In particular, X includes age,
gender, marital status, dummy variable for having children, logarithmic income, logarithmic value of the
main residence (replaced with zero if the reported value of the main residence is zero), education (four
categories: ISCED codes 0-1, 2, 3-4 and 5-6), employment status, indicators of the current employment
as civil servant, public sector employee or self employed, �rm size at current employment, living area and
smoking dummies (as proxies for health behavior), country dummies, and three health measures. In the
outpatient care utilization models the education level and the number of health problems of the partner are
also included as regressors. These can serve as proxies for the partner�s health care utilization, which might
induce utilization by the respondent. The e¤ects of income, wealth, and voluntary PHI coverage are allowed
to be country-speci�c. Further details about the data are given in Section 5.
I assume that there is no reverse causality from health care utilization to the reported health problems
within one year. This assumption is more reasonable for chronic conditions and limitations in activities of
daily living than for reported symptoms, in which case it is a data limitation that health symptoms of the
previous year cannot be observed.
"1 is a latent heterogeneity term, it is assumed that exp("1) has a gamma distribution. "1 includes
unobservables which in�uence health care demand, but are independent from the regressors. These can be
such speci�c health characteristics which are not captured by the included health measures, but can also be
other factors like being acquainted with a physician.
Since spouses might make joint decisions on health care utilization (and on PHI coverage), I allow the error
terms to be correlated across the household members, and the standard errors are clustered by household.
5A simple way to check the distributional assumption is using the nbvargr command in Stata, written by Philip B. Ender.Nevertheless, based on Gourieroux et al. (1984), if the mean is correctly speci�ed, the maximum likelihood estimation givesconsistent results even if the negative binomial distribution assumption does not hold.
6

4.2 Two-part model
The assumption that PHI coverage is exogenous in the health care demand model might be unrealistic,
even if it is predetermined. Time-invariant but unobserved taste shifters might be correlated both with
voluntary PHI coverage and health care utilization. It can be due to adverse selection and to positive
selection, as well. First, the problem of adverse selection arises if those people are more likely to be covered
with PHI who are more likely to utilize health care due to unobserved health problems or due to less
subjective disutility attached to medical care. Second, there is positive selection if PHI is more likely to be
purchased by wealthier individuals who are at the same time in better health condition, thus less likely to
utilize health care. Although I control for income and wealth in the empirical models, these controls cannot
capture perfectly the economic situation of the respondents. If PHI is endogenous in equation (1) then the
consistency of the benchmark estimation is violated.
In the preferred two-part speci�cation I relax the assumption that health care utilization is a one-stage
decision, and also assume that PHI is endogenous both in the �rst and second stage. The underlying
assumption is that separate processes drive the probability of making any doctoral visits, and the exact
number of visits (similarly for hospital stays). The statistical reason for applying two-stage modelling is the
relatively large number of observed zero outcomes.6
Following the argument of Dow and Norton (2003), if zero values are "true zeros", i.e. the results of corner
solution and not of sample selection then applying sample selection estimation methods can be misleading,
whereas two-part models can be appropriate. In addition, Norton et al. (2008) analyze the properties of
sample selection and two-part models if there is a large fraction of zero observations and there are no
exclusion restrictions. They show that two-part models can be superior even if the errors in the two parts
of the models are correlated. In the health care utilization models of this paper there are no clear exclusion
restrictions: the same observed characteristics drive the probability of health care utilization and the amount
of utilization. This modelling feature calls for the application of two-part models, instead of selection models.
The two-part model is based on the assumption that the second stage error term has zero expected
value, conditional on positive outcome and on the exogenous regressors. Based on this assumption the two
parts of the model can be estimated separately. The overall marginal e¤ect of PHI can be calculated as a
combination of the two sets of estimation results. The basic two-part model has to be modi�ed due to the
potential endogeneity of PHI in the utilization models.
The �rst stage equations model the voluntary PHI coverage together with the probability of having any
GP visits, specialist visits or hospital stays (Pos_Yj). This �rst stage model can also be estimated for dental
care, for which only a binary indicator of utilization is available.
PHI�i = Zi�k + �i
PHIi = 1(PHI�i > 0) (2)
Pos_Y �ji = Xi�2jk + 2jkPHIi + "2ji
Pos_Yji = 1(Pos_Y �ji > 0): (3)
6Two-stage modelling is a standard approach in modelling health care demand, see e.g. Zimmerman Murphy (1987),Pohlmeier and Ulrich (1995), and Werblow et al. (2007).An alternative modelling strategy could be the application of �nite mixture (latent class) models, as e.g.
Deb and Trivedi (1997). Such models allow for heterogeneity in the population, but do not apply strict separation betweenthose who utilize and do not utilize health care services. Then the marginal e¤ects are allowed to vary among "latent classes"of the population. I apply the simpler two-part modelling approach, but extend that with handling the endogeneity of PHIcoverage.
7

The variables in vector Z which can also in�uence health care utilization are the following: age, gender,
marital status, having children, wealth and income measures, education level, living area, and country
dummies. Again, the income and wealth variables are allowed to have country-speci�c e¤ect (k is the
country index). The reason for excluding smoking indicators and health measures from the regressors is that
PHI is treated as predetermined, therefore I exclude those indicators that are likely to have changed since
contracting the insurance.7 The instruments for PHI coverage included in vector Z are the �rm size and
the last employment status indicators of the individual. Equation (2) is a reduced form model of insurance
coverage where potential interactions between health and PHI coverage are not modelled. The aim of this
speci�cation is to include such control variables that can capture the socioeconomic circumstances when the
decision on PHI coverage was made, keeping in mind that this decision was made earlier.
The identifying instruments of voluntary PHI are indicators of the last employment: the number of people
employed at the last job ("�rm size" categories), and whether the respondent was public employee, civil
servant or self-employed in the last job. The �rm size indicator is based on the number of employees at the
current or last job. I di¤erentiate six categories from 1 to 500 plus employees, and an additional category holds
if the respondent is self-employed or the question is not applicable (25% of the respondent). Occupational
status can in�uence PHI coverage, as it is possible that the insurance is contracted through or supported by
the employer, and in some countries di¤erent insurance regulations hold for the self-employed or civil servants.
Paccagnella et al. (2008) document that in most countries covered by SHARE, voluntary PHI coverage is
predominant among employees of �rms with more than 24 employees. Mossialos and Thomson (2004) also
report that group policies, i.e. voluntary PHI purchased by groups (typically by employers) have a major
role in many European countries. Group policies generally o¤er lower prices and more favorable conditions,
and are often provided as an employee bene�t. The availability of group policies varies with �rm size. The
identi�cation is based on the assumption that only the current characteristics of the employment in�uence
health care utilization decisions, whereas the �rm size at the last employment and the type of the last job
in�uence insurance coverage. Current job characteristics might in�uence health care utilization e.g. through
the availability of health services at the workplace or through required regular health checks. I assume that
after retirement the characteristics of the last job do not have direct e¤ect on health care utilization. Similar
identi�cation strategy is applied by Jones et al. (2006) and Paccagnella et al. (2008).
The regressors included in X are the same as in equation (1). Since some unobservables might a¤ect both
the voluntary PHI coverage and the decision on health care utilization, PHI can be endogenous in equation
(3), and the error terms � and "2 can be correlated. Assuming that � and "2 have bivariate normal distribution
with zero means and unit variances, these two binary models form a bivariate probit model. This model
handles the likely endogeneity of private health insurance in equation (3). The method of multivariate probit
estimation in similar medical care demand framework is also applied by Gibbons and Wilcox-Gok (1998). If
the exogeneity assumptions hold (Z and X are exogenous in equations (2) and (3)), the maximum likelihood
estimation of the bivariate probit models gives consistent estimates.
The nonzero numbers of doctoral visits and hospital nights are estimated by zero-truncated negative
binomial regression. This regression model takes into account that the outcome values are positive counts.
Again, PHI coverage can be endogenous in the utilization models, therefore I apply the method of two-
stage residual inclusion: �rst I estimate a probit model for the probability of PHI coverage (equation (2)),
7Pre-existing conditions can in�uence coverage since those are generally excluded from voluntary PHI cover (seeMossialos and Thomson (2004)), or due to adverse selection. Analyzing the e¤ects of long-term illness measures on PHI coverageis out of the scope of this paper, and would also require additional data.
8
then include the estimated residual as regressor in the zero-truncated negative binomial regression.8 This
2SRI method is an implementation of the method of instrumental variables in nonlinear models. It is
applicable when there are such regressors in a nonlinear model that are correlated with unobserved (latent)
variables, and these unobservables also in�uence the outcome variable. This approach is widely applied in
empirical models in health economics, for a list of citations see Terza et al. (2008). Provided that there are
appropriate instruments for the endogenous regressor, the 2SRI method is consistent.9 I apply maximum
likelihood estimation in both stages. According to Cameron and Trivedi (2005), the consistency of two-step
m-estimation requires that the parameters in the �rst stage are estimated consistently, and the second stage
parameter estimates with �rst stage parameters known would be consistent.
Without conditioning on positive utilization, the expected value of the outcome is:
E[YjijXi; PHIi; ui; "3ji] = exp(Xi�3jk + 3jkPHIi + �j ui + "3ji); (4)
where exp("3) has gamma distribution. u is the �rst stage residual: ui = PHIi � �(Zi�k), where �(:) isthe cumulative standard normal distribution function, and � indicates the estimated value of the parameter
vector from the probit model.10 If PHI is exogenous in the jth health care utilization model then �jshould equal zero. "3 includes unobservables (heterogeneity components) which are independent from the
included regressors. It is assumed in this model that the coe¢ cient of the �rst stage residual is not country
speci�c. This follows from the implicit assumption that the correlation between the unobservables in the
utilization and PHI coverage models is the same across the countries. Without this assumption this simple
2SRI method could not be applied for the pooled sample, and separate �rst stage models would be needed
for all the analyzed countries.
The expression under equation (4) can be used in the likelihood function for positive outcomes. The
outcome of �nal interest is E(YjijXi; PHIi) = Pr(Yji > 0jXi; PHIi) � E(YjijYji > 0; Xi; PHIi); and the
marginal e¤ect of PHI coverage on utilization is:
@E(YjijXi; PHIi)@PHIi
= Pr(Yji > 0jXi; PHIi)@E(YjijYji > 0; Xi; PHIi)
@PHIi+
+@ Pr(Yji > 0jXi; PHIi)
@PHIiE(YjijYji > 0; Xi; PHIi): (5)
This marginal e¤ect can be calculated using the estimation results of the two parts of the model.
5 Data
The empirical analysis is based on the �rst wave of the Survey of Health, Ageing, and Retirement in Europe
(SHARE), release 2.3.1.11 The SHARE data covers individuals aged 50+, and their spouses. The sample is
8The zero-truncated negative binomial models are estimated with the ztnb Stata command.9Alternative consistent estimation methods could be to use the full-information maximum likelihood and two-stage method
of moments estimation suggested by Terza (1998).10Based on Terza et al. (2008), three conditions have to be satis�ed for the consistency of the 2SRI method: 1. The identifying
instruments cannot be correlated with the unobservable determinants of health care utilization. 2. The identifying instrumentsmust be correlated with the PHI variable. 3. The identifying instruments might not have direct in�uence on the utilizationmeasure, and might not be correlated with the random error term in the utilization model.These conditions are satis�ed based on the assumptions that the characteristics of the last job have no direct e¤ect on current
helath care utilization, and these characteristics are independent of the unobservable determinants of utilization.11This paper uses data from SHARE release 2.3.1, as of July 29th 2010. SHARE data collection in 2004-2007 was primarily
funded by the European Commission through its 5th and 6th framework programmes (project numbers QLK6-CT-2001- 00360;
9

based on probability samples in the participating countries. Since only the �rst wave questionnaire of SHARE
contains a question about private health insurance coverage, I use the �rst wave data, which corresponds to
year 2004.
I use samples on 11 European countries: Austria, Belgium, Denmark, France, Germany, Greece, Italy,
the Netherlands, Spain, Sweden, and Switzerland. In order to avoid the problem of small samples, I use
pooled data for these countries, the size of the estimating sample is 23:5 thousand. I weight the observations
so as each country has the same share in the pooled sample. Each weight is country speci�c, and equals the
number of all observations divided by the number of observations in the particular country.
Due to the relatively high rate of nonresponse, for income, wealth, and health insurance premia I use
the imputed values provided in the dataset. The SHARE dataset contains multiple imputations, I use the
average of these. This approach is a simpli�cation, since it neglects the uncertainty of the imputations,
therefore can cause downward bias in the estimated standard errors. However, this simpli�cation does not
a¤ect the main results of the paper. The household-level income and wealth measures are divided by the
household size so as to get individual-level measures. I generate the income measure used in this analysis as
the gross income minus the health insurance payments, based on the imputed values.12
The key interest lies in the e¤ect of voluntary PHI coverage on health care utilization in Europe. Coverage
with voluntary PHI refers by de�nition only to those individuals who do not have private insurance as primary
health insurance. Having primary private health insurance is relevant only in Germany and the Netherlands
(the mandatory private insurance in Switzerland is de�ned here as public insurance). In the Netherlands the
high-earners were excluded from the public insurance in 2004. In the SHARE sample 36% of the individuals
living in the Netherlands report not having basic public health insurance coverage. These people have private
primary coverage. In case of Germany, high-earners, self-employed people and civil servants might not be
covered with the basic public insurance (9% of the sample). I exclude those individuals from the estimation
sample who are covered with primary private health insurance. The reason for this exclusion is that my
aim in this paper is to analyze the di¤erence in utilization between those who are covered with only the
mandatory health insurance, and those who have voluntary PHI coverage as well.
Some descriptive statistics of the variables are reported in Table A.1 in Appendix A. The �nancial
values are purchasing power parity adjusted. The adjusted values are included in the SHARE dataset, the
adjustment was based on OECD purchasing power parity data. As health indicators I use the number of
chronic diseases the respondents ever had, ADL limitations, and reported symptoms.13
I de�ne voluntary private health insurance coverage as having any type of private health insurance which
supplements or complements the basic health insurance. Although there are questions in the SHARE about
the services the private health insurance provides, I do not use this information because of the following
reasons. First, the de�nitions of these insurance categories vary across the country-speci�c questionnaires.
RII-CT- 2006-062193; CIT5-CT-2005-028857). Additional funding by the US National Institute on Aging (grant numbers U01AG09740-13S2; P01 AG005842; P01 AG08291; P30 AG12815; Y1-AG-4553-01; OGHA 04-064; R21 AG025169) as well as byvarious national sources is gratefully acknowledged (see http://www.share-project.org for a full list of funding institutions).12Since PHI is predetermined in this model, it is reasonable to subtract its costs from the disposable income measure. I
replace the net income to one for whom its calculated value is zero or negative (there are 63 such observations in the sampleused). The median value of annual payments for private health insurance contracts is 356 EUR, the mean is 596 EUR amongthose in the sample who report supplementary or complementary PHI coverage.13The chronic conditions are: heart attack, high blood pressure, high blood cholesterol, stroke, diabetes, chronic lung disease,
asthma, arthritis, osteoporosis, cancer, stomach ulcer, Parkinson disease, cataracts, hip or fremoral fracture.The ADL limitations include di¢ culties with dressing, walking across a room, eating, bathing, getting in or out of bed, and
using the toilet.The speci�ed symptoms are: pain in a joint, heart trouble, breathlessness, persistent cough, swollen legs, sleeping problems,
falling down, fear of falling down, dizziness, stomach problems, and incontinence.
10

Second, it would be di¢ cult to separate the partial e¤ects of the certain insurance types, since in some
insurance categories there are very few observations. The coverage ratios with the basic ten insurance
categories are reported in Table 2. The prevalence of the di¤erent categories varies across the countries.
Insurance for long term and home care are generally the least widespread. The predominant type of PHI
also varies across countries, for example in Austria it is the insurance for hospital care, in the Netherlands
the dental care insurance, whereas in Spain the insurance that provides direct access to specialists.
AU BE DK FR DE GR IT NL ES SE CHMedical care with
direct access to specialists 2.7 6.4 9.2 70.0 3.8 1.8 1.8 0.0 6.0 1.4 17.8Medical care with an
extended choice of doctors 2.6 0.2 4.9 52.0 3.5 1.3 0.7 0.0 4.3 0.5 18.5Dental care 1.5 5.7 18.6 75.9 5.6 0.4 0.4 47.0 3.2 0.2 6.4Larger choice of drugs
and/or full drugs expenses 1.6 2.7 13.8 72.1 0.7 0.6 0.4 34.7 0.9 0.4 14.2Extended choice of hospitals 16.5 0.1 5.3 73.7 4.2 1.5 1.7 0.0 4.3 0.5 38.2Long term care 0.8 0.2 0.5 64.1 0.0 0.2 0.0 0.0 0.1 0.1 9.2Nursing care at home 0.9 0.1 0.8 54.0 0.0 0.3 0.1 0.0 2.3 0.0 8.8Home help for ADL 0.7 2.7 0.3 25.8 0.0 0.1 0.2 0.0 0.4 0.0 8.3Full coverage of costs for doctor visits 2.1 0.8 2.0 49.7 0.0 1.0 0.5 0.0 4.1 1.2 1.7Full coverage of costs for hospital care 6.7 59.5 1.8 12.8 5.3 2.1 1.1 0.0 3.8 0.9 5.0
Table 2: Percentage of individuals covered by speci�c types of voluntary PHI (SHARE data)
Estimating country speci�c probit models for insurance coverage shows that higher education and in-
come generally increase the likelihood of insurance coverage, whereas age decreases that. The type of last
employment and workplace, and the insurance status of the spouse also a¤ect the PHI coverage. Firm size
also seems to have an in�uencing factor, although not in all countries. Paccagnella et al. (2008) analyze in
details the determinants of voluntary PHI coverage of people aged 50 and over using the SHARE data. They
also point out the e¤ect of employment status.
The dependent variables I analyze in this paper refer to the last 12 months before the interview. These
are the number of times seeing or talking to general practitioners (GP), and to specialists, the number of
nights spent in hospital, and reporting visits to dentists.14 I analyze the demand for the GP and outpatient
specialist care separately, so as to check if the in�uencing mechanisms are di¤erent for these two types of
outpatient care. The number of dental visits cannot be modelled, since there is no information in the SHARE
data about the number of such visits. However, I can use the information if the respondent had any dental
visits or not.
When estimating the number of hospital nights or doctoral visits, I exclude those observations where it is
larger than 50. The �rst reason for this exclusion is theoretical: the underlying utility maximization model
might not be valid for those in the worst health condition. Reporting high utilization can indicate critical
health condition. The second reason is related to the data. In some countries the SHARE data excludes
individuals living in institutions for elderly. If these people are generally in worse health condition than the
ones not living in such institutions, then the data is not representative for those with severe health problems.
Cutting the sample at 50 reported hospital nights, GP or specialist visits implies the exclusion of less than
1% of the observations.
In Table A.2 in Appendix A I present a table of country-level averages of PHI coverage and health care
14When asking about specialist visits, a showcard is shown to the respondents indicating 13 types of specialist care.
11

utilization. There are large di¤erences in voluntary PHI coverage rates (ranging from 5� 6% in Greece and
Italy to 84% in France). The cross-country variation in the ratio of people reporting specialist visits, dental
visits, or hospital stays is not negligible, but that is relatively small for GP visits. The majority (85%) of the
respondents report some visits to general practitioners. The average number of nonzero GP visits, specialist
visits, and the average length of hospital stays also show cross-country variation, here it is the number of GP
visits for which the standard deviation relative to the mean is the highest. The average length of reported
hospital stays is the largest in Germany (12:4), the average number of nonzero GP visits is the highest in
Italy and Spain (7:7), whereas the highest average number of specialist visits can be observed in Greece
(4:6). On the other hand, all these three utilization statistics are the lowest in Sweden.
The SHARE data also provides some information on the out-of-pocket expenditures on health care. The
weighted average of annual out-of-pocket expenditure on inpatient services is 280 EUR for those who report
nonzero hospital nights. The average annual outpatient expenditure is 130 EUR among those who report
outpatient visits to general practitioners, specialists or dentist. The survey also asks if the respondent had
to forego health care due to high costs: only 4% of the respondents report such di¢ culty, about half of them
indicate that the costs of dental care were not a¤ordable. These statistics indicate that the out-of-pocket
inpatient and outpatient health expenditures are moderate in the analyzed European countries. Moral hazard
due to PHI coverage is most likely to play a role in case of dental care. For the other types of health care
the role of PHI is more likely to make higher quality of services available.
6 Estimation results
6.1 Voluntary private health insurance coverage
Although the focus of the paper is on the e¤ect of voluntary PHI on health care utilization, estimating the
in�uencing factors of PHI coverage is needed as the �rst stage equation in the structural estimation.
PHI is considered as predetermined in the health care equations, but it is still likely to be endogenous. It
is assumed that the observed individual characteristics included in equation (2) reveal permanent di¤erences
among the individuals, thus these can be used to estimate individual speci�c likelihoods of being covered
with PHI.
The estimated coe¢ cients of the probit model are reported in Table B.1 in Appendix B. Income isestimated to have generally signi�cantly positive e¤ect on insurance coverage (the reference country is Aus-
tria). The Netherlands is an exception in this respect because there the richest individuals are typically
covered with primary private health insurance, which is not included in the voluntary PHI category. Higher
education is also associated with higher probability of coverage. Most of the country dummy coe¢ cients are
signi�cantly di¤erent from zero, due to the di¤erences in the health care and insurance institutions across
the countries.
Working for a big �rm can indicate the availability of group policies, and accordingly its e¤ect is signi�-
cantly positive. Although the estimated likelihood of PHI does not increase monotonically with �rm size at
last employment, the highest �rm size (with above 500 employees) implies the highest probability of cover-
age, ceteris paribus. As for the type of the last job, self-employment signi�cantly increases the probability
of being covered with PHI, ceteris paribus.15
15Based on the estimated marginal e¤ects at the average, the probability of having PHI is 5 percentage points higher if the�rm size is above 500 employees than if the �rm size is between 200 � 499. The increasing e¤ect of self-employment at theaverage is 7 percentage points.
12

The indicators of the �rm size and employment status signi�cantly in�uence the probability of coverage
with PHI. This suggests that these indicators might indeed be used for identifying the e¤ect of PHI coverage
on health care utilization. When testing the joint signi�cance of these indicators, the p-value of the Wald-test
is approximately zero.
6.2 Benchmark estimation results
In the benchmark model I assume that health care utilization is a one stage decision, and PHI coverage is
exogenous. The estimated coe¢ cients of the benchmark model are reported in Table B.2 in Appendix B,
the estimated country-speci�c coe¢ cients of the PHI indicator are repeated in Table 3.16
Number of Number of Number ofhosp. nights GP visits spec. visits
AT 0.431�� 0.084 0.136BE 0.021 -0.072�� 0.076DK -0.316 0.122� 0.162FR 0.269 0.152��� 0.000DE -0.091 -0.135�� 0.135GR 0.424 -0.329�� -0.073IT 0.795� -0.109 -0.057NL 0.317 0.009 0.249��
ES -0.504 -0.069 0.239�
SE -0.332 0.010 0.043CH 0.473 -0.046 0.242�, ��, ��� signi�cant at the 10, 5, 1% level, respectively
Table 3: PHI coe¢ cients: benchmark model
Based on the benchmark negative binomial estimation results there is no clear evidence for a positive
e¤ect of voluntary PHI coverage on health care utilization. The sign of the e¤ect on inpatient and outpatient
services varies across the countries. Using 10% signi�cance level, the results indicate signi�cant positive
e¤ect on inpatient care utilization in Austria, and Italy. The estimated e¤ect on the number of visits to
general practitioners is signi�cantly positive in France, but signi�cantly negative in Belgium, Germany, and
Greece. The negative e¤ect can be the result of direct access to specialist. The estimated e¤ect on specialist
care utilization is positive in most of the countries, but it is signi�cantly di¤erent from zero only in the
Netherlands, and Spain.
As expected, the indicators of health problems have positive coe¢ cients in the health care utilization
models. Some of the country dummies are also signi�cantly di¤erent from zero, indicating the di¤erences of
health care systems and health behaviors in the countries analyzed.
6.3 Two-part model estimation results
The preferred speci�cation follows the model described in Section 4.2: the utilization is modelled as two-stage
decision, and voluntary PHI is considered to be endogenous in both stages.
The �rst stage model is about the probability of utilization. This model can be estimated for dental care
utilization, as well. In Table 4 I present the estimated coe¢ cients of interest based on the bivariate probit
models, but I report also the estimated e¤ect of PHI if insurance coverage is assumed to be exogenous.
16The reported signi�cance levels are always based on clustered standard errors (with clustering on the household level).
13

Nonzero hosp. nights Nonzero GP visits Nonzero spec. visits Nonzero dent. visitsProbit Bivar. probit Probit Bivar. probit Probit Bivar. probit Probit Bivar. probit
AT 0.191�� 0.489 0.108 -0.589 0.087 0.101 0.331��� 0.520�
BE 0.120� 0.409 0.193�� -0.454 0.076 0.095 0.185��� 0.374DK -0.045 0.245 0.120 -0.529 0.026 0.044 0.466��� 0.647��
FR 0.083 0.394 0.360��� -0.340 0.121� 0.142 0.064 0.269DE 0.175� 0.502 -0.097 -0.849� 0.151� 0.172 0.006 0.209GR 0.303� 0.693 -0.154 -0.989� 0.033 0.057 0.150 0.385IT 0.122 0.496 -0.105 -0.944� -0.125 -0.102 0.121 0.349NL 0.077 0.365 0.114 -0.535 0.050 0.069 0.474��� 0.659��
ES 0.074 0.423 -0.058 -0.838 0.199� 0.220 0.329��� 0.541�
SE -0.108 0.253 -0.090 -0.872� 0.018 0.040 0.170 0.390CH 0.169 0.457 0.020 -0.629 0.306��� 0.325 0.177 0.358corr. -0.176 0.393 -0.011 -0.112�, ��, ��� signi�cant at the 10, 5, 1% level, respectively
Table 4: PHI coe¢ cients: probit models of nonzero utilization
If the endogeneity of PHI is neglected then its e¤ect is underestimated in absolute value for hospital, GP
and dental care utilization. For specialist care utilization the estimated e¤ects under the simple and bivariate
probit models are close to each other. Despite the di¤erences in the point estimates of the PHI coe¢ cients
under the probit and bivariate probit speci�cations, the estimated correlation coe¢ cients between the error
terms of the PHI and nonzero utilization models are insigni�cant. Thus there is no clear evidence for the
endogeneity of PHI in the �rst stage of utilization.17 The results also indicate that coverage with voluntary
PHI increases the probability of utilizing hospital care, visiting specialists and dentists. On the other hand,
PHI coverage decreases the probability of visiting a general practitioner. However, most of the estimated
coe¢ cients are not signi�cantly di¤erent from zero.
The second stage estimated coe¢ cients of PHI are presented in Table 5. In this speci�cation voluntary
PHI is allowed to be endogenous also in the second stage of utilization decision, where the amount of
utilization is analyzed for those respondents who report nonzero hospital nights or doctoral visits. The
standard errors have to be adjusted for two-stage estimation. The results presented in Table 5 are based on
bootstrapped standard errors (with 1000 replications). The adjustment of standard errors has only small
e¤ects.
There is some evidence that PHI is endogenous in the second stage decision on GP care utilization.
The estimated coe¢ cient of the residual from the probit model of PHI coverage is signi�cantly positive
in the second part model of GP care. The positive coe¢ cient indicates that the unobservables increasing
the probability of PHI coverage also increase the demand for GP care. On the other hand, the residual
is insigni�cant in the hospital and specialist care models, thus PHI coverage might be exogenous in those
models.18
One of the advantages of the here applied two-part modelling method is that it can provide information
on the di¤erent e¤ects of PHI on the probability of utilization and on the amount of utilization. However,
the size of the coe¢ cients cannot be interpreted on themselves, therefore I analyze the estimated marginal
17 I also test the di¤erence between the probit and bivariate probit PHI coe¢ cients using the bootstrap Hausman test, followingCameron and Trivedi (2009), p. 429-430. The test indicates for all four types of health care that the estimated PHI coe¢ cientsunder the two speci�cations do not di¤er signi�cantly. This implies that the exogeneity of PHI in the �rst stage of utilizationcannot be rejected.18The second stage estimation results are consistent if the regressors other than PHI, and the characteristics of the previous
job are exogenous. In order to test the validity of the exogeneity assumptions, it is possible to calculate the nonlinear versionof the Sargan test, suggested by Cameron and Trivedi (2005), p. 277. The test con�rms the exogeneity assumptions.
14

Number of Number of Number ofhosp. nights GP visits spec. visits
AT -0.500 -1.071��� 0.424BE -0.779 -1.256��� 0.393DK -0.821 -1.024��� 0.550FR -0.537 -1.028��� 0.283DE -1.020 -1.312��� 0.349GR -0.810 -1.457��� 0.246IT -0.091 -1.257��� 0.478NL -0.623 -1.198��� 0.588ES -1.564� -1.221��� 0.471SE -0.939 -1.104��� 0.408CH -0.547 -1.209��� 0.276First stage residual 0.608 1.155��� -0.360�, ��, ��� signi�cant at the 10, 5, 1% level, respectively,based on bootstrapped standard errors
Table 5: PHI coe¢ cients: zero-truncated negative binomial models of nonzero utilization
e¤ects in Section 6.4. In addition, in Section 6.5 I analyze the sensitivity of the estimation results with
respect to the modelling (distributional and exogeneity) assumptions.
The presented results suggest that PHI coverage might increase the probability of hospital care utilization,
but decrease the length of the stay. On the other hand, being covered with PHI implies lower probability and
fewer number of visits to general practitioners. There is some evidence for increased probability of specialist
care utilization due to voluntary PHI coverage, but its e¤ect on the frequency of visits is small. I return to
the analysis of these results in Section 6.4.
6.4 Analysis of the results
Due to the nonlinear nature of the empirical models, the partial e¤ect of PHI varies among the individuals. In
Table 6 I present the estimated marginal e¤ect of voluntary PHI on the number of hospital nights and doctoral
visits for a representative individual. Using the estimating sample the mode of the discrete regressors are
determined. For the rest of the regressors the mean values are used, and the marginal e¤ect of the insurance
indicator is calculated for this individual.
The marginal e¤ects presented in Tables 6 and 7 are based on the estimation results as discussed in
Sections 6.2-6.3. The results of Table 6 refer to overall utilization, not only to nonzero utilization.19 The
two-part model (2PM) estimates are based on the combination of the �rst and second part of the model, as
described under equation (5) in Section 4.2.
Except for Denmark and Sweden, PHI coverage has positive marginal e¤ect on the expected number of
hospital nights, based on the two-part model estimates. The positive overall e¤ects are due to the positive
e¤ect of PHI in the �rst stage of utilization. However, the positive marginal e¤ect on the probability of
inpatient care utilization is insigni�cant for all countries. The estimated increase in the overall number of
hospital nights due to PHI coverage varies between 0:1 (Spain) and 0:9 (Greece), according to the two-part
model results. Thus, these e¤ects are relatively small. The benchmark model underestimates the e¤ect of
PHI on hospital care utilization: this model neglects that PHI coverage is endogenously determined, and
19The mfx command of Stata 10 is used when calculating the marginal e¤ects. The signi�cance levels of the marginal e¤ectsin the two-part models are based on bootstrapped standard errors. The Stata codes of Deb et al. (2010) are used as basis forthe bootstrapping procedures. 1000 replications are used.
15

Number of hosp. nights Number of GP visits Number of spec. visitsBenchm. 2PM Benchm. 2PM Benchm. 2PM
AT 0.370�� 0.548 0.373 -2.938��� 0.166 0.382BE 0.015 0.225 -0.235� -3.184��� 0.116 0.362DK -0.190 -0.072 0.519� -2.849��� 0.205 0.494FR 0.210 0.303 0.630��� -2.771��� -0.010 0.262DE -0.060 0.390 -0.469�� -3.568��� 0.190 0.381GR 0.366 0.925 -1.094��� -3.894��� -0.088 0.159IT 0.841 0.813 -0.614 -3.737��� -0.091 0.280NL 0.255 0.226 0.041 -3.100��� 0.327� 0.545ES -0.276� 0.104 -0.248 -3.459��� 0.344 0.554SE -0.197 -0.083 0.032 -3.370��� 0.051 0.316CH 0.414 0.455 -0.151 -3.188��� 0.345 0.440�, ��, ��� signi�cant at the 10, 5, 1% level, respectively (2PM: based onbootstrapped standard errors)
Table 6: Marginal e¤ect of voluntary PHI
cannot wholly capture the positive e¤ect of PHI coverage on the likelihood of hospital stays.
The estimated marginal e¤ect of voluntary PHI on the expected number of GP visits is negative for
most of the countries based on both speci�cations. Neglecting the endogeneity of PHI coverage in the
utilization model (benchmark model) causes upward bias in the estimated e¤ect, which becomes positive
for some of the countries. The di¤erent results of the benchmark and two-part model estimations can be
explained by the self-selection into PHI coverage. Due to the in�uencing e¤ect of unobserved preferences,
those who are covered with PHI are also more likely to visit general practitioners. Therefore the benchmark
speci�cation underestimates the negative e¤ect of PHI coverage on the number of GP visits. According to
the estimates of the two-part models the marginal e¤ect of PHI coverage on the number of GP visits for
the representative individual lies between �3:9 (Greece) and �2:8 (France). For specialist care utilizationthe estimated marginal e¤ect of PHI coverage is less than one, insigni�cant, but positive under the two-part
speci�cation for all countries. The two-part estimates predict the largest positive e¤ect for Spain (0:6).
Based on the results of the two-part models it is possible to separately analyze the e¤ect of PHI coverage
on the probability of utilization, and on the amount of nonzero care utilized. These estimated e¤ects are
presented in Table 7.
For hospital care the overall estimated e¤ect is generally positive (as shown in Table 6), which comes
from the increasing e¤ect of PHI coverage on the probability of utilization. On the other hand, being covered
with PHI implies shorter stays in hospitals, and this estimated e¤ect is not negligible in magnitude, although
signi�cantly di¤erent from zero only for Spain. Two explanations are possible for these �ndings. First, PHI
coverage might make more e¢ cient or alternative (home care) services available. Second, it is also likely
that individuals with PHI coverage utilize di¤erent kinds of inpatient services than the uncovered ones. For
example, general health checks induced by PHI coverage might necessitate short stays in hospitals.
Contrary to the hospital care, PHI has negative e¤ect both on the probability and number of visits to
general practitioners, and the second-stage e¤ects are signi�cantly di¤erent from zero for all of the countries.
The marginal e¤ect on the probability of visiting a GP is of considerable magnitude in some of the countries.
For instance, PHI coverage is estimated to decrease the estimated probability for the representative individual
by around 30 percentage points in Greece and Italy. The negative e¤ect can be the result of direct access
to specialists. An alternative explanation can be that those covered with PHI have access to more e¢ cient
treatments and preventive care, which necessitates fewer visits to general practitioners, ceteris paribus.
16

Hosp. nights GP visits Spec. visits Dent. visitsProb. Nr. Prob. Nr. Prob. Nr. Prob.
AT 0.115 -3.111 -0.154 -2.599��� 0.026 0.848 0.181��
BE 0.090 -4.420 -0.113 -3.052��� 0.022 0.818 0.130DK 0.050 -4.386 -0.140 -2.561��� 0.000 1.277 0.220���
FR 0.086 -3.380 -0.084 -2.716��� 0.039 0.466 0.095DE 0.119 -4.954 -0.252 -2.873��� 0.053 0.702 0.073GR 0.181 -4.263 -0.309 -2.989��� 0.003 0.395 0.134IT 0.118 -0.775 -0.295 -2.873��� -0.059 1.041 0.125NL 0.080 -3.653 -0.140 -2.841��� 0.013 1.342 0.223���
ES 0.097 -6.065�� -0.251 -2.756��� 0.069 1.066 0.189�
SE 0.053 -4.667 -0.263 -2.607��� -0.001 0.825 0.136CH 0.106 -3.313 -0.170 -2.807��� 0.114 0.527 0.125�, ��, ��� signi�cant at the 10, 5, 1% level, respectively (amount of utilization:based on bootstrapped standard errors)
Table 7: Marginal e¤ect of voluntary PHI based on the two-part model
The estimated marginal e¤ect on the probability of visiting a specialist is generally positive, but the
maximum is 11 percentage points and insigni�cant for all countries. The number of nonzero specialist visits
are estimated to increase due to PHI coverage in all of the countries, but these results are also insigni�cant.
This �nding is di¤erent from the results of Jones et al. (2006), who estimate positive e¤ect of PHI on
specialist visits. Although they apply di¤erent methodology to a set of European countries (Ireland, Italy,
Portugal, and the U.K.) than I do in this paper, the most likely explanation for the di¤erent �ndings lies
in the age structure of the estimating sample. The �ndings of Jones et al. (2006) are based on a sample of
individuals aged 16 and above, which suggests that specialist care utilization can be more responsive to PHI
coverage among the younger generations than among the older ones.
Finally, the marginal e¤ect of PHI coverage on the probability of dental care utilization is also analyzed.
This e¤ect is positive for all countries, and varies between 7 (Germany) and 22 (Denmark and the Nether-
lands) percentage points. The substantial positive e¤ects for Denmark and the Netherlands are reasonable,
since there the main role of voluntary PHI is �nancing dental care (see Table 2).
The estimated marginal e¤ects can be compared to the �ndings of other authors. The �rst stage utilization
results are directly comparable to the results reported by Gibbons and Wilcox-Gok (1998), due to the similar
methodology. Based on a U.S. sample they estimate that supplementary PHI coverage in the U.S. increases
the probability of outpatient care utilization by about 2�7 percentage points for a representative individual,depending on the type of the insurance. Based on my estimation results the marginal e¤ect of voluntary PHI
coverage on doctoral care utilization varies across the countries and across the service types. Unanimously
positive e¤ect among the outpatient services is found only for dental care. Although my results are based
on a sample of elderly individuals, these estimates still indicate that PHI has smaller e¤ect on outpatient
specialist care utilization than in the U.S., but the marginal e¤ect on the probability of visits to dentists
is relatively large. The negative partial e¤ect of voluntary PHI coverage on GP care utilization is most
likely a consequence of the European health care institutions: PHI coverage often can ensure direct access
to specialists. Similarly to these results, negative e¤ect of PHI coverage on visits to general practitioners is
found by Rodríguez and Stoyanova (2004) based on Spanish data, which they also explain by direct access
to specialists due to private insurance. Hullegie and Klein (2010) also estimate negative e¤ect of private
insurance on doctoral visits in Germany, which they explain by receiving better medical treatment.
How do the estimated e¤ects relate to the country-speci�c characteristics of the public health care system?
17

Table 8 shows the correlation coe¢ cients between the estimated marginal e¤ects of PHI on the amount and
probability of health care utilization, and the indicators of public health care. The analyzed aggregate
statistics are the ones presented in Table 1. The marginal e¤ects on the amount of utilization are based
on the two-part model estimates as presented in Table 6, and the marginal e¤ects on the probability of
utilization are the ones presented in Table 7. I consider the probability of utilization since that is available
also for dental care.
Aggregate indicators (source: WHO)Public/total Public health Public healthhealth expend. expend./inhabitant expend./GDP
2PM Hospital -0.51 -0.46 -0.43marginal GP 0.37 0.73 0.63e¤ects Specialist 0.00 0.15 0.03
Marginal Hospital -0.61 -0.61 -0.56e¤ects GP 0.17 0.60 0.51on Specialist -0.40 0.17 0.08prob. Dentist -0.04 -0.14 -0.30
Table 8: Estimated marginal e¤ect of PHI on nonzero utilization under various speci�cations
The marginal e¤ect of PHI on the probability of hospital stays and dental visits, and on the overall
number of hospital nights are positive for most of the countries. Based on the calculated correlations, these
positive e¤ects are larger in countries where the relative measures of public health expenditure are smaller.
Thus these �ndings indicate that the role of PHI coverage in making inpatient and dental care available is
more important in countries where general government spends relatively less on health care. The estimated
e¤ect of voluntary PHI is also generally positive on the probability and amount of specialist care utilization.
There is some evidence for positive correlation with the indicators of public health expenditures, but these
relationships are weak. Nevertheless, since the marginal e¤ects on specialist care utilization are small and
insigni�cant, these correlations are less conclusive.
Contrary to the e¤ects on hospital and dental care, the estimated e¤ect of voluntary PHI is negative on
the probability and amount of GP care utilization for all countries. These negative e¤ects are smaller in
absolute value if the public health care is more generous. This result suggests that the role of PHI coverage
in ensuring direct access to specialists or higher quality services is less important in countries with relatively
larger public health care systems. In countries where public health expenditures are lower there might be
greater need for avoiding the gatekeeper function of general practitioners or accessing private specialist
6.5 Speci�cation checks
In the following, I modify the preferred two-part models, and check how sensitive are the results to changes
in the distributional and exogeneity assumptions. In column (1) under each service type in Table 9 I present
the estimated marginal e¤ect of the PHI indicator based on the second part of the two-part estimation, as
discussed in Section 4.2. The marginal e¤ect is calculated at the mode of the discrete, and mean of the
continuous regressors. The results in the second, third, and fourth columns of each block also correspond to
18
the estimated e¤ects on nonzero utilization.20
The estimates under column (2) for all three service types correspond to the case when voluntary PHI is
still assumed to be endogenous in the �rst and second part of the utilization model, but standard negative
binomial model is used in the second part, instead of zero-truncated negative binomial distribution. Due
to the exclusion of zero observations this model is clearly misspeci�ed. However, in case of GP care the
estimated coe¢ cients are close to the zero-truncated negative binomial (ZTNB) estimates. For all three
types of utilization, neglecting the lack of zero observations shifts the estimated coe¢ cients towards zero.
The signi�cance of the estimates is not a¤ected by this modi�cation. These results provide some evidence
for the robustness of the preferred two-part model estimates in the sense that modifying the distributional
speci�cation in the second part of the model does not a¤ect qualitatively the estimation results.
The third speci�cation is a selection model with endogenous PHI. It is analogous to the presented two-
part model, but this speci�cation also models the potential correlation between the error terms of the probit
model of utilization and count data model of nonzero utilization. The problem with this speci�cation is
that there is no sample selection inherent in the health care utilization model: there are observed zero and
nonzero utilizations. The �rst part of the model is the same as in the two-part model (equations (2) and
(3)). However, equation (4) is modi�ed the following way:
E[Yjij ~Xi; PHIi;~"3ji] = exp( ~Xi~�3jk + ~ 3jkPHIi + ~"3ji) := �ji(~"3ji) if Pos_Yji = 1: (6)
I assume that �; "2 and ~"3 have multivariate normal distribution with mean zero and variance 1; 1; �2,
respectively. Under this assumption it is not true any more that Y has negative binomial distribution, but
the normality assumption simpli�es the manipulation of the likelihood function with endogenous bivariate
regressor and selectivity. I also assume that the correlation coe¢ cients between these error terms are the
same across the countries.
The ~X vector of regressors is the same as X, except for the exclusion restrictions which can strengthen
the identi�cation. For inpatient care utilization the living area is considered as such variable which in�uences
the probability of hospital stay, but not the length of the stay. Living area can indicate the availability of
hospitals, and the inclination of going to hospital, but it is not likely to in�uence the length of the treatment.
For outpatient care utilization the indicators of the spouse�s visit to GP or specialist are excluded from the
second stage model. These indicators are assumed to in�uence the propensity to visit a physician, but not
the frequency of visits afterwards. Based on the distributional assumptions this model can be estimated with
maximum simulated likelihood (MSL).21 Simulation is needed since there is no closed form of the likelihood
20The reported signi�cance levels under the �rst three speci�cations take into account the two-stage estimation proce-dure: those are based on bootstrapped ((1) and (2)) or adjusted (3) standard errors. The adjustment procedure is basedon Greene (2003).21The contribution of the ith observation with nonzero utilization to the likelihood is
Pr(Yji; Pos_Yji = 1; PHIi = ljXi; Zi) =
=
ZPr(Yji; Pos_Yji = 1; PHIi = ljXi; Zi;~"3ji)f(~"3ji)d~"3ji =
=
Zexp(��ji(~"3ji))�ji(~"3ji)Yji
Yji!Pr(Pos_Yji = 1; PHIi = ljXi; Zi;~"3ji)f(~"3ji)d~"3ji:
f(:) is the normal probability density function with mean zero and variance �2, and l equals 0 or 1. The second term in theintegral can be expressed as a function of ~"3ji, using the �rst stage bivariate probit estimation results, and the assumptionof multivariate normality. In order to simplify the estimation procedure I apply two-stage maximum likelihood estimation - Iestimate the bivariate probit model of equations (2) and (3) in the �rst stage, and use these estimation results as known in thesecond stage.
19

Numberofhospitalnights
NumberofGPvisits
Numberofspecialistvisits
(1)
(2)
(3)
(4)
(1)
(2)
(3)
(4)
(1)
(2)
(3)
(4)
Selection
ZTNB,
Selection
ZTNB,
Selection
ZTNB,
Neg.
model,
exog.
Neg.
model,
exog.
Neg.
model,
exog.
ZTNB
binom.
MSL
PHI
ZTNB
binom.
MSL
PHI
ZTNB
binom.
MSL
PHI
AT
-3.111
1.080
-0.515
��0.789
-2.599
���
-2.507
���
-0.425
��0.282
0.848
0.066
-0.216
0.147
BE
-4.420
-1.173
-1.080
�-1.280
�-3.052
���
-3.009
���
-1.502
���
-0.448
���
0.818
0.025
-0.413
�0.083
DK
-4.386
-1.292
-1.090
�-1.513
-2.561
���
-2.390
���
-0.560
��0.467
1.277
0.490
-0.238
0.448
FR
-3.380
0.687
-1.078
�0.513
-2.716
���
-2.498
���
-1.369
���
0.501��
0.466
-0.247
-0.589
�-0.152
DE
-4.954
-2.544
-1.185
�-2.573
���
-2.873
���
-2.896
���
-0.511
�-0.605
��0.702
-0.097
-0.137
-0.013
GR
-4.263
-1.190
-1.634
-1.293
-2.989
���
-3.040
���
-0.171
-0.965
�0.395
-0.450
-0.246
-0.234
IT-0.775
5.571
-0.272
5.221
-2.873
���
-2.790
���
-0.671
�-0.339
1.041
0.205
-0.215
0.258
NL
-3.653
0.051
-1.078
�-0.185
-2.841
���
-2.782
���
-1.587
���
-0.196
1.342
0.440
-0.405
�0.545
ES
-6.065
��-4.610
��-1.886
�-4.673
���
-2.756
���
-2.744
���
-0.265
-0.247
1.066
0.235
-0.117
0.250
SE-4.667
-1.830
-1.843
�-2.092
-2.607
���
-2.398
���
-0.235
0.239
0.825
0.014
-0.121
0.095
CH
-3.313
0.400
-0.872
�0.286
-2.807
���
-2.730
���
-0.742
��-0.279
0.527
-0.228
-0.391
�-0.158
�,��,���signi�cantatthe10,5,1%
level,respectively,basedonbootstrapped(speci�cations(1)and(2))
andadjusted(speci�cation(3))standarderrors
Table9:Estimatedmarginale¤ectofPHIonnonzeroutilizationundervariousspeci�cations
20
function.22
The estimated marginal e¤ects under this speci�cation lie the closest to the estimates of speci�cation (2)
in case of hospital care utilization. On the other hand, qualitative di¤erences are found for the estimated
e¤ect on the number of GP and specialist visits. The di¤erences could be explained by the fact that the
selectivity model takes into account that in the second part of the model the sample is not random. However,
if the selection model is reestimated with the assumption that the selectivity is exogenous then the results
still di¤er from the two-part estimation results. Since there are no strong and theoretically founded exclusion
restrictions in the selectivity models, the two-part model is preferred. Nevertheless, the results still con�rm
the negative partial e¤ect of PHI on the number of visits to general practitioners.
As a �nal speci�cation check, I compare the estimation results of the zero-truncated negative binomial
models to the case when PHI coverage is assumed to be exogenous in the second part of the model. Under
this speci�cation the residual from the probit model of PHI coverage is not included in the model of nonzero
health care utilization (equation (4)). The estimated e¤ects of PHI on hospital nights are considerably
upward biased, compared to the speci�cation where endogeneity is taken into account (�rst speci�cation).
The similar holds for the estimated e¤ect on the number of visits to general practitioners. According to
these results it is important to take into account the endogeneity of PHI in the utilization models. Due to
adverse selection, those covered with PHI might su¤er from more severe conditions or might have di¤erent
attitudes towards medical care than the uncovered ones. Neglecting this selectivity can lead to upward
biased estimated e¤ect of PHI on health care utilization. In case of outpatient specialist care such upward
bias cannot be observed, the association between PHI coverage and the amount of specialist care utilization
is estimated to be weak.
It follows from this analysis that neglecting the correlation between the unobserved terms of the utilization
and PHI coverage models a¤ects the estimation results, thus handling the endogeneity of PHI coverage in
the utilization models is important. The speci�cation checks also show that the estimation results are
also sensitive to the modelling assumptions, in particular the choice between two-part models and selection
models in�uences the results. Due to identi�cation problems under the selectivity model, the two-part model
is preferred here.
7 Conclusions
Assuming that individuals behave in utility maximizing way, health insurance coverage can in�uence their
health care utilization decisions, and the type of health care utilized. It depends not only on the individual
characteristics, but also on the country speci�c institutional backgrounds to what extent voluntary private
health insurance coverage in�uences these utilization outcomes.
In this paper I analyze the e¤ect of voluntary private health insurance coverage on the utilization of
hospital, general practitioner, specialist and dental care. The estimated e¤ects are compared across various
modelling assumptions. The size, and in some cases also the sign of the estimated e¤ects vary with the
assumptions. In the preferred speci�cation I model health care utilization as a two-stage decision. Due
to the e¤ects of unobservables, private health insurance coverage is likely to be endogenous in health care
utilization models. In this paper I take into consideration this endogeneity also in the two-part estimation
22 In the simulations I use 100 draws from the Halton sequence with prime number 7. For producing the Halton draws I usethe Stata code mdraws written by L. Cappellari and S. P. Jenkins. Cappellari and Jenkins (2006) also discuss the advantagesof Halton draws in MSL estimation.
21

model. The speci�cation tests show that the exogeneity assumptions about voluntary PHI have substantial
e¤ect on the estimated coe¢ cients.
I compare the e¤ects of voluntary private health insurance among 11 European countries. According to
the results under the preferred two-part empirical speci�cation, private health insurance increases hospital,
outpatient specialist and dental care utilization, but has a negative e¤ect on visits to general practitioners.
The e¤ects on the expected number of hospital nights and visits to specialists are insigni�cant and close
to zero. Both the positive e¤ects on hospital and dental care utilization, and the negative e¤ects on gen-
eral practitioner care utilization are larger in absolute value in countries where public health care funding
indicators are smaller.
The empirical results indicate that although there is almost universal coverage with public insurance
in the analyzed European countries, the role of voluntary private health insurance is not negligible among
individuals aged 50 and over. There is evidence that the main roles of private insurance are making inpatient
and dental services available, and avoiding the otherwise compulsory visits to general practitioners when
making contacts with specialists. The results presented in the paper can be informative for health policy
decisions. Supporting private health insurance coverage might increase the utilization of some types of health
services (especially of dental care), and direct the demand towards more e¢ cient service types.
The empirical results of this paper are based on a sample which covers individuals aged 50 and over,
thus for the whole population the e¤ect of voluntary private health insurance might be di¤erent. The
country speci�c samples are relatively small, therefore in this paper homogenous e¤ects of some individual
characteristics on health care utilization have to be assumed across the countries. Analyzing the di¤erences
across private health insurance contract types, the e¤ect of insurance coverage on the type of care utilized,
and on the amount of health care expenditures remains for future research.
22

Appendix
A Descriptive statistics
A.1 Sample mean and standard deviation of the variables (weighted data)
mean sd mean sd
age 64.96 10.19 smoking habits
female 0.55 0.50 never 0.53 0.50
marital status stopped 0.27 0.44
with spouse 0.68 0.47 yes 0.20 0.40
with partner 0.04 0.20 last job
single 0.28 0.45 civil servant 0.10 0.29
child 0.88 0.32 public employee 0.17 0.38
income (1000 EUR) 20.98 74.19 self-employed 0.17 0.37
main residence (1000 EUR) 102.51 321.00 voluntary PHI 0.32 0.47
education level # illness 1.35 1.38
primary 0.35 0.48 # ADL problems 0.20 0.76
lower secondary 0.18 0.39 # symptoms 1.45 1.62
upper secondary 0.31 0.46 �rm size not relevant 0.26 0.44
tertiary 0.16 0.37 �rm size 1-5 0.13 0.34
area=big city 0.14 0.35 �rm size 6-15 0.14 0.34
living area �rm size 16-24 0.08 0.26
suburbs big city 0.16 0.37 �rm size 25-199 0.23 0.42
large town 0.19 0.39 �rm size 200-499 0.07 0.25
small town 0.26 0.44 �rm size 500- 0.10 0.29
rural 0.25 0.43 # gp visits 4.89 7.64
employment status # hosp.nights 1.55 7.13
retired 0.50 0.50 # specialist visits 1.57 4.56
employed, other 0.12 0.33 visit dentist 0.54 0.50
unemployed 0.03 0.17
disabled 0.03 0.17
homemaker 0.15 0.35
civil servant 0.04 0.19
self-employed 0.07 0.26
public employee 0.07 0.25
23

A.2 Voluntary private health insurance coverage and health care utilization -sample means
Voluntary # hospital # GP # specialist
PHI Hospital Visit Visit Visit nights� visits� visits�
coverage stay GP specialist dentist (if hosp.>0) (if GP>0) (if spec.>0)
AT 0.23 0.19 0.85 0.37 0.51 11.57 5.51 3.58
BE 0.76 0.14 0.92 0.48 0.49 9.35 6.17 3.77
DK 0.36 0.12 0.81 0.18 0.76 8.58 4.01 3.78
FR 0.84 0.15 0.93 0.46 0.44 8.92 5.75 3.63
DE 0.14 0.16 0.92 0.54 0.75 12.35 5.54 4.29
GR 0.05 0.08 0.76 0.27 0.37 8.22 5.43 4.63
IT 0.06 0.12 0.83 0.41 0.33 9.76 7.70 4.02
NL 0.72 0.11 0.80 0.40 0.57 7.50 3.71 4.18
ES 0.09 0.11 0.88 0.42 0.26 9.13 7.72 4.40
SE 0.09 0.11 0.75 0.28 0.78 6.66 2.70 3.07
CH 0.33 0.12 0.83 0.30 0.68 8.93 4.13 3.86� Hospital nights or doctoral visits above 50 are excluded.
24
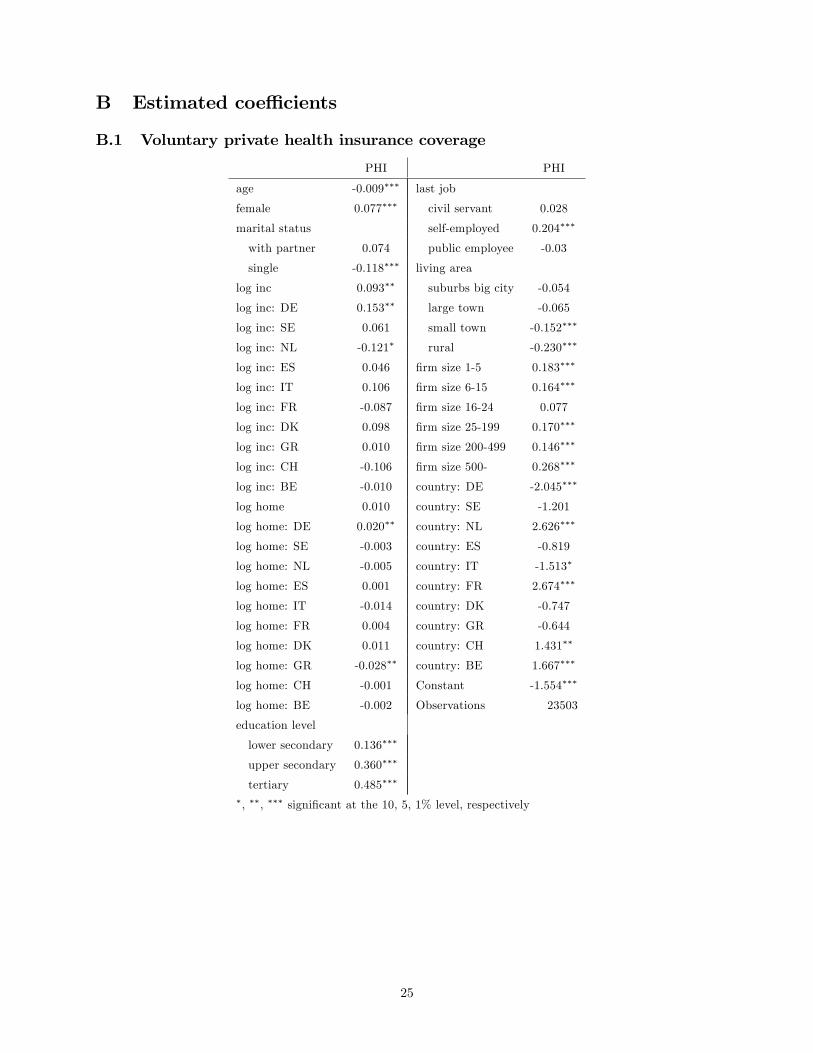
B Estimated coe¢ cients
B.1 Voluntary private health insurance coverage
PHI PHI
age -0.009��� last job
female 0.077��� civil servant 0.028
marital status self-employed 0.204���
with partner 0.074 public employee -0.03
single -0.118��� living area
log inc 0.093�� suburbs big city -0.054
log inc: DE 0.153�� large town -0.065
log inc: SE 0.061 small town -0.152���
log inc: NL -0.121� rural -0.230���
log inc: ES 0.046 �rm size 1-5 0.183���
log inc: IT 0.106 �rm size 6-15 0.164���
log inc: FR -0.087 �rm size 16-24 0.077
log inc: DK 0.098 �rm size 25-199 0.170���
log inc: GR 0.010 �rm size 200-499 0.146���
log inc: CH -0.106 �rm size 500- 0.268���
log inc: BE -0.010 country: DE -2.045���
log home 0.010 country: SE -1.201
log home: DE 0.020�� country: NL 2.626���
log home: SE -0.003 country: ES -0.819
log home: NL -0.005 country: IT -1.513�
log home: ES 0.001 country: FR 2.674���
log home: IT -0.014 country: DK -0.747
log home: FR 0.004 country: GR -0.644
log home: DK 0.011 country: CH 1.431��
log home: GR -0.028�� country: BE 1.667���
log home: CH -0.001 Constant -1.554���
log home: BE -0.002 Observations 23503
education level
lower secondary 0.136���
upper secondary 0.360���
tertiary 0.485���
�, ��, ��� signi�cant at the 10, 5, 1% level, respectively
25

B.2 Benchmark modelHosp.night GP visit Spec.visit Hosp.night GP visit Spec.visit
age 0.027��� 0.006��� -0.012��� �rm size 1-5 -0.150 -0.075 -0.105
female -0.171�� 0.049�� 0.147��� �rm size 6-15 -0.202 -0.065 -0.094
marital status �rm size 16-24 -0.577�� -0.065 0.018
with partner 0.286� 0.004 0.071 �rm size 25-199 -0.131 -0.126�� 0.055
single 0.044 0.027 -0.127��� �rm size 200-499 -0.030 -0.011 0.020
child 0.185� 0.001 -0.017 �rm size 500- 0.132 -0.105 0.230
log inc 0.025 0.026 -0.078 smoking habits
log inc: DE -0.027 -0.055 0.075 stopped 0.310��� 0.016 0.132���
log inc: SE -0.257 0.101 -0.068 yes 0.010 -0.050�� -0.153���
log inc: NL 0.352��� 0.011 0.194�� PHI: AT 0.431�� 0.084 0.136
log inc: ES 0.160 0.014 0.144� PHI: DE -0.091 -0.135�� 0.135
log inc: IT -0.077 -0.033 0.121 PHI: SE -0.332 0.010 0.043
log inc: FR -0.097 -0.066�� 0.067 PHI: NL 0.317 0.009 0.249��
log inc: DK 0.029 -0.076 0.133 PHI: ES -0.504 -0.069 0.239�
log inc: GR 0.100 0.031 0.108 PHI: IT 0.795� -0.109 -0.057
log inc: CH 0.128 -0.012 0.290��� PHI: FR 0.269 0.152��� 0.000
log inc: BE -0.02 -0.052� 0.140� PHI: DK -0.316 0.122� 0.162
log home -0.019 -0.006 0.007 PHI: GR 0.424 -0.329�� -0.073
log home: DE 0.019 0.010 0.001 PHI: CH 0.473 -0.046 0.242
log home: SE -0.022 0.010 0.005 PHI: BE 0.021 -0.072�� 0.076
log home: NL -0.010 0.000 -0.007 # chronic 0.305��� 0.186��� 0.235���
log home: ES 0.000 0.008 -0.001 # ADL 0.187��� 0.050��� 0.045�
log home: IT 0.047�� -0.006 -0.005 # symptoms 0.178��� 0.101��� 0.187���
log home: FR 0.006 -0.001 -0.021� country: DE 0.009 0.526 -0.304
log home: DK 0.064�� 0.005 0.013 country: SE 1.454 -1.943��� 0.102
log home: GR 0.031 0.012 -0.021 country: NL -4.731��� -0.649� -1.891��
log home: CH 0.017 0.005 0.014 country: ES -2.422�� -0.012 -1.201
log home: BE 0.000 0.002 -0.003 country: IT -0.531 0.541� -0.963
education level country: FR 0.126 0.586�� -0.274
lower secondary 0.179� -0.009 0.175��� country: DK -1.806 0.263 -2.233
upper secondary 0.062 -0.067��� 0.267��� country: GR -2.566��� -0.534� -0.985
tertiary -0.04 -0.103��� 0.330��� country: CH -2.050 -0.146 -3.043���
employment status country: BE -0.446 0.623�� -1.188
employed, other -0.191 -0.103� -0.328��� partner�s education level
unemployed -0.105 0.015 -0.048 lower secondary 0.044 0.091
disabled 1.041��� 0.464��� 0.569��� upper secondary -0.043 0.018
homemaker -0.108 0.019 -0.085� tertiary -0.011 0.005
civil servant 0.048 0.046 -0.296�� partner�s # chronic -0.002 0.002
self-employed -0.451��� -0.335��� -0.358��� partner�s # ADL -0.006 0.007
public employee -0.367� 0.011 -0.164 partner�s # symptoms 0.016 -0.007
living area Constant -2.150��� 0.514�� 0.990
suburb city 0.047 -0.009 -0.130�� Observations 23394 23398 23465
large town 0.119 -0.046 -0.261���
small town 0.220�� -0.029 -0.280���
rural 0.094 -0.051 -0.264���
�, ��, ��� signi�cant at the 10, 5, 1% level, respectively
26

References
Bago d�Uva, T., and Jones, A. M. 2009. "Health care utilisation in Europe: New evidence from the EHCP."
Journal of Health Economics, 28: 265-279.
Cameron, A. C., and P. K. Trivedi. 2005. Microeconometrics: Methods and Applications. Cambridge Univer-
sity Press.
Cameron, A. C., and P. K. Trivedi. 2009. Microeconometrics Using Stata. Stata Press.
Cappellari, L., and S. P. Jenkins. 2006. "Calculation of Multivariate Normal Probabilities by Simulation,
with Applications to Maximum Simulated Likelihood Estimation." The Stata Journal, 6(2): 156-189.
Deb, P., W. Manning, and E. Norton. 2010. Sample programs for ASHE June 2010 at Cornell University
Ithaca.
Deb, P., and P. K. Trivedi. 1997. "Demand for Medical Care by the Elderly: A Finite Mixture Approach."
Journal of Applied Econometrics, 12: 313-336.
Deb, P., and P. K. Trivedi. 2006. "Maximum simulated likelihood estimation of a negative binomial regression
model with multinomial endogenous treatment." The Stata Journal, 6(2): 246-255.
Dow, W. H., and E. C. Norton. 2003. "Choosing Between and Interpreting the Heckit and Two-Part Models
for Corner Solutions." Health Services & Outcomes Research Methodology, 4: 5-18.
Gibbons, R. D., and Wilcox-Gok, V. 1998. "Health Service Utilization and Insurance Coverage: A Multi-
variate Probit Analysis." Journal of the American Statistical Association, 93(441): 63-72.
Gourieroux, C., A. Monfort, and A. Trognon. 1984. "Pseudo Maximum Likelihood Methods: Theory."
Econometrica, 52(3): 681-700.
Greene, W. H. 2003. Econometric Analysis. Prentice Hall, 5th edition.
Grossman, M. 1972. �On the concept of health capital and the demand for health." Journal of Political
Economy, 80: 223-255.
Holly, A. et al. 2005. �Out-of-Pocket Payments for Health Care Expenditures.�, in A. Börsch-Supan et al.
(2005) Health, Aging and Retirement in Europe � First Results from the Survey on Health, Aging and
Retirement in Europe, MEA, pp. 126-132.
Hullegie, P., and T. J. Klein. 2010. "The e¤ect of private health insurance on medical care utilization and
self-assessed health in Germany." Health Economics, 19(9): 1048-1062.
Hunt-McCool, J., B. F. Kiker, and Y. C. Ng. 1994. "Estimates of the Demand for Medical Care Under
Di¤erent Functional Forms." Journal of Applied Econometrics, 9(2): 201-218.
Jones, A. M. 2000. "Health Econometrics." in Handbook of Health Economics, 2000, vol. 1, Chapter 6, pp.
265-344.
Jones, A. M., Koolman, X., and van Doorslaer, E. 2006. "The Impact of Having Supplementary Private
Health Insurance on the Use of Specialists." Annales d�Économie et de Statistique, 83/84: 251-275.
27

Manning, W. G. et al. 1987. "Health Insurance and the Demand for Medical Care: Evidence from a Ran-
domized Experiment." The American Economic Review, 77(3): 251-277.
Mossialos, E., and Thomson, S. 2004. Voluntary health insurance in the European Union. WHO, European
Observatory on Health Systems and Policies.
Norton, E. C., W. H. Dow, and Y. K. Do. 2008. "Speci�cation tests for the sample selection and two-part
models." Health Services & Outcomes Research Methodology, 8: 201-208.
OECD. 2004. Private Health Insurance in OECD Countries. The OECD Health Project.
Paccagnella, O., Rebba, V., and Weber, G. 2008. "Voluntary Private Health Care Insurance Among the
Over Fifties in Europe: A Comparative Analysis of SHARE Data." Marco Fanno Working Paper, No. 86,
University of Padua.
Pohlmeier, W., and V. Ulrich. 1995. "An Econometric Model of the Two-Part Decisionmaking Process in
the Demand for Health Care." The Journal of Human Resources, 30(2): 339-361.
Rodríguez, M., and A. Stoyanova. 2004. "The e¤ect of private insurance access on the choice of GP/specialist
and public/private provider in Spain." Health Economics, 13(7): 689-703.
Terza, J. V. 1998. "Estimating count data models with endogenous switching: Sample selection and endoge-
nous treatment e¤ects." Journal of Econometrics, 84: 129-154.
Terza, J. V., A. Basu, and P. J. Rathouz. 2008. "Two-stage residual inclusion estimation: Addressing
endogeneity in health econometric modeling." Journal of Health Economics, 27: 531-543.
Thomson, S., Foubister, T., and Mossialos, E. 2009. Financing health care in the European Union. WHO,
European Observatory on Health Systems and Policies.
Werblow, A., S. Felder, and P. Zweifel. 2007. "Population Ageing and Health Care Expenditure: A School
of �Red Herrings�?" Health Economics, 16: 1109-1126.
Zimmerman Murphy, M. 1987. "The Importance of Sample Selection Bias in the Estimation of Medical Care
Equations." Eastern Economic Journal, 13: 19-29.
28