Volume3 Issue2 Popa
16
1 Romanian Journal of Fiscal Policy Volume 3, Issue 2, July-December 2012 (5), Pages 1-16 The Impact of Social Factors on Economic Growth: Empirical Evidence for Romania and European Union Countries Ana-Maria POPA The Bucharest University of Economic Studies ABSTRACT This study analyzes the relationship between the social factors and the economic growth. A summary of social and economic environment is presented for Romania. As such, the paper analyzes the global evolution of social and economic environment over time and establishes a direct correlation between human development and economic welfare. An econometric model and a clustering model are tested for European Union countries. The results of the paper reveal the social factors that are positively correlated with the economic growth (i.e. the expected years of schooling and the life expectancy) and, respectively, the factors that are negatively correlated with the economic growth (i.e. the population at risk of poverty and the unemployment rate). Keywords: Economic growth, Social factors, Human development JEL codes: E60, O15, O47 1. Introduction None of the economic topics captured the attention of the economists, physicians and politicians, as the concept of the economic growth. This is due to the major significance of the topic upon the entire population in a country, which made the maintenance or improvement of the economic environment an objective of the macroeconomic policy, on short, medium and also long term.
-
Upload
bashirdarak -
Category
Documents
-
view
241 -
download
0
description
Volume3 Issue2 Popa
Transcript of Volume3 Issue2 Popa

1
Romanian Journal of Fiscal Policy
Volume 3, Issue 2, July-December 2012 (5), Pages 1-16
The Impact of Social Factors on Economic Growth: Empirical
Evidence for Romania and European Union Countries
Ana-Maria POPA
The Bucharest University of Economic Studies
ABSTRACT
This study analyzes the relationship between the social factors and the economic growth. A
summary of social and economic environment is presented for Romania. As such, the paper
analyzes the global evolution of social and economic environment over time and establishes
a direct correlation between human development and economic welfare. An econometric
model and a clustering model are tested for European Union countries. The results of the
paper reveal the social factors that are positively correlated with the economic growth (i.e.
the expected years of schooling and the life expectancy) and, respectively, the factors that
are negatively correlated with the economic growth (i.e. the population at risk of poverty
and the unemployment rate).
Keywords: Economic growth, Social factors, Human development
JEL codes: E60, O15, O47
1. Introduction
None of the economic topics captured the attention of the economists, physicians and
politicians, as the concept of the economic growth. This is due to the major significance of
the topic upon the entire population in a country, which made the maintenance or
improvement of the economic environment an objective of the macroeconomic policy, on
short, medium and also long term.
2
The purpose of this paper is to reveal the importance of social factors upon economic
growth, considering that the most used macroeconomic indicator, GDP per capita, is not the
most proper measure for the nation welfare. GDP per capita fails to take into consideration
some specific sectors of the economy, such as the black market and grey economy.
Until recently, the economists were reluctant to rely on culture as a possible determinant of
economic phenomena. However, in recent years, better techniques and more data made it
possible to identify systematic differences in people’s preferences and beliefs and to relate
them to various measures of cultural legacy. These developments suggest an approach to
introduce cultural-based explanations that can be tested and are able to substantially enrich
the understanding of economic phenomena.
The increased importance of social factors relies on a basic concept. For centuries the fiscal
and monetary policies focused on increasing the national income, which lead consequently
to economic growth. The reason most of them encountered difficulties is that they were
based on a wrong hypothesis, according to which the nation welfare is based only on the
level of income.
The paper points out the necesity for a society to sustain the human development (which is
measured by Human Development Indicator, further on reffered to as “HDI”), taking into
consideration the economic benefits which arise from it on a long term.
The study of social factors is performed within two stages: at the Romanian level and at the
EU level (performing an econometric analysis and a clustering model).
In 1880, for most of the countries, the life expectancy was around 40 years. The changes
encountered within over 200 years of evolution were determined by the two global wars, the
industrialization process, the technologic progress, the medical evolution, the scientific
research, but were also related to internal causes, specific to each country. Thus, the
differences are significant and are linked both to life expectancy level and the GDP / capita.
Also, in 200 years, the differences between countries, both social and economic, increased
significantly: in respect of life expectancy, the level of the indicator increased for all the
countries, but in respect of the economic wellness, not all the countries enjoyed the same
evolution. The Western European countries and the USA registered the most significant
evolutions, while Africa and Asia are still facing major economic and social issues. The access
to a healthy life and medical services are still long terms objectives for countries with low life
expectancy.
The evolutions of economic and social environment in the world are mostly important for
the future development. In order for the poor countries to eliminate the barriers to a decent
living standard, outside resources and support are needed. The clustering phenomena may
amplify globally, based on the fact that the developed countries will continue to enforce

3
their position, while poor countries will strangle with of social and economic difficulties.
The paper is organized as follows: the next section presents the review of literature in order
to establish a framework for the study of social indicators, Section 3 consists in an analysis of
the statistical data revealing the social and economic developments in Romania, and also in
European Union; Section 4 describes the econometric model and the empirical results for
the EU countries concerning the study of the correlation between economic growth and a
numbers of social indicators; Section 5 summaries the conclusions of the paper.
2. Literature Review
According to Harrison and Huntington (2000), the analysis of social factors helps
understanding the human behavior with respect to consumption, savings, investitional
system, expectations and atitude towards the economic circumstances, which also have a
major impact on the economic growth.
In this paper, it was considered a split of social factors into demographic and cultural factors,
in order to determine the significance of each of those two classes when studying their
impact on the economic growth. For example, the population’s structure represents a very
important social indicator, as it influences the distribution of the public income.
The cultural influence upon economic growth
Barro and Sala-i-Martin (1996) defined culture as the sum of symbols, meanings, habits,
values, institutions, behaviors and social artifacts which characterize a distinctive and
specific human population group.
The culture can be defined in a sufficiently narrow ways that makes it easier to identify a
causal link from culture to economic outcomes. As such, another basic definition can be that
of Guiso et al. (2004): those customary beliefs and values that ethnic, religious and social
groups transmit fairly unchanged from generation to generation. This definition provides an
approach to identify a causal effect from culture to economic outcomes and focuses on
those dimensions of culture that can have an impact on the economic outcomes, beliefs (i.e.
priors) and values (i.e. preferences).
Birdsall (2001) analyzed the decision of saving money as the culture's main mechanism to
influence the economic preferences, through the relation between religion and the
preference for savings (indicator measured as the percentage of population that educate
their children to make savings). His paper showed that religious people are more likely to
educate their children to make economy than the non-Christians. Furthermore, the author
suggested that sharing a specific religion can have an influence on a country's economic
performances.
4
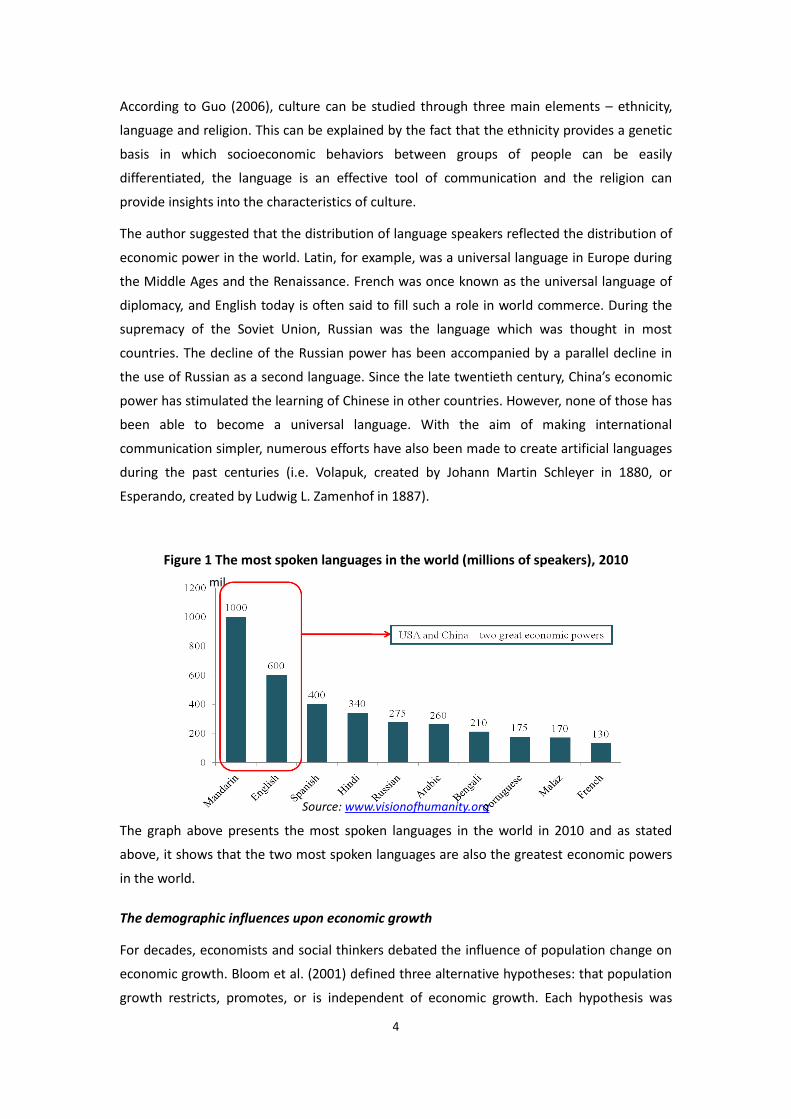
According to Guo (2006), culture can be studied through three main elements – ethnicity,
language and religion. This can be explained by the fact that the ethnicity provides a genetic
basis in which socioeconomic behaviors between groups of people can be easily
differentiated, the language is an effective tool of communication and the religion can
provide insights into the characteristics of culture.
The author suggested that the distribution of language speakers reflected the distribution of
economic power in the world. Latin, for example, was a universal language in Europe during
the Middle Ages and the Renaissance. French was once known as the universal language of
diplomacy, and English today is often said to fill such a role in world commerce. During the
supremacy of the Soviet Union, Russian was the language which was thought in most
countries. The decline of the Russian power has been accompanied by a parallel decline in
the use of Russian as a second language. Since the late twentieth century, China’s economic
power has stimulated the learning of Chinese in other countries. However, none of those has
been able to become a universal language. With the aim of making international
communication simpler, numerous efforts have also been made to create artificial languages
during the past centuries (i.e. Volapuk, created by Johann Martin Schleyer in 1880, or
Esperando, created by Ludwig L. Zamenhof in 1887).
Figure 1 The most spoken languages in the world (millions of speakers), 2010
Source: www.visionofhumanity.org
The graph above presents the most spoken languages in the world in 2010 and as stated
above, it shows that the two most spoken languages are also the greatest economic powers
in the world.
The demographic influences upon economic growth
For decades, economists and social thinkers debated the influence of population change on
economic growth. Bloom et al. (2001) defined three alternative hypotheses: that population
growth restricts, promotes, or is independent of economic growth. Each hypothesis was
mil

5
sustained with strong arguments, and all the arguments mostly focused on population size
and growth. The debates revealed other important issues, such as the age structure of the
population – the way in which the population is distributed across different age groups.
The author revealed that due to the fact that people’s economic behavior varies at different
stages of life, changes in a country’s age structure can have significant effects on its
economic performance. In this respect, nations with a high proportion of children are likely
to devote a high proportion of resources to their care, which tends to depress the pace of
economic growth. By contrast, if most of a nation’s population falls within the working-ages,
the added productivity of this group can produce an increase in the economic growth. This is
how the combined effect of this large working-age population and health, family, labor,
financial and human capital policies can create virtuous cycles of wealth creation. On the
other hand, if a large proportion of a nation’s population consists of the elderly, the effects
can be similar to those of a very young population: a large share of resources is needed by a
relatively less productive segment of the population, which likewise can inhibit economic
growth.
Further, Bloom et al. (2001) analyzed the three main mechanisms of population’s structure
for determining economic growth (labor supply, savings and human capital) and their
dependence of policy environment:
a growing number of adults will only be productive if there is sufficient flexibility in the
labor market to allow its expansion, and macroeconomic policies that permit and
encourage investment;
people will only save if they have access to adequate saving mechanisms and have
confidence in domestic financial markets;
the demographic transition creates conditions where people will tend to invest in their
health and education, offering great economic benefits, especially in the modern world’s
increasingly sophisticated economies.
3. Statistics on Social and Economic Developments in Romania
and European Union
This paper analyzes the social and economic developments in Romania by comparison with
other European Union countries, in order to identify the major distinctions and the source of
gaps. Romania is an emerging country and it registered a high economic growth in the last
ten years, which was not accompanied by corresponding social development, due to the
6
huge inequality of income distribution within the population, measured by Gini coefficient1.
The Romanian financial crisis from 2008 was one of the most powerful crises, in comparison
to other EU countries. Its deepness was affected by the increased level of debt. Such context
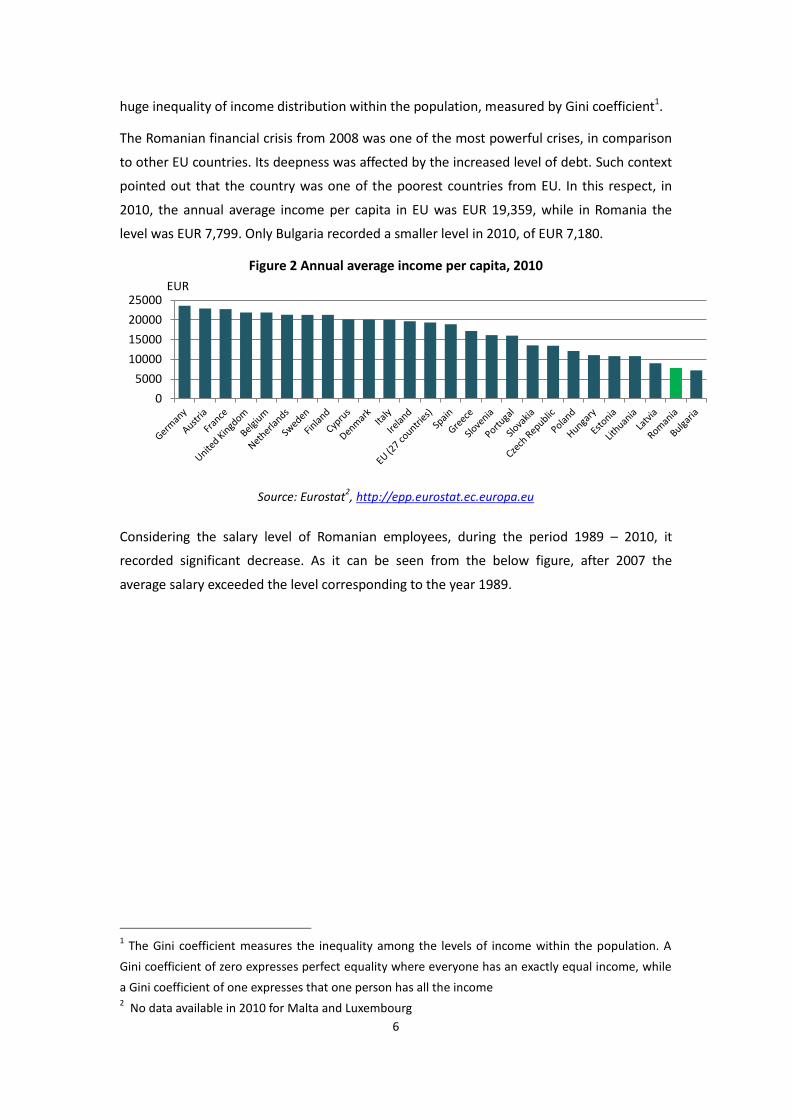
pointed out that the country was one of the poorest countries from EU. In this respect, in
2010, the annual average income per capita in EU was EUR 19,359, while in Romania the
level was EUR 7,799. Only Bulgaria recorded a smaller level in 2010, of EUR 7,180.
Figure 2 Annual average income per capita, 2010
Source: Eurostat2, http://epp.eurostat.ec.europa.eu
Considering the salary level of Romanian employees, during the period 1989 – 2010, it
recorded significant decrease. As it can be seen from the below figure, after 2007 the
average salary exceeded the level corresponding to the year 1989.
1 The Gini coefficient measures the inequality among the levels of income within the population. A
Gini coefficient of zero expresses perfect equality where everyone has an exactly equal income, while
a Gini coefficient of one expresses that one person has all the income 2 No data available in 2010 for Malta and Luxembourg
0
5000
10000
15000
20000
25000 EUR

7
Figure 3 The evolution of salary in Romania, during 1989 – 2010
Source: INSSE Data, www.insse.ro
Romania is one of the eight countries which, during 2009 – 2010, did not raise the level of
minimum salary, and considering the increasing inflation rates, the real minimum salary
registered a significant decrease.
As a consequence of the evolution of the Romanian salary, the income stopped being an
adequate indicator of the living standard. Furthermore, there are two main sources of the
salary’s evolution: the decrease of the number of employees and the salary clustering, which
means that high-value salaries increased significantly, while small-value salaries continued to
decrease. In 1989 the minimum salary encountered almost 57% of the average salary, while
in 2010, it represented only 31% of the average salary.
Figure 4 Number of employees vs. number of retired people and farmers
Source: INSSE Data, www.insse.ro
The significant decrease of the number of employees was accompanied by the ascendant
100 105
86 75
62 62 70 77 59 62 62 59 62 64 71 78
89 97 112
130 128 125
95 78
54 38 33 33 31 26 29 26 30
42 44 56
56 57 57 64 78 87
82
57 50 48 37 31 27 24 20 22 25 22 25 32 32
38 34 32 29 28 29 33 31
0
50
100
150
19
89
19
90
19
91
19
92
19
93
19
94
19
95
19
96
19
97
19
98
19
99
20
00
20
01
20
02
20
03
20
04
20
05
20
06
20
07
20
08
20
09
20
10
Minimum gross salary (% from the level of 1989)
Average gross salary (% from the level of 1989)
Minimum salary as % from the average gross salary
%
8 8.2
7.6 6.9 6.7
6.4 6.2 5.9
5.6 5.4 4.8 4.6 4.6 4.6 4.6 4.5 4.6 4.7 4.9 5 4.8 4.3
2.8 3.6 4 4.2 4.4 4.9 5.2
5.4
5.5 5.7 5.9 6.1 6.3 6.3 6.3 6.2 6 5.8 5.7 5.7 5.7 5.7
0
2
4
6
8
10
Employees Retired people and farmers
mil

8
trend of the retirement. This was due to the favorable anticipated retirement policy of
Romania. In this respect, income from salaries was replaced by income from pensions, which
led to substantial loss in the national domestic product.
Figure 5 Gini Coefficient, 2010
Source: Eurostat, http://epp.eurostat.ec.europa.eu
Romania recorded in 2010 one of the highest Gini coefficients (35%), suggesting a significant
inequality of income distribution among its population.
The figure below presents the evolution of Romanian GDP as compared to the year 1989. As
can be seen, it was just in 2004 that the GDP exceeded the level from 1989. Also, starting
with 2008, it recorded a new descendent trend.
Figure 6 Evolution of GDP in Romania
Source: Eurostat, http://epp.eurostat.ec.europa.eu
In Romania, the social public expenditures are undersized as compared to the other
European countries. In 2008, the average European level of the social public expenditures
was 56.2%, while in Romania the level reached only 37.3% of the GDP.
100 94 82
73 74 78 85 89 83
78 77 79 85 90 95
104 108 116 122 129 122 121
0 20 40 60 80
100 120 140
%, base year 1989
0 5
10 15 20 25 30 35 40
Lith
uan
ia
Latv
ia
Spai
n
Po
rtu
gal
Ro
man
ia
Bu
lgar
ia
Irel
and
Un
ited
Kin
gdo
m
Gre
ece
Cro
atia
Esto
nia
Ital
y
Po
lan
d
Euro
pea
n U
nio
n …
Fran
ce
Swit
zerl
and
Ger
man
y …
Cyp
rus
Mal
ta
Luxe
mb
ou
rg
Den
mar
k
Bel
giu
m
Au
stri
a
Slo
vaki
a
Icel
and
Net
her
lan
ds
Fin
lan
d
Cze
ch R
epu
blic
Hu
nga
ry
Swed
en
Slo
ven
ia
No
rway
%

9
Figure 7 Social public expenditures, % of GDP, average 2000 – 2008
Source: Eurostat, http://epp.eurostat.ec.europa.eu
With respect to the average Human Development Indicator during 2005 – 2009, Romania
recorded one of the lowest levels, being closely followed by Bulgaria. On the other hand, the
levels of HDI within EU countries are slightly different.
Figure 8 HDI Average in EU countries, 2005 – 2009
Source: Eurostat, http://epp.eurostat.ec.europa.eu
As a result of the uncertain developments in the Romanian economy, the living standard did
not registered significant improvements during 1989 – 2010. From 2008, the country was
affected by the global economic crisis. In this respect, one solution may be the increasing of
foreign investments, which could help the local economy recovering.
4. Econometric Model and Empirical Results for EU countries
The econometric model tested in this section aims to identify the social factors which are
correlated with the economic growth and their impact upon a country’s welfare.
39 37 37 35 34 32 32 31 31 30 29 29 29 29 28 28 26 26 25 24 23 23 22 22 22 21 20 19
0 5
10 15 20 25 30 35 40 45
% of GDP
0.00 0.20 0.40 0.60 0.80 1.00
HDI

10
The econometric analysis is performed using a panel data consisting in annual data extracted
from 2005-2009 for EU countries3. The real GDP per capita indicator is used as dependent
variable, while the independent variables are as follows:
population at risk of poverty,
unemployment rate,
life expectancy and
expected years of schooling.
For the expected years of schooling, population at risk of poverty, life expectancy and GDP /
capita the logarithmic values were used, in order to have to ensure data consistency (due to
the fact that the unemployment rate was expressed as percentage rate).
In order to choose the most adequate estimation method within the econometric
estimation, the Hausman test is performed. As shown in the table below, the test returns a
value equal to 0.00 and considering the null hypothesis of this test (that individual errors of
the panel data are not correlated with the independents variables), the estimation with no
effects is further performed.
Table 1 Result of Hausman Test
Correlated Random Effects - Hausman Test
Equation: panel_model
Test cross-section random effects
Test Summary Chi-Sq. Statistic Chi-Sq. d.f. Prob.
Cross-section random 58.276556 4 0.0000
Cross-section random effects test comparisons:
Variable Fixed Random Var(Diff.) Prob.
LN_RISK_POVERTY -0.039532 -0.044916 0.000003 0.0031
UNEMPLOYMENT -2.026851 -2.095464 0.000141 0.0000
LN_LIFE_EXPECTANCY 2.914816 3.551845 0.008933 0.0000
LN_YEARS_SCHOOLING -0.042254 -0.059056 0.000130 0.1399
According to the multiple model tested, the independent factors have a significant influence
on the economic growth. In going further, the impact of each factor upon the GDP/capita is
presented in the Table 2:
3 Data source: Eurostat, http://epp.eurostat.ec.europa.eu
11
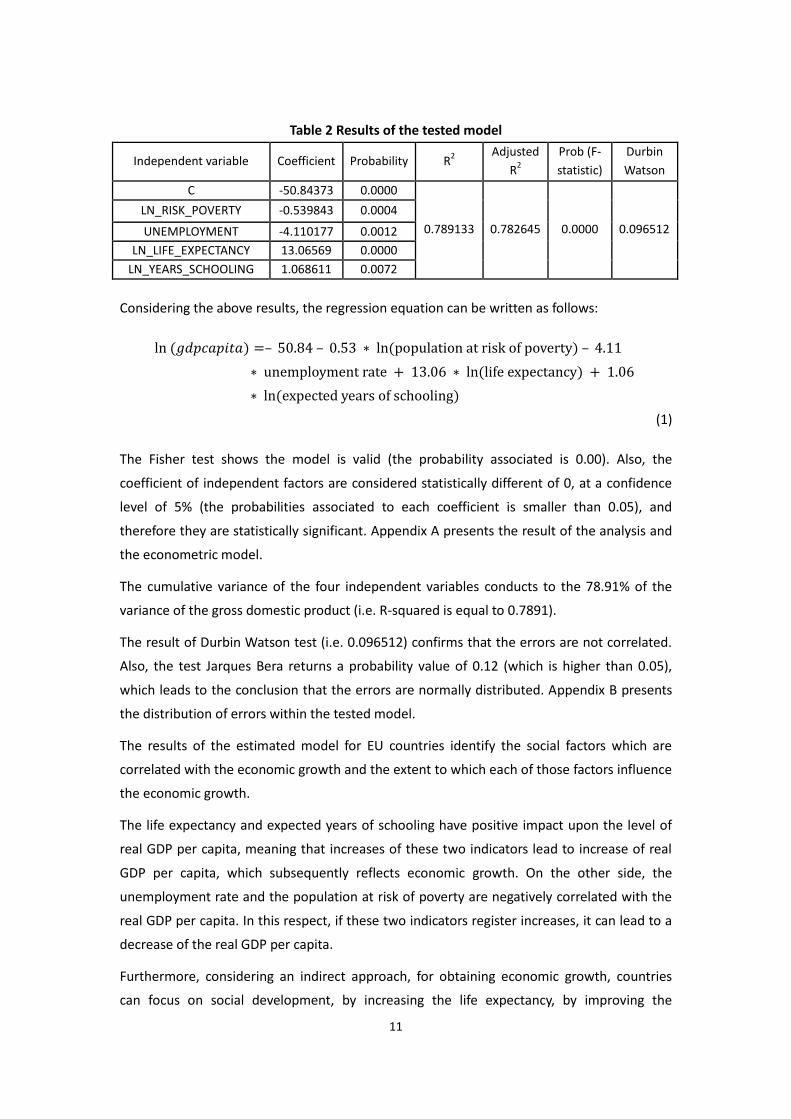
Table 2 Results of the tested model
Independent variable Coefficient Probability R2
Adjusted
R2
Prob (F-
statistic)
Durbin
Watson
C -50.84373 0.0000
0.789133 0.782645 0.0000 0.096512
LN_RISK_POVERTY -0.539843 0.0004
UNEMPLOYMENT -4.110177 0.0012
LN_LIFE_EXPECTANCY 13.06569 0.0000
LN_YEARS_SCHOOLING 1.068611 0.0072
Considering the above results, the regression equation can be written as follows:
(1)
The Fisher test shows the model is valid (the probability associated is 0.00). Also, the
coefficient of independent factors are considered statistically different of 0, at a confidence
level of 5% (the probabilities associated to each coefficient is smaller than 0.05), and
therefore they are statistically significant. Appendix A presents the result of the analysis and
the econometric model.
The cumulative variance of the four independent variables conducts to the 78.91% of the
variance of the gross domestic product (i.e. R-squared is equal to 0.7891).
The result of Durbin Watson test (i.e. 0.096512) confirms that the errors are not correlated.
Also, the test Jarques Bera returns a probability value of 0.12 (which is higher than 0.05),
which leads to the conclusion that the errors are normally distributed. Appendix B presents
the distribution of errors within the tested model.
The results of the estimated model for EU countries identify the social factors which are
correlated with the economic growth and the extent to which each of those factors influence
the economic growth.
The life expectancy and expected years of schooling have positive impact upon the level of
real GDP per capita, meaning that increases of these two indicators lead to increase of real
GDP per capita, which subsequently reflects economic growth. On the other side, the
unemployment rate and the population at risk of poverty are negatively correlated with the
real GDP per capita. In this respect, if these two indicators register increases, it can lead to a
decrease of the real GDP per capita.
Furthermore, considering an indirect approach, for obtaining economic growth, countries
can focus on social development, by increasing the life expectancy, by improving the
12
education and raising the expected years of schooling, by reducing the poverty (more
specifically, the population at risk of poverty) and also by controlling the unemployment rate.
Considering the above, it can be stated that the continuous investment in human capital
development, through various channels (e.g. education, standard of living, poverty
reducing), contributes to economic benefits on long term. The analysis performed proves the
relevance of cultural and demographic influences when analyzing the economic growth.
The figure below also reveals relation between the economic growth and the life expectancy,
respectively, the relation between economic growth and Gini coefficient, for the EU
countries.
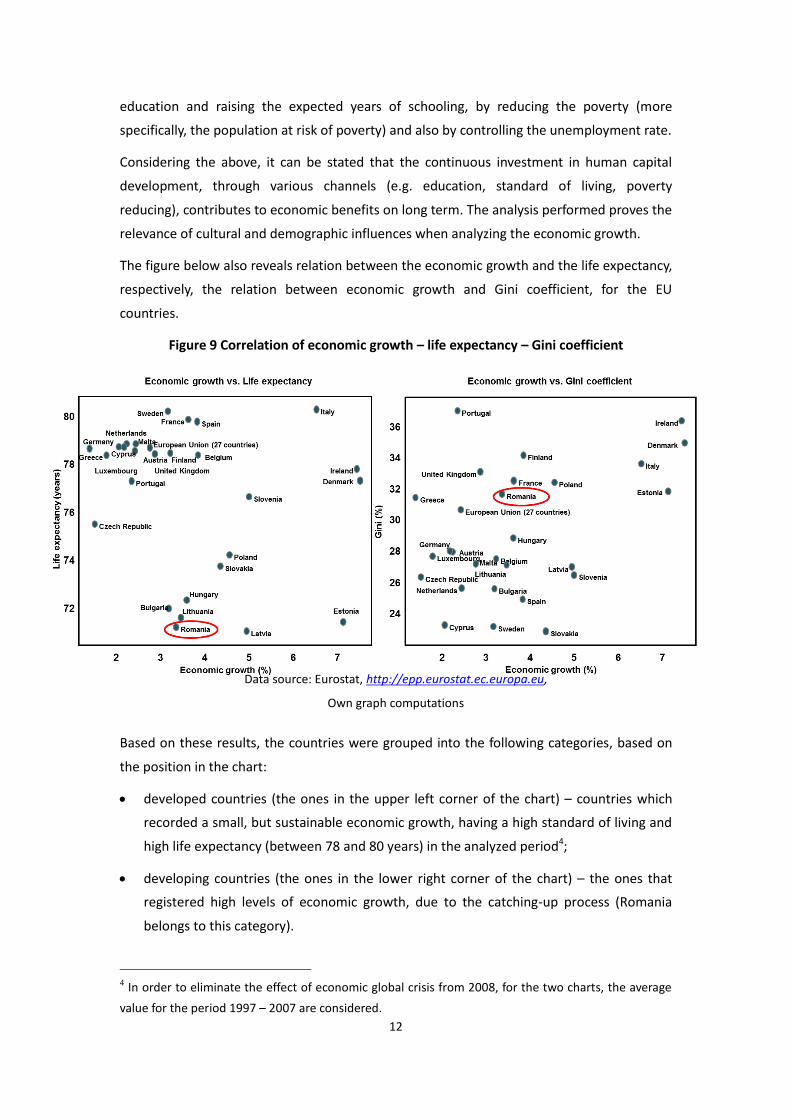
Figure 9 Correlation of economic growth – life expectancy – Gini coefficient
Data source: Eurostat, http://epp.eurostat.ec.europa.eu,
Own graph computations
Based on these results, the countries were grouped into the following categories, based on
the position in the chart:
developed countries (the ones in the upper left corner of the chart) – countries which
recorded a small, but sustainable economic growth, having a high standard of living and
high life expectancy (between 78 and 80 years) in the analyzed period4;
developing countries (the ones in the lower right corner of the chart) – the ones that
registered high levels of economic growth, due to the catching-up process (Romania
belongs to this category).
4 In order to eliminate the effect of economic global crisis from 2008, for the two charts, the average
value for the period 1997 – 2007 are considered.
13
Also, by considering the relation between the Gini coefficient and the economic growth, the
figure points out that along with the high level of income, the countries should also focus on
the distribution of the income within the population.
For further analysis, there were determined the clusters within the EU countries5 based on
the real GDP per capita along with other social indicators (i.e. Gini coefficient, life
expectancy, total socio-cultural expenditures, unemployment rate, population at risk of
poverty, expected years of schooling, degree of enrolment in education.
The results are presented in the Appendix of the paper. The analysis reveals that, from a
social and economic perspective, the highest similarities are between the following couples
of countries: Finland and Sweden, Romania and Bulgaria and Germany and Italy.
On the other hand, the countries are grouped into 3 clusters, which also reflect the
economic stability and the membership status within the EU:
Cluster 1 – developed countries: founder countries (e.g. Belgium, France, Germany,
Italy), and countries that have accessed EU until 1995. These countries made significant
investments in human capital and they enjoyed long term economic development.
Cluster 2 – developing countries: part of countries that accessed EU in 2004 and in 2007.
Romania belongs to this cluster. The countries are mainly focused on economic growth
and financial stability, the decrease of the export dependence and the debt level. Also
they invest in technological progress and innovation. The main challenges those
countries are facing are related to the migration of the work force, the weaknesses
within the education and health systems;
Cluster 3 – small countries, but with financial stability. The cluster is composed by a part
of the countries which accessed EU in 2004 (Czech Republic, Cyprus, Malta, Slovakia and
Slovenia) and Luxembourg. They are not part of the first cluster due to the smaller
economy and also not part of the second cluster to human capital development.
Also, the position of a country within a cluster is strongly correlated with the value of HDI
indicator, as shown below:
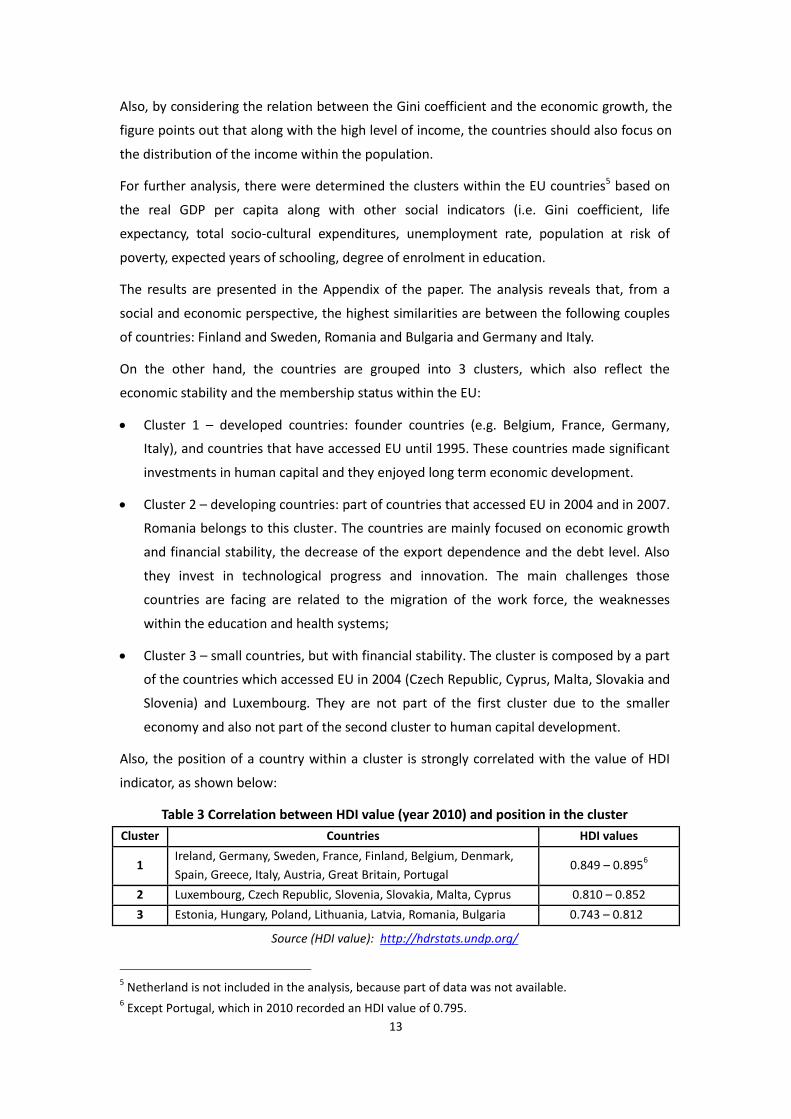
Table 3 Correlation between HDI value (year 2010) and position in the cluster
Cluster Countries HDI values
1 Ireland, Germany, Sweden, France, Finland, Belgium, Denmark,
Spain, Greece, Italy, Austria, Great Britain, Portugal 0.849 – 0.895
6
2 Luxembourg, Czech Republic, Slovenia, Slovakia, Malta, Cyprus 0.810 – 0.852
3 Estonia, Hungary, Poland, Lithuania, Latvia, Romania, Bulgaria 0.743 – 0.812
Source (HDI value): http://hdrstats.undp.org/
5 Netherland is not included in the analysis, because part of data was not available.
6 Except Portugal, which in 2010 recorded an HDI value of 0.795.

14
The above results show the correlation between the human development and
economic growth, as the countries from cluster 1 (develop countries) encounter the
highest levels of HDI indicator (except Portugal), being followed by countries from
cluster 3 (small countries, but which invested in human capital) and countries from
cluster 2 (developing countries).
5. Conclusions
The analysis of correlation between the social factors and the economic growth reveals the
impact of human development upon the economic development, both through direct and
indirect mechanisms.
As it was showed, both cultural and demographic factors have specific influences on the
economy. More specifically, the culture defines the way population’s preferences, the way
they take decision, the perception upon living and the perspective for the futures. On the
other site, the demographic factors are important, mainly because of the population
structure and the capacity of working and contributing to the GDP.
In respect of the analysis of social and economic environment in Romania, the study
identified that the main difficulties are related to the fact that the country registered one of
the highest Gini coefficient, one of the lowest HDI Indicator and a very small increase in the
level of the GDP after the events from 1989.
The results of the econometric analysis performed for EU countries pointed out the factors
that are positively correlated with the economic growth (i.e. the expected years of schooling
and the life expectancy) and, respectively, the factors that are negatively correlated with the
economic growth (i.e. the population at risk of poverty and the unemployment rate).
Further, considering a long term approach, social development and the improvement of the
living standard can lead to sustainable economic growth.
On the other side, the clustering analysis and the presentation of the global evolution of
social and economic environment has also determined a strong relation between the human
development within a country and its economic development.
Moreover, the correlation between the factors measuring the social wellness and the
economic growth should be completed with the analysis of other complex factors (e.g.
financial, political and legislative) and should also be leveraged for each country.
Nevertheless, the analysis performed within the paper is relevant and is relies on a concept
that has a significant importance for the macroeconomic policy: the analysis of social factors
can reflect the differences between the degrees of development among multiple countries.

15
Thus, continuous investment in human capital leads to sustainable development and should
be considered within the economic policies as one of the basic objectives of any country
wishing to achieve high standards of living and economic welfare.
Acknowledgements
I am greatly thankful to Professor Laura-Mihaela Obreja Brașoveanu, who supervised my
work for the graduation thesis and also for her support, constructive comments and useful
suggestions provided during the writing of this paper. I also acknowledge the support and
useful suggestions of Andreea Stoian, the Executive Editor of RJFP.
References
Barro, R., Sala-i-Martin, X., 1996. The Classical Approach to Convergence Analysis. The
Economic Journal, vol. 106, no. 437.
Birdsall, N., Kelley, A., Sinding, S., 2001. Population Matters: Demographic Change. Economic
Growth, and Poverty in the Developing World, New York, NY: Oxford University
Press.
Bloom, D., Canning, D., Sevilla, J., 2001. Economic Growth and Demographic Transition.
National Bureau of Economic Research.
Guiso, L., Sapienza, P., Zingales, L., 2004. Does culture affect economic outcomes. The Journal
of Economic Perspectives.
Guo, R., 2006. Cultural influences on Economic Analysis: Theory and Empirical Evidence.
Palgrave Macmillan.
Harrison, L., Huntington, S., 2000. Culture Matters: How Values Shape Human Progress. Basic
Books.

16
APPENDIX – Output of cluster analysis