
VOLUME P1 – PORTFOLIO BEST PRACTICES REPORT · Itron, Inc. P1-2 Portfolio Best Practices Report...
101
NATIONAL ENERGY EFFICIENCY BEST PRACTICES STUDY VOLUME P1 – PORTFOLIO BEST PRACTICES REPORT Submitted to California Best Practices Project Advisory Committee Rafael Friedmann Contract Manager Pacific Gas and Electric Company P.O. Box 770000, N6G San Francisco, CA 94177 Submitted by PRIME CONTRACTOR ITRON, INC. 1111 BROADWAY, SUITE 1800 OAKLAND, CA 94607 Volume P1 Report Contractor – Itron, Inc. July 2008 ©2008 Itron Inc. All Rights Reserved.
Transcript of VOLUME P1 – PORTFOLIO BEST PRACTICES REPORT · Itron, Inc. P1-2 Portfolio Best Practices Report...
NATIONAL ENERGY EFFICIENCY BEST PRACTICES STUDY VOLUME P1 – PORTFOLIO BEST PRACTICES REPORT
Submitted to California Best Practices Project Advisory Committee Rafael Friedmann Contract Manager Pacific Gas and Electric Company P.O. Box 770000, N6G San Francisco, CA 94177 Submitted by PRIME CONTRACTOR ITRON, INC. 1111 BROADWAY, SUITE 1800 OAKLAND, CA 94607
Volume P1 Report Contractor – Itron, Inc. July 2008 ©2008 Itron Inc. All Rights Reserved.
Itron, Inc. i Table of Contents Portfolio Best Practices Report
TABLE OF CONTENTS
SECTION
PAGE
ES. EXECUTIVE SUMMARY P1-1
ES.1 Introduction P1-1
ES.2 Key Category Themes P1-1
ES.3 Best Practices Summaries P1-3
1. OVERVIEW OF PORTFOLIOS P1-21
1.1 Primary Characteristics P1-21
1.2 Administrative Models P1-25
2. CONTEXT AND ENVIRONMENT P1-28
2.1 Issues P1-28
2.2 Challenges P1-35
3. COMPARISON OF PORTFOLIO COMPONENTS P1-41
3.1 Portfolio Objectives P1-41
3.2 Portfolio Design P1-46
3.3 Portfolio Management Practices P1-52
3.4 Evaluation and Adaptation P1-68
3.5 Regulatory and Policy Environment P1-72
APPENDIX A - Methodology P1-88
APPENDIX B - Sources P1-92
Itron, Inc. ii Portfolio Best Practices Report
ACKNOWLEDGEMENTS
The Best Practices Study team would like to gratefully acknowledge the participation of the following individuals and their organizations in this report:
• Dennis Brandt and Steve Sim, Florida Power and Light
• Blair Hamilton, Efficiency Vermont
• Fred Gordon, Energy Trust of Oregon
• Deb Sundin, Xcel Energy (MN)
• Rick Leuthauser, MidAmerican Energy
• Paul DeCotis and Larry Pakenas, NYSERDA
• Gene Rodrigues, Don Arambula, David Bruder and John Nall, Southern California Edison
• Mark Gaines, Athena Besa, Rick Hobbs, Sandra Williams and Frank Spasaro, Sempra Utilities
• Roland Risser, Bill Miller, Duane Larson, Steve McCarty and Patricia Lawrence, Pacific Gas and Electric Company
These individuals participated in lengthy interviews in which they generously shared their expertise and lessons learned in Portfolio design, management, and implementation, and the influence of overarching policies surrounding portfolio implementation. Without their participation and the support of their organizations, this report would not have been possible.
We also thank the members of the Best Practices Study’s Project Advisory Committee for their inspiration, insights, tireless review and thoughtful direction throughout the project:
• Rafael Friedmann – Pacific Gas and Electric Company
• Pierre Landry – Southern California Edison Company
• Rob Rubin – Sempra Utilities
• Peter Lai – California Public Utilities Commission, Energy Division
• Don Schwartz – California Energy Commission
Finally, these reports benefited greatly from the tireless production efforts of Alex Kang.
Itron, Inc. iii Portfolio Best Practices Report
CONTACT INFORMATION
Rafael Friedmann Best Practices Study Contract Manager Pacific Gas and Electric Company P.O. Box 770000, N6G San Francisco, CA 94177 415-972-5799 [email protected]
Jennifer Fagan and Mike Rufo Best Practices Study Prime Contractor Leads Itron, Inc. 1111 Broadway, Suite 1800 Oakland, CA 94607 608-235-1314, 510-844-2800 [email protected] [email protected] [email protected]
Jennifer Fagan and Mike Rufo P1 Portfolio Best Practices Report Leads Itron, Inc. 1111 Broadway, Suite 1800 Oakland, CA 94607 608-235-1314, 510-844-2800 [email protected] [email protected] [email protected]
Itron, Inc. iv Portfolio Best Practices Report
BEST PRACTICES PORTFOLIO REPORT – HOW TO USE THE INFORMATION
This Portfolio Best Practices report was prepared for two distinct audiences – portfolio administrators and portfolio regulators. Each of these audiences has a unique set of interests and perspectives. Portfolio administrators are most concerned with effective portfolio design, management and evaluation, while regulators are also responsible for establishing an effective and fair regulatory and policy structure governing portfolio management.
For these reasons, the set of Portfolio Best Practices selected was designed broadly, to address the interests of both audiences. Portfolio administrators are directed to pay particular attention to best practices related to Portfolio Planning, Design, Management and Evaluation. In addition to these areas, regulators should also pay close attention to best practices surrounding the portfolio’s Regulatory and Policy Environment. In addition, please note that certain best practices may not apply to particular types of portfolios, e.g., decoupling mechanisms would not apply to portfolios administered by non-profit organizations.
Itron, Inc. P1-1 Portfolio Best Practices Report
ES. EXECUTIVE SUMMARY
ES.1 INTRODUCTION
This report presents the results of a comparative analysis of Best Practices at the portfolio level. The overall Best Practices Study objectives, scope, and methodology are briefly outlined in Appendix A of this report.
The Best Practices Study team (“Best Practices Team”) reviewed nine energy efficiency portfolios for this study. The portfolios are listed in Exhibit P1-E1 below and presented in the body of this report.
Exhibit P1-E1 Portfolios Reviewed
Portfolio Name/Implementer Abbreviation for Report
NYSERDA NYSERDA
Efficiency Vermont EVT
Energy Trust of Oregon Trust
Xcel Energy (Minnesota) Xcel (MN)
MidAmerican Energy MidAmerican
Florida Power and Light FPL
Pacific Gas and Electric PG&E
Southern California Edison SCE
Sempra Utilities (San Diego Gas and Electric and Southern California Gas) Sempra
ES.2 KEY CATEGORY THEMES
Five major themes cut across all of the portfolios reviewed for this report:
Successful portfolios share many common characteristics, even if they appear to be very different in terms of their administrative models, funding sources and governance. These characteristics are:
• Deeply committed senior management and program staff
• Clearly defined goals and objectives
• Data-driven, systematic and comprehensive portfolio and program planning processes
• Stable program funding sources and levels
Itron, Inc. P1-2 Portfolio Best Practices Report
Portfolios use a combination of strategies to successfully address the many challenges they face, some of which are common to all and others which are unique to a state or region. These challenges include:
• Dramatically increased savings goals combined with potential for decreased contributions from key technologies, due to transformation of underlying markets and high market saturation levels.
• Increased complexity of program delivery, for example, due to increased requirements to provide for integrated delivery of energy efficiency with demand-response, self-generation, and advanced metering programs.
• Changing codes and standards and associated baselines, requiring continuous adjustment of energy efficient measures promoted by the programs.
• Maturity in certain energy efficient equipment markets, leading to high market saturation levels and/or increased free-ridership.
• Increased need for development of energy efficiency infrastructure. Human resource needs are particularly acute, due to the aging workforce.
• Budget challenges due to capped funding levels.
A strong commitment by senior management to the portfolio, their willingness to provide the resources needed to support it, and their creation of a culture that values and nurtures its activities and results, are key success elements. Elements of a highly supportive working environment include:
• A mission statement that is aligned with the portfolio’s objectives and values; role modeling of the mission in the organization’s activities.
• Senior management that continually emphasizes the importance of the portfolio’s activities and accomplishments throughout the organization.
• Budgets and staffing levels that are sufficient to support the portfolio’s activities.
• A work culture that emphasizes and rewards continuous improvement in portfolio achievements.
• Advocacy of portfolio-friendly regulatory and legislative policies such as instituting decoupling mechanisms, performance-based incentives, and cost-effectiveness procedures, among others.
Having clearly defined and measurable objectives, understanding the relative importance of each, and regularly monitoring progress against these objectives are key to the portfolio’s ability to attain them. The principle underlying this best practice is that “you can’t manage what you don’t measure”. Effective management of the portfolio by its objectives requires:
• Objectives that are actionable, measurable and aligned with the overall policy goals.
Itron, Inc. P1-3 Portfolio Best Practices Report
• Tools to facilitate regular monitoring of progress against these objectives.
Having a balanced portfolio with a diverse set of programs representing different markets, delivery strategies, and maturity levels is essential. Of nearly equal importance are having the flexibility to make changes at any time, so that initiatives can be continually adjusted and rebalanced as circumstances warrant. Reasons for rebalancing include:
• Treatment of energy efficiency as a resource in energy procurement decisions
• Changes in end-user and market acceptance of existing technologies (as compared to initial forecasts)
• Introduction of new technologies
• Changing codes and standards
• Desire to test new approaches to determine their effectiveness
ES.3 BEST PRACTICES SUMMARIES
Best practices are identified in this study for each of the major portfolio components used to organize data collection and analysis. These components are:
• Portfolio Goals and Objectives
• Portfolio Planning Process
• Portfolio Design: Adaptation to Changes in Technologies and Market Conditions
• Portfolio Management Practices
− Staffing Approach
− Program Integration
− Quality Control and Verification
− Reporting and Tracking
• Portfolio Evaluation and Adaptability
• Regulatory and Policy Environment
− Alignment with Organizational Strategic and Financial Goals
− Impact on Short-term and Long-term Resource Planning
− Avoided Cost and Cost-effectiveness Procedures
− Funding Stability/Funds Management
Itron, Inc. P1-4 Portfolio Best Practices Report
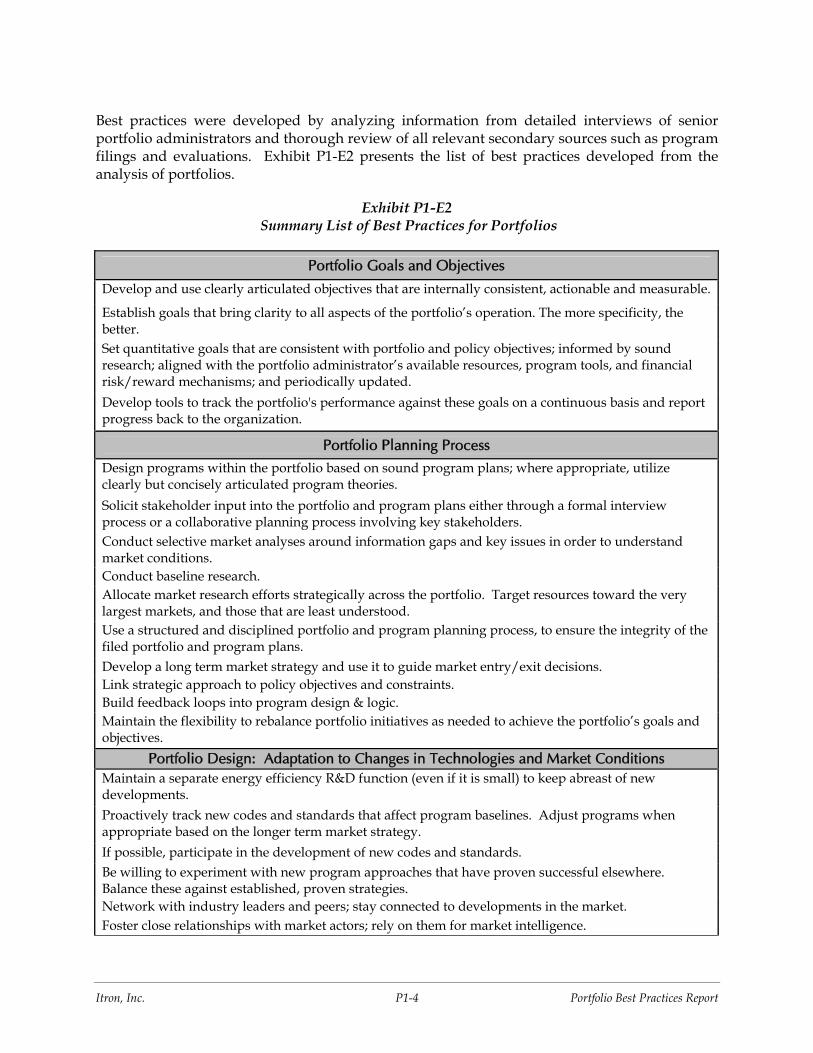
Best practices were developed by analyzing information from detailed interviews of senior portfolio administrators and thorough review of all relevant secondary sources such as program filings and evaluations. Exhibit P1-E2 presents the list of best practices developed from the analysis of portfolios.
Exhibit P1-E2 Summary List of Best Practices for Portfolios
Portfolio Goals and Objectives
Develop and use clearly articulated objectives that are internally consistent, actionable and measurable.
Establish goals that bring clarity to all aspects of the portfolio’s operation. The more specificity, the better. Set quantitative goals that are consistent with portfolio and policy objectives; informed by sound research; aligned with the portfolio administrator’s available resources, program tools, and financial risk/reward mechanisms; and periodically updated. Develop tools to track the portfolio's performance against these goals on a continuous basis and report progress back to the organization.
Portfolio Planning Process
Design programs within the portfolio based on sound program plans; where appropriate, utilize clearly but concisely articulated program theories. Solicit stakeholder input into the portfolio and program plans either through a formal interview process or a collaborative planning process involving key stakeholders. Conduct selective market analyses around information gaps and key issues in order to understand market conditions. Conduct baseline research. Allocate market research efforts strategically across the portfolio. Target resources toward the very largest markets, and those that are least understood. Use a structured and disciplined portfolio and program planning process, to ensure the integrity of the filed portfolio and program plans. Develop a long term market strategy and use it to guide market entry/exit decisions. Link strategic approach to policy objectives and constraints. Build feedback loops into program design & logic. Maintain the flexibility to rebalance portfolio initiatives as needed to achieve the portfolio’s goals and objectives.
Portfolio Design: Adaptation to Changes in Technologies and Market Conditions Maintain a separate energy efficiency R&D function (even if it is small) to keep abreast of new developments. Proactively track new codes and standards that affect program baselines. Adjust programs when appropriate based on the longer term market strategy. If possible, participate in the development of new codes and standards. Be willing to experiment with new program approaches that have proven successful elsewhere. Balance these against established, proven strategies. Network with industry leaders and peers; stay connected to developments in the market. Foster close relationships with market actors; rely on them for market intelligence.
Itron, Inc. P1-5 Portfolio Best Practices Report
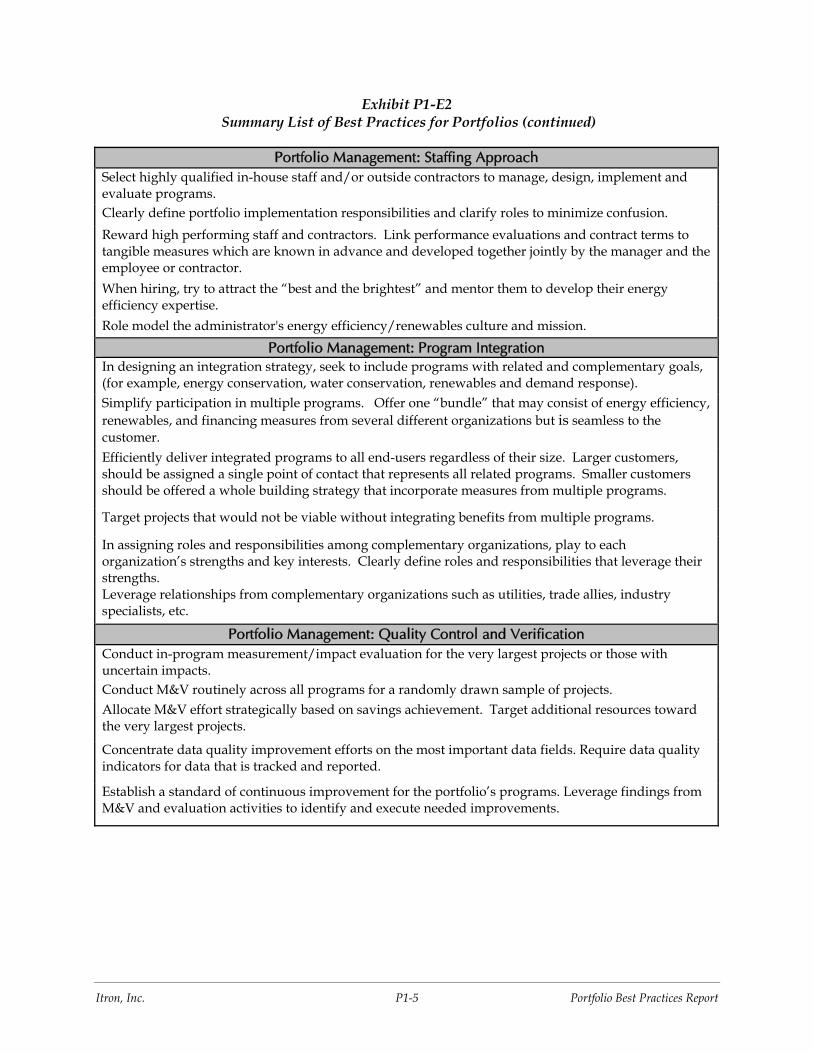
Exhibit P1-E2 Summary List of Best Practices for Portfolios (continued)
Portfolio Management: Staffing Approach Select highly qualified in-house staff and/or outside contractors to manage, design, implement and evaluate programs. Clearly define portfolio implementation responsibilities and clarify roles to minimize confusion. Reward high performing staff and contractors. Link performance evaluations and contract terms to tangible measures which are known in advance and developed together jointly by the manager and the employee or contractor. When hiring, try to attract the “best and the brightest” and mentor them to develop their energy efficiency expertise. Role model the administrator's energy efficiency/renewables culture and mission.
Portfolio Management: Program Integration In designing an integration strategy, seek to include programs with related and complementary goals, (for example, energy conservation, water conservation, renewables and demand response). Simplify participation in multiple programs. Offer one “bundle” that may consist of energy efficiency, renewables, and financing measures from several different organizations but is seamless to the customer. Efficiently deliver integrated programs to all end-users regardless of their size. Larger customers, should be assigned a single point of contact that represents all related programs. Smaller customers should be offered a whole building strategy that incorporate measures from multiple programs.
Target projects that would not be viable without integrating benefits from multiple programs.
In assigning roles and responsibilities among complementary organizations, play to each organization’s strengths and key interests. Clearly define roles and responsibilities that leverage their strengths. Leverage relationships from complementary organizations such as utilities, trade allies, industry specialists, etc.
Portfolio Management: Quality Control and Verification Conduct in-program measurement/impact evaluation for the very largest projects or those with uncertain impacts. Conduct M&V routinely across all programs for a randomly drawn sample of projects. Allocate M&V effort strategically based on savings achievement. Target additional resources toward the very largest projects.
Concentrate data quality improvement efforts on the most important data fields. Require data quality indicators for data that is tracked and reported.
Establish a standard of continuous improvement for the portfolio’s programs. Leverage findings from M&V and evaluation activities to identify and execute needed improvements.
Itron, Inc. P1-6 Portfolio Best Practices Report
Exhibit P1-E2 Summary List of Best Practices for Portfolios (continued)
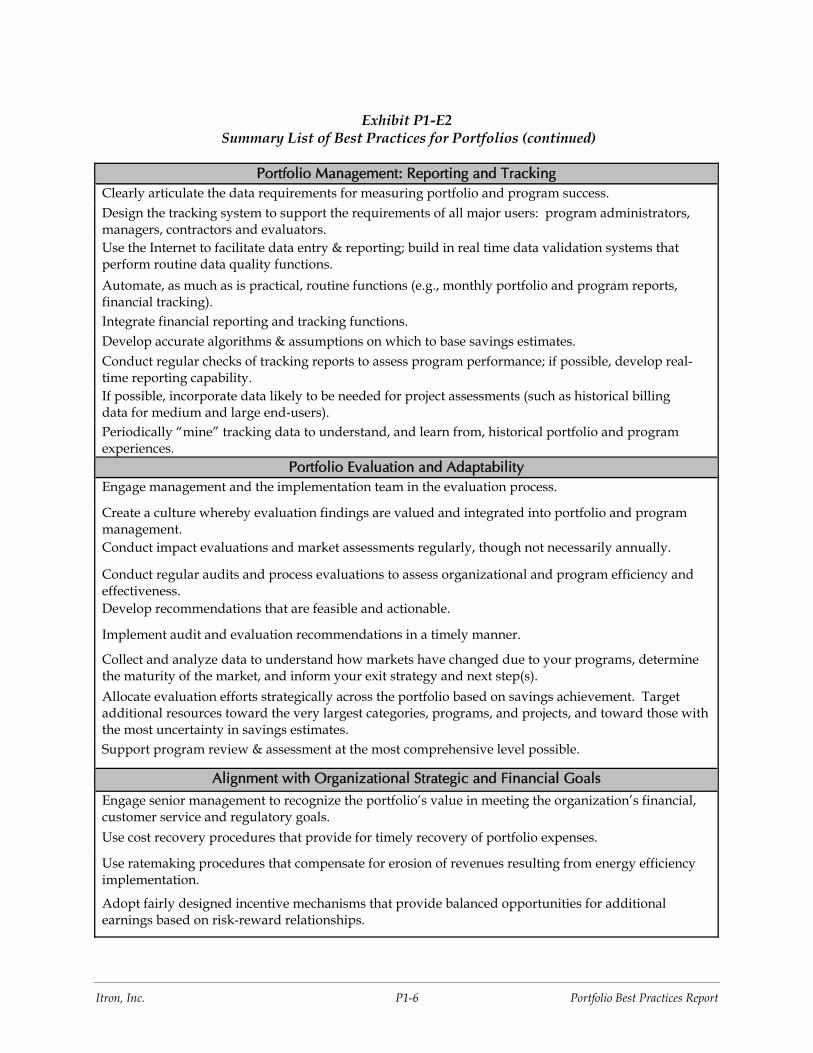
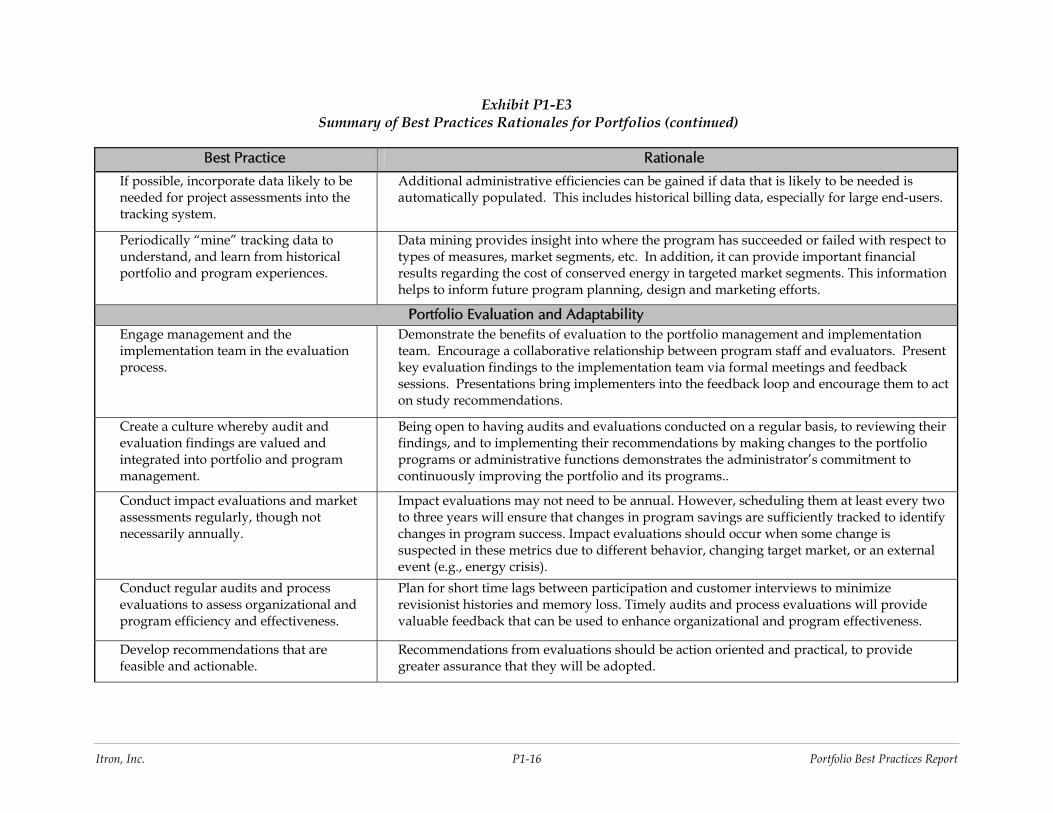
Portfolio Management: Reporting and Tracking Clearly articulate the data requirements for measuring portfolio and program success. Design the tracking system to support the requirements of all major users: program administrators, managers, contractors and evaluators. Use the Internet to facilitate data entry & reporting; build in real time data validation systems that perform routine data quality functions. Automate, as much as is practical, routine functions (e.g., monthly portfolio and program reports, financial tracking). Integrate financial reporting and tracking functions. Develop accurate algorithms & assumptions on which to base savings estimates. Conduct regular checks of tracking reports to assess program performance; if possible, develop real-time reporting capability. If possible, incorporate data likely to be needed for project assessments (such as historical billing data for medium and large end-users). Periodically “mine” tracking data to understand, and learn from, historical portfolio and program experiences.
Portfolio Evaluation and Adaptability Engage management and the implementation team in the evaluation process.
Create a culture whereby evaluation findings are valued and integrated into portfolio and program management. Conduct impact evaluations and market assessments regularly, though not necessarily annually.
Conduct regular audits and process evaluations to assess organizational and program efficiency and effectiveness. Develop recommendations that are feasible and actionable.
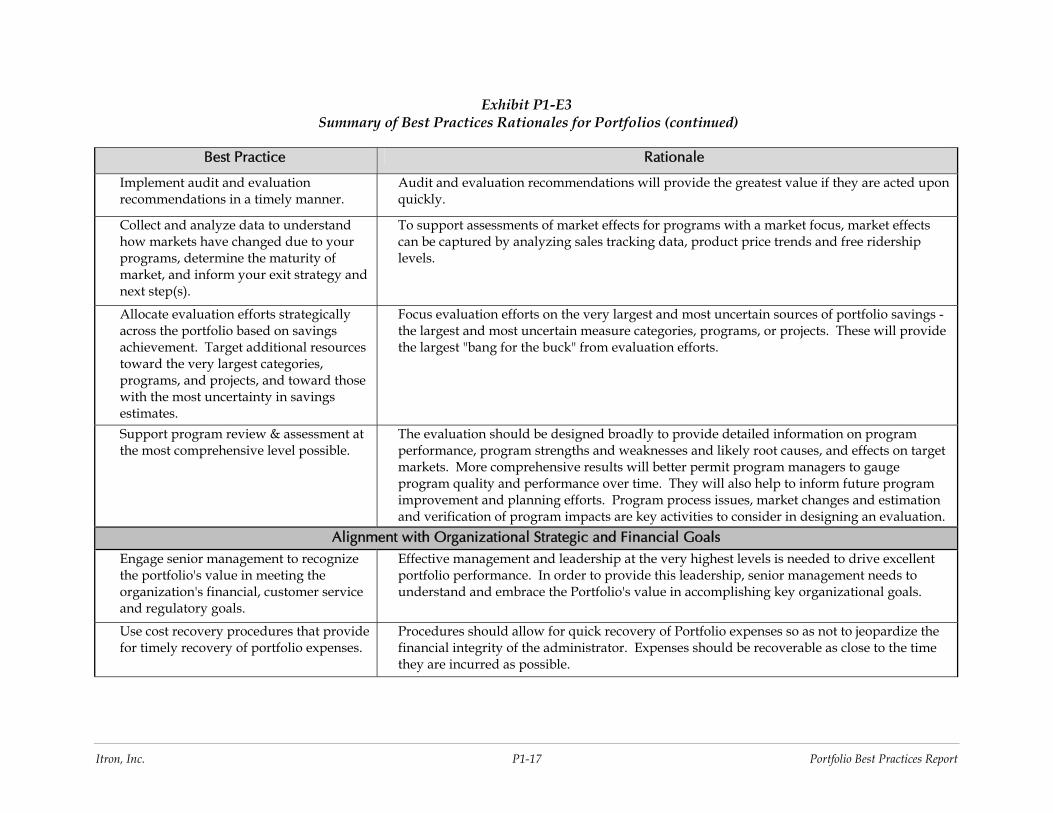
Implement audit and evaluation recommendations in a timely manner.
Collect and analyze data to understand how markets have changed due to your programs, determine the maturity of the market, and inform your exit strategy and next step(s). Allocate evaluation efforts strategically across the portfolio based on savings achievement. Target additional resources toward the very largest categories, programs, and projects, and toward those with the most uncertainty in savings estimates. Support program review & assessment at the most comprehensive level possible.
Alignment with Organizational Strategic and Financial Goals Engage senior management to recognize the portfolio’s value in meeting the organization’s financial, customer service and regulatory goals. Use cost recovery procedures that provide for timely recovery of portfolio expenses.
Use ratemaking procedures that compensate for erosion of revenues resulting from energy efficiency implementation.
Adopt fairly designed incentive mechanisms that provide balanced opportunities for additional earnings based on risk-reward relationships.
Itron, Inc. P1-7 Portfolio Best Practices Report
Exhibit P1-E2 Summary List of Best Practices for Portfolios (continued)
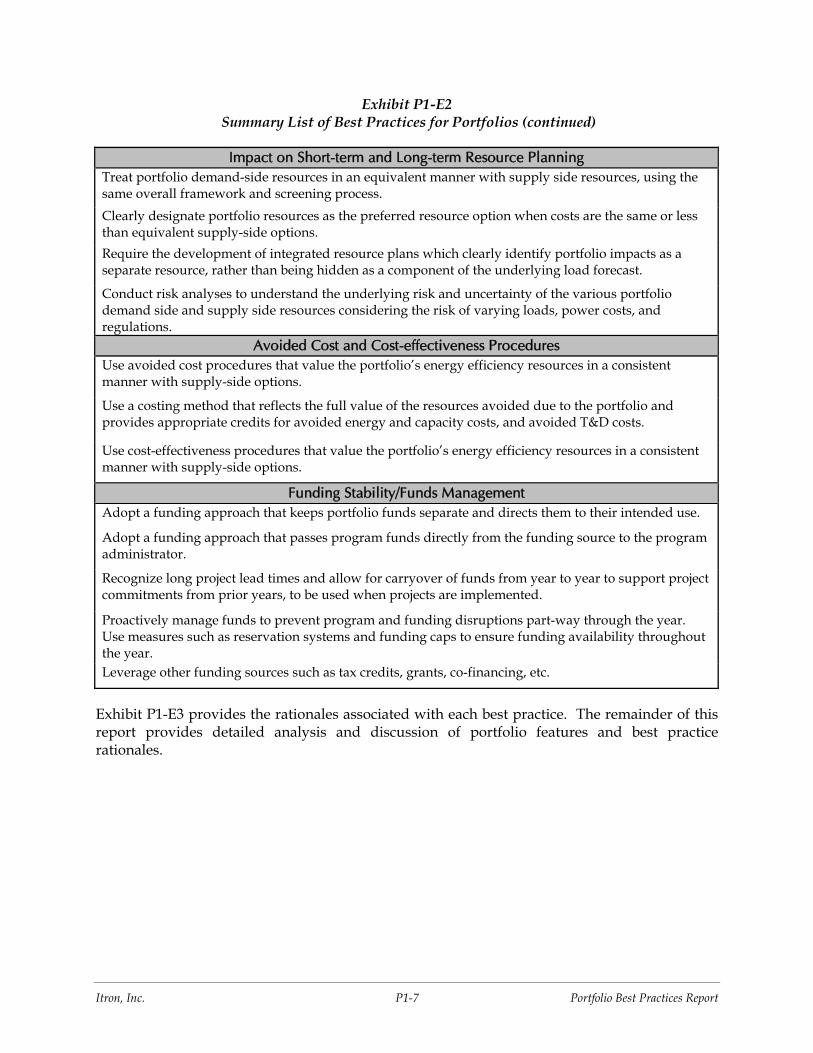
Impact on Short-term and Long-term Resource Planning Treat portfolio demand-side resources in an equivalent manner with supply side resources, using the same overall framework and screening process. Clearly designate portfolio resources as the preferred resource option when costs are the same or less than equivalent supply-side options. Require the development of integrated resource plans which clearly identify portfolio impacts as a separate resource, rather than being hidden as a component of the underlying load forecast.
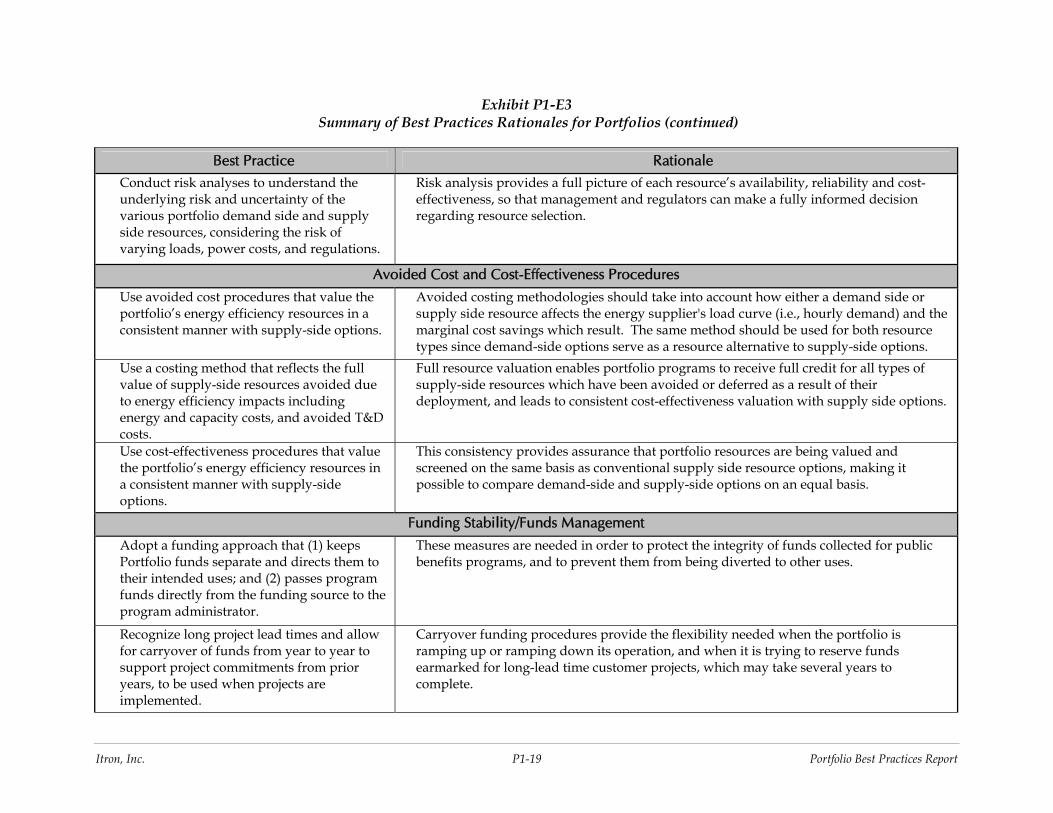
Conduct risk analyses to understand the underlying risk and uncertainty of the various portfolio demand side and supply side resources considering the risk of varying loads, power costs, and regulations.
Avoided Cost and Cost-effectiveness Procedures Use avoided cost procedures that value the portfolio’s energy efficiency resources in a consistent manner with supply-side options.
Use a costing method that reflects the full value of the resources avoided due to the portfolio and provides appropriate credits for avoided energy and capacity costs, and avoided T&D costs.
Use cost-effectiveness procedures that value the portfolio’s energy efficiency resources in a consistent manner with supply-side options.
Funding Stability/Funds Management Adopt a funding approach that keeps portfolio funds separate and directs them to their intended use.
Adopt a funding approach that passes program funds directly from the funding source to the program administrator.
Recognize long project lead times and allow for carryover of funds from year to year to support project commitments from prior years, to be used when projects are implemented.
Proactively manage funds to prevent program and funding disruptions part-way through the year. Use measures such as reservation systems and funding caps to ensure funding availability throughout the year. Leverage other funding sources such as tax credits, grants, co-financing, etc.
Exhibit P1-E3 provides the rationales associated with each best practice. The remainder of this report provides detailed analysis and discussion of portfolio features and best practice rationales.
Itron, Inc. P1-8 Portfolio Best Practices Report
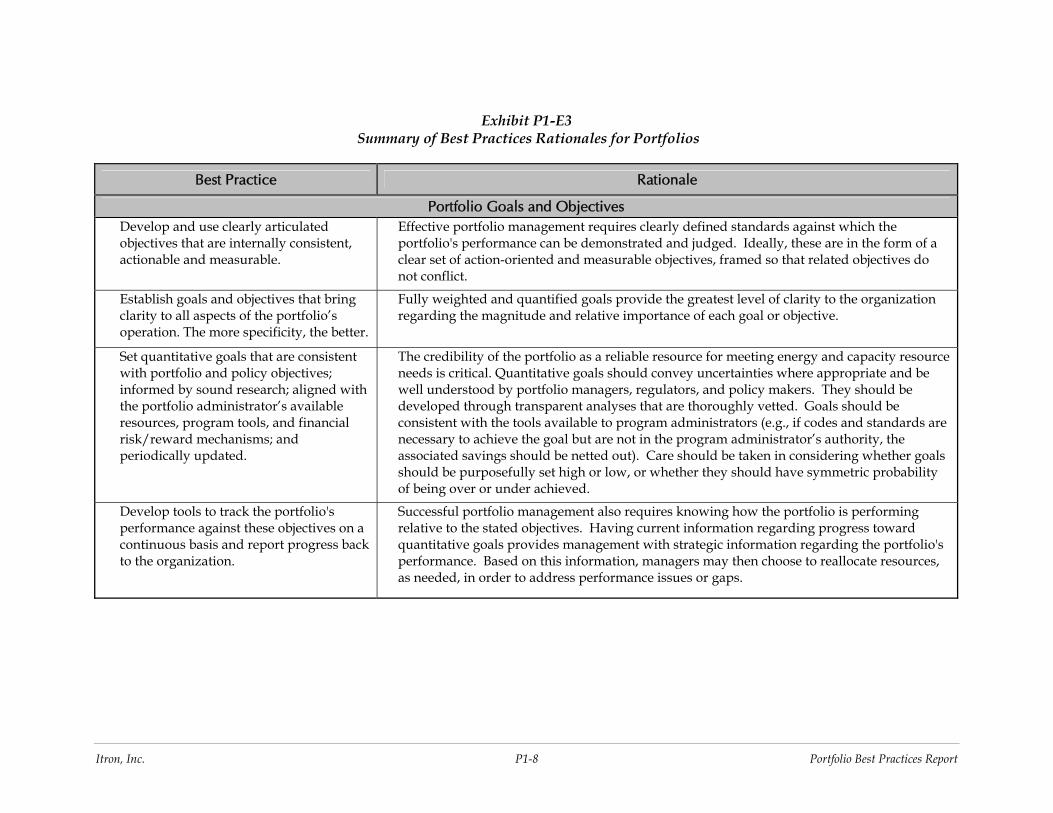
Exhibit P1-E3 Summary of Best Practices Rationales for Portfolios
Best Practice Rationale
Portfolio Goals and Objectives Develop and use clearly articulated objectives that are internally consistent, actionable and measurable.
Effective portfolio management requires clearly defined standards against which the portfolio's performance can be demonstrated and judged. Ideally, these are in the form of a clear set of action-oriented and measurable objectives, framed so that related objectives do not conflict.
Establish goals and objectives that bring clarity to all aspects of the portfolio’s operation. The more specificity, the better.
Fully weighted and quantified goals provide the greatest level of clarity to the organization regarding the magnitude and relative importance of each goal or objective.
Set quantitative goals that are consistent with portfolio and policy objectives; informed by sound research; aligned with the portfolio administrator’s available resources, program tools, and financial risk/reward mechanisms; and periodically updated.
The credibility of the portfolio as a reliable resource for meeting energy and capacity resource needs is critical. Quantitative goals should convey uncertainties where appropriate and be well understood by portfolio managers, regulators, and policy makers. They should be developed through transparent analyses that are thoroughly vetted. Goals should be consistent with the tools available to program administrators (e.g., if codes and standards are necessary to achieve the goal but are not in the program administrator’s authority, the associated savings should be netted out). Care should be taken in considering whether goals should be purposefully set high or low, or whether they should have symmetric probability of being over or under achieved.
Develop tools to track the portfolio's performance against these objectives on a continuous basis and report progress back to the organization.
Successful portfolio management also requires knowing how the portfolio is performing relative to the stated objectives. Having current information regarding progress toward quantitative goals provides management with strategic information regarding the portfolio's performance. Based on this information, managers may then choose to reallocate resources, as needed, in order to address performance issues or gaps.
Itron, Inc. P1-9 Portfolio Best Practices Report
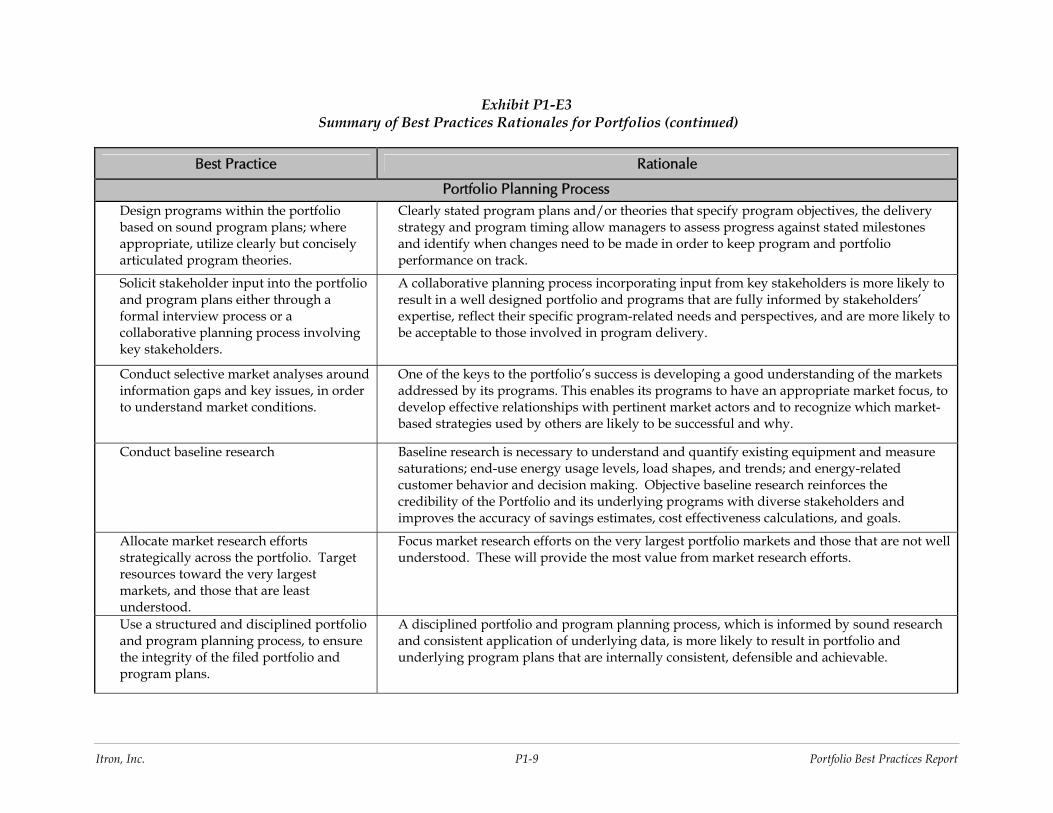
Exhibit P1-E3 Summary of Best Practices Rationales for Portfolios (continued)
Best Practice Rationale
Portfolio Planning Process Design programs within the portfolio based on sound program plans; where appropriate, utilize clearly but concisely articulated program theories.
Clearly stated program plans and/or theories that specify program objectives, the delivery strategy and program timing allow managers to assess progress against stated milestones and identify when changes need to be made in order to keep program and portfolio performance on track.
Solicit stakeholder input into the portfolio and program plans either through a formal interview process or a collaborative planning process involving key stakeholders.
A collaborative planning process incorporating input from key stakeholders is more likely to result in a well designed portfolio and programs that are fully informed by stakeholders’ expertise, reflect their specific program-related needs and perspectives, and are more likely to be acceptable to those involved in program delivery.
Conduct selective market analyses around information gaps and key issues, in order to understand market conditions.
One of the keys to the portfolio’s success is developing a good understanding of the markets addressed by its programs. This enables its programs to have an appropriate market focus, to develop effective relationships with pertinent market actors and to recognize which market-based strategies used by others are likely to be successful and why.
Conduct baseline research Baseline research is necessary to understand and quantify existing equipment and measure saturations; end-use energy usage levels, load shapes, and trends; and energy-related customer behavior and decision making. Objective baseline research reinforces the credibility of the Portfolio and its underlying programs with diverse stakeholders and improves the accuracy of savings estimates, cost effectiveness calculations, and goals.
Allocate market research efforts strategically across the portfolio. Target resources toward the very largest markets, and those that are least understood.
Focus market research efforts on the very largest portfolio markets and those that are not well understood. These will provide the most value from market research efforts.
Use a structured and disciplined portfolio and program planning process, to ensure the integrity of the filed portfolio and program plans.
A disciplined portfolio and program planning process, which is informed by sound research and consistent application of underlying data, is more likely to result in portfolio and underlying program plans that are internally consistent, defensible and achievable.
Itron, Inc. P1-10 Portfolio Best Practices Report
Exhibit P1-E3 Summary of Best Practices Rationales for Portfolios (continued)
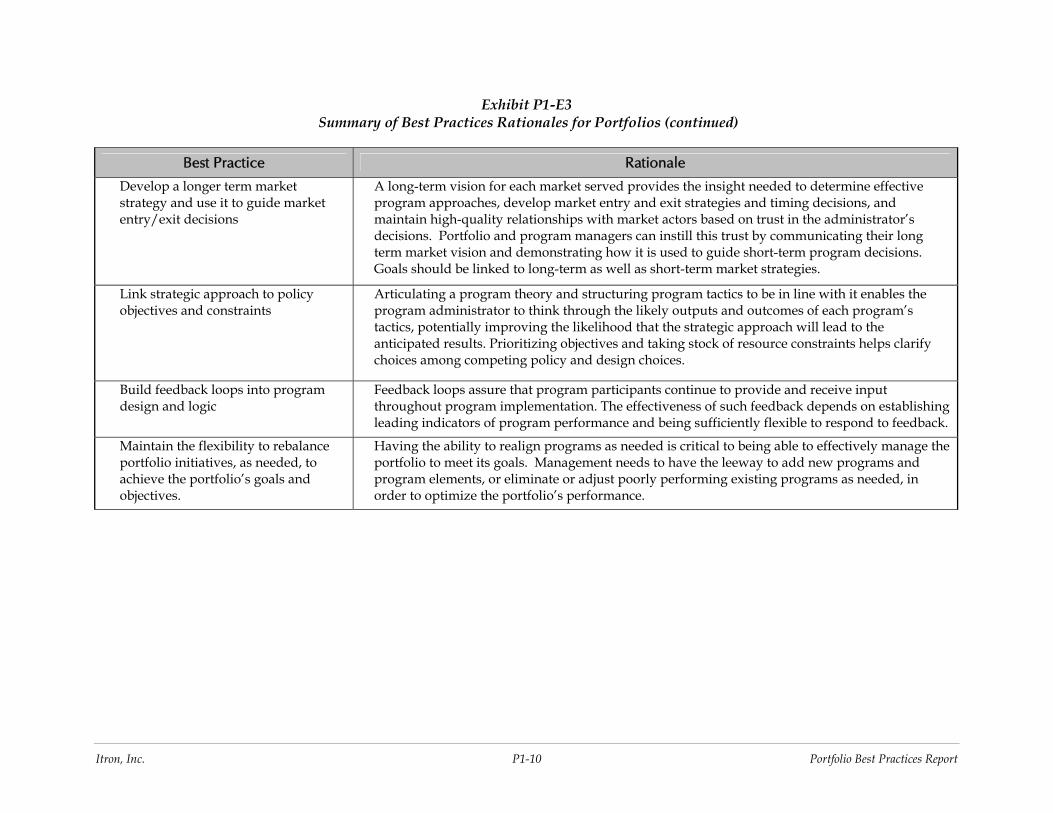
Best Practice Rationale
Develop a longer term market strategy and use it to guide market entry/exit decisions
A long-term vision for each market served provides the insight needed to determine effective program approaches, develop market entry and exit strategies and timing decisions, and maintain high-quality relationships with market actors based on trust in the administrator’s decisions. Portfolio and program managers can instill this trust by communicating their long term market vision and demonstrating how it is used to guide short-term program decisions. Goals should be linked to long-term as well as short-term market strategies.
Link strategic approach to policy objectives and constraints
Articulating a program theory and structuring program tactics to be in line with it enables the program administrator to think through the likely outputs and outcomes of each program’s tactics, potentially improving the likelihood that the strategic approach will lead to the anticipated results. Prioritizing objectives and taking stock of resource constraints helps clarify choices among competing policy and design choices.
Build feedback loops into program design and logic
Feedback loops assure that program participants continue to provide and receive input throughout program implementation. The effectiveness of such feedback depends on establishing leading indicators of program performance and being sufficiently flexible to respond to feedback.
Maintain the flexibility to rebalance portfolio initiatives, as needed, to achieve the portfolio’s goals and objectives.
Having the ability to realign programs as needed is critical to being able to effectively manage the portfolio to meet its goals. Management needs to have the leeway to add new programs and program elements, or eliminate or adjust poorly performing existing programs as needed, in order to optimize the portfolio’s performance.
Itron, Inc. P1-11 Portfolio Best Practices Report
Exhibit P1-E3 Summary of Best Practices Rationales for Portfolios (continued)
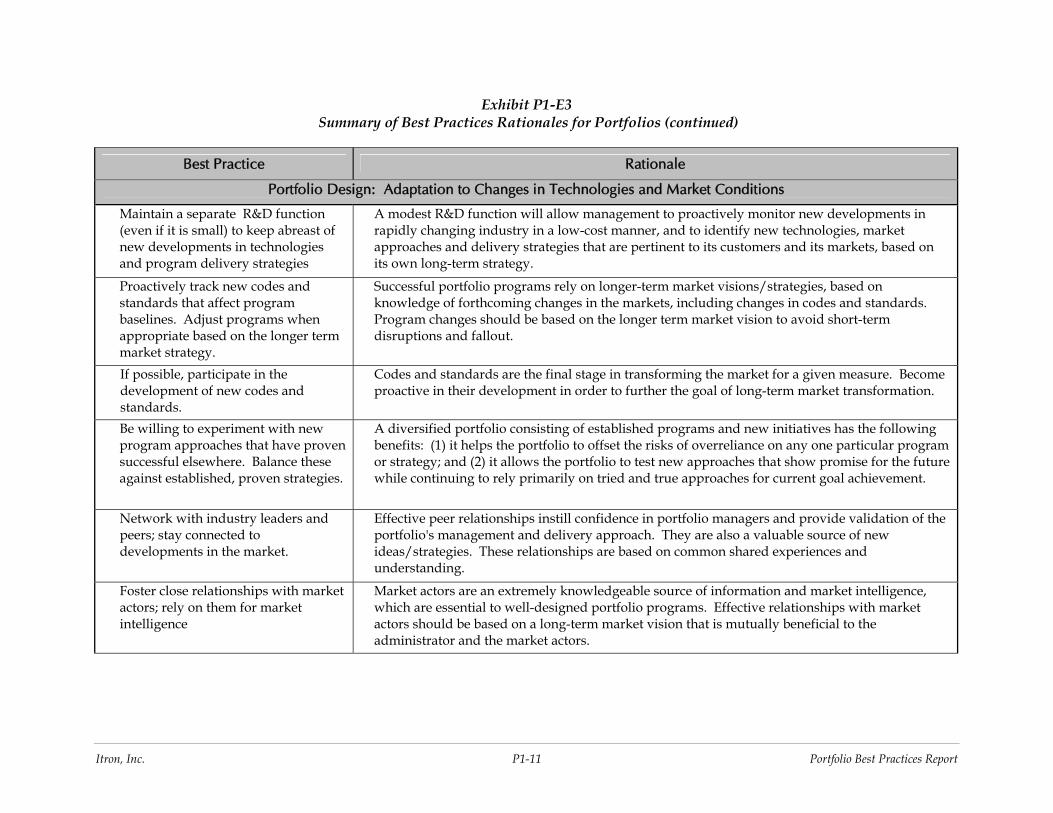
Best Practice Rationale
Portfolio Design: Adaptation to Changes in Technologies and Market Conditions
Maintain a separate R&D function (even if it is small) to keep abreast of new developments in technologies and program delivery strategies
A modest R&D function will allow management to proactively monitor new developments in rapidly changing industry in a low-cost manner, and to identify new technologies, market approaches and delivery strategies that are pertinent to its customers and its markets, based on its own long-term strategy.
Proactively track new codes and standards that affect program baselines. Adjust programs when appropriate based on the longer term market strategy.
Successful portfolio programs rely on longer-term market visions/strategies, based on knowledge of forthcoming changes in the markets, including changes in codes and standards. Program changes should be based on the longer term market vision to avoid short-term disruptions and fallout.
If possible, participate in the development of new codes and standards.
Codes and standards are the final stage in transforming the market for a given measure. Become proactive in their development in order to further the goal of long-term market transformation.
Be willing to experiment with new program approaches that have proven successful elsewhere. Balance these against established, proven strategies.
A diversified portfolio consisting of established programs and new initiatives has the following benefits: (1) it helps the portfolio to offset the risks of overreliance on any one particular program or strategy; and (2) it allows the portfolio to test new approaches that show promise for the future while continuing to rely primarily on tried and true approaches for current goal achievement.
Network with industry leaders and peers; stay connected to developments in the market.
Effective peer relationships instill confidence in portfolio managers and provide validation of the portfolio's management and delivery approach. They are also a valuable source of new ideas/strategies. These relationships are based on common shared experiences and understanding.
Foster close relationships with market actors; rely on them for market intelligence
Market actors are an extremely knowledgeable source of information and market intelligence, which are essential to well-designed portfolio programs. Effective relationships with market actors should be based on a long-term market vision that is mutually beneficial to the administrator and the market actors.
Itron, Inc. P1-12 Portfolio Best Practices Report
Exhibit P1-E3 Summary of Best Practices Rationales for Portfolios (continued)
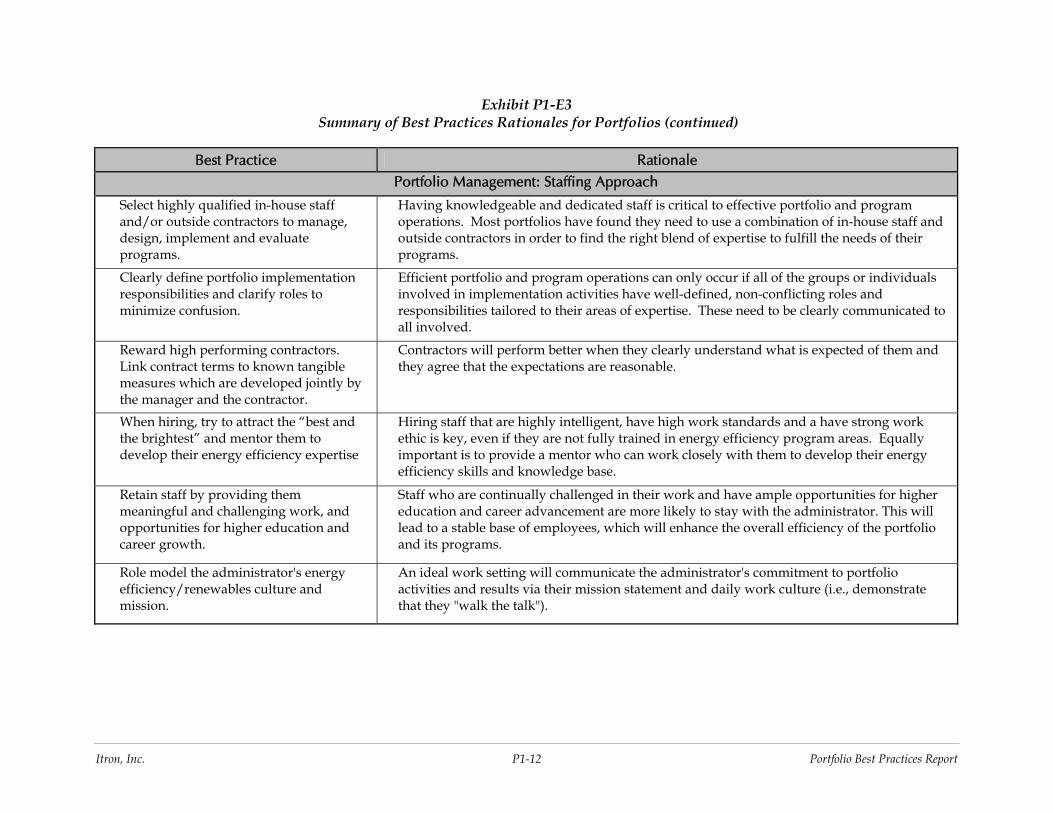
Best Practice Rationale Portfolio Management: Staffing Approach
Select highly qualified in-house staff and/or outside contractors to manage, design, implement and evaluate programs.
Having knowledgeable and dedicated staff is critical to effective portfolio and program operations. Most portfolios have found they need to use a combination of in-house staff and outside contractors in order to find the right blend of expertise to fulfill the needs of their programs.
Clearly define portfolio implementation responsibilities and clarify roles to minimize confusion.
Efficient portfolio and program operations can only occur if all of the groups or individuals involved in implementation activities have well-defined, non-conflicting roles and responsibilities tailored to their areas of expertise. These need to be clearly communicated to all involved.
Reward high performing contractors. Link contract terms to known tangible measures which are developed jointly by the manager and the contractor.
Contractors will perform better when they clearly understand what is expected of them and they agree that the expectations are reasonable.
When hiring, try to attract the “best and the brightest” and mentor them to develop their energy efficiency expertise
Hiring staff that are highly intelligent, have high work standards and a have strong work ethic is key, even if they are not fully trained in energy efficiency program areas. Equally important is to provide a mentor who can work closely with them to develop their energy efficiency skills and knowledge base.
Retain staff by providing them meaningful and challenging work, and opportunities for higher education and career growth.
Staff who are continually challenged in their work and have ample opportunities for higher education and career advancement are more likely to stay with the administrator. This will lead to a stable base of employees, which will enhance the overall efficiency of the portfolio and its programs.
Role model the administrator's energy efficiency/renewables culture and mission.
An ideal work setting will communicate the administrator's commitment to portfolio activities and results via their mission statement and daily work culture (i.e., demonstrate that they "walk the talk").
Itron, Inc. P1-13 Portfolio Best Practices Report
Exhibit P1-E3 Summary of Best Practices Rationales for Portfolios (continued)
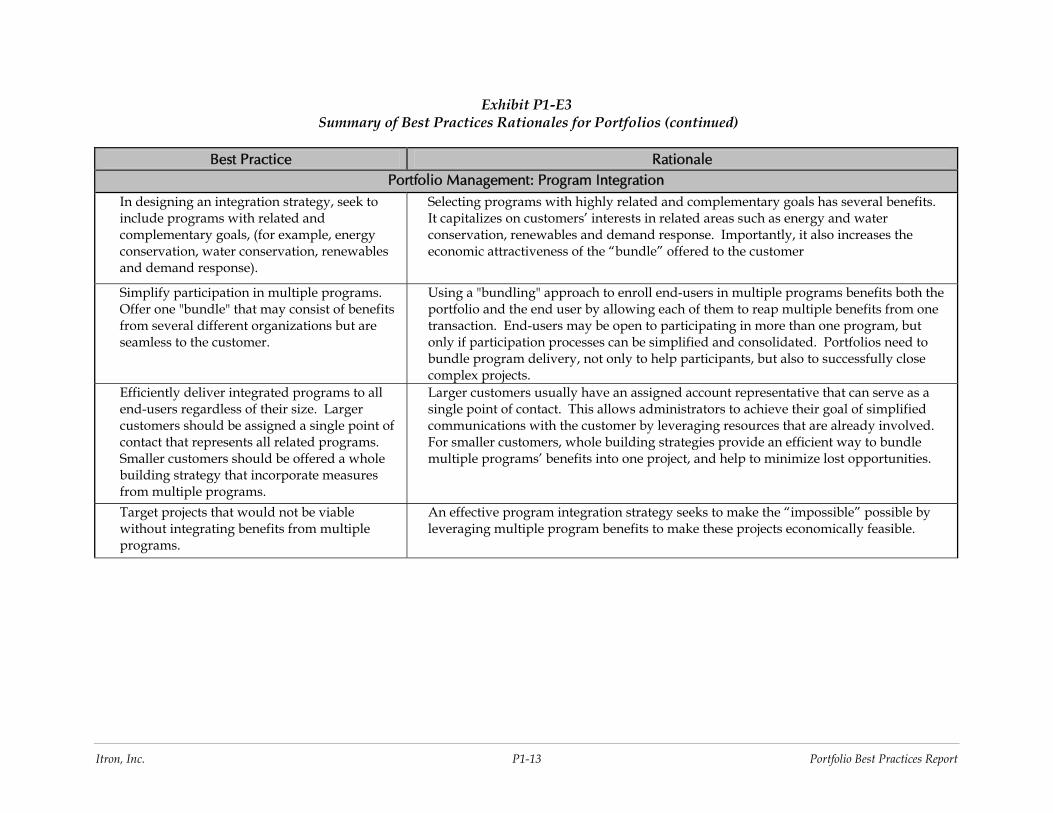
Best Practice Rationale Portfolio Management: Program Integration
In designing an integration strategy, seek to include programs with related and complementary goals, (for example, energy conservation, water conservation, renewables and demand response).
Selecting programs with highly related and complementary goals has several benefits. It capitalizes on customers’ interests in related areas such as energy and water conservation, renewables and demand response. Importantly, it also increases the economic attractiveness of the “bundle” offered to the customer
Simplify participation in multiple programs. Offer one "bundle" that may consist of benefits from several different organizations but are seamless to the customer.
Using a "bundling" approach to enroll end-users in multiple programs benefits both the portfolio and the end user by allowing each of them to reap multiple benefits from one transaction. End-users may be open to participating in more than one program, but only if participation processes can be simplified and consolidated. Portfolios need to bundle program delivery, not only to help participants, but also to successfully close complex projects.
Efficiently deliver integrated programs to all end-users regardless of their size. Larger customers should be assigned a single point of contact that represents all related programs. Smaller customers should be offered a whole building strategy that incorporate measures from multiple programs.
Larger customers usually have an assigned account representative that can serve as a single point of contact. This allows administrators to achieve their goal of simplified communications with the customer by leveraging resources that are already involved. For smaller customers, whole building strategies provide an efficient way to bundle multiple programs’ benefits into one project, and help to minimize lost opportunities.
Target projects that would not be viable without integrating benefits from multiple programs.
An effective program integration strategy seeks to make the “impossible” possible by leveraging multiple program benefits to make these projects economically feasible.
Itron, Inc. P1-14 Portfolio Best Practices Report
Exhibit P1-E3 Summary of Best Practices Rationales for Portfolios (continued)
Best Practice Rationale
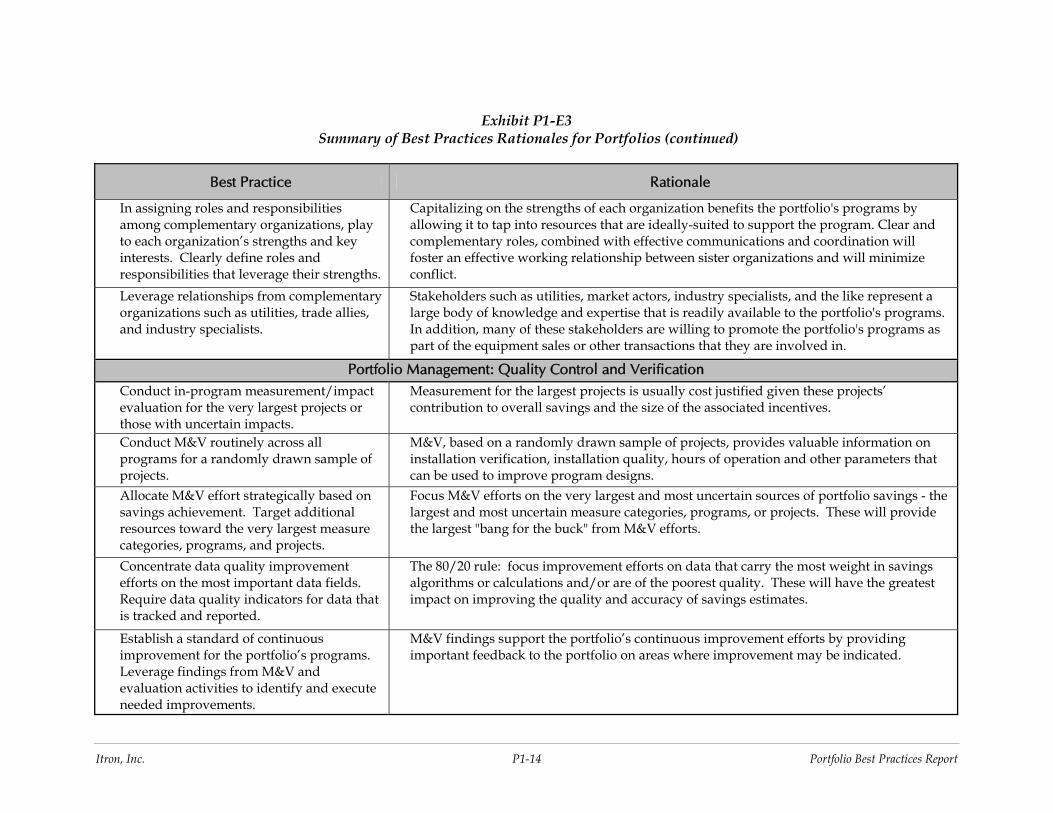
In assigning roles and responsibilities among complementary organizations, play to each organization’s strengths and key interests. Clearly define roles and responsibilities that leverage their strengths.
Capitalizing on the strengths of each organization benefits the portfolio's programs by allowing it to tap into resources that are ideally-suited to support the program. Clear and complementary roles, combined with effective communications and coordination will foster an effective working relationship between sister organizations and will minimize conflict.
Leverage relationships from complementary organizations such as utilities, trade allies, and industry specialists.
Stakeholders such as utilities, market actors, industry specialists, and the like represent a large body of knowledge and expertise that is readily available to the portfolio's programs. In addition, many of these stakeholders are willing to promote the portfolio's programs as part of the equipment sales or other transactions that they are involved in.
Portfolio Management: Quality Control and Verification Conduct in-program measurement/impact evaluation for the very largest projects or those with uncertain impacts.
Measurement for the largest projects is usually cost justified given these projects’ contribution to overall savings and the size of the associated incentives.
Conduct M&V routinely across all programs for a randomly drawn sample of projects.
M&V, based on a randomly drawn sample of projects, provides valuable information on installation verification, installation quality, hours of operation and other parameters that can be used to improve program designs.
Allocate M&V effort strategically based on savings achievement. Target additional resources toward the very largest measure categories, programs, and projects.
Focus M&V efforts on the very largest and most uncertain sources of portfolio savings - the largest and most uncertain measure categories, programs, or projects. These will provide the largest "bang for the buck" from M&V efforts.
Concentrate data quality improvement efforts on the most important data fields. Require data quality indicators for data that is tracked and reported.
The 80/20 rule: focus improvement efforts on data that carry the most weight in savings algorithms or calculations and/or are of the poorest quality. These will have the greatest impact on improving the quality and accuracy of savings estimates.
Establish a standard of continuous improvement for the portfolio’s programs. Leverage findings from M&V and evaluation activities to identify and execute needed improvements.
M&V findings support the portfolio’s continuous improvement efforts by providing important feedback to the portfolio on areas where improvement may be indicated.
Itron, Inc. P1-15 Portfolio Best Practices Report
Exhibit P1-E3 Summary of Best Practices Rationales for Portfolios (continued)
Best Practice Rationale
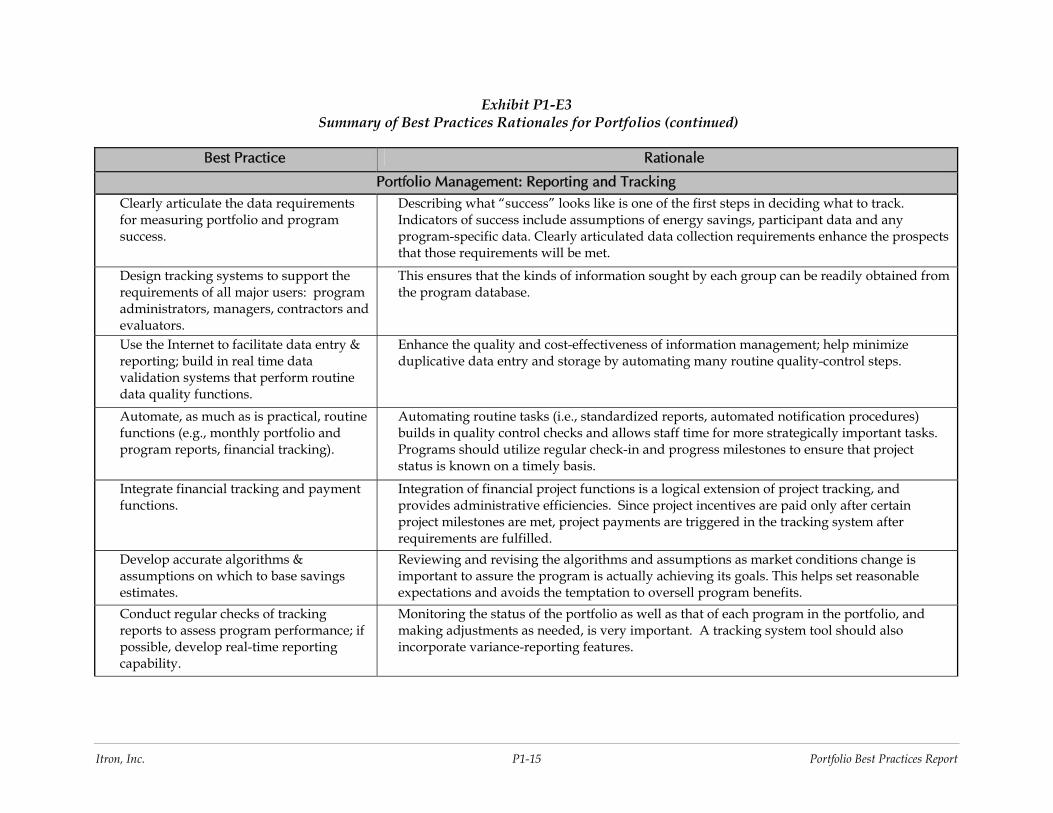
Portfolio Management: Reporting and Tracking Clearly articulate the data requirements for measuring portfolio and program success.
Describing what “success” looks like is one of the first steps in deciding what to track. Indicators of success include assumptions of energy savings, participant data and any program-specific data. Clearly articulated data collection requirements enhance the prospects that those requirements will be met.
Design tracking systems to support the requirements of all major users: program administrators, managers, contractors and evaluators.
This ensures that the kinds of information sought by each group can be readily obtained from the program database.
Use the Internet to facilitate data entry & reporting; build in real time data validation systems that perform routine data quality functions.
Enhance the quality and cost-effectiveness of information management; help minimize duplicative data entry and storage by automating many routine quality-control steps.
Automate, as much as is practical, routine functions (e.g., monthly portfolio and program reports, financial tracking).
Automating routine tasks (i.e., standardized reports, automated notification procedures) builds in quality control checks and allows staff time for more strategically important tasks. Programs should utilize regular check-in and progress milestones to ensure that project status is known on a timely basis.
Integrate financial tracking and payment functions.
Integration of financial project functions is a logical extension of project tracking, and provides administrative efficiencies. Since project incentives are paid only after certain project milestones are met, project payments are triggered in the tracking system after requirements are fulfilled.
Develop accurate algorithms & assumptions on which to base savings estimates.
Reviewing and revising the algorithms and assumptions as market conditions change is important to assure the program is actually achieving its goals. This helps set reasonable expectations and avoids the temptation to oversell program benefits.
Conduct regular checks of tracking reports to assess program performance; if possible, develop real-time reporting capability.
Monitoring the status of the portfolio as well as that of each program in the portfolio, and making adjustments as needed, is very important. A tracking system tool should also incorporate variance-reporting features.
Itron, Inc. P1-16 Portfolio Best Practices Report
Exhibit P1-E3 Summary of Best Practices Rationales for Portfolios (continued)
Best Practice Rationale
If possible, incorporate data likely to be needed for project assessments into the tracking system.
Additional administrative efficiencies can be gained if data that is likely to be needed is automatically populated. This includes historical billing data, especially for large end-users.
Periodically “mine” tracking data to understand, and learn from historical portfolio and program experiences.
Data mining provides insight into where the program has succeeded or failed with respect to types of measures, market segments, etc. In addition, it can provide important financial results regarding the cost of conserved energy in targeted market segments. This information helps to inform future program planning, design and marketing efforts.
Portfolio Evaluation and Adaptability Engage management and the implementation team in the evaluation process.
Demonstrate the benefits of evaluation to the portfolio management and implementation team. Encourage a collaborative relationship between program staff and evaluators. Present key evaluation findings to the implementation team via formal meetings and feedback sessions. Presentations bring implementers into the feedback loop and encourage them to act on study recommendations.
Create a culture whereby audit and evaluation findings are valued and integrated into portfolio and program management.
Being open to having audits and evaluations conducted on a regular basis, to reviewing their findings, and to implementing their recommendations by making changes to the portfolio programs or administrative functions demonstrates the administrator’s commitment to continuously improving the portfolio and its programs..
Conduct impact evaluations and market assessments regularly, though not necessarily annually.
Impact evaluations may not need to be annual. However, scheduling them at least every two to three years will ensure that changes in program savings are sufficiently tracked to identify changes in program success. Impact evaluations should occur when some change is suspected in these metrics due to different behavior, changing target market, or an external event (e.g., energy crisis).
Conduct regular audits and process evaluations to assess organizational and program efficiency and effectiveness.
Plan for short time lags between participation and customer interviews to minimize revisionist histories and memory loss. Timely audits and process evaluations will provide valuable feedback that can be used to enhance organizational and program effectiveness.
Develop recommendations that are feasible and actionable.
Recommendations from evaluations should be action oriented and practical, to provide greater assurance that they will be adopted.
Itron, Inc. P1-17 Portfolio Best Practices Report
Exhibit P1-E3 Summary of Best Practices Rationales for Portfolios (continued)
Best Practice Rationale
Implement audit and evaluation recommendations in a timely manner.
Audit and evaluation recommendations will provide the greatest value if they are acted upon quickly.
Collect and analyze data to understand how markets have changed due to your programs, determine the maturity of market, and inform your exit strategy and next step(s).
To support assessments of market effects for programs with a market focus, market effects can be captured by analyzing sales tracking data, product price trends and free ridership levels.
Allocate evaluation efforts strategically across the portfolio based on savings achievement. Target additional resources toward the very largest categories, programs, and projects, and toward those with the most uncertainty in savings estimates.
Focus evaluation efforts on the very largest and most uncertain sources of portfolio savings - the largest and most uncertain measure categories, programs, or projects. These will provide the largest "bang for the buck" from evaluation efforts.
Support program review & assessment at the most comprehensive level possible.
The evaluation should be designed broadly to provide detailed information on program performance, program strengths and weaknesses and likely root causes, and effects on target markets. More comprehensive results will better permit program managers to gauge program quality and performance over time. They will also help to inform future program improvement and planning efforts. Program process issues, market changes and estimation and verification of program impacts are key activities to consider in designing an evaluation.
Alignment with Organizational Strategic and Financial Goals Engage senior management to recognize the portfolio's value in meeting the organization's financial, customer service and regulatory goals.
Effective management and leadership at the very highest levels is needed to drive excellent portfolio performance. In order to provide this leadership, senior management needs to understand and embrace the Portfolio's value in accomplishing key organizational goals.
Use cost recovery procedures that provide for timely recovery of portfolio expenses.
Procedures should allow for quick recovery of Portfolio expenses so as not to jeopardize the financial integrity of the administrator. Expenses should be recoverable as close to the time they are incurred as possible.
Itron, Inc. P1-18 Portfolio Best Practices Report
Exhibit P1-E3 Summary of Best Practices Rationales for Portfolios (continued)
Best Practice Rationale
Use ratemaking procedures that compensate for reduced revenues and profits due to implementation of portfolio programs.
Adopt rate procedures that remove any disincentives due to reduced sales and associated profits. Procedures could include a formal decoupling mechanism, or use of a procedure that forecasts lost revenues due to energy efficiency implementation and compensates the utility on a one-for-one basis.
Adopt fairly designed financial incentive mechanisms that provide balanced opportunities for additional earnings based on risk-reward relationships.
The purpose of an incentive mechanism is to align the Portfolio with the portfolio administrator’s profitability or related financial objectives (e.g., for non-profit administrators). Financial incentive mechanisms should strike a balance between risk and reward, offering the administrator a reasonable opportunity to earn a financial incentive for exceptional portfolio performance, or face a penalty for substandard performance. In designing the mechanism, the uncertainties and risks associated with the underlying goals needs to be well-understood. Care must be taken to ensure the structure of the mechanism does not produce perverse or otherwise unintended incentives or encourage gaming. The mechanism should also fairly reflect factors that are within the administrator’s control and control for factors completely outside their control.
Impact on Short-term and Long-term Resource Planning Treat portfolio demand-side resources in an equivalent manner with supply side resources, using the same overall framework and screening process.
This will provide more of a level playing field between portfolio resources and traditional supply-side options. This framework will ideally favor the selection of portfolio resources over supply-side options when costs are the same, since they produce little/no adverse environmental impacts compared with equivalent supply-side options.
Clearly designate portfolio resources as the preferred resource option when costs are the same or less than equivalent supply-side options.
This provides senior management with a clear signal of the importance of portfolio resources in resource planning and procurement processes, first among the various resource options.
Require the development of integrated resource plans which clearly identify Portfolio impacts as a separate resource, rather than being hidden as a component of the underlying load forecast.
Such treatment recognizes that portfolio savings impacts are a separate resource to be acquired on a basis equivalent to that of supply side resources, and clearly states the magnitude of its contribution.
Itron, Inc. P1-19 Portfolio Best Practices Report
Exhibit P1-E3 Summary of Best Practices Rationales for Portfolios (continued)
Best Practice Rationale Conduct risk analyses to understand the underlying risk and uncertainty of the various portfolio demand side and supply side resources, considering the risk of varying loads, power costs, and regulations.
Risk analysis provides a full picture of each resource’s availability, reliability and cost-effectiveness, so that management and regulators can make a fully informed decision regarding resource selection.
Avoided Cost and Cost-Effectiveness Procedures
Use avoided cost procedures that value the portfolio’s energy efficiency resources in a consistent manner with supply-side options.
Avoided costing methodologies should take into account how either a demand side or supply side resource affects the energy supplier's load curve (i.e., hourly demand) and the marginal cost savings which result. The same method should be used for both resource types since demand-side options serve as a resource alternative to supply-side options.
Use a costing method that reflects the full value of supply-side resources avoided due to energy efficiency impacts including energy and capacity costs, and avoided T&D costs.
Full resource valuation enables portfolio programs to receive full credit for all types of supply-side resources which have been avoided or deferred as a result of their deployment, and leads to consistent cost-effectiveness valuation with supply side options.
Use cost-effectiveness procedures that value the portfolio’s energy efficiency resources in a consistent manner with supply-side options.
This consistency provides assurance that portfolio resources are being valued and screened on the same basis as conventional supply side resource options, making it possible to compare demand-side and supply-side options on an equal basis.
Funding Stability/Funds Management
Adopt a funding approach that (1) keeps Portfolio funds separate and directs them to their intended uses; and (2) passes program funds directly from the funding source to the program administrator.
These measures are needed in order to protect the integrity of funds collected for public benefits programs, and to prevent them from being diverted to other uses.
Recognize long project lead times and allow for carryover of funds from year to year to support project commitments from prior years, to be used when projects are implemented.
Carryover funding procedures provide the flexibility needed when the portfolio is ramping up or ramping down its operation, and when it is trying to reserve funds earmarked for long-lead time customer projects, which may take several years to complete.
Itron, Inc. P1-20 Portfolio Best Practices Report
Exhibit P1-E3 Summary of Best Practices Rationales for Portfolios (continued)
Best Practice Rationale
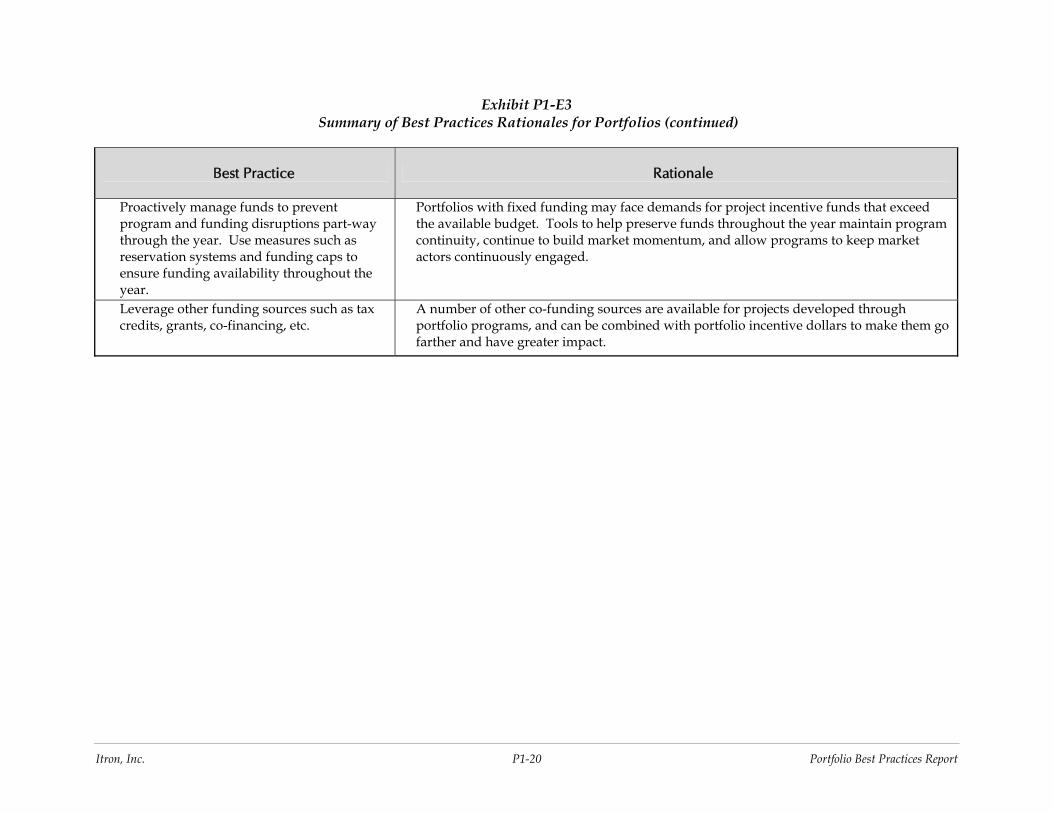
Proactively manage funds to prevent program and funding disruptions part-way through the year. Use measures such as reservation systems and funding caps to ensure funding availability throughout the year.
Portfolios with fixed funding may face demands for project incentive funds that exceed the available budget. Tools to help preserve funds throughout the year maintain program continuity, continue to build market momentum, and allow programs to keep market actors continuously engaged.
Leverage other funding sources such as tax credits, grants, co-financing, etc.
A number of other co-funding sources are available for projects developed through portfolio programs, and can be combined with portfolio incentive dollars to make them go farther and have greater impact.
Itron, Inc. P1-21 Portfolio Best Practices Report
1. OVERVIEW OF PORTFOLIOS
This volume of the Best Practices Study addresses “portfolios”, which are defined as a set of programs designed to work strategically and comprehensively across specific technologies, practices, and programs at a market level. They are administered by one organization or department and, for the purposes of this study, must include energy efficiency programs, and may also include any of the following related program areas: demand response, distributed generation, and customer-sited renewables.
As discussed further below, this report does not seek to identify which portfolios or administrative models are best as compared to others. Rather, the objective of this report is to characterize issues, lessons learned, and best practices that cut across individual portfolios.
1.1 PRIMARY CHARACTERISTICS
Descriptions of each of the portfolios reviewed in this study are below. The process for inclusion of a given portfolio in this study is described in the Methodology appendix to this report. In general, we sought to include a mix of different portfolio types implemented by a representative set of organizations from around the country. Because this study was made possible by energy efficiency public goods charge funds collected by Pacific Gas and Electric Company (PG&E), Southern California Edison Company (SCE), and Sempra Utilities (San Diego Gas and Electric and Southern California Gas Companies), each of these program administrators is included in the study.
The first three portfolios shown are in states that have undergone substantial restructuring of electricity markets. As a result, the energy efficiency program administrative functions in all three states were transferred from investor-owned utilities to a single, independent non-utility administrator. For these three portfolios, the description includes the portfolio’s history, including the legislation and regulatory milestones that led to its creation.
Portfolios Administered by Non Utility Organizations
• New York State Energy Research and Development Authority (NYSERDA) The New York State Energy Research and Development Authority was originally established by 1975 law as a public benefit corporation in order to fund research into energy supply and efficiency, and energy-related environmental issues.
Since late 1998, at the direction of the New York Public Service Commission, NYSERDA has managed the New York Energy $martSM program. Funded by a System Benefits Charge (SBC) on electric distribution, this program offers energy efficiency, research and development, low-income, demand management and renewable generation. It also provides funding and education to preserve these types of programs previously offered by regulated utilities as the regulated electricity market moved to more open competition.
Itron, Inc. P1-22 Portfolio Best Practices Report
NYSERDA administers a broad range of efficiency programs, addressing all major markets and customer sectors. In its environmental role, NYSERDA monitors the environmental impacts of conventional energy generation and also promotes non polluting renewable energy sources to consumers and businesses. The focus of this study is on the energy efficiency, low income and renewable (demand-side) components of the New York Energy $martSM program, which constitute the majority of NYSERDA’s portfolio.
• Efficiency Vermont (EVT) In May 1997, the Department of Public Service (DPS) proposed the creation of a single independent statewide Energy Efficiency Utility (EEU) to implement electric energy efficiency programs in fulfillment of the State’s electric utilities’ efficiency obligations under Least Cost Planning. Legislation clarifying the Board’s authority to create an EEU and fund it through a separate charge on customer utility bills was passed in the spring of 1999. On September 30, 1999, the Board issued an order that created the EEU, and shortly thereafter, conducted a competitive bidding process to select an EEU Administrator. In January 2000, Vermont Energy Investment Corporation was selected as the winning bidder, and began operation of the EEU with the name “Efficiency Vermont” on March 1, 2000.1
Compared to the other Portfolios reviewed, Efficiency Vermont’s scope is the narrowest, with its primary focus on electric energy efficiency. Its programs, however, are entirely comprehensive. It is also the smallest portfolio in terms of its absolute budget size. However, on a relative basis, its budget as a percent of revenues is the highest of the portfolios researched. Efficiency Vermont is in its 8th year of operation and its contract was recently extended to the end of 2012.
• Energy Trust of Oregon (the Trust) The Trust is a non-profit corporation established in 2002 as part of utility restructuring legislation and charged with acquiring cost-effective conservation and renewable energy resources. The Trust receives funding as a portion of a three percent systems benefit charge on electric utility bills of customers of investor-owned utilities in Oregon (Portland General Electric and PacifiCorp) in the range of $40-$50 million per year. Third-party contractors (called Program Management Contractors) implement all programs.
The Trust is the newest of the portfolios reviewed, having only been in operation since 2002. In addition to the energy efficiency and renewables programs it administers for the state, the Trust also implements gas conservation programs for some of the state’s gas utilities through separate contracts with them. These gas programs are not part of the Trust’s portfolio addressed by this study.
Portfolios Administered by Investor-Owned Utilities
• Xcel Energy – Minnesota (Xcel – MN) Xcel Energy’s Minnesota portfolio consists of electric and gas energy efficiency programs, and demand response programs for smaller mass market customers of its Northern States Power Company subsidiary. Its portfolio
1 Vermont DPS Biennial Report – July 1, 2000 to June 30, 2004, issued May 9, 2005
Itron, Inc. P1-23 Portfolio Best Practices Report
is the result of Conservation Improvement Plan (CIP) legislation which requires utility investment in energy efficiency programs with State oversight into planning and evaluation. Xcel-MN’s portfolio is mature, and has been in place since the early 1980s.
• MidAmerican Energy (MidAmerican) MidAmerican is the largest utility in Iowa. Its portfolio is the most comprehensive of those reviewed for this study, and includes both energy efficiency programs and demand response programs applicable to all major customer classes. Like many of the other utility administrators in this study, MidAmerican has been a long-time administrator of its programs since the early 1990s. Its portfolio originated from a regulatory requirement to file energy efficiency plans with the state regulators every 5 years.
• Florida Power and Light (FPL) Florida Power and Light, which provides electric service to customers in central and southern Florida, operates a portfolio which includes both energy efficiency and demand response programs. Although it has been administering these programs for many years, it has done so quietly and is less well-known for its accomplishments than other administrators.
• California Investor-Owned Utilities (IOUs) - Pacific Gas and Electric (PG&E), Southern California Edison (SCE) and Sempra Utilities [San Diego Gas and Electric (SDG&E) and Southern California Gas (SCG)]. California’s investor owned utilities have been operating large energy efficiency portfolios since the early 1970s. These utilities are well-known for their leadership in the energy efficiency area, and for their work developing, implementing, and advocating for strong energy-efficiency programs and standards both within California and nationally. The California Public Utilities Commission recently decided to continue investor-owned utility administration of energy efficiency portfolios indefinitely.
California’s investor owned utilities’ portfolios have the following characteristics in common:
− They consist of energy efficiency and low income programs only
− The programs address all major customer classes
− Both traditional and nontraditional markets are served
− A combination of mature and newer programs is offered
− Both statewide and local programs are included
− Are currently administering programs for the 2006-2008 funding cycle
Exhibit 1-1 provides a snapshot of these portfolios in terms of their scope, maturity and overall size. Size metrics are based on current budgets and energy savings levels.
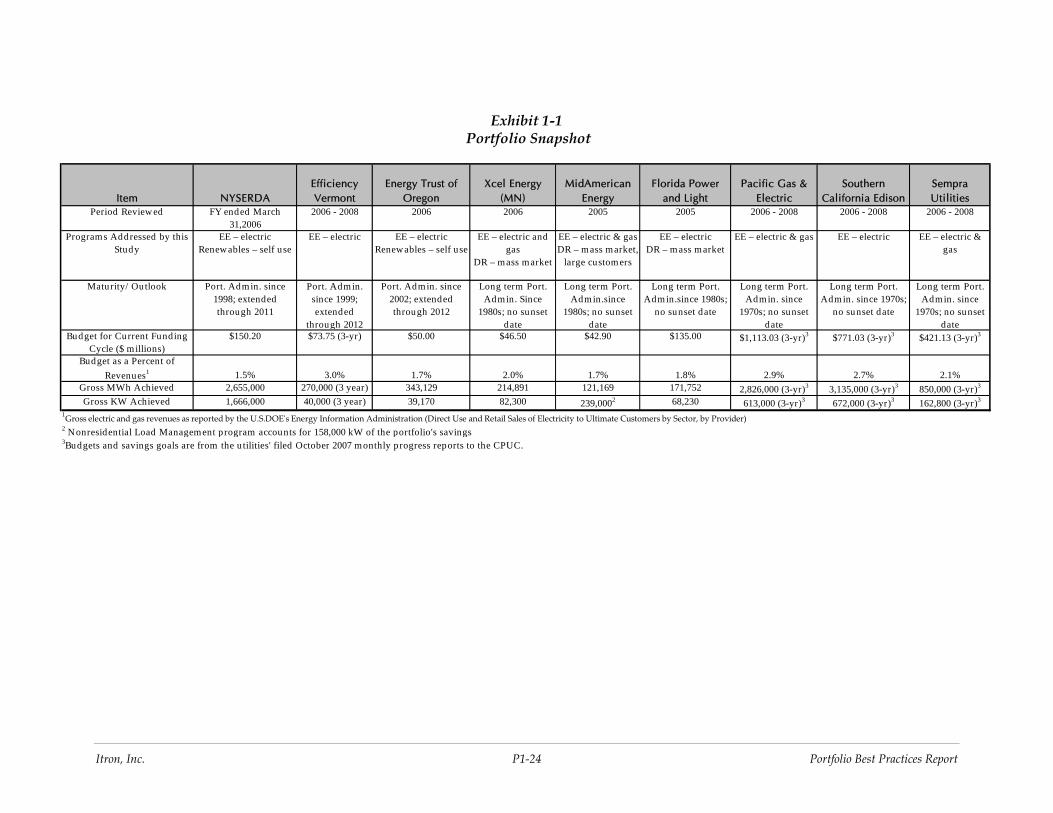
Itron, Inc. P1-24 Portfolio Best Practices Report
Exhibit 1-1 Portfolio Snapshot
Item NYSERDAEfficiency Vermont
Energy Trust of Oregon
Xcel Energy (MN)
MidAmerican Energy
Florida Power and Light
Pacific Gas & Electric
Southern California Edison
Sempra Utilities
Period Review ed FY ended March 31,2006
2006 - 2008 2006 2006 2005 2005 2006 - 2008 2006 - 2008 2006 - 2008
Programs Addressed by this Study
EE – electric Renew ables – self use
EE – electric EE – electric Renew ables – self use
EE – electric and gas
DR – mass market
EE – electric & gas DR – mass market,
large customers
EE – electric DR – m ass market
EE – electric & gas EE – electric EE – electric & gas
Maturity/ Outlook Port. Admin. since 1998; extended through 2011
Port. Admin. since 1999; extended
through 2012
Port. Admin. since 2002; extended through 2012
Long term Port. Admin. Since
1980s; no sunset date
Long term Port. Admin.since
1980s; no sunset date
Long term Port. Admin.since 1980s;
no sunset date
Long term Port. Admin. since
1970s; no sunset date
Long term Port. Admin. since 1970s;
no sunset date
Long term Port. Admin. since
1970s; no sunset date
Budget for Current Funding Cycle ($ millions)
$150.20 $73.75 (3-yr) $50.00 $46.50 $42.90 $135.00 $1,113.03 (3-yr)3 $771.03 (3-yr)3 $421.13 (3-yr)3
Budget as a Percent of Revenues1 1.5% 3.0% 1.7% 2.0% 1.7% 1.8% 2.9% 2.7% 2.1%
Gross MWh Achieved 2,655,000 270,000 (3 year) 343,129 214,891 121,169 171,752 2,826,000 (3-yr)3 3,135,000 (3-yr)3 850,000 (3-yr)3
Gross KW Achieved 1,666,000 40,000 (3 year) 39,170 82,300 239,0002 68,230 613,000 (3-yr)3 672,000 (3-yr)3 162,800 (3-yr)3
1Gross electric and gas revenues as reported by the U.S.DOEʹs Energy Information Administration (Direct Use and Retail Sales of Electricity to Ultimate Customers by Sector, by Provider)2 N onresidential Load Management program accounts for 158,000 kW of the portfolio's savings3Budgets and savings goals are from the u tilities' filed October 2007 monthly progress reports to the CPUC.
Itron, Inc. P1-25 Portfolio Best Practices Report
1.2 ADMINISTRATIVE MODELS
In general, portfolio administrative models vary as a function of the Type of Administrator and the Type of Governance/Oversight that is present. Each of these is discussed below.
The portfolios reviewed in this study reflect three different administrative models. They include administration by investor-owned utilities, nonprofit organizations and government agencies.
The majority of portfolios reviewed in this study are administered by investor-owned utilities. These include: Mid-American, Xcel-MN, FPL, PG&E, SCE and Sempra. These utilities have been long-term administrators of their portfolio’s programs, since the mid-1980s.
The remaining portfolios are administered by nonprofit agencies (EVT and the Trust) and a government agency (NYSERDA). These portfolios operate in states that have undergone significant energy market restructuring, where the longstanding model of utility administered energy efficiency and renewables programs has given way to the newer models of administration by non-utility organizations.
1.2.1 Is there a “Best” Administrative Model?
Recent studies have concluded that the selection of an approach to portfolio administration should be made based on the conditions present in each jurisdiction, and that no single model clearly stands out as superior. In selecting a particular approach, consideration needs to be given to several factors, including those listed below:
• the size of the energy efficiency effort,
• the size of the targeted geographic area,
• the experience level required to administer the portfolio,
• any synergies with energy procurement and customer service responsibilities California recently debated the merits of continued utility administration of portfolios versus alternative administrative structures (in the California Public Utilities Commission’s Order Instituting Rulemaking proceeding 01-08-028). After extensive deliberations on various proposed alternative structures, the Commission concluded in its January 2005 order that “there is no single best model for how energy efficiency programs should be administered . . . One size does not “fit all”: The best administrative structure depends on each state’s particular context.”2 The CPUC found that continued utility administration of portfolios was the preferred alternative, based on the conditions present in California.3 The CPUC has recently
2 Decision 05-01-055 dated January 27, 2005 in the CPUC’s Order Instituting Rulemaking to Examine the
Commission’s Future Energy Efficiency Policies, Administration and Programs at page 58.
3 Ibid, page 89.
Itron, Inc. P1-26 Portfolio Best Practices Report
adopted the third element of this approach, a risk-reward financial incentive mechanism that applies to the utility administrators during the 2006-2008 funding cycle4.
A 2003 study by the Center for the Study of Energy Markets (CAEM) reached a similar conclusion that “no single administrative structure for energy-efficiency programs has yet emerged in the U. S. that is clearly superior to all of the other alternatives.” 5 CAEM gives a number of reasons to support this conclusion including differences in policy environments among the states, differences among states and regions in the structure and regulation of the electric utility industry, and differing priorities given to market transformation and resource acquisition program strategies that may require different administrative approaches.
This study will serve to identify the characteristics and business practices desired regardless of the type of program administrator. Best practices related to portfolio management and evaluation practices, clearly within the administrator’s control, are applicable to any type of administrator.
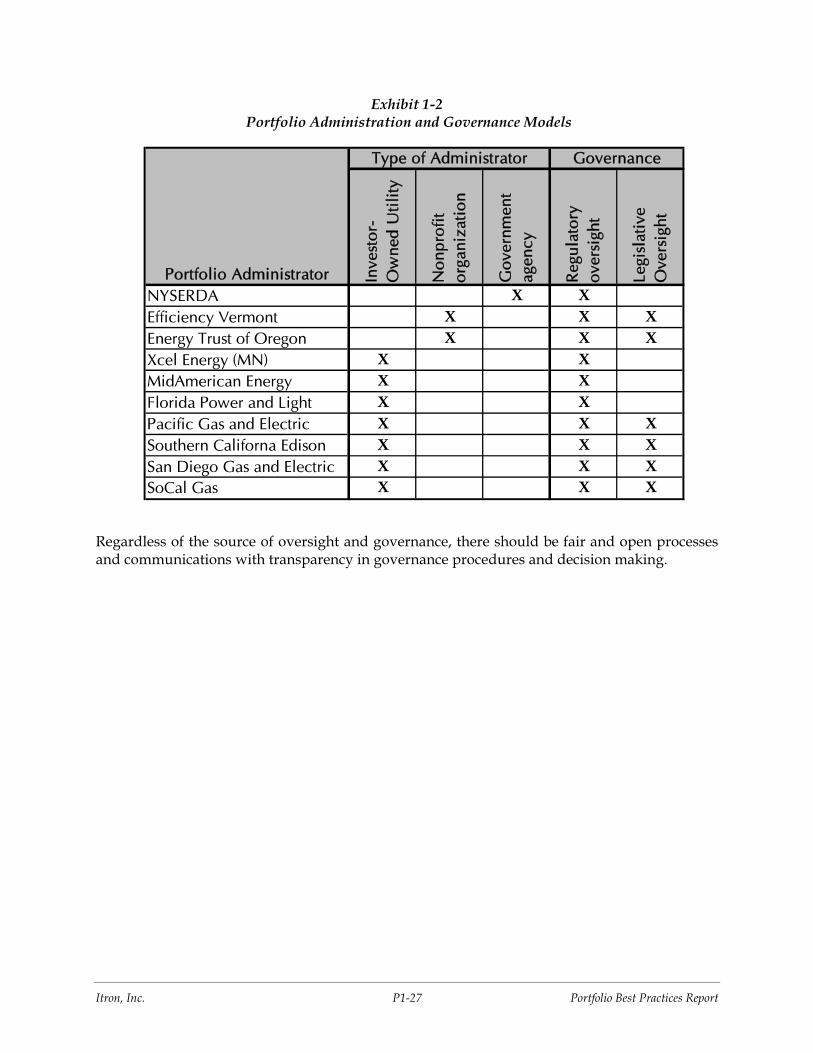
1.2.2 Governance
All portfolios face internal scrutiny by their own internal Boards of Directors. In addition, they are subject to independent oversight by one or more external governing bodies. The type of governance again varies by type of administrator. The general models are presented below:
• Utility administrators – Portfolios which are administered by investor-owned utilities are subject to oversight by their state utility regulatory agency, as part of its utility regulation function.
• Nonprofit and state agency administrators - Nonprofit portfolio administrators are usually overseen by one of two governing bodies – the state utility regulatory agency and/or a special legislative subcommittee. Utility regulatory agencies oversee all of the portfolios reviewed in this study.
Exhibit 1-2 below summarizes the Administrative and Governance models that apply to the portfolios reviewed in this study.
4 Decision 07-09-043 dated September 25, 2007 in the CPUC’s Order Instituting Rulemaking to Examine the
Commission’s post-2005 Energy Efficiency Policies, Programs, Evaluation, Measurement and Verification, and Related Issues
5 Blumstein, C, Goldman, G, and Barbose, G, August 2003, “Who Should Administer Energy Efficiency Markets?”, CSEM, page 1
Itron, Inc. P1-27 Portfolio Best Practices Report
Exhibit 1-2 Portfolio Administration and Governance Models
Inve
stor
-O
wne
d U
tili
ty
Non
prof
it
orga
niza
tion
Gov
ernm
ent
agen
cy
Reg
ulat
ory
over
sigh
t
Legi
slat
ive
Ove
rsig
ht
NYSERDA X XEfficiency Vermont X X XEnergy Trust of Oregon X X XXcel Energy (MN) X XMidAmerican Energy X XFlorida Power and Light X XPacific Gas and Electric X X XSouthern Californa Edison X X XSan Diego Gas and Electric X X XSoCal Gas X X X
Portfolio Administrator
Type of Administrator Governance
Regardless of the source of oversight and governance, there should be fair and open processes and communications with transparency in governance procedures and decision making.
Itron, Inc. P1-28 Portfolio Best Practices Report
2. CONTEXT AND ENVIRONMENT
Energy efficiency portfolios are well-suited to address many of the issues being faced today by the energy industry. These include rapid energy growth, increasing fuel prices, customer dissatisfaction over rising energy bills, reliability concerns, and mounting unease over global warming. These programs offer cost-effective, clean energy solutions for mitigating increased energy growth and associated environmental impacts, and also provide end-users with tools to help them reduce their energy costs.
A recent ACEEE paper characterizes a “perfect storm” of high fuel prices, escalating construction costs, increased uncertainty surrounding cost recovery for new generation plants, mounting concerns over system reliability, public opposition to the siting of new generation and transmission facilities, and looming environmental costs – potentially carbon emissions costs”6. In response to these factors, the level of interest in energy efficiency is growing nationwide, and many program administrators, including several of those in this study, have been called on to expand their programs, some significantly.
At the national level, a call-to-action has been sounded by a group of more than 50 leading energy and environmental stakeholder organizations that teamed up to prepare the National Action Plan for Energy Efficiency (NAPEE), published in July 2006. This plan calls for a “sustainable, aggressive national commitment to energy efficiency through gas and electric utilities, utility regulators, and partner organizations”.7
2.1 ISSUES
Specific issues being faced by the portfolios reviewed in this project are discussed in this section of the report. Many of the issues are national in scope, state and regional issues are also addressed. These issues include:
• Increasing demand for electricity
• Increasing energy costs
• Reliability concerns
• Localized capacity/T&D constraints
• Environmental/Climate change concerns
6 Kushler, M., York, D., Witte, P., “Aligning Utility Interests With Energy Efficiency Objectives: A Review of
Recent Efforts at Decoupling and Performance Incentives”, October 2006
7 U.S Department of Energy and U.S. Environmental Protection Agency, National Action Plan for Energy Efficiency (NAPEE), July 2006.
Itron, Inc. P1-29 Portfolio Best Practices Report
2.1.1 Increasing Demand for Electricity
At a national level, the demand for electricity is growing at a significant rate. According to the U.S. Energy Information Administration, electricity sales increased 3.2 percent in 2005, showing much stronger growth than the 2.3 percent average since 1980.8 Major contributing factors include continued economic growth, increasing population, and increasing energy service demands (e.g., larger homes and plug loads). The North American Reliability Council (NERC), in its 2007 Long-Term Reliability Assessment Report, projects that electric demand will increase by nearly 18 percent over the next 10 years.9 At the same time, the report notes that, committed and uncommitted power capacity will increase by only 12.5 percent. (Uncommitted resources are those resources that are still too early in the planning process to commit to providing energy and are therefore, still subject to considerable uncertainty.) Areas of greatest concern in the U.S. include California, the Rocky Mountain States, New England, Texas, the Southwest and the Midwest.10 The NAPEE report also observes that, “Energy demand continues to grow despite historically high energy prices and mounting concerns over energy security and independence as well as air pollution and global climate change.”11
Impact on Portfolios
In general, increased demand and energy growth have led to greater demand for portfolio programs. Capacity savings from portfolio programs are one of the few ways to fulfill short-term capacity needs resulting from this growth. Policy makers and utility management are increasingly designating portfolio programs as a preferred resource to help fulfill both short-term and longer-term resource needs. An example of this is Florida Power and Light, which experienced record high system peak demand for electricity during the summer of 2005. Its senior management authorized the deployment of all cost effective load reduction from energy efficiency and demand response programs, so that the utility could meet its reliability and reserve margin commitments.
2.1.2 Increasing Energy Costs
Higher energy prices have also intensified interest in portfolio programs, since they are a tool that can help consumers cope with increased energy bills (i.e. by decreasing their usage). During the past three years, consumers have experienced record high prices for virtually all forms of energy.
8 U.S. Energy Information Administration, 2006 Electric Power Annual
9 North American Reliability Council, 2007 Long-Term Reliability Assessment Report, page 10
10 Ibid, page 6
11 NAPEE, page ES-1.
Itron, Inc. P1-30 Portfolio Best Practices Report
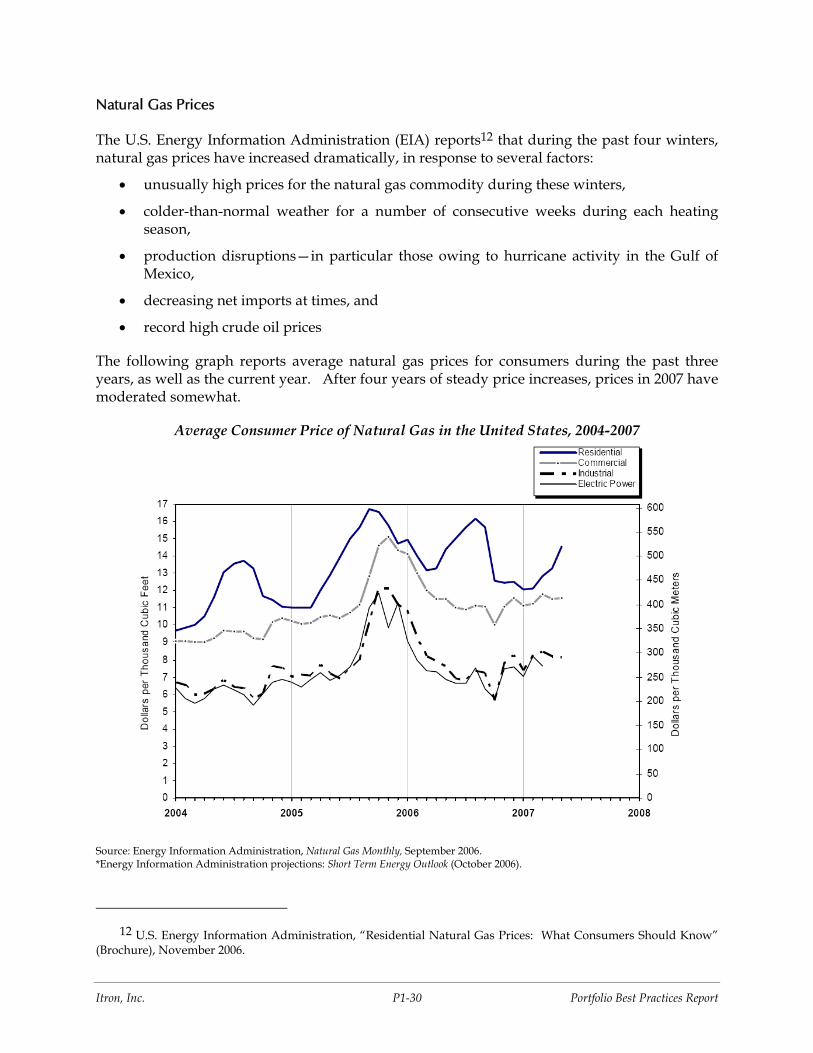
Natural Gas Prices
The U.S. Energy Information Administration (EIA) reports12 that during the past four winters, natural gas prices have increased dramatically, in response to several factors:
• unusually high prices for the natural gas commodity during these winters,
• colder-than-normal weather for a number of consecutive weeks during each heating season,
• production disruptions—in particular those owing to hurricane activity in the Gulf of Mexico,
• decreasing net imports at times, and
• record high crude oil prices
The following graph reports average natural gas prices for consumers during the past three years, as well as the current year. After four years of steady price increases, prices in 2007 have moderated somewhat.
Average Consumer Price of Natural Gas in the United States, 2004-2007
Source: Energy Information Administration, Natural Gas Monthly, September 2006. *Energy Information Administration projections: Short Term Energy Outlook (October 2006).
12 U.S. Energy Information Administration, “Residential Natural Gas Prices: What Consumers Should Know”
(Brochure), November 2006.
Itron, Inc. P1-31 Portfolio Best Practices Report
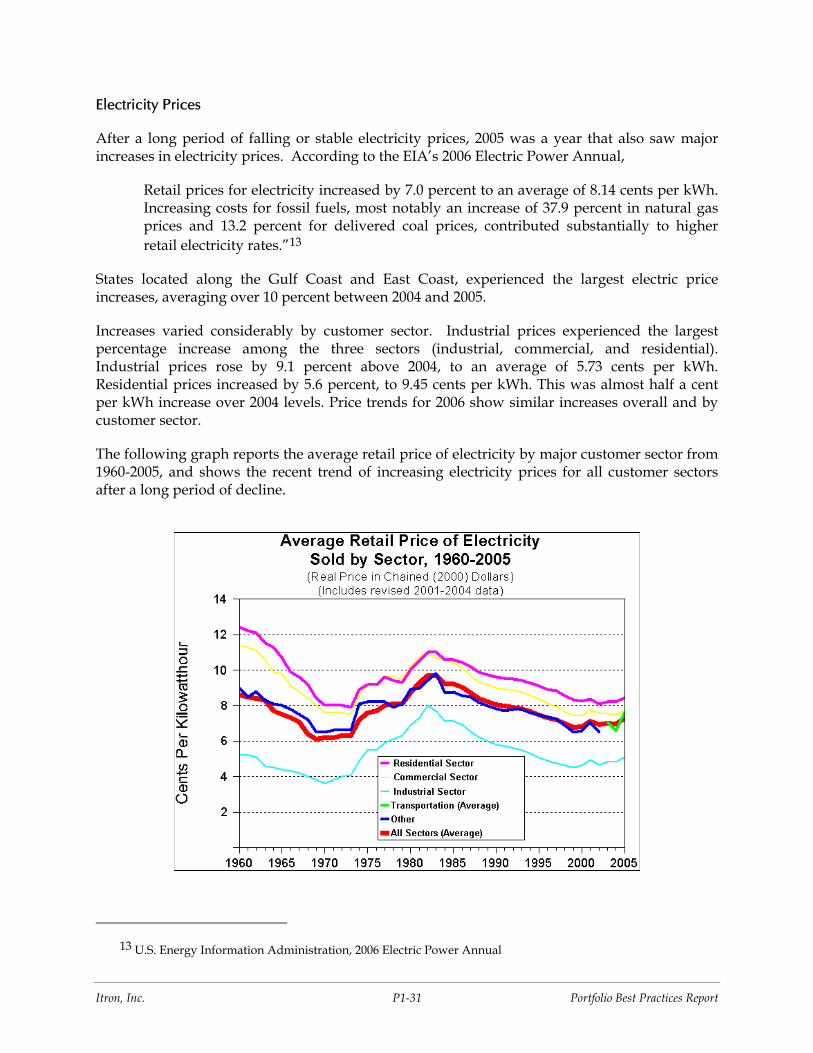
Electricity Prices
After a long period of falling or stable electricity prices, 2005 was a year that also saw major increases in electricity prices. According to the EIA’s 2006 Electric Power Annual,
Retail prices for electricity increased by 7.0 percent to an average of 8.14 cents per kWh. Increasing costs for fossil fuels, most notably an increase of 37.9 percent in natural gas prices and 13.2 percent for delivered coal prices, contributed substantially to higher retail electricity rates.”13
States located along the Gulf Coast and East Coast, experienced the largest electric price increases, averaging over 10 percent between 2004 and 2005.
Increases varied considerably by customer sector. Industrial prices experienced the largest percentage increase among the three sectors (industrial, commercial, and residential). Industrial prices rose by 9.1 percent above 2004, to an average of 5.73 cents per kWh. Residential prices increased by 5.6 percent, to 9.45 cents per kWh. This was almost half a cent per kWh increase over 2004 levels. Price trends for 2006 show similar increases overall and by customer sector.
The following graph reports the average retail price of electricity by major customer sector from 1960-2005, and shows the recent trend of increasing electricity prices for all customer sectors after a long period of decline.
13 U.S. Energy Information Administration, 2006 Electric Power Annual
Itron, Inc. P1-32 Portfolio Best Practices Report
Impact on Portfolios
In general, increasing energy prices have affected portfolios in many ways. For example, they have:
• Increased end-users’ awareness of energy costs;
• Increased end-users’ demand for energy audits, particularly in areas with significant space heating requirements;14
• Improved the economics of installing energy efficient equipment by increasing the value of the energy savings and consequently, reducing the simple payback period; and,
• Increased avoided cost levels, thereby making a wider range of energy savings measures cost-effective.
• Increased the potential for free ridership.
Policymakers are well aware of these and are adapting portfolio budgets, program activities and delivery strategies in order to take advantage of the desirable impacts and to avoid those that are undesirable.
2.1.3 Reliability Concerns
Reliability concerns have been a key issue in energy system planning during the past five years. These concerns have been accentuated by events such as the August 2003 electricity blackout in the Northeast and Hurricane Katrina in 2005, which have highlighted the vulnerability of our transmission delivery infrastructure to widespread outages. The growth in electricity demand cited earlier places added stress on the electricity delivery infrastructure, fueling additional concerns.
In order to prevent future blackouts, a number of steps have been undertaken to reinforce the integrity of the national transmission system backbone.15 Many of these were enacted through the passage of the Energy Policy Act of 2005 (EPAct).
Policymakers are also becoming aware of the strong role that portfolio programs can potentially play to address reliability issues. Both energy efficiency and demand response programs are tools that can help to ameliorate reliability concerns, by reducing system peak demand and related transmission capacity requirements. Savings from portfolio measures are one of the few ways to provide the immediate load relief needed to address these capacity shortfalls. Portfolio
14 MidAmerican Energy, one of the Midwestern portfolios reviewed in this study has been particularly
challenged by the surge in residential customer demand for audits, and related budgetary and staffing needs and reallocations involved.
15 Hilt, D., “August 14, 2003, Northeast Blackout Impacts and Actions and the Energy Policy Act of 2005”, August 2006.
Itron, Inc. P1-33 Portfolio Best Practices Report
programs can be an effective solution to address both short-term and longer-term reliability needs.
2.1.4 Localized Capacity Needs/Constraints
In addition to the general regional and national concerns over reliability, some utilities need to deploy additional resources to meet localized capacity requirements. This typically occurs when growth in specific parts of their service territories places a strain on localized transmission and distribution (T&D) facilities. In some cases, the growth is occurring in remote areas for which it would be very costly to upgrade the T&D system using conventional measures. Others, such as utilities in New York, have localized requirements for installed capacity that must be met. Savings from portfolio programs can help to address these needs as well by targeting efforts towards energy efficiency and load reduction in the affected areas. One of the portfolios in this study, NYSERDA, has received additional funding in order to expand its efforts in the New York City area, in order to help reduce electric demand there.
In the longer-term, investments can be made in generation and T&D facilities to address these needs. In the short-term, however, savings from portfolio measures can provide the immediate load reductions needed to address these capacity shortfalls
2.1.5 Environmental Concerns / Climate Change
Concerns over global warming and its potential impacts are rising and becoming more widespread. Although the possible magnitude, impacts, and trajectory of climate change over the next century can only be approximated, many states and regions have elected to take action themselves, rather than waiting for federal action. Individual states as well as regional planning organizations (RPOs) have developed policies to address the effects of global climate change, in particular, those resulting from the energy sector. After the Bush administration rejected the Kyoto Protocol in March 2001, states and municipalities took on greater responsibility to institute policies to counter greenhouse gas (GHG) emissions and their effects on global warming. A number of these policies promote the use of energy efficiency programs. According to the EPA,
The potential energy savings achievable through state actions is significant. EPA estimates that if each state were to implement cost-effective clean energy-environment policies, the expected growth in demand for electricity could be cut in half by 2025, and more demand could be met through cleaner energy supply. This would mean annual savings of more than 900 billion kilowatt-hours (kWh) and $70 billion in energy costs by 2025, while preventing the need for more than 300 power plants and reducing greenhouse gas emissions by an amount equivalent to emissions from 80 million of today’s vehicles.16
16 U.S. Environmental Protection Agency. Clean Energy-Environment Guide to Action: Policies, Best Practices, and
Action Steps for States. April 2006. EPA’s reported estimates here are based on a meta-analysis that examined results of 11 different studies. References to these studies can be found in the above referenced Guide to Action.
Itron, Inc. P1-34 Portfolio Best Practices Report
Major efforts carried out by the states include:
• commitment to GHG emission-reduction goals,
• design of GHG emission-reduction incentive programs, primarily cap-and-trade,
• the creation of state-level inventories of GHG emissions at the sector level to track which industries are emitting relatively larger percentages of GHGs,
• the development of GHG emission projections based on alternative energy-usage scenarios to inform policy decisions,17
• outreach to companies and residents to encourage energy conservation and energy-wise choices, and
• the adoption of energy efficiency policies and comprehensive state action plans to counter the increasing releases of CO2 into the atmosphere.
An evaluation of over a decade of state-level annual carbon dioxide emissions data was conducted for this Best Practices report to determine which states have the lowest and highest average per capita emissions of carbon dioxide. A caveat to these results is that a number of factors, aside from state policies addressing greenhouse gases, affect state level per capita CO2 emissions. Some of these factors include weather, geographical terrain, degree of urban to rural density, natural gas transmission and distribution infrastructure, as well as the availability of alternate or renewable energy. Average per capita emissions of CO2 were based on data from 1990 through 2003. It was during these years that a number of states began efforts to reduce GHG emissions.
As Exhibit 2-1 shows, the states with the lowest per capita CO2 emissions include California, and a number of states in the New England region such as New York, Massachusetts, Vermont, Rhode Island, Connecticut, and New Hampshire. The New England states are all a part of RGGI, which has received a great deal of attention due to its formation and focus on the reduction of carbon dioxide emissions. Note, however, that the per capita CO2 emissions for some of these states (e.g., Rhode Island) are expected to be low due to relatively small shares of industrial load. The state with the highest per capita average CO2 emissions is Wyoming, which uses coal as a major source of energy generation, while the median state is Colorado.
17 For example, the California Energy Commission has begun research on long-term energy use and efficiency
scenarios as part of its Public Energy Interest Research (PIER) program. See Rufo, Michael W., and Alan S. North. 2007. Assessment of Long-Term Electric Energy Efficiency Potential in California’s Residential Sector. California Energy Commission, PIER Energy-Related Environmental Research. CEC-500-2007-02
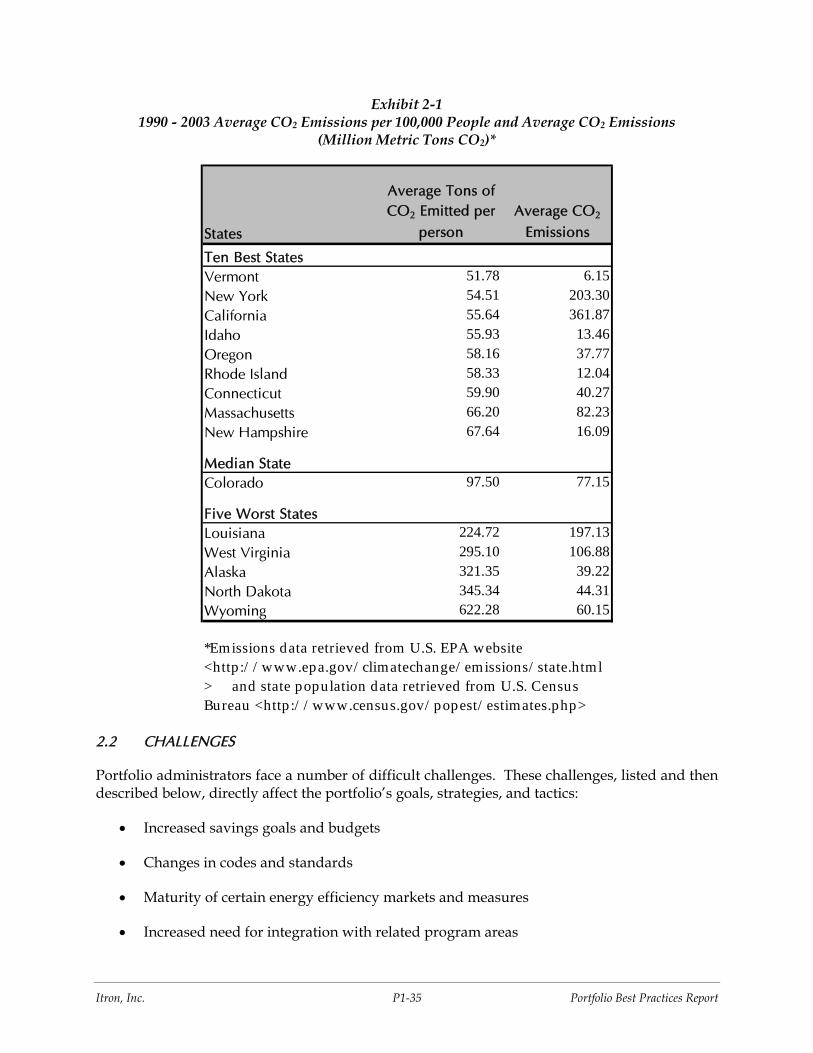
Itron, Inc. P1-35 Portfolio Best Practices Report
Exhibit 2-1 1990 - 2003 Average CO2 Emissions per 100,000 People and Average CO2 Emissions
(Million Metric Tons CO2)*
States
Average Tons of CO2 Emitted per
personAverage CO2
Emissions
Ten Best StatesVermont 51.78 6.15New York 54.51 203.30California 55.64 361.87Idaho 55.93 13.46Oregon 58.16 37.77Rhode Island 58.33 12.04Connecticut 59.90 40.27Massachusetts 66.20 82.23New Hampshire 67.64 16.09
Median StateColorado 97.50 77.15
Five Worst StatesLouisiana 224.72 197.13West Virginia 295.10 106.88Alaska 321.35 39.22North Dakota 345.34 44.31Wyoming 622.28 60.15
*Emissions data retrieved from U.S. EPA website <http :/ / www.epa.gov/ climatechange/ emissions/ state.html> and state population data retrieved from U.S. Census Bureau <http :/ / www.census.gov/ popest/ estimates.php>
2.2 CHALLENGES
Portfolio administrators face a number of difficult challenges. These challenges, listed and then described below, directly affect the portfolio’s goals, strategies, and tactics:
• Increased savings goals and budgets
• Changes in codes and standards
• Maturity of certain energy efficiency markets and measures
• Increased need for integration with related program areas
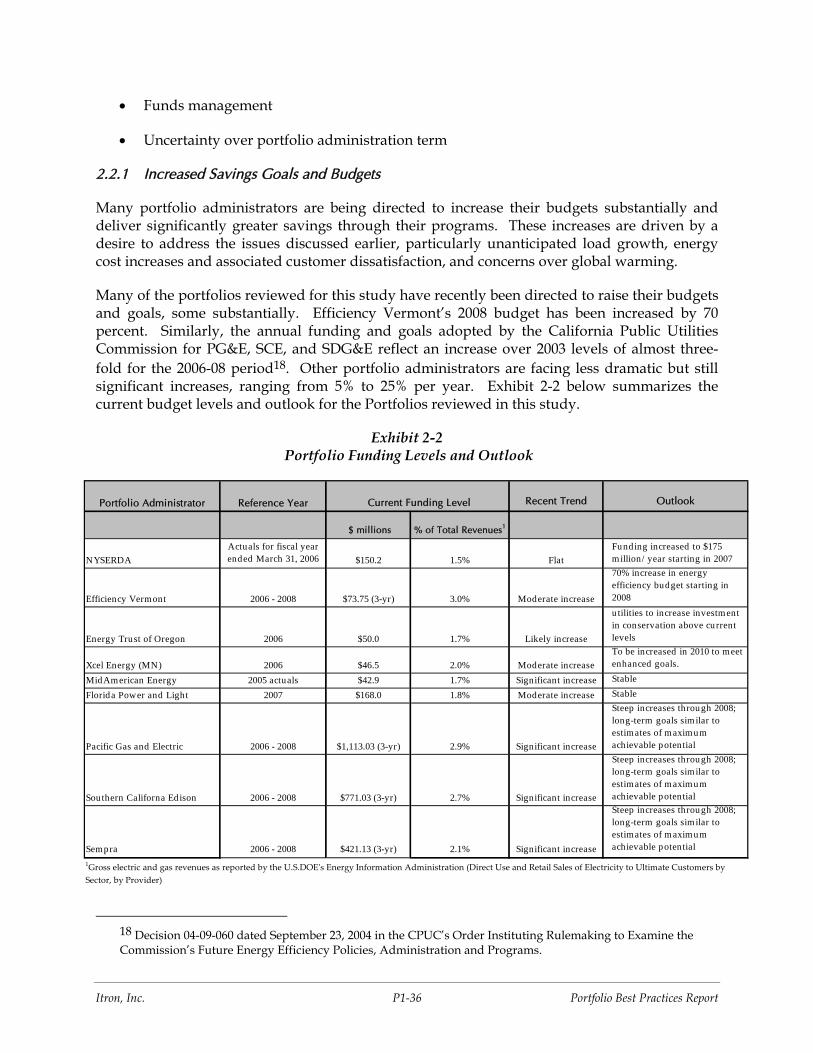
Itron, Inc. P1-36 Portfolio Best Practices Report
• Funds management
• Uncertainty over portfolio administration term
2.2.1 Increased Savings Goals and Budgets
Many portfolio administrators are being directed to increase their budgets substantially and deliver significantly greater savings through their programs. These increases are driven by a desire to address the issues discussed earlier, particularly unanticipated load growth, energy cost increases and associated customer dissatisfaction, and concerns over global warming.
Many of the portfolios reviewed for this study have recently been directed to raise their budgets and goals, some substantially. Efficiency Vermont’s 2008 budget has been increased by 70 percent. Similarly, the annual funding and goals adopted by the California Public Utilities Commission for PG&E, SCE, and SDG&E reflect an increase over 2003 levels of almost three-fold for the 2006-08 period18. Other portfolio administrators are facing less dramatic but still significant increases, ranging from 5% to 25% per year. Exhibit 2-2 below summarizes the current budget levels and outlook for the Portfolios reviewed in this study.
Exhibit 2-2 Portfolio Funding Levels and Outlook
Portfolio Administrator Reference Year Recent Trend Outlook
$ millions % of Total Revenues1
NYSERDAActuals for fiscal year ended March 31, 2006 $150.2 1.5% Flat
Funding increased to $175 million/ year starting in 2007
Efficiency Vermont 2006 - 2008 $73.75 (3-yr) 3.0% Moderate increase
70% increase in energy efficiency budget starting in 2008
Energy Trust of Oregon 2006 $50.0 1.7% Likely increase
u tilities to increase investment in conservation above current levels
Xcel Energy (MN) 2006 $46.5 2.0% Moderate increaseTo be increased in 2010 to meet enhanced goals.
MidAmerican Energy 2005 actuals $42.9 1.7% Significant increase Stable
Florida Power and Light 2007 $168.0 1.8% Moderate increase Stable
Pacific Gas and Electric 2006 - 2008 $1,113.03 (3-yr) 2.9% Significant increase
Steep increases through 2008; long-term goals similar to estimates of maximum achievable potential
Southern Californa Edison 2006 - 2008 $771.03 (3-yr) 2.7% Significant increase
Steep increases through 2008; long-term goals similar to estimates of maximum achievable potential
Sempra 2006 - 2008 $421.13 (3-yr) 2.1% Significant increase
Steep increases through 2008; long-term goals similar to estimates of maximum achievable potential
Current Funding Level
1Gross electric and gas revenues as reported by the U.S.DOEʹs Energy Information Administration (Direct Use and Retail Sales of Electricity to Ultimate Customers by Sector, by Provider)
18 Decision 04-09-060 dated September 23, 2004 in the CPUC’s Order Instituting Rulemaking to Examine the Commission’s Future Energy Efficiency Policies, Administration and Programs.
Itron, Inc. P1-37 Portfolio Best Practices Report
Administrators, regulators, and policy makers in jurisdictions that have set newly aggressive goals for energy efficiency will need to closely monitor market response to determine which of their new and expanded initiatives are most effective. To maximize success, these more aggressive goals will likely also require closer analysis and integration of energy efficiency market strategies across the full spectrum of available policy tools and program tactics (e.g., incentive programs, information programs, market transformation efforts, and codes and standards).
2.2.2 Changes in Codes and Standards
Another challenge faced by many portfolio managers with increasing goals is keeping up with, and achieving savings incremental to, changes in appliance efficiency standards and building codes. Many portfolio programs encourage purchases of energy efficiency measures relative to market baselines, which are often based on energy efficiency codes and standards. As codes and standards increase to capture more of the available efficiency potential, voluntary programs must concomitantly raise the level of efficiency of equipment that they promote. When codes and standards are increased aggressively, this can sometimes create sudden reductions in the amount of cost-effective efficiency potential available for voluntary programs. Often, this gap proves to be temporary as markets adjust to the new standards and demand for higher efficiency measures is stimulated through new programs. This pattern has been repeated several times for a number of products over the past 25 years of energy efficiency programs and policies. Nonetheless, in the short-term, adjusting to increasing codes and standards can be challenging, particularly when changes coincide with increasing goals for voluntary programs.
One obvious example of this is the changes in federal appliance efficiency standards that occur periodically. A case in point is the 2006 increase in the minimum SEER rating for central and packaged air conditioners (A/C) from a SEER of 10 to SEER 13. Many portfolios located in warm summer climate regions have had to revise their programs significantly to address this standards revision. They have found that A/C equipment that moderately exceeds the new standard is not cost effective unless combined with a “quality installation” approach that includes proper A/C sizing, refrigerant charge, and duct sealing. Although significant savings are likely available from improving A/C system practices, changing practices is inherently more challenging and complex than simply replacing like-for-like equipment with higher rated efficiency levels.
Over the next 5 years, the U.S. Department of Energy (USDOE) plans to update efficiency standards for a number of additional measures. Per their schedule, new standards are expected for the following measures in 2008: packaged terminal air conditioners and heat pumps, refrigerated vending machines, and a wide range of commercial refrigeration measures. 19
19 Because USDOE has fallen behind schedule in issuing these new standards, many states have taken the
initiative to adopt their own standards which exceed the federal levels. By the time the USDOE standards are issued, they are already behind where the market is. For example, USDOE recently proposed to require all furnaces and boilers to have an 80% AFUE rating – a level which is already met by nearly all furnaces bought today. This means that additional savings accruing from the new standard are minimal.
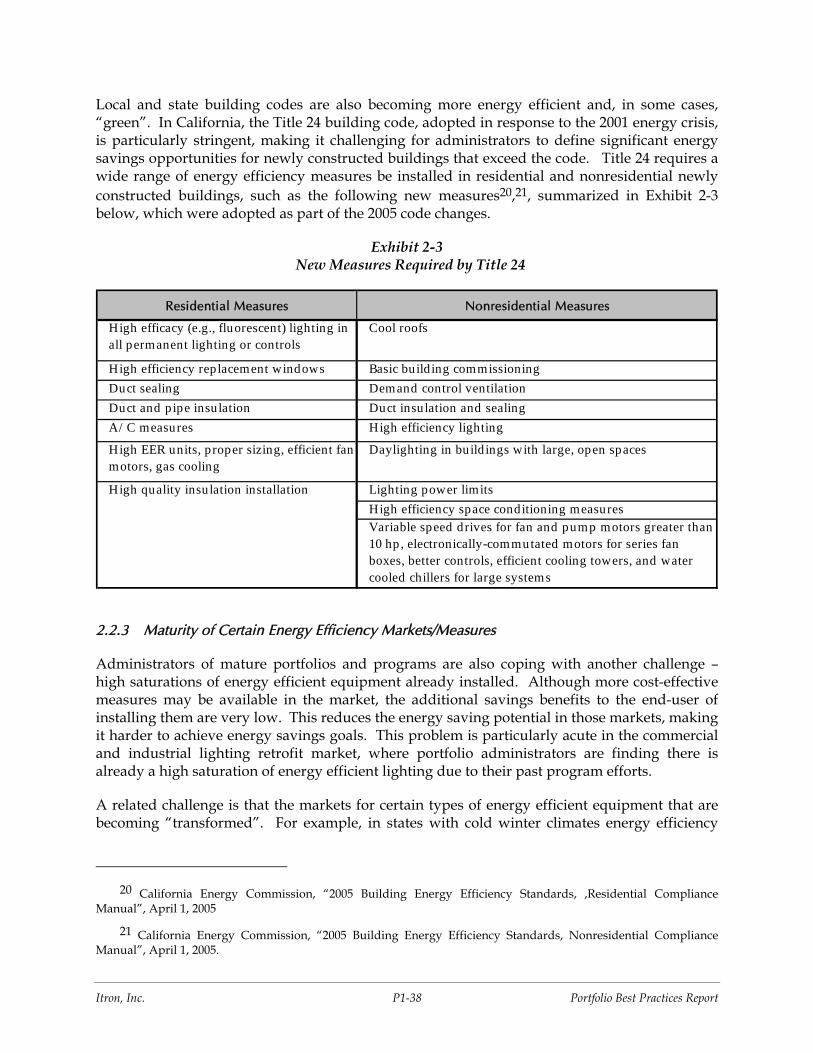
Itron, Inc. P1-38 Portfolio Best Practices Report
Local and state building codes are also becoming more energy efficient and, in some cases, “green”. In California, the Title 24 building code, adopted in response to the 2001 energy crisis, is particularly stringent, making it challenging for administrators to define significant energy savings opportunities for newly constructed buildings that exceed the code. Title 24 requires a wide range of energy efficiency measures be installed in residential and nonresidential newly constructed buildings, such as the following new measures20,21, summarized in Exhibit 2-3 below, which were adopted as part of the 2005 code changes.
Exhibit 2-3 New Measures Required by Title 24
Residential Measures Nonresidential Measures
High efficacy (e.g., fluorescent) lighting in all permanent lighting or controls
Cool roofs
High efficiency replacement windows Basic build ing commissioningDuct sealing Demand control ventilationDuct and p ipe insulation Duct insulation and sealingA/ C measures High efficiency lighting
High EER units, proper sizing, efficient fan motors, gas cooling
Daylighting in build ings with large, open spaces
Lighting power limitsHigh efficiency space conditioning measuresVariable speed drives for fan and pump motors greater than 10 hp , electronically-commutated motors for series fan boxes, better controls, efficient cooling towers, and water cooled chillers for large systems
High quality insulation installation
2.2.3 Maturity of Certain Energy Efficiency Markets/Measures
Administrators of mature portfolios and programs are also coping with another challenge – high saturations of energy efficient equipment already installed. Although more cost-effective measures may be available in the market, the additional savings benefits to the end-user of installing them are very low. This reduces the energy saving potential in those markets, making it harder to achieve energy savings goals. This problem is particularly acute in the commercial and industrial lighting retrofit market, where portfolio administrators are finding there is already a high saturation of energy efficient lighting due to their past program efforts.
A related challenge is that the markets for certain types of energy efficient equipment that are becoming “transformed”. For example, in states with cold winter climates energy efficiency
20 California Energy Commission, “2005 Building Energy Efficiency Standards, ,Residential Compliance
Manual”, April 1, 2005
21 California Energy Commission, “2005 Building Energy Efficiency Standards, Nonresidential Compliance Manual”, April 1, 2005.
Itron, Inc. P1-39 Portfolio Best Practices Report
rebate programs have transformed the residential furnace market. Many builders and HVAC contractors routinely install high efficiency furnaces, and many codes now prescribe them. Another market that is in the process of becoming transformed is the compact fluorescent bulb (CFL) market. CFL prices have dropped significantly during the past 5 years, and are expected to continue to decline. In addition, the quality of CFL bulbs has improved dramatically. To date, consumers have been relatively slow to adopt CFLs on a large scale, but this could change in response to mass marketing efforts by large corporations such as Wal-Mart, and as further improvements occur, reducing the need for their promotion via portfolio programs.
2.2.4 Increased Need for Integration with Related Program Areas
Consumers’ concerns over energy and environmental issues are growing, and many desire to take action. Many different programs are now available to address these concerns. Some of these programs are within the portfolio, but many are not. The types of programs include:
• Energy Efficiency
• Demand Response
• Green Pricing
• Green Buildings/LEED certification
• Renewable Energy
• Distributed Generation
• Related Loan Programs and Tax Credits
Some portfolio administrators have undertaken steps to deliver such programs in an integrated, “one stop” manner. This places an additional burden on portfolio administrators who must interact with staff of many different programs, clarify respective roles and responsibilities, prepare proposals that incorporate multiple program offerings, and in some cases, coordinate their program designs in order to minimize overlap conflicts.
Integrating portfolio programs with state and federal tax credits and incentives involves a related phenomenon (see section 3.3.2, below). Congress and legislatures are increasingly active in energy policy, and coordinating portfolio programs with a dynamic collection of legislative incentives poses a major challenge and opportunity for program administrators and consumers.
2.2.5 Funds Management
Effective management of portfolio funds is another challenge that affects all portfolios, particularly those with fixed funding levels (e.g., a fixed System Benefits Charge). Many of the newer portfolios have benefited in past years from “carryover” funds, representing unspent budget during previous years when their programs were ramping up. These carryover funds are now largely spent and there are no comparable funding sources to take their place.
Itron, Inc. P1-40 Portfolio Best Practices Report
Tight management of program funds is especially difficult during times when consumer awareness and interest in energy efficiency services is high, as it is now. Administrators must implement reservation systems to protect funds so that they are available throughout the program year.
2.2.6 Uncertainty over Portfolio Administration Term
One last area of challenge for some administrators is related to uncertainty over their tenure. Most of the organizations reviewed in this study have a finite term of administration, with some uncertainty about the future. This uncertainty makes it difficult for the portfolio administrator to implement longer-term strategies.
Itron, Inc. P1-41 Portfolio Best Practices Report
3. COMPARISON OF PORTFOLIO COMPONENTS
This section compares the portfolios reviewed across each of the major portfolio components used to organize the data collection and analysis in this study. The component areas and the various elements addressed within each are listed below. The first four component areas address portfolio objective, design management and evaluation practices; the fifth area addresses the overarching policies and regulations that influence the portfolio’s performance. Each of these areas is discussed separately.
• Portfolio Goals and Objectives
• Portfolio Planning Process
• Portfolio Design: Adaptation to Changes in Technologies and Market Conditions
• Portfolio Management Practices
− Staffing Approach
− Program Integration
− Quality Control and Verification
− Reporting and Tracking
• Portfolio Evaluation and Adaptability
• Regulatory and Policy Environment
− Alignment with Organizational Strategic and Financial Goals
− Impact on Short-term and Long-term Resource Planning
− Avoided Cost and Cost-Effectiveness Procedures
− Funding Stability/Funds Management
Appendix A provides a brief overview of the study’s objectives, scope and methodology, and includes the rationale for selection of each of these component areas.
3.1 PORTFOLIO OBJECTIVES
The portfolio’s goals and objectives are instrumental in defining the expected outcomes against which its success will be judged. Effective portfolio management practices are designed around a set of clearly-defined objectives or goals which are actionable and measurable. This allows the portfolio administrator to assess their progress versus the objectives on a regular basis and to take corrective actions if results are not on-track.
Portfolio objectives typically originate from one of three sources: legislation, regulatory rules or policies, or the administrator’s governing board or senior management team. Some may result
Itron, Inc. P1-42 Portfolio Best Practices Report
from a combination of sources (as is the case for the Trust, which has separate sets of objectives set by its governing board and regulatory agency, respectively). These objectives may be quantitative and have specific measurable outcomes, or qualitative with no attached metrics.
Recently, there has been an increased emphasis on resource acquisition as a primary objective. In many states, this has been an outcome of their renewed interest in energy efficiency and related actions to make it a significant part of the overall energy resource mix. Most states no longer view market transformation as conflicting with resource acquisition, but consider it a tool or strategy to fulfill their primary resource acquisition objective.
Current Portfolio Practices
Despite significant differences in administrative structures, and regulatory and policy environments, the nine Portfolios involved in this study have fairly similar objectives. An overarching objective cited by all nine portfolios is the cost-effective acquisition of energy savings (i.e., resource acquisition). Portfolio administrators see their primary purpose as delivering a committed block of cost-effective energy savings, in order to demonstrate the portfolio’s credibility as a reliable resource for meeting energy and capacity resource needs.
Other Portfolio objectives and their sources of origin are summarized in Exhibit 3-1 below. Those objectives marked with an “XX” are subject to measurement.
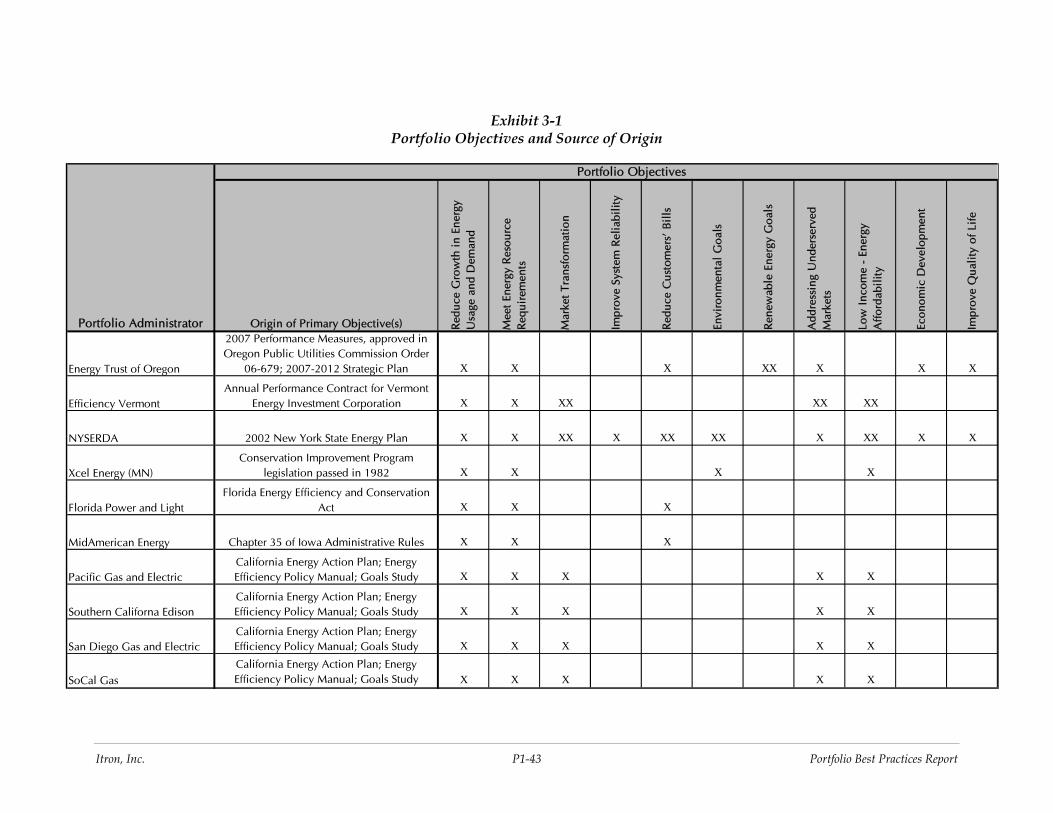
Itron, Inc. P1-43 Portfolio Best Practices Report
Exhibit 3-1 Portfolio Objectives and Source of Origin
Origin of Primary Objective(s) Red
uce
Gro
wth
in
Ener
gy
Usa
ge a
nd D
eman
d
Mee
t En
ergy
Res
ourc
e R
equi
rem
ents
Mar
ket
Tran
sfor
mat
ion
Impr
ove
Syst
em R
elia
bili
ty
Red
uce
Cus
tom
ers'
Bil
ls
Envi
ronm
enta
l G
oals
Ren
ewab
le E
nerg
y G
oals
Add
ress
ing
Und
erse
rved
M
arke
ts
Low
Inc
ome
- En
ergy
A
ffor
dabi
lity
Econ
omic
Dev
elop
men
t
Impr
ove
Qua
lity
of
Life
Energy Trust of Oregon
2007 Performance Measures, approved in Oregon Public Utilities Commission Order
06-679; 2007-2012 Strategic Plan X X X XX X X X
Efficiency VermontAnnual Performance Contract for Vermont
Energy Investment Corporation X X XX XX XX
NYSERDA 2002 New York State Energy Plan X X XX X XX XX X XX X X
Xcel Energy (MN)Conservation Improvement Program
legislation passed in 1982 X X X X
Florida Power and LightFlorida Energy Efficiency and Conservation
Act X X X
MidAmerican Energy Chapter 35 of Iowa Administrative Rules X X X
Pacific Gas and ElectricCalifornia Energy Action Plan; Energy Efficiency Policy Manual; Goals Study X X X X X
Southern Californa EdisonCalifornia Energy Action Plan; Energy Efficiency Policy Manual; Goals Study X X X X X
San Diego Gas and ElectricCalifornia Energy Action Plan; Energy Efficiency Policy Manual; Goals Study X X X X X
SoCal GasCalifornia Energy Action Plan; Energy Efficiency Policy Manual; Goals Study X X X X X
Portfolio Administrator
Portfolio Objectives
Itron, Inc. P1-44 Portfolio Best Practices Report
In reviewing them, the following general themes emerged:
• Beyond resource acquisition, a primary objective of all portfolios in this study is the desire to reduce growth in energy usage and demand. Widespread use of portfolio programs is an effective way to address increased energy and peak demand growth.
• The most common secondary objectives include market transformation, addressing underserved markets, and making energy more affordable to low income families. Several portfolios named market transformation as a key goal, viewing it as a complementary strategy for helping them attain their resource acquisition goals. Other key objectives named are related to serving lower income and hard-to-reach markets.
• Another objective that is increasing in importance is that of lowering customers’ bills through promotion of energy efficiency. In the wake of significant rate increases, many portfolio administrators now view their programs as an effective tool for lowering customers’ bills. Four of the portfolios explicitly state reducing customers’ bills as a portfolio objective. Virtually all of those interviewed recognized their portfolio’s role in addressing customers’ concerns over high energy bills.
• All portfolios have an overarching customer satisfaction objective. Some portfolios have it as an explicit objective; for others, it is part of their corporate mission which applies to all corporate activities.
• All of the portfolios in this study have established quantitative goals for their most important objectives, resource acquisition and cost-effectiveness. However only one organization, Efficiency Vermont, has fully quantified and weighted objectives. Most of the other Portfolios have one or more secondary objectives that are qualitative only. Having objectives that are quantifiable or measurable is important for being able to demonstrate your success in achieving the objective.
• All nine Portfolios also have tracking tools in place that allow them to monitor progress against these quantitative metrics. The specific tools used to track the Portfolio’s results are discussed later in this report.
In some states, portfolio objectives are defined based on a comprehensive energy policy framework. For example, in California, the investor-owned utilities’ portfolio objectives are based on policies and procedures prescribed in the California Energy Action Plan, the Energy Efficiency Policy Manual, and the current Statewide Energy Efficiency Goals study. Taken together, these documents provide the policy framework to guide the implementation of energy efficiency and renewable energy programs in California.
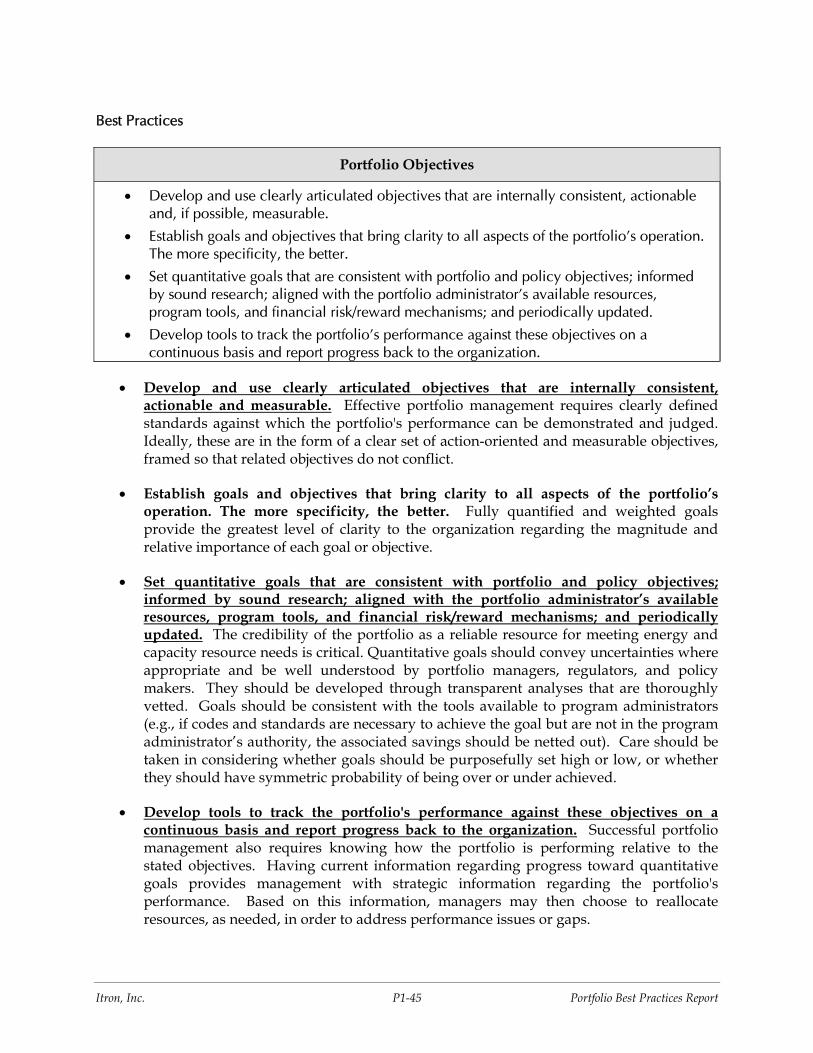
Itron, Inc. P1-45 Portfolio Best Practices Report
Best Practices
Portfolio Objectives
• Develop and use clearly articulated objectives that are internally consistent, actionable and, if possible, measurable.
• Establish goals and objectives that bring clarity to all aspects of the portfolio’s operation. The more specificity, the better.
• Set quantitative goals that are consistent with portfolio and policy objectives; informed by sound research; aligned with the portfolio administrator’s available resources, program tools, and financial risk/reward mechanisms; and periodically updated.
• Develop tools to track the portfolio's performance against these objectives on a continuous basis and report progress back to the organization.
• Develop and use clearly articulated objectives that are internally consistent, actionable and measurable. Effective portfolio management requires clearly defined standards against which the portfolio's performance can be demonstrated and judged. Ideally, these are in the form of a clear set of action-oriented and measurable objectives, framed so that related objectives do not conflict.
• Establish goals and objectives that bring clarity to all aspects of the portfolio’s operation. The more specificity, the better. Fully quantified and weighted goals provide the greatest level of clarity to the organization regarding the magnitude and relative importance of each goal or objective.
• Set quantitative goals that are consistent with portfolio and policy objectives; informed by sound research; aligned with the portfolio administrator’s available resources, program tools, and financial risk/reward mechanisms; and periodically updated. The credibility of the portfolio as a reliable resource for meeting energy and capacity resource needs is critical. Quantitative goals should convey uncertainties where appropriate and be well understood by portfolio managers, regulators, and policy makers. They should be developed through transparent analyses that are thoroughly vetted. Goals should be consistent with the tools available to program administrators (e.g., if codes and standards are necessary to achieve the goal but are not in the program administrator’s authority, the associated savings should be netted out). Care should be taken in considering whether goals should be purposefully set high or low, or whether they should have symmetric probability of being over or under achieved.
• Develop tools to track the portfolio's performance against these objectives on a continuous basis and report progress back to the organization. Successful portfolio management also requires knowing how the portfolio is performing relative to the stated objectives. Having current information regarding progress toward quantitative goals provides management with strategic information regarding the portfolio's performance. Based on this information, managers may then choose to reallocate resources, as needed, in order to address performance issues or gaps.
Itron, Inc. P1-46 Portfolio Best Practices Report
3.2 PORTFOLIO DESIGN
3.2.1 Portfolio Planning Process
A well-structured and data-driven portfolio and program planning process can potentially benefit the Portfolio in many ways, by providing:
• Consistent development of the overall portfolio and underlying program plans, including goals, incentive levels, and other program attributes.
• Well-designed programs incorporating industry best practices, market and technology research, and input from key stakeholders (such as trade allies).
• Stakeholder buy-in (if a collaborative process is used),
• Quantitative and qualitative benchmarks to monitor program performance against.
The portfolios in this study use fairly structured processes to design their portfolios and programs. Each of these processes has the following features in common: (1) planning processes and steps are deliberate, and are consistently applied across all programs; and (2) quantitative portfolio and program features and goals are data driven, and are based primarily on current, relevant market research. All 3 of the California IOU portfolio administrators have recently decided to set-up separate planning groups with dedicated staff. This will allow them to conduct program research and planning tasks on a more continuous basis.
There are several versions of these structured portfolio and program planning processes being used, for example:
• Both FPL and PG&E design each program based on an in-house product development process model. The end result is programs that are designed based on a deliberate and structured planning approach, in a manner consistent with other corporate products. One outcome of the PG&E model is a long-term market strategy for each targeted measure based on the anticipated market transformation.
• MidAmerican uses a detailed and comprehensive program and portfolio planning process that involves use of:
− Dedicated staff to lead the program design process
− Large stakeholder teams to make decisions regarding program design changes
− Diagnostic tools such as process flow diagrams to document where changes need to be made
• Efficiency Vermont designs its programs based on their understanding of how markets work. They use market research to support this understanding in some cases. They design their delivery approaches based on input and feedback from trade allies, with whom they collaborate to deliver efficiency measures to end-users.
Itron, Inc. P1-47 Portfolio Best Practices Report
• Xcel – MN uses a data-driven process to design its programs and set savings goals, based on the results of an energy efficiency potential study. Like FPL and PG&E, their program design and development process is based on their product development process. They research successful program approaches and strategies used by others and adapt them to their own customers and market conditions.
• Sempra has a common set of materials and tools for program managers to use when planning programs. They have an internal tool called Program Builder that looks at technology data systematically, and gives them a snapshot of program data with detailed assumptions. They also have a budgeting tool for program managers, which reports historical administrative budgets, and incentive budgets. This helps them to forecast budgets for future years. They use technology data from the DEER database for standard measures, and they perform market research for non-standard measures.
The program planning process may also include the development of formal program theories (or logic models) which can provide considerable value, particularly for programs with a strong market focus that involve complex delivery strategies and implementation teams. Logic models express the chain of events which lead to measure adoption, and include formal metrics for each event. These allow the program manager to closely monitor progress against stated metrics and to adjust the program when results are off-track.
For the most part, these portfolios do not make use of formal program theories22 as the first step in their program planning processes. Only NYSERDA and the Trust develop formal program theories prior to designing their programs. NYSERDA has been strongly committed to the development and use of program theory, and until recently, had a separate evaluation team dedicated to program theory and logic modeling. Now, that function has been combined with market characterization, with one team to address both. In the past, when its programs were less well-established, NYSERDA primarily used program theory to identify mid-course corrections. Now that these programs are mature, NYSERDA has shifted its use to new program designs where it is used to confirm the initial design or identify changes that need to be made.
There are three main reasons why program theory is less widely-used:
• As the emphasis of portfolios and programs has shifted toward a predominantly resource acquisition focus, the use of detailed formal theories has been de-emphasized.
• Many programs were in place for many years pre-dating the interest in formal program theory, and therefore, making development of theory unnecessary.
• Regulators are not requiring its use, as in the past.
22 A program theory provides a cause-and-effect framework that lays out the proposed intervention strategies
and explains how they will lead to the desired outcomes.
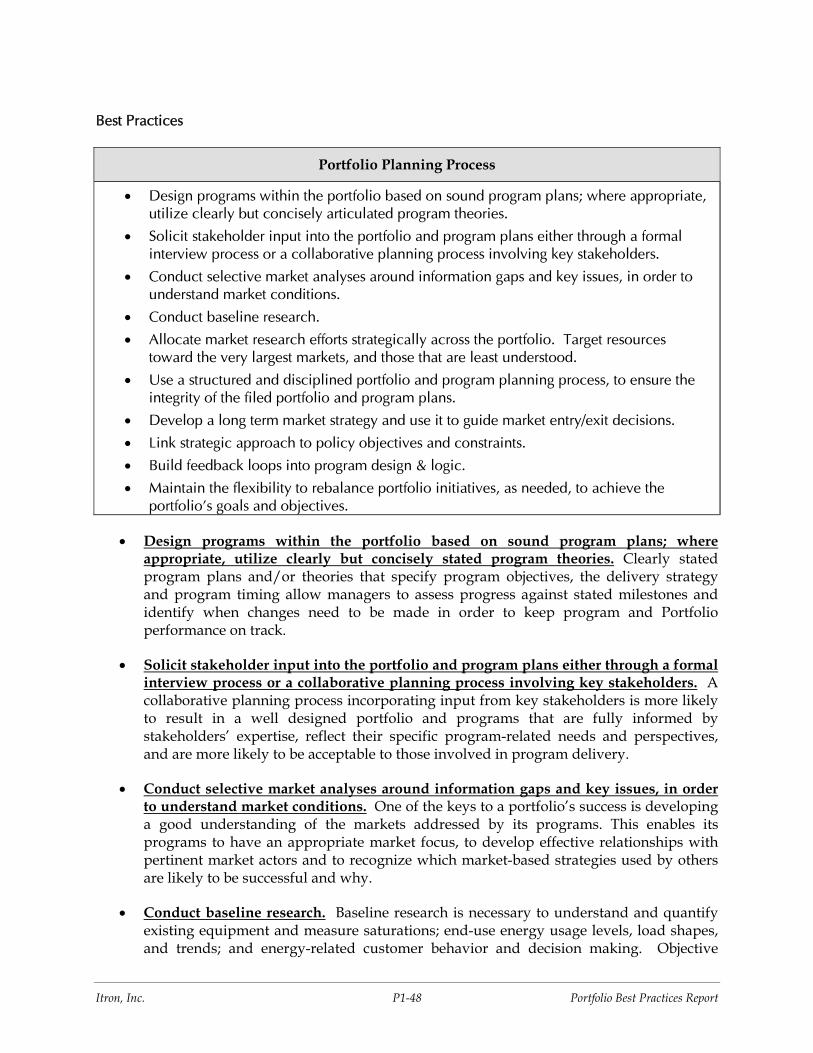
Itron, Inc. P1-48 Portfolio Best Practices Report
Best Practices
Portfolio Planning Process
• Design programs within the portfolio based on sound program plans; where appropriate, utilize clearly but concisely articulated program theories.
• Solicit stakeholder input into the portfolio and program plans either through a formal interview process or a collaborative planning process involving key stakeholders.
• Conduct selective market analyses around information gaps and key issues, in order to understand market conditions.
• Conduct baseline research.
• Allocate market research efforts strategically across the portfolio. Target resources toward the very largest markets, and those that are least understood.
• Use a structured and disciplined portfolio and program planning process, to ensure the integrity of the filed portfolio and program plans.
• Develop a long term market strategy and use it to guide market entry/exit decisions.
• Link strategic approach to policy objectives and constraints.
• Build feedback loops into program design & logic. • Maintain the flexibility to rebalance portfolio initiatives, as needed, to achieve the
portfolio’s goals and objectives.
• Design programs within the portfolio based on sound program plans; where appropriate, utilize clearly but concisely stated program theories. Clearly stated program plans and/or theories that specify program objectives, the delivery strategy and program timing allow managers to assess progress against stated milestones and identify when changes need to be made in order to keep program and Portfolio performance on track.
• Solicit stakeholder input into the portfolio and program plans either through a formal interview process or a collaborative planning process involving key stakeholders. A collaborative planning process incorporating input from key stakeholders is more likely to result in a well designed portfolio and programs that are fully informed by stakeholders’ expertise, reflect their specific program-related needs and perspectives, and are more likely to be acceptable to those involved in program delivery.
• Conduct selective market analyses around information gaps and key issues, in order to understand market conditions. One of the keys to a portfolio’s success is developing a good understanding of the markets addressed by its programs. This enables its programs to have an appropriate market focus, to develop effective relationships with pertinent market actors and to recognize which market-based strategies used by others are likely to be successful and why.
• Conduct baseline research. Baseline research is necessary to understand and quantify existing equipment and measure saturations; end-use energy usage levels, load shapes, and trends; and energy-related customer behavior and decision making. Objective
Itron, Inc. P1-49 Portfolio Best Practices Report
baseline research reinforces the credibility of the portfolio and its underlying programs with diverse stakeholders and improves the accuracy of savings estimates, cost effectiveness calculations, and goals.
• Allocate market research efforts strategically across the portfolio. Target resources toward the very largest markets, and those that are least understood. Focus market research efforts on the very largest portfolio markets and those that are not well understood. These will provide the most value from market research efforts.
• Use a structured and disciplined portfolio and program planning process, to ensure the integrity of the filed portfolio and program plans. A disciplined portfolio and program planning process, which is informed by sound research and consistent application of underlying data, is more likely to result in portfolio and underlying program plans that are internally consistent, defensible and achievable.
• Develop a longer term market strategy and use it to guide market entry/exit decisions. A long-term vision for each market served provides the insight needed to determine effective program approaches, develop market entry and exit strategies and timing decisions, and maintain high-quality relationships with market actors based on trust in the administrator’s decisions. Portfolio and program managers can instill this trust by communicating their long term market vision and demonstrating how it is used to guide short-term program decisions.
• Link strategic approach to policy objectives and constraints. Articulating a program theory and structuring program tactics to be in line with it enables the program administrator to think through the likely outputs and outcomes of the program tactics, potentially improving the likelihood that the strategic approach will lead to the anticipated results. Prioritizing objectives and taking stock of resource constraints helps clarify choices among competing policy and design choices.
• Build feedback loops into program design and logic. Feedback loops assure that program participants continue to provide and receive input throughout program implementation. The effectiveness of such feedback depends on establishing critical metrics of program performance and being sufficiently flexible to respond to feedback.
• Maintain the flexibility to rebalance portfolio initiatives as needed to achieve the portfolio’s goals and objectives. Having the ability to realign programs as needed is critical to being able to effectively manage the portfolio to meet its goals. Management needs to have the leeway to add new programs and program elements, or eliminate or adjust poorly performing existing programs as needed, in order to optimize the portfolio’s performance.
3.2.2 Adaptation to Changes in Technologies and Market Conditions
One of the many challenges facing portfolio and program managers today is the current dynamic environment of constantly changing market conditions as new technologies are released, consumer preferences and lifestyles change, and economic and market conditions vary. Another market force is changes in codes and standards which affects baseline conditions
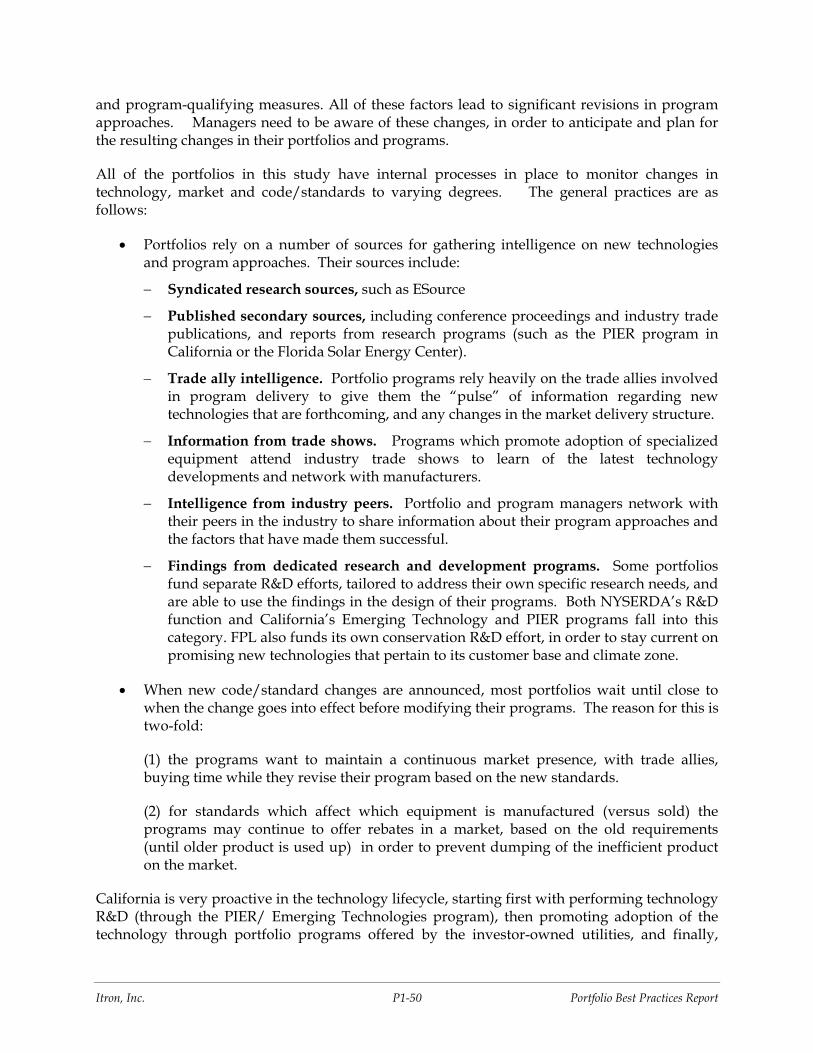
Itron, Inc. P1-50 Portfolio Best Practices Report
and program-qualifying measures. All of these factors lead to significant revisions in program approaches. Managers need to be aware of these changes, in order to anticipate and plan for the resulting changes in their portfolios and programs.
All of the portfolios in this study have internal processes in place to monitor changes in technology, market and code/standards to varying degrees. The general practices are as follows:
• Portfolios rely on a number of sources for gathering intelligence on new technologies and program approaches. Their sources include:
− Syndicated research sources, such as ESource
− Published secondary sources, including conference proceedings and industry trade publications, and reports from research programs (such as the PIER program in California or the Florida Solar Energy Center).
− Trade ally intelligence. Portfolio programs rely heavily on the trade allies involved in program delivery to give them the “pulse” of information regarding new technologies that are forthcoming, and any changes in the market delivery structure.
− Information from trade shows. Programs which promote adoption of specialized equipment attend industry trade shows to learn of the latest technology developments and network with manufacturers.
− Intelligence from industry peers. Portfolio and program managers network with their peers in the industry to share information about their program approaches and the factors that have made them successful.
− Findings from dedicated research and development programs. Some portfolios fund separate R&D efforts, tailored to address their own specific research needs, and are able to use the findings in the design of their programs. Both NYSERDA’s R&D function and California’s Emerging Technology and PIER programs fall into this category. FPL also funds its own conservation R&D effort, in order to stay current on promising new technologies that pertain to its customer base and climate zone.
• When new code/standard changes are announced, most portfolios wait until close to when the change goes into effect before modifying their programs. The reason for this is two-fold:
(1) the programs want to maintain a continuous market presence, with trade allies, buying time while they revise their program based on the new standards.
(2) for standards which affect which equipment is manufactured (versus sold) the programs may continue to offer rebates in a market, based on the old requirements (until older product is used up) in order to prevent dumping of the inefficient product on the market.
California is very proactive in the technology lifecycle, starting first with performing technology R&D (through the PIER/ Emerging Technologies program), then promoting adoption of the technology through portfolio programs offered by the investor-owned utilities, and finally,
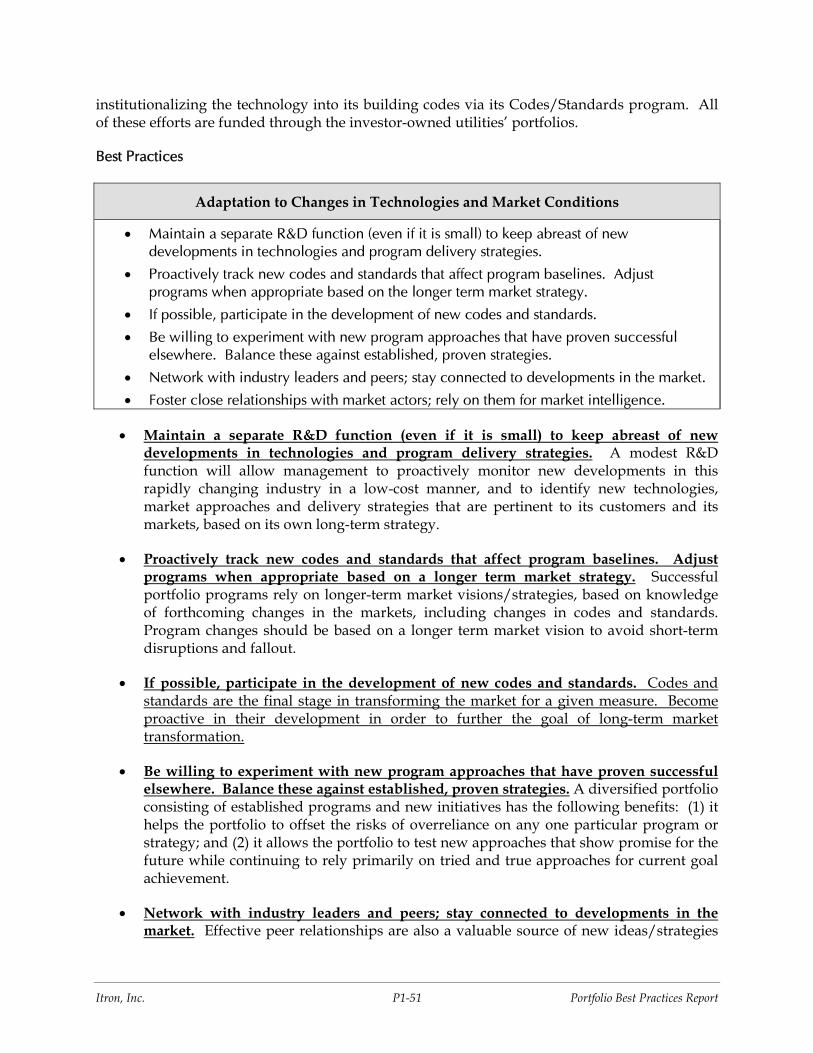
Itron, Inc. P1-51 Portfolio Best Practices Report
institutionalizing the technology into its building codes via its Codes/Standards program. All of these efforts are funded through the investor-owned utilities’ portfolios.
Best Practices
Adaptation to Changes in Technologies and Market Conditions
• Maintain a separate R&D function (even if it is small) to keep abreast of new developments in technologies and program delivery strategies.
• Proactively track new codes and standards that affect program baselines. Adjust programs when appropriate based on the longer term market strategy.
• If possible, participate in the development of new codes and standards.
• Be willing to experiment with new program approaches that have proven successful elsewhere. Balance these against established, proven strategies.
• Network with industry leaders and peers; stay connected to developments in the market.
• Foster close relationships with market actors; rely on them for market intelligence.
• Maintain a separate R&D function (even if it is small) to keep abreast of new developments in technologies and program delivery strategies. A modest R&D function will allow management to proactively monitor new developments in this rapidly changing industry in a low-cost manner, and to identify new technologies, market approaches and delivery strategies that are pertinent to its customers and its markets, based on its own long-term strategy.
• Proactively track new codes and standards that affect program baselines. Adjust programs when appropriate based on a longer term market strategy. Successful portfolio programs rely on longer-term market visions/strategies, based on knowledge of forthcoming changes in the markets, including changes in codes and standards. Program changes should be based on a longer term market vision to avoid short-term disruptions and fallout.
• If possible, participate in the development of new codes and standards. Codes and standards are the final stage in transforming the market for a given measure. Become proactive in their development in order to further the goal of long-term market transformation.
• Be willing to experiment with new program approaches that have proven successful elsewhere. Balance these against established, proven strategies. A diversified portfolio consisting of established programs and new initiatives has the following benefits: (1) it helps the portfolio to offset the risks of overreliance on any one particular program or strategy; and (2) it allows the portfolio to test new approaches that show promise for the future while continuing to rely primarily on tried and true approaches for current goal achievement.
• Network with industry leaders and peers; stay connected to developments in the market. Effective peer relationships are also a valuable source of new ideas/strategies
Itron, Inc. P1-52 Portfolio Best Practices Report
and provide validation of the portfolio's management and delivery approach. These relationships are based on common shared experiences and understanding.
• Foster close relationships with market actors; rely on them for market intelligence. Market actors are an extremely knowledgeable source of street-level information and market intelligence, which are essential to well-designed portfolio programs. Effective relationships with market actors are critical for successful delivery of market–based programs.
3.3 PORTFOLIO MANAGEMENT PRACTICES
Excellent portfolio management practices lead to efficient and cost-effective operations and high-quality results. This study addresses management practices in four key areas:
• Staffing Approach
• Program Integration
• Quality Control and Verification
• Reporting and Tracking
3.3.1 Staffing Approach
Portfolio staffing and human resource practices address the “people” side of the portfolio. Practices fall into two areas – the overall staffing philosophy and approach used by the portfolio, and staff development and retention policies.
3.3.1.1 Staffing Philosophy
This element is concerned with the portfolio’s overall staffing philosophy and its use of in-house staff versus subcontractors to fulfill both portfolio administration and program implementation functions. Portfolio managers have many choices available: they can hire and develop in-house staff to perform portfolio/program functions, they can outsource certain areas to subcontractors, or they can rely on turnkey contractors for all program implementation functions. Some portfolios use a hybrid approach, using in-house staff for some programs, turnkey contractors for others, and/or a combination of in-house staff and subcontractors for still others. None of these approaches is clearly superior to the others.
Often it is practical considerations that dictate a portfolio’s use of in-house staff versus contractors. The need to outsource is driven by such factors as the:
• Urgency of the resource/staffing need. If a quick program start up is required, the administrator may elect to outsource the program to a turnkey contractor to run.
• Type of expertise needed. Subcontractors often have specialized expertise and/or relationships that can be leveraged.
Itron, Inc. P1-53 Portfolio Best Practices Report
• Economics of outsourcing versus hiring additional in‐house staff. In some cases, it may be cheaper for the administrator to hire out program delivery functions rather than hiring internal staff to perform them.
• Administrator’s ability to hire, i.e., they may not be allowed to hire additional staff due to a hiring freeze.
Portfolio managers expressed the following views with respect to their overall philosophy toward hiring versus outsourcing:
• They prefer to use in-house staff to perform portfolio administrative and program management functions.
• If they have the needed expertise in-house, they would prefer to use in-house staff to perform that associated function.
• They tend to outsource under the following conditions:
− Their in-house staff lacks the necessary expertise and/or relationships with market providers
− They need to grow quickly – either to build new capability or expand their existing capability
− To fill gaps caused by internal hiring freezes
• When they do outsource, their first choice is to rely on trusted partners for implementation, preferably those they have known for a long time or who are recognized for their expertise in a given area
Most of the portfolios reviewed in this study use a combination of in-house staff and outside contractors. Exhibit 3-2 summarizes the specific approaches used by each administrator.
Virtually all use contractors when necessary to fill gaps in their own expertise. Two of the portfolio administrators, NYSERDA and the Trust, use a Program Contractor Model, which calls for outsourcing of all program delivery functions to turnkey contractors. The Trust adopted this model initially to facilitate a quick start-up of its programs, and is now re-assessing it to determine whether it is still appropriate. NYSERDA continues to use this approach for some of its programs.
To maximize the contributions made by their own staff versus outside contractors, portfolio administrators need to: use staff and contractors that are well-qualified to perform the work; have clearly drawn lines of responsibility between their own staff and outside contractors; and structure contracts in order to reward high contractors based on known performance metrics.
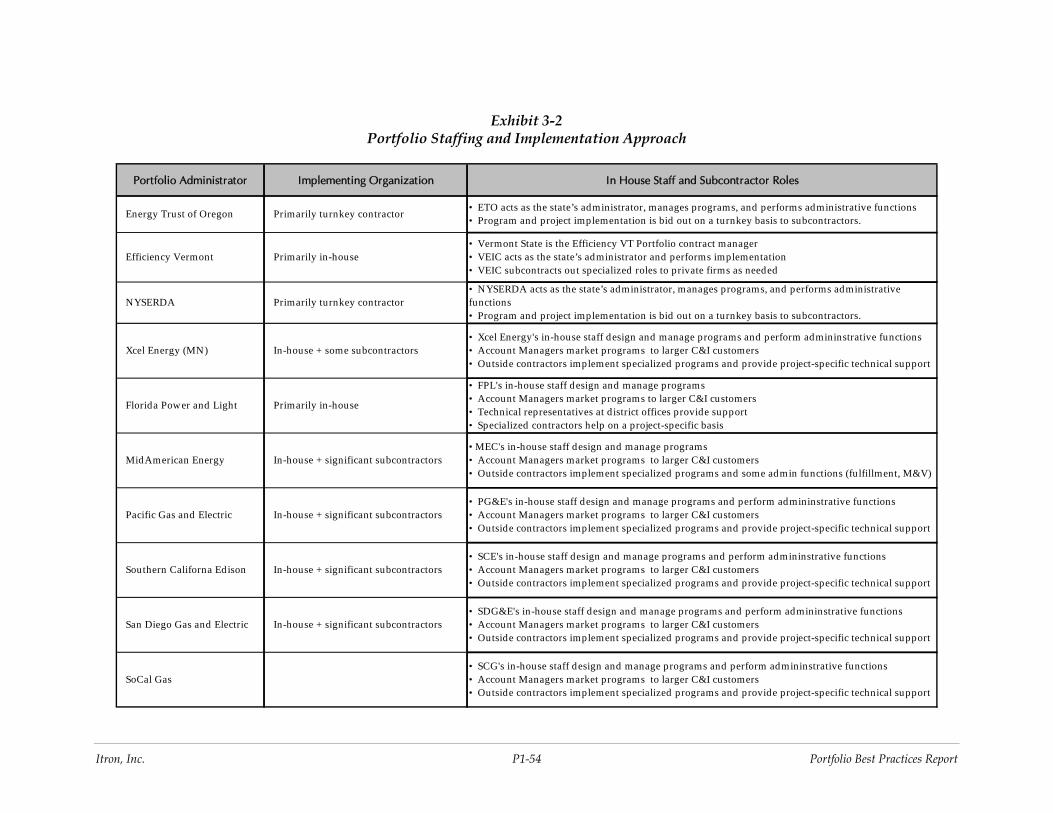
Itron, Inc. P1-54 Portfolio Best Practices Report
Exhibit 3-2 Portfolio Staffing and Implementation Approach
Portfolio Administrator Implementing Organization In House Staff and Subcontractor Roles
Energy Trust of Oregon Primarily turnkey contractor • ETO acts as the state’s administrator, manages programs, and performs administrative functions• Program and project implementation is bid out on a turnkey basis to subcontractors.
Efficiency Vermont Primarily in-house• Vermont State is the Efficiency VT Portfolio contract manager • VEIC acts as the state’s administrator and performs implementation • VEIC subcontracts out specialized roles to private firms as needed
NYSERDA Primarily turnkey contractor• NYSERDA acts as the state’s administrator, manages programs, and performs administrative functions• Program and project implementation is bid out on a turnkey basis to subcontractors.
Xcel Energy (MN) In-house + some subcontractors• Xcel Energy's in-house staff design and manage programs and perform admininstrative functions• Account Managers market programs to larger C&I customers• Outside contractors implement specialized programs and provide project-specific technical support
Florida Power and Light Primarily in-house
• FPL's in-house staff design and manage programs• Account Managers market programs to larger C&I customers• Technical representatives at d istrict offices provide support• Specialized contractors help on a project-specific basis
MidAmerican Energy In-house + significant subcontractors• MEC's in-house staff design and manage programs • Account Managers market programs to larger C&I customers• Outside contractors implement specialized programs and some admin functions (fulfillment, M&V)
Pacific Gas and Electric In-house + significant subcontractors• PG&E's in-house staff design and manage programs and perform admininstrative functions• Account Managers market programs to larger C&I customers• Outside contractors implement specialized programs and provide project-specific technical support
Southern Californa Edison In-house + significant subcontractors• SCE's in-house staff design and manage programs and perform admininstrative functions• Account Managers market programs to larger C&I customers• Outside contractors implement specialized programs and provide project-specific technical support
San Diego Gas and Electric In-house + significant subcontractors• SDG&E's in-house staff design and manage programs and perform admininstrative functions• Account Managers market programs to larger C&I customers• Outside contractors implement specialized programs and provide project-specific technical support
SoCal Gas• SCG's in-house staff design and manage programs and perform admininstrative functions• Account Managers market programs to larger C&I customers• Outside contractors implement specialized programs and provide project-specific technical support
Itron, Inc. P1-55 Portfolio Best Practices Report
3.3.1.2 Staff Development and Retention
It is generally recognized that having talented and motivated staff is a very important element in business operations. Attracting the right kind of staff to support portfolio operations can be difficult, because well-qualified candidates are usually very marketable. Retaining professional staff if they become dissatisfied can also be difficult for the same reasons. Therefore, a major challenge is how to attract, develop and retain staff.
Portfolio managers indicated that the Portfolio’s reputation, corporate culture and human resources practices are all influential in their ability to hire staff initially, motivate them to perform highly, and retain them. With respect to recruitment/hiring, retention and staff development, the following general practices are followed by the portfolios involved in this study:
Recruitment/Hiring
• Administrators recognize that the type of work they oversee is somewhat different from the norm and ideally like to attract staff who:
− Are ideologically aligned with energy efficiency and environmental issues
− Can handle other unusual aspects of this work, such as regulatory issues/challenges.
• They prefer to hire experienced staff who can “hit the ground running”. If applicants with the required expertise are not available, they then recruit and hire entry level staff with the required educational background, and then mentor them.
• In hiring staff, administrators look for those who have the following types of expertise or skills:
− Technical understanding of buildings, technologies, etc.
− New product development
− Budget and contract management
− Marketing and outreach
− Political and regulatory processes
− Critical thinking skills
− Good oral and written communications skills
Retention and Staff Development
• Retention and staff development go hand-in hand. A key to retaining satisfied employees is to continually challenge them in their work, and to offer them opportunities for higher education and upward mobility.
• Administrators develop their employees in various ways:
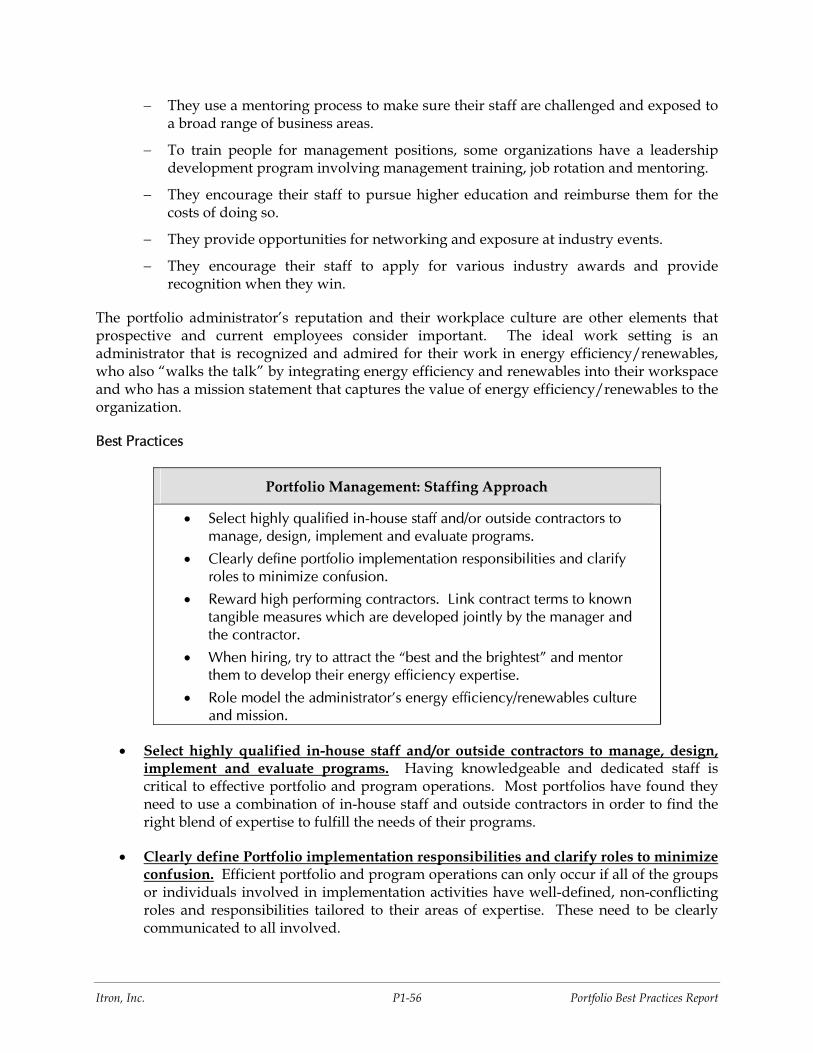
Itron, Inc. P1-56 Portfolio Best Practices Report
− They use a mentoring process to make sure their staff are challenged and exposed to a broad range of business areas.
− To train people for management positions, some organizations have a leadership development program involving management training, job rotation and mentoring.
− They encourage their staff to pursue higher education and reimburse them for the costs of doing so.
− They provide opportunities for networking and exposure at industry events.
− They encourage their staff to apply for various industry awards and provide recognition when they win.
The portfolio administrator’s reputation and their workplace culture are other elements that prospective and current employees consider important. The ideal work setting is an administrator that is recognized and admired for their work in energy efficiency/renewables, who also “walks the talk” by integrating energy efficiency and renewables into their workspace and who has a mission statement that captures the value of energy efficiency/renewables to the organization.
Best Practices
Portfolio Management: Staffing Approach
• Select highly qualified in-house staff and/or outside contractors to manage, design, implement and evaluate programs.
• Clearly define portfolio implementation responsibilities and clarify roles to minimize confusion.
• Reward high performing contractors. Link contract terms to known tangible measures which are developed jointly by the manager and the contractor.
• When hiring, try to attract the “best and the brightest” and mentor them to develop their energy efficiency expertise.
• Role model the administrator's energy efficiency/renewables culture and mission.
• Select highly qualified in-house staff and/or outside contractors to manage, design, implement and evaluate programs. Having knowledgeable and dedicated staff is critical to effective portfolio and program operations. Most portfolios have found they need to use a combination of in-house staff and outside contractors in order to find the right blend of expertise to fulfill the needs of their programs.
• Clearly define Portfolio implementation responsibilities and clarify roles to minimize confusion. Efficient portfolio and program operations can only occur if all of the groups or individuals involved in implementation activities have well-defined, non-conflicting roles and responsibilities tailored to their areas of expertise. These need to be clearly communicated to all involved.
Itron, Inc. P1-57 Portfolio Best Practices Report
• Reward high performing contractors. Link contract terms to known tangible measures which are developed jointly by the manager and the contractor. Contractors will perform better when they clearly understand what is expected of them and they agree that the expectations are reasonable.
• When hiring, try to attract the “best and the brightest” and mentor them to develop their energy efficiency expertise. Hiring staff that are highly intelligent, have high work standards and a strong work ethic is key, even if they are not fully trained in energy efficiency program areas. Equally important is to provide a mentor who can work closely with them to develop their energy efficiency skills and knowledge base.
• Role model the administrator's energy efficiency/renewables culture and mission. An ideal work setting will communicate the administrator's commitment to Portfolio activities and results via their mission statement and daily work culture (i.e., "walk the talk").
3.3.2 Program Integration
End users today have access a large number of programs promoting different types or elements of energy services. In addition to conventional energy efficiency programs, there are demand response programs, renewable energy programs, green pricing, green buildings programs, financing programs and special rate options. There may also be tax credits related to installation of energy efficiency or renewable energy measures. Typically, these are offered by multiple organizations which include the portfolio administrator, electric or gas utilities (who may also administer the portfolio), government agencies, and private sector firms (for financing, these include banks or ESCOs).
For end-users undertaking large, complex projects (such as a whole building retrofit or new construction project), each of these programs or services may provide benefits to their project. The challenge to portfolio administrators is how to package these benefits from multiple programs in a way that is seamless to the end-user.
All of the portfolios involved in this study expressed strong support for providing integrated delivery, simplifying program delivery by combining benefits from multiple programs and simplifying communications using a central point of contact. Administrators see several benefits to integrated delivery of benefits from related programs:
• It is a smarter way to achieve savings; in effect, using one transaction to yield impacts from multiple programs.
• It complements the goal of minimizing lost opportunities by requiring participants to consider all applicable programs and measures when considering their options.
• It makes certain complex projects financially viable, by combining the purchasing power of several different program budgets.
• It provides them another way to “think outside the box”. They see program integration as a necessity for achieving increased savings goals.
Itron, Inc. P1-58 Portfolio Best Practices Report
• Bundling delivery of energy efficiency with demand response offers a way to consider and realize the joint benefits of both types of programs when marketing to end-users.23
Although portfolios see the merits of bundled program delivery, they also realize that this approach is far more complicated than if they simply focus on delivering their own programs. Some of the challenges they face are:
• The logistics of coordinating roles and responsibilities among the many organizations involved
• Differences in program design may make it challenging to fully leverage all program features
• Difficulties in packaging the project, including the incentives and savings contributions from each program
• Liability concerns associated with providing tax advice to program participants
• Savings attribution issues – difficulties in establishing the savings contribution and level of free ridership from each program and measure
• The need to keep communications simple, working through a single point of contact, and consolidating marketing messages, so that the sponsor is not overwhelmed with too much information.
Portfolios’ current integrated program delivery efforts are narrowly focused, and include:
• Using findings from energy audits to “steer” customers towards their other prescriptive equipment programs, and demand response programs
• For large customers’ projects, leveraging the utilities’ assigned account representatives to serve as a single point of contact and program integrator. Part of the account representative’s job is to identify which programs and measures would benefit each of their assigned customers, and to provide referrals to each of the pertinent programs.
• Routinely conducting billing analysis and identifying the lowest-cost rate option for each of their large and medium sized customers. This, in effect, is used to market lower-cost demand response programs to customers who are interested in DR programs.
• Cross-promoting related and complementary programs. For example, the California utilities promote the Self-Generation Incentive Program, the California Solar Initiative and the Climate Change Action Registry, along with their own programs.
23 York and Kushler, 2005, “Exploring the Relationships Between Demand Response and Energy Efficiency: A
Review of Experience and Discussion of Key Issues”, ACEEE.
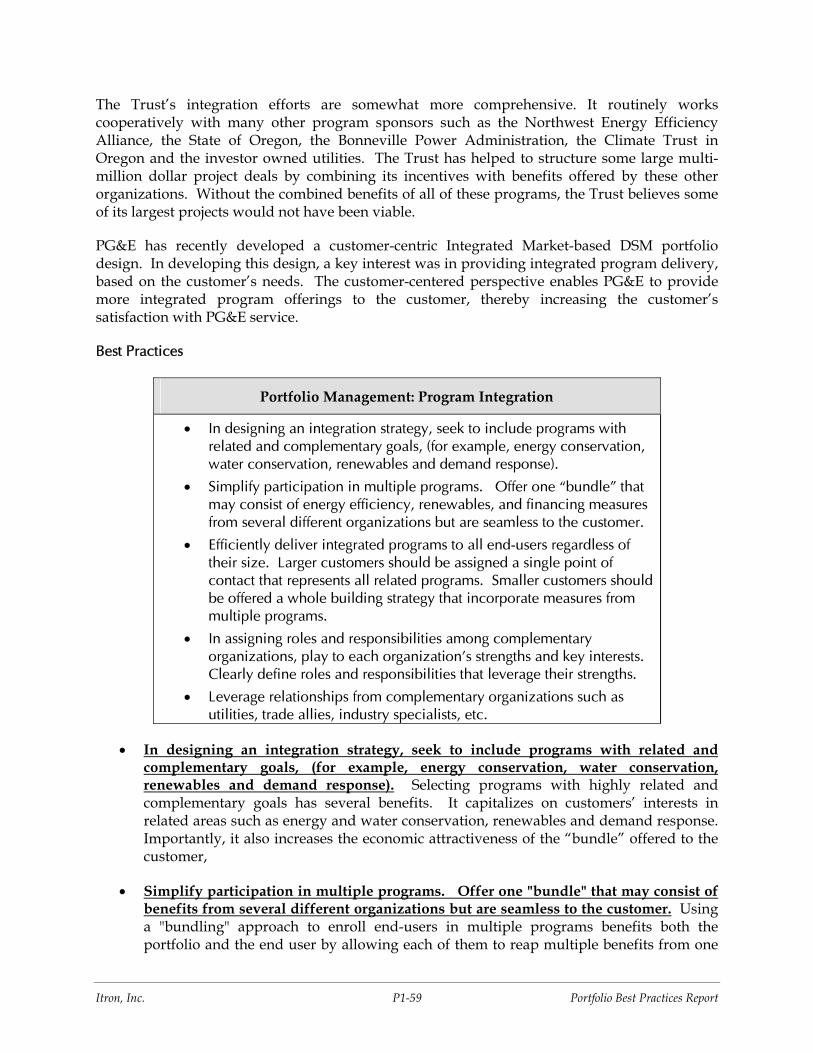
Itron, Inc. P1-59 Portfolio Best Practices Report
The Trust’s integration efforts are somewhat more comprehensive. It routinely works cooperatively with many other program sponsors such as the Northwest Energy Efficiency Alliance, the State of Oregon, the Bonneville Power Administration, the Climate Trust in Oregon and the investor owned utilities. The Trust has helped to structure some large multi-million dollar project deals by combining its incentives with benefits offered by these other organizations. Without the combined benefits of all of these programs, the Trust believes some of its largest projects would not have been viable.
PG&E has recently developed a customer-centric Integrated Market-based DSM portfolio design. In developing this design, a key interest was in providing integrated program delivery, based on the customer’s needs. The customer-centered perspective enables PG&E to provide more integrated program offerings to the customer, thereby increasing the customer’s satisfaction with PG&E service.
Best Practices
Portfolio Management: Program Integration
• In designing an integration strategy, seek to include programs with related and complementary goals, (for example, energy conservation, water conservation, renewables and demand response).
• Simplify participation in multiple programs. Offer one “bundle” that may consist of energy efficiency, renewables, and financing measures from several different organizations but are seamless to the customer.
• Efficiently deliver integrated programs to all end-users regardless of their size. Larger customers should be assigned a single point of contact that represents all related programs. Smaller customers should be offered a whole building strategy that incorporate measures from multiple programs.
• In assigning roles and responsibilities among complementary organizations, play to each organization’s strengths and key interests. Clearly define roles and responsibilities that leverage their strengths.
• Leverage relationships from complementary organizations such as utilities, trade allies, industry specialists, etc.
• In designing an integration strategy, seek to include programs with related and complementary goals, (for example, energy conservation, water conservation, renewables and demand response). Selecting programs with highly related and complementary goals has several benefits. It capitalizes on customers’ interests in related areas such as energy and water conservation, renewables and demand response. Importantly, it also increases the economic attractiveness of the “bundle” offered to the customer,
• Simplify participation in multiple programs. Offer one "bundle" that may consist of benefits from several different organizations but are seamless to the customer. Using a "bundling" approach to enroll end-users in multiple programs benefits both the portfolio and the end user by allowing each of them to reap multiple benefits from one
Itron, Inc. P1-60 Portfolio Best Practices Report
transaction. End-users may be open to participating in more than one program, but only if participation processes can be simplified and consolidated. Portfolios need to bundle program delivery, not only to help participants, but also to successfully close complex projects.
• Efficiently deliver integrated programs to all end-users regardless of their size. Larger customers should be assigned a single point of contact that represents all related programs. Smaller customers should be offered a whole building strategy that incorporate measures from multiple programs. Larger customers usually have an assigned account representative that can serve as a single point of contact. This allows administrators to achieve their goal of simplified communications with the customer by leveraging resources that are already involved. For smaller customers, whole building strategies provide an efficient way to bundle multiple programs’ benefits into one project, and help to minimize lost opportunities.
• In assigning roles and responsibilities among complementary organizations, play to each organization’s strengths and key interests. Clearly define roles and responsibilities that leverage their strengths. Capitalizing on the strengths of each delivery organization benefits the Portfolio's programs by allowing it to tap into resources that are ideally-suited to support the program.
• Leverage relationships that have been developed through other organizations such as utilities, trade allies, industry specialists, etc. Stakeholders such as utilities, market actors, industry specialists, etc. represent a large body of knowledge and expertise that is available to the Portfolio's programs at no cost. In addition, many of these stakeholders are willing to promote the Portfolio's programs as part of the equipment sales or other transactions that they are involved in.
3.3.3 Quality Control and Verification
Good M&V and quality control practices are necessary for a successful portfolio. However, designing an affordable yet effective approach is a challenge for many. Finding the right balance of M&V and quality control activities must be considered within the context of the portfolio’s policy goals. The current verification and quality control approaches used by the portfolios in this study are summarized below. Evaluation issues and best practices are elaborated upon in a later section of this report.
Verification. All portfolios reviewed in this study use some form of verification process, based on a random sample of projects (for small and medium-size projects) or a complete census (for the very largest projects). The level of detail and rigor involved depends on the size and complexity of projects. The larger, more complex projects receive a greater level of scrutiny than smaller projects involving prescriptive measures. Some administrators use utility staff to perform verification for the largest projects. For example, Xcel-MN requires its account managers to do a quick visual check of installed equipment for their assigned customers. In addition to their own verification activities, most administrators require their turnkey program contractors to do in-program verification.
In addition, at least one organization uses computer-based verification for one of its programs. Xcel-MN’s direct load control program uses a protocol to remotely check control equipment

Itron, Inc. P1-61 Portfolio Best Practices Report
(using AMI metered data) and verify it is still working. They then follow up on the equipment found to be defective based on the data.
Exhibit 3-3 below describes the specific verification practices used by each portfolio.
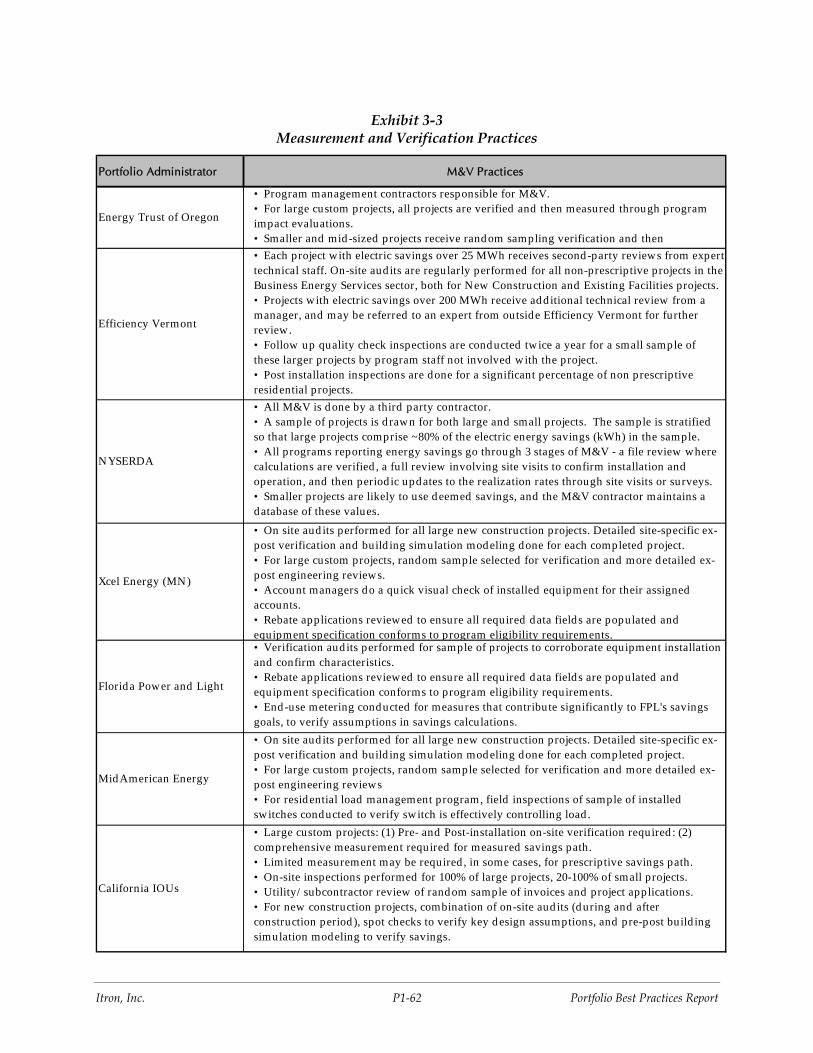
Itron, Inc. P1-62 Portfolio Best Practices Report
Exhibit 3-3 Measurement and Verification Practices
Portfolio Administrator M&V Practices
Energy Trust of Oregon
• Program management contractors responsible for M&V.• For large custom projects, all projects are verified and then measured through program impact evaluations.• Smaller and mid-sized projects receive rand om sampling verification and then
Efficiency Vermont
• Each project w ith electric savings over 25 MWh receives second-party reviews from expert technical staff. On-site aud its are regularly performed for all non-prescriptive projects in the Business Energy Services sector, both for New Construction and Existing Facilities projects. • Projects w ith electric savings over 200 MWh receive ad d itional technical review from a manager, and may be referred to an expert from outside Efficiency Vermont for further review.• Follow up quality check inspections are cond ucted tw ice a year for a small sample of these larger projects by program staff not involved with the project.• Post installation inspections are done for a significant percentage of non prescriptive residential projects.
NYSERDA
• All M&V is d one by a third party contractor.• A sample of projects is d rawn for both large and small projects. The sample is stratified so that large projects comprise ~80% of the electric energy savings (kWh) in the sample. • All programs reporting energy savings go through 3 stages of M&V - a file review where calculations are verified , a full review involving site visits to confirm installation and operation, and then period ic updates to the realization rates through site visits or surveys.• Smaller projects are likely to use d eemed savings, and the M&V contractor maintains a database of these values.
Xcel Energy (MN)
• On site aud its performed for all large new construction projects. Detailed site-specific ex-post verification and build ing simulation mod eling done for each completed project. • For large custom projects, random sample selected for verification and more detailed ex-post engineering reviews.• Account managers do a quick visual check of installed equipment for their assigned accounts.• Rebate applications reviewed to ensure all required data fields are populated and equipment specification conforms to program eligibility requirements.
Florida Power and Light
• Verification aud its performed for sample of projects to corroborate equipment installation and confirm characteristics.• Rebate applications reviewed to ensure all required data fields are populated and equipment specification conforms to program eligibility requirements.• End -use metering conducted for measures that contribute significantly to FPL's savings goals, to verify assumptions in savings calculations.
MidAmerican Energy
• On site aud its performed for all large new construction projects. Detailed site-specific ex-post verification and build ing simulation mod eling done for each completed project. • For large custom projects, random sample selected for verification and more detailed ex-post engineering reviews• For resid ential load management program, field inspections of sample of installed switches conducted to verify switch is effectively controlling load .
California IOUs
• Large custom projects: (1) Pre- and Post-installation on-site verification required : (2) comprehensive measurement required for measured savings path.• Limited measurement may be required , in some cases, for prescrip tive savings path.• On-site inspections performed for 100% of large projects, 20-100% of small projects.• Utility/ subcontractor review of rand om sample of invoices and project applications.• For new construction projects, combination of on-site aud its (d uring and after construction period ), spot checks to verify key d esign assumptions, and pre-post build ing simulation modeling to verify savings.
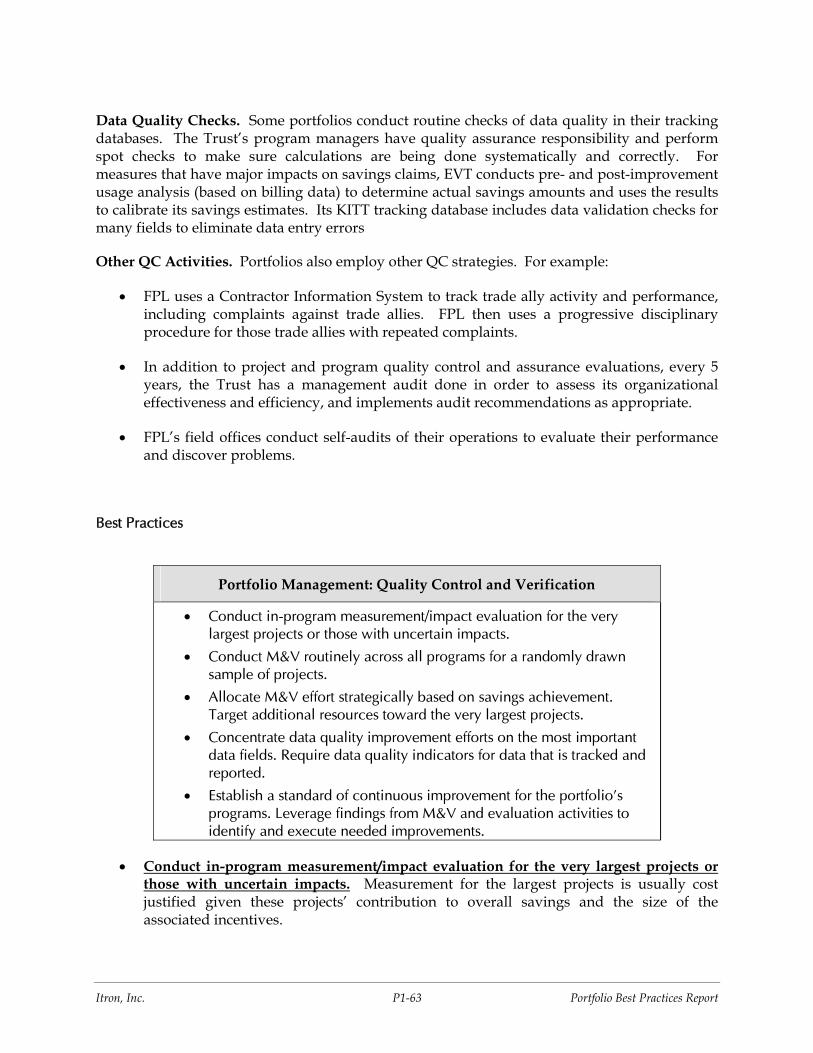
Itron, Inc. P1-63 Portfolio Best Practices Report
Data Quality Checks. Some portfolios conduct routine checks of data quality in their tracking databases. The Trust’s program managers have quality assurance responsibility and perform spot checks to make sure calculations are being done systematically and correctly. For measures that have major impacts on savings claims, EVT conducts pre- and post-improvement usage analysis (based on billing data) to determine actual savings amounts and uses the results to calibrate its savings estimates. Its KITT tracking database includes data validation checks for many fields to eliminate data entry errors
Other QC Activities. Portfolios also employ other QC strategies. For example:
• FPL uses a Contractor Information System to track trade ally activity and performance, including complaints against trade allies. FPL then uses a progressive disciplinary procedure for those trade allies with repeated complaints.
• In addition to project and program quality control and assurance evaluations, every 5 years, the Trust has a management audit done in order to assess its organizational effectiveness and efficiency, and implements audit recommendations as appropriate.
• FPL’s field offices conduct self-audits of their operations to evaluate their performance and discover problems.
Best Practices
Portfolio Management: Quality Control and Verification
• Conduct in-program measurement/impact evaluation for the very largest projects or those with uncertain impacts.
• Conduct M&V routinely across all programs for a randomly drawn sample of projects.
• Allocate M&V effort strategically based on savings achievement. Target additional resources toward the very largest projects.
• Concentrate data quality improvement efforts on the most important data fields. Require data quality indicators for data that is tracked and reported.
• Establish a standard of continuous improvement for the portfolio’s programs. Leverage findings from M&V and evaluation activities to identify and execute needed improvements.
• Conduct in-program measurement/impact evaluation for the very largest projects or those with uncertain impacts. Measurement for the largest projects is usually cost justified given these projects’ contribution to overall savings and the size of the associated incentives.
Itron, Inc. P1-64 Portfolio Best Practices Report
• Conduct M&V routinely across all programs for a randomly drawn sample of projects. M&V, based on a randomly drawn sample of projects, provides valuable information on installation verification, installation quality, hours of operation and other parameters that can be used to improve program designs.
• Allocate M&V effort strategically based on savings achievement. Target additional resources toward the very largest measure categories, programs and projects. Focus M&V efforts on the very largest sources of portfolio savings - the largest measure categories, programs, or projects. These will provide the largest "bang for the buck" for M&V efforts.
• Concentrate data quality improvement efforts on the most important data fields. Require data quality indicators for data that is tracked and reported. The 80/20 rule: focus improvement efforts on data that carry the most weight in savings algorithms or calculations and/or are of the poorest quality. These will have the greatest impact on improving the quality and accuracy of savings estimates.
• Establish a standard of continuous improvement for the portfolio and its programs. Leverage findings from M&V and evaluation activities to identify and execute needed improvements. M&V findings support the portfolio’s continuous improvement efforts by providing important feedback on areas where results are off--track and improvement is needed. The portfolio administrator can then take corrective actions to address these weaknesses.
3.3.4 Reporting and Tracking
Efficient, accurate and timely tracking and reporting are important for portfolio operations, because they allow managers to monitor performance against objectives, and fine-tune programs or reallocate resource as needed when goals are not being met. Tracking databases perform the following functions, each of which is essential to effective portfolio operations:
• They provide documentation of portfolio and program projects and activities that lead to achievement of the portfolio’s objectives. In essence, they provide proof of what was accomplished for the money that was spent.
• They serve as an important portfolio and program management tool, allowing the portfolio and program managers to:
− track progress towards achieving quantitative Portfolio and program objectives
− monitor the pipeline of identified and committed projects
− understand where savings have come from – which technologies, market segments, etc.
• They provide valuable information to support the marketing function, such as project leads, a contact management system, a history of prior participation, etc.;
• They also provide data to support the evaluation, audit and quality control functions.
Itron, Inc. P1-65 Portfolio Best Practices Report
Newer tracking and reporting systems take advantage of advanced computer technology. Many of the newer systems are internet-based, and can be accessed by all key stakeholders involved in the portfolio’s programs, including program staff, subcontractors, and trade allies. Routine functions such as reporting, financial tracking and check disbursement are typically automated. Some databases can track and report results on a near-real time basis. Several also have electronic program application forms, which are accessible by program staff, trade allies, and participants.
The portfolio administrators in this study use both older and newer tracking and reporting systems. In general, utility administrators tend to use older databases, while non-utility administrators have newer internet- based systems. Two of the non-utility administrators, the Trust and EVT, have newer, highly sophisticated databases which are internet-based and have near-real time reporting of results, automated financial functions, and electronic program application forms. The third non-utility administrator, NYSERDA, uses an older system, but is in the process of developing an electronic project application portal that will allow auto-population of some fields. NYSERDA is working on a new database that is intended to combine the functions of finance, contracting, and project tracking for all of its programs, and for specific projects. It will centralize all of the independent spreadsheets that contractors are currently using. They estimate that it will take another 2 years to complete.
Exhibit 3-4 provides an overview of reporting and tracking functions used by each Portfolio.
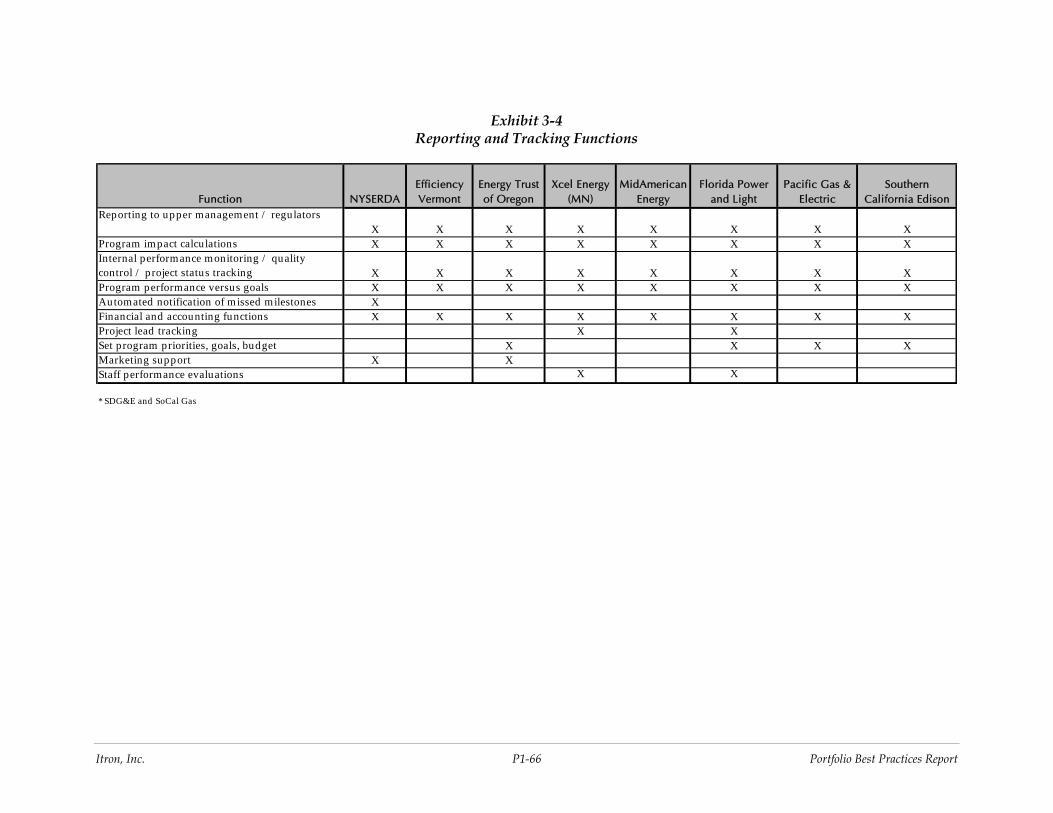
Itron, Inc. P1-66 Portfolio Best Practices Report
Exhibit 3-4 Reporting and Tracking Functions
Function NYSERDAEfficiency Vermont
Energy Trust of Oregon
Xcel Energy (MN)
MidAmerican Energy
Florida Power and Light
Pacific Gas & Electric
Southern California Edison
Reporting to upper management / regulatorsX X X X X X X X
Program impact calculations X X X X X X X XInternal performance monitoring / quality control / p roject status tracking X X X X X X X XProgram performance versus goals X X X X X X X XAutomated notification of missed milestones XFinancial and accounting functions X X X X X X X XProject lead tracking X XSet program priorities, goals, budget X X X XMarketing support X XStaff performance evaluations X X
* SDG&E and SoCal Gas
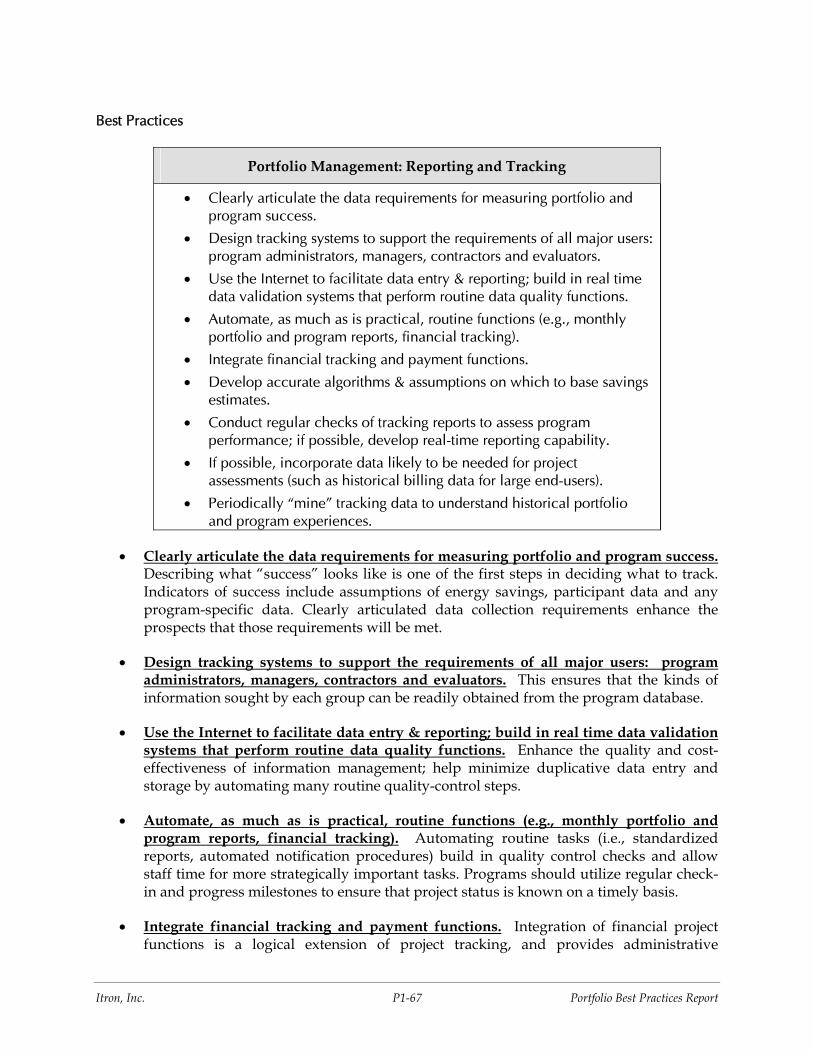
Itron, Inc. P1-67 Portfolio Best Practices Report
Best Practices
Portfolio Management: Reporting and Tracking
• Clearly articulate the data requirements for measuring portfolio and program success.
• Design tracking systems to support the requirements of all major users: program administrators, managers, contractors and evaluators.
• Use the Internet to facilitate data entry & reporting; build in real time data validation systems that perform routine data quality functions.
• Automate, as much as is practical, routine functions (e.g., monthly portfolio and program reports, financial tracking).
• Integrate financial tracking and payment functions.
• Develop accurate algorithms & assumptions on which to base savings estimates.
• Conduct regular checks of tracking reports to assess program performance; if possible, develop real-time reporting capability.
• If possible, incorporate data likely to be needed for project assessments (such as historical billing data for large end-users).
• Periodically “mine” tracking data to understand historical portfolio and program experiences.
• Clearly articulate the data requirements for measuring portfolio and program success. Describing what “success” looks like is one of the first steps in deciding what to track. Indicators of success include assumptions of energy savings, participant data and any program-specific data. Clearly articulated data collection requirements enhance the prospects that those requirements will be met.
• Design tracking systems to support the requirements of all major users: program administrators, managers, contractors and evaluators. This ensures that the kinds of information sought by each group can be readily obtained from the program database.
• Use the Internet to facilitate data entry & reporting; build in real time data validation systems that perform routine data quality functions. Enhance the quality and cost-effectiveness of information management; help minimize duplicative data entry and storage by automating many routine quality-control steps.
• Automate, as much as is practical, routine functions (e.g., monthly portfolio and program reports, financial tracking). Automating routine tasks (i.e., standardized reports, automated notification procedures) build in quality control checks and allow staff time for more strategically important tasks. Programs should utilize regular check-in and progress milestones to ensure that project status is known on a timely basis.
• Integrate financial tracking and payment functions. Integration of financial project functions is a logical extension of project tracking, and provides administrative
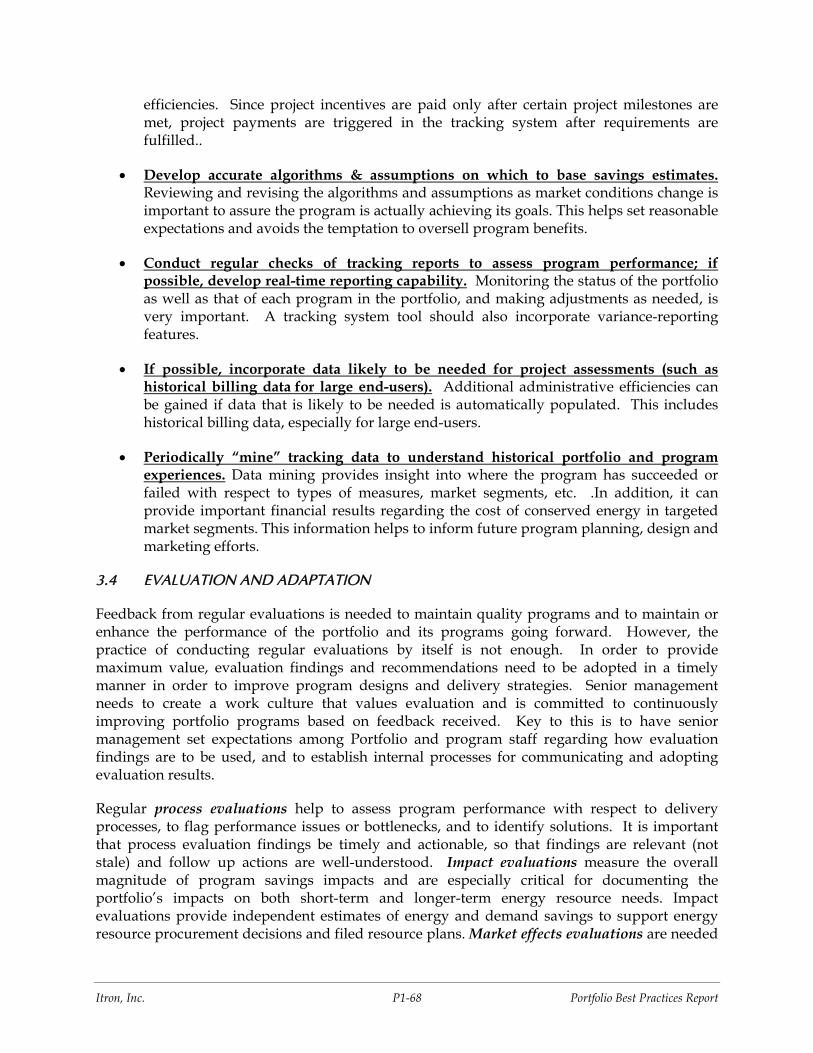
Itron, Inc. P1-68 Portfolio Best Practices Report
efficiencies. Since project incentives are paid only after certain project milestones are met, project payments are triggered in the tracking system after requirements are fulfilled..
• Develop accurate algorithms & assumptions on which to base savings estimates. Reviewing and revising the algorithms and assumptions as market conditions change is important to assure the program is actually achieving its goals. This helps set reasonable expectations and avoids the temptation to oversell program benefits.
• Conduct regular checks of tracking reports to assess program performance; if possible, develop real-time reporting capability. Monitoring the status of the portfolio as well as that of each program in the portfolio, and making adjustments as needed, is very important. A tracking system tool should also incorporate variance-reporting features.
• If possible, incorporate data likely to be needed for project assessments (such as historical billing data for large end-users). Additional administrative efficiencies can be gained if data that is likely to be needed is automatically populated. This includes historical billing data, especially for large end-users.
• Periodically “mine” tracking data to understand historical portfolio and program experiences. Data mining provides insight into where the program has succeeded or failed with respect to types of measures, market segments, etc. .In addition, it can provide important financial results regarding the cost of conserved energy in targeted market segments. This information helps to inform future program planning, design and marketing efforts.
3.4 EVALUATION AND ADAPTATION
Feedback from regular evaluations is needed to maintain quality programs and to maintain or enhance the performance of the portfolio and its programs going forward. However, the practice of conducting regular evaluations by itself is not enough. In order to provide maximum value, evaluation findings and recommendations need to be adopted in a timely manner in order to improve program designs and delivery strategies. Senior management needs to create a work culture that values evaluation and is committed to continuously improving portfolio programs based on feedback received. Key to this is to have senior management set expectations among Portfolio and program staff regarding how evaluation findings are to be used, and to establish internal processes for communicating and adopting evaluation results.
Regular process evaluations help to assess program performance with respect to delivery processes, to flag performance issues or bottlenecks, and to identify solutions. It is important that process evaluation findings be timely and actionable, so that findings are relevant (not stale) and follow up actions are well-understood. Impact evaluations measure the overall magnitude of program savings impacts and are especially critical for documenting the portfolio’s impacts on both short-term and longer-term energy resource needs. Impact evaluations provide independent estimates of energy and demand savings to support energy resource procurement decisions and filed resource plans. Market effects evaluations are needed
Itron, Inc. P1-69 Portfolio Best Practices Report
for programs with a market focus in order to understand how the targeted market has matured based on various metrics such as product price trends and free ridership levels, This information is needed to inform the program design going forward – incentive strategy, exit strategy, etc.
The portfolios involved in this study conduct regular and comprehensive evaluations as a rule. Most portfolios conduct comprehensive evaluation studies at least every two to three years, involving process, impact and, in some cases market effects components. These studies follow standard evaluation practices with respect to sample design, the types of analysis conducted for each market area (e.g., engineering analysis, billing analysis), and the methods used to assess free ridership. Exhibit 3-5 summarizes evaluation practices for each of the nine portfolios reviewed.
Some examples of the more unique elements of the evaluation approaches used by the Portfolios in this study are:
• NYSERDA’s Portfolio approach to evaluation. Rather than routinely conducting comprehensive assessments of each program, NYSERDA uses specialized teams that provide evaluation services to its entire program portfolio. The areas of specialization are: M&V (includes impact evaluation); Market Characterization, Assessment and Causality; Program Theory and Logic; and Process Evaluation. In 2005, NYSERDA also evaluated its own evaluation process to determine its effectiveness and identify improvements.
• FPL’s collaborative evaluation process. FPL’s portfolio management encourages a high degree of collaboration between evaluation and program staff. Evaluation findings are formally presented to each program manager and feedback is obtained. In addition, program staff members provide regular input into the overall research and evaluation process.
• The Trust’s management audits. The Trust’s evaluation function includes periodic management audits to assess the effectiveness of its portfolio management and administrative functions. There is a formal process in place to ensure recommendations are adopted soon after the audit is completed.
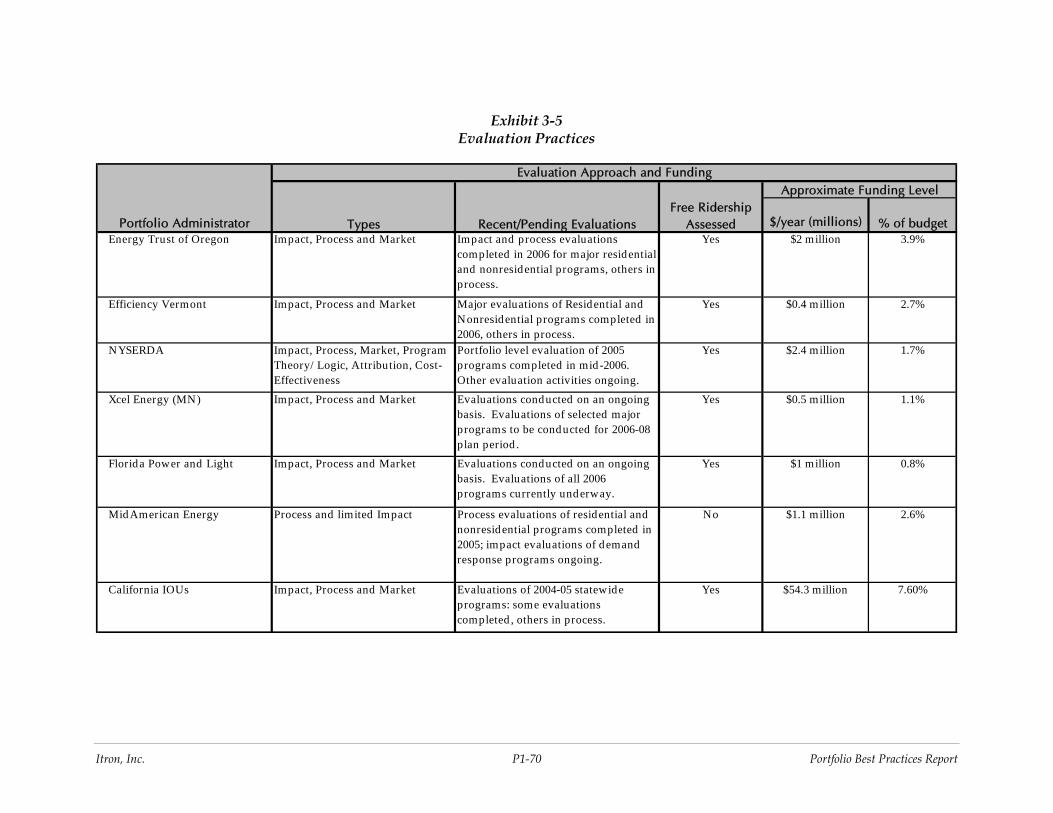
Itron, Inc. P1-70 Portfolio Best Practices Report
Exhibit 3-5 Evaluation Practices
$/year (millions) % of budgetEnergy Trust of Oregon Impact, Process and Market Impact and process evaluations
completed in 2006 for major residential and nonresidential programs, others in process.
Yes $2 million 3.9%
Efficiency Vermont Impact, Process and Market Major evaluations of Residential and Nonresidential programs completed in 2006, others in process.
Yes $0.4 million 2.7%
NYSERDA Impact, Process, Market, Program Theory/ Logic, Attribution, Cost-Effectiveness
Portfolio level evaluation of 2005 programs completed in mid -2006. Other evaluation activities ongoing.
Yes $2.4 million 1.7%
Xcel Energy (MN) Impact, Process and Market Evaluations conducted on an ongoing basis. Evaluations of selected major programs to be conducted for 2006-08 plan period .
Yes $0.5 million 1.1%
Florida Power and Light Impact, Process and Market Evaluations conducted on an ongoing basis. Evaluations of all 2006 programs currently underway.
Yes $1 million 0.8%
MidAmerican Energy Process and limited Impact Process evaluations of residential and nonresidential programs completed in 2005; impact evaluations of demand response programs ongoing.
No $1.1 million 2.6%
California IOUs Impact, Process and Market Evaluations of 2004-05 statewide programs: some evaluations completed , others in process.
Yes $54.3 million 7.60%
Portfolio Administrator
Evaluation Approach and FundingApproximate Funding Level
Types Recent/Pending EvaluationsFree Ridership
Assessed
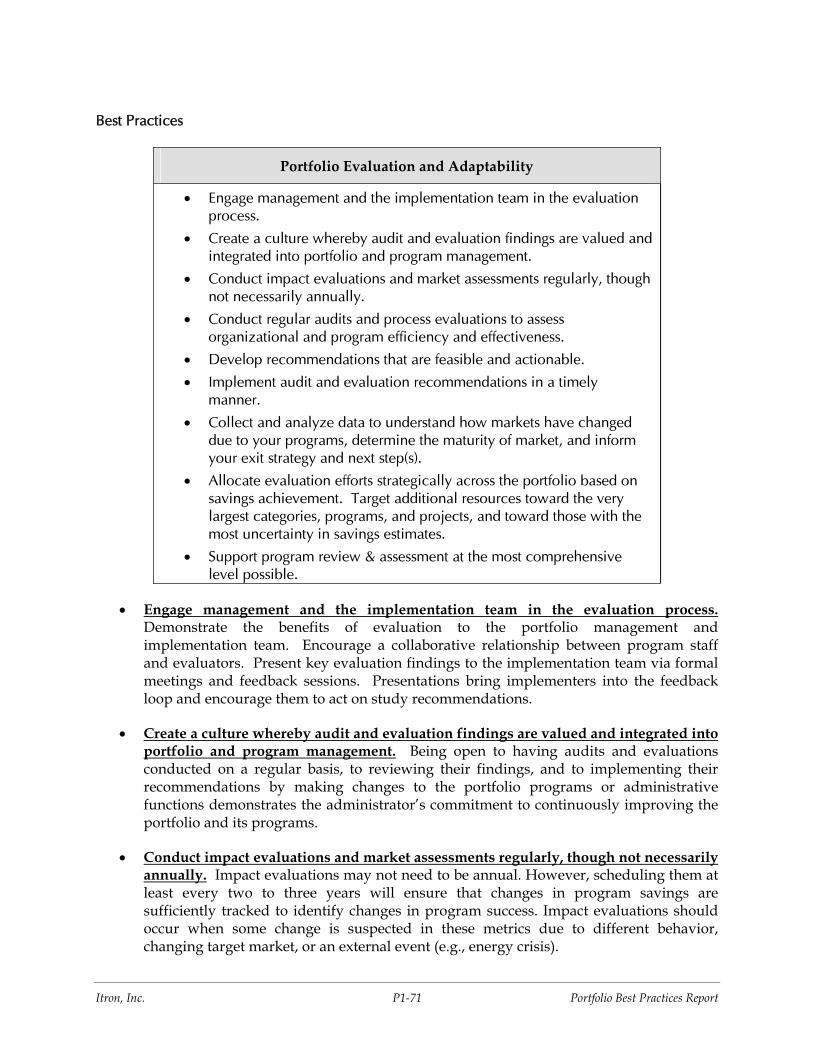
Itron, Inc. P1-71 Portfolio Best Practices Report
Best Practices
Portfolio Evaluation and Adaptability
• Engage management and the implementation team in the evaluation process.
• Create a culture whereby audit and evaluation findings are valued and integrated into portfolio and program management.
• Conduct impact evaluations and market assessments regularly, though not necessarily annually.
• Conduct regular audits and process evaluations to assess organizational and program efficiency and effectiveness.
• Develop recommendations that are feasible and actionable.
• Implement audit and evaluation recommendations in a timely manner.
• Collect and analyze data to understand how markets have changed due to your programs, determine the maturity of market, and inform your exit strategy and next step(s).
• Allocate evaluation efforts strategically across the portfolio based on savings achievement. Target additional resources toward the very largest categories, programs, and projects, and toward those with the most uncertainty in savings estimates.
• Support program review & assessment at the most comprehensive level possible.
• Engage management and the implementation team in the evaluation process. Demonstrate the benefits of evaluation to the portfolio management and implementation team. Encourage a collaborative relationship between program staff and evaluators. Present key evaluation findings to the implementation team via formal meetings and feedback sessions. Presentations bring implementers into the feedback loop and encourage them to act on study recommendations.
• Create a culture whereby audit and evaluation findings are valued and integrated into portfolio and program management. Being open to having audits and evaluations conducted on a regular basis, to reviewing their findings, and to implementing their recommendations by making changes to the portfolio programs or administrative functions demonstrates the administrator’s commitment to continuously improving the portfolio and its programs.
• Conduct impact evaluations and market assessments regularly, though not necessarily annually. Impact evaluations may not need to be annual. However, scheduling them at least every two to three years will ensure that changes in program savings are sufficiently tracked to identify changes in program success. Impact evaluations should occur when some change is suspected in these metrics due to different behavior, changing target market, or an external event (e.g., energy crisis).
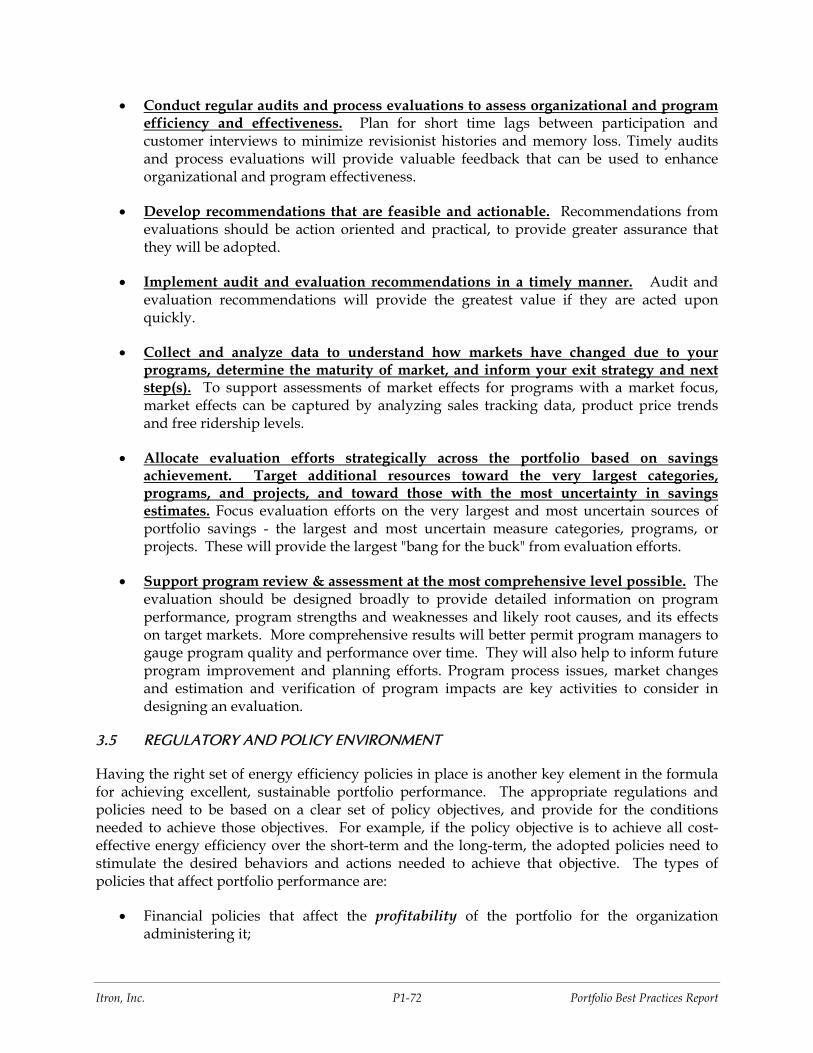
Itron, Inc. P1-72 Portfolio Best Practices Report
• Conduct regular audits and process evaluations to assess organizational and program efficiency and effectiveness. Plan for short time lags between participation and customer interviews to minimize revisionist histories and memory loss. Timely audits and process evaluations will provide valuable feedback that can be used to enhance organizational and program effectiveness.
• Develop recommendations that are feasible and actionable. Recommendations from evaluations should be action oriented and practical, to provide greater assurance that they will be adopted.
• Implement audit and evaluation recommendations in a timely manner. Audit and evaluation recommendations will provide the greatest value if they are acted upon quickly.
• Collect and analyze data to understand how markets have changed due to your programs, determine the maturity of market, and inform your exit strategy and next step(s). To support assessments of market effects for programs with a market focus, market effects can be captured by analyzing sales tracking data, product price trends and free ridership levels.
• Allocate evaluation efforts strategically across the portfolio based on savings achievement. Target additional resources toward the very largest categories, programs, and projects, and toward those with the most uncertainty in savings estimates. Focus evaluation efforts on the very largest and most uncertain sources of portfolio savings - the largest and most uncertain measure categories, programs, or projects. These will provide the largest "bang for the buck" from evaluation efforts.
• Support program review & assessment at the most comprehensive level possible. The evaluation should be designed broadly to provide detailed information on program performance, program strengths and weaknesses and likely root causes, and its effects on target markets. More comprehensive results will better permit program managers to gauge program quality and performance over time. They will also help to inform future program improvement and planning efforts. Program process issues, market changes and estimation and verification of program impacts are key activities to consider in designing an evaluation.
3.5 REGULATORY AND POLICY ENVIRONMENT
Having the right set of energy efficiency policies in place is another key element in the formula for achieving excellent, sustainable portfolio performance. The appropriate regulations and policies need to be based on a clear set of policy objectives, and provide for the conditions needed to achieve those objectives. For example, if the policy objective is to achieve all cost-effective energy efficiency over the short-term and the long-term, the adopted policies need to stimulate the desired behaviors and actions needed to achieve that objective. The types of policies that affect portfolio performance are:
• Financial policies that affect the profitability of the portfolio for the organization administering it;
Itron, Inc. P1-73 Portfolio Best Practices Report
• Resource planning policies that dictate the priority given to cost-effective portfolio savings in energy resource procurement and planning decisions.
• Avoided costing and cost-effectiveness policies that address the valuation of portfolio programs/measures and other supply-side resource options.
• The adequacy and stability of funding for portfolio activities.
Each of these will be discussed in this section.
3.5.1 Alignment with Organizational Strategic and Financial Goals
Desirable financial policies are those that align the portfolio administrator’s profit motives with the implementation of cost-effective portfolio programs as part of a balanced mix of energy resources. The most favorable set of financial policies are those which support the acquisition of all cost effective energy efficiency. A key goal is to provide an earnings opportunity for portfolio resources that is comparable to that for supply-side investments. In addition to leveling the playing field between demand-side and supply-side investments, favorable financial policies also gain senior management’s attention by providing the tools they need to demonstrate the full financial value of portfolio programs to employees and shareholders.
The most desirable financial policy approach is one that:
• Completely removes any disincentives for the energy provider that may result from reduced sales and associated profit margin
• Provides a comparable earnings opportunity for portfolio resources to that for investments in supply-side infrastructure
• Provides full and timely recovery of portfolio costs
Although the link between financial alignment tools and effective implementation of energy efficiency programs has long been understood, it is only recently that several prominent organizations have joined the Natural Resources Defense Council (NRDC) in lobbying for the adoption of financial alignment policies and tools as a part of the toolkit for effective energy efficiency deployment. NRDC has championed the establishment of appropriate financial alignment tools, particularly decoupling and financial incentive mechanisms for over a decade, based on their belief that “getting the incentives right” is a necessary to pre-condition to motivate energy efficiency providers to excel. In the past year, other organizations, notably ACEEE, the Regulatory Assistance Project, and EPA are now making similar arguments in various studies that advocate the adoption of decoupling and financial incentive mechanisms. The EPA’s National Action Plan for Energy Efficiency calls for their enactment as part of “a call to action to utilities, state utility regulators, consumer advocates, consumers, businesses, other state officials, and other stakeholders to create an aggressive, sustainable national commitment to energy efficiency.”
Itron, Inc. P1-74 Portfolio Best Practices Report
Removing Disincentives from Reduced Sales and Profits24. The appropriate policy response is one that makes the utility “whole” for erosion of earnings due to reduced sales from energy efficiency programs. This can be done most effectively through adoption of a decoupling mechanism which breaks the link between sales and profits so that the utility’s profit level is not influenced by fluctuations in its sales.
Decoupling mechanisms were fairly widely used up until the mid 1990s, but were discontinued after energy markets began to restructure. The general belief was that energy resource management decisions would be transferred to unregulated energy market providers, and that utility energy efficiency incentives were no longer relevant. California reinstated decoupling mechanisms for all of the IOUs after the 2001 Energy Crisis, when it reaffirmed the need to have utilities play a strong role in energy resource planning and procurement.
In addition to California, several other states have either adopted a decoupling mechanism, or are actively considering whether to adopt one. At present, there is a great deal of interest in the adoption of natural gas decoupling mechanisms on the part of the natural gas industry, and there are 25 states who have either adopted a decoupling mechanism, or are actively considering one.. On the electric side, Idaho, New York Connecticut and Vermont have recently adopted decoupling mechanisms. At least nine other states have seen major electric decoupling proposals this year: Delaware, Hawaii, Maryland, Massachusetts, Minnesota, New Hampshire, New Jersey, New Mexico, and Wisconsin. .
Other states have procedures in place to compensate for lost revenues as part of the rate case process. For example, some estimate lost revenues and associated profit margins using statistical methods and make an annual adjustment to earnings to compensate for them. However, because these approaches do not break the link between sales and profits, they are not as effective as decoupling mechanisms for achieving the policy goal of removing the financial disincentive to reduced sales.
Providing Comparable Earnings Opportunity to that for Supply-Side Investments. A second, very important financial policy element is the use of financial incentive mechanisms to reward exceptional Portfolio performance. Such mechanisms provide portfolio programs with the opportunity to earn additional profits for their organizations, and help to put portfolio programs on a comparable financial footing with supply-side investments. Ideally, the adopted mechanisms should have the following characteristics:
• They should provide a balanced opportunity for risk-reward based on portfolio performance,
• They should align the interests of utility ratepayers and stockholders,
• Claimed savings should be independently verified based on measurement and evaluation studies.
24 This is primarily an issue that affects utilities, as providers of energy services.
Itron, Inc. P1-75 Portfolio Best Practices Report
Historically, financial incentive mechanisms were fairly common in the early to mid 1990s as part of a broader Performance-Based Ratemaking (PBR) framework. Like decoupling mechanisms, financial incentive mechanisms were perceived as unnecessary with the advent of energy market restructuring and were discontinued in several states in the mid-to-late 1990s. With the renewed interest in energy efficiency and ramp-up of portfolio activities, many states are now reconsidering them.
Financial incentives are fairly common among the portfolios reviewed in this study. All but one have financial incentive mechanisms either in place or pending. Both Xcel-MN and EVT have full financial incentive mechanisms in effect, although the approaches vary significantly. Xcel – MN’s energy efficiency incentive is part of a broader PBR framework that was adopted in the late 1990s. EVT’s is tied to a performance contract that provides a portion of their compensation based on successful achievement of contract milestones. Both MidAmerican and FPL have partial incentive mechanisms, in the form of rate-of-return measures that allow them to earn a rate of return on capital equipment purchases tied to their direct load control programs. California has recently adopted a financial incentive mechanism, which is applicable to each of its portfolio administrators. Several of the portfolios in this study commented that the main value of financial incentive mechanisms to their organization is in getting their senior management to understand the direct financial contribution of portfolio programs to their company’s bottom line profit.
Timely Cost Recovery. A final element of a favorable financial framework is assured and prompt recovery of portfolio costs. All portfolio administrators in this study have procedures in place that provide prompt reimbursement of costs, usually within one month of when they are incurred. Many are also subject to a year-end financial audit or prudency review process to assess the reasonableness of costs incurred. Portfolios view these procedures as reasonable and fair, allowing them to remain on a solid financial footing.
Exhibit 3-6 below provides a summary of financial alignment tools used by the portfolios involved in this study.
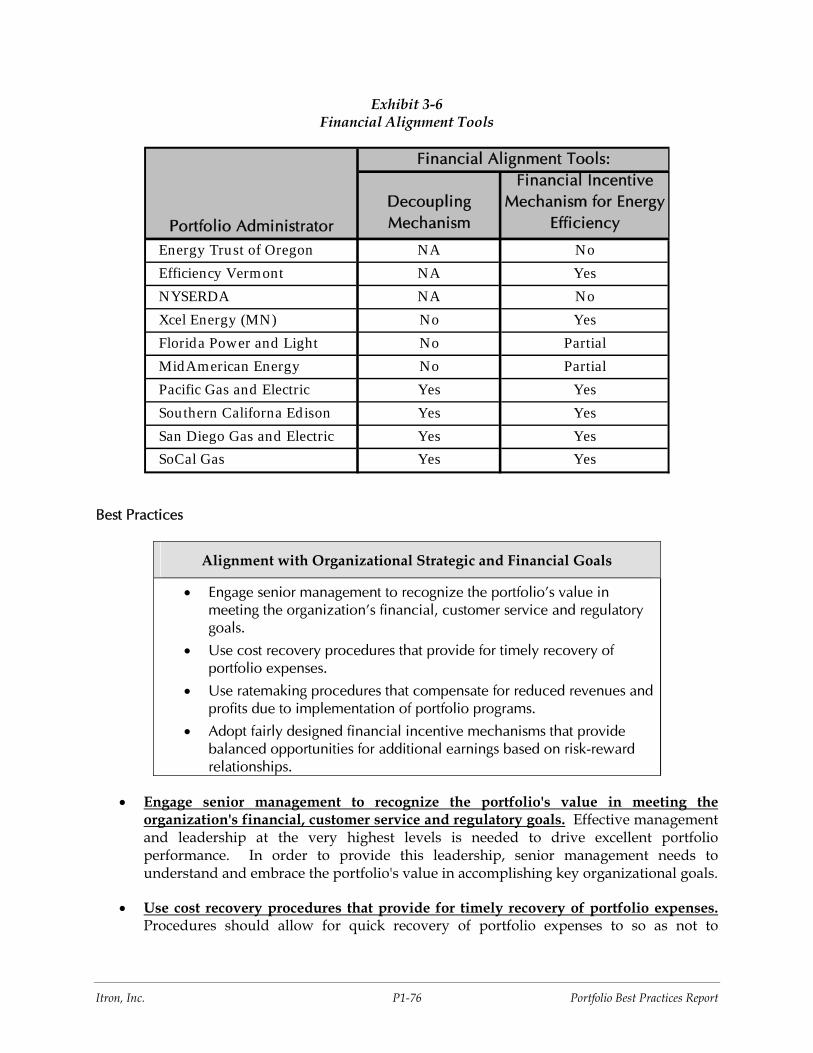
Itron, Inc. P1-76 Portfolio Best Practices Report
Exhibit 3-6 Financial Alignment Tools
Decoupling Mechanism
Financial Incentive Mechanism for Energy
Efficiency
Energy Trust of Oregon NA NoEfficiency Vermont NA YesNYSERDA NA NoXcel Energy (MN) No YesFlorida Power and Light No PartialMidAmerican Energy No PartialPacific Gas and Electric Yes YesSouthern Californa Edison Yes YesSan Diego Gas and Electric Yes YesSoCal Gas Yes Yes
Portfolio Administrator
Financial Alignment Tools:
Best Practices
Alignment with Organizational Strategic and Financial Goals
• Engage senior management to recognize the portfolio's value in meeting the organization's financial, customer service and regulatory goals.
• Use cost recovery procedures that provide for timely recovery of portfolio expenses.
• Use ratemaking procedures that compensate for reduced revenues and profits due to implementation of portfolio programs.
• Adopt fairly designed financial incentive mechanisms that provide balanced opportunities for additional earnings based on risk-reward relationships.
• Engage senior management to recognize the portfolio's value in meeting the organization's financial, customer service and regulatory goals. Effective management and leadership at the very highest levels is needed to drive excellent portfolio performance. In order to provide this leadership, senior management needs to understand and embrace the portfolio's value in accomplishing key organizational goals.
• Use cost recovery procedures that provide for timely recovery of portfolio expenses. Procedures should allow for quick recovery of portfolio expenses to so as not to
Itron, Inc. P1-77 Portfolio Best Practices Report
jeopardize the financial integrity of the administrator. Expenses should be recoverable as close to the time they are incurred as possible.
• Use ratemaking procedures that compensate for reduced revenues and profits due to implementation of portfolio programs. Adopt rate procedures that remove any disincentives due to reduced sales and associated profits. Procedures could include a formal decoupling mechanism, or use of a procedure that forecasts lost revenues due to energy efficiency implementation and compensates the administrator on a one-for-one basis.
• Adopt fairly designed financial incentive mechanisms that provide balanced opportunities for additional earnings based on risk-reward relationships. The purpose of the incentive mechanism is to align the portfolio with the utility's profitability objectives. It should strike a balance between risk-reward, offering the administrator a reasonable opportunity to earn a financial incentive for exceptional portfolio performance, or face a penalty for substandard performance.
3.5.2 Impact on Short-term and Long-term Resource Planning
The treatment of energy efficiency in resource planning processes (including both filed resource plans, and related procurement decisions) is another critical element of the policy framework necessary to motivate excellent and sustainable portfolio performance. Desirable resource planning processes are those that:
• Treat portfolio demand-side resources in an equivalent manner with supply side resources, using the same overall framework and screening process. This will provide a level playing field between portfolio resources and traditional supply-side options.
• Clearly designate portfolio resources as the preferred resource option when costs are the same as equivalent supply-side options. This provides senior management with a clear signal of the importance of portfolio resources in resource planning and procurement processes.
• Require the development of integrated resource plans (IRPs) which clearly identify portfolio impacts as a separate resource, rather than being hidden as a component of the underlying load forecast. Such treatment recognizes that portfolio savings impacts are a separate resource to be acquired on a basis equivalent to that of supply side resources, and clearly states the magnitude of its contribution.
In the mid-1980s to mid-1990s, many states had integrated resource planning processes in place which provided equivalent treatment to demand-side and supply-side resources. These processes were generally discarded in the late 1990s, another casualty of anticipated energy market restructuring and deregulation. Recently, concerns about energy resource adequacy and global warming have rejuvenated interest in IRP procedures and plans, and many states have either adopted formal IRP requirements or related procedures (for example, Energy Efficiency and Renewables Portfolio Standards). According to a recent study by the Regulatory Assistance Project, IRP procedures, or their equivalent, are in place in the following states: California, Connecticut (gas-only), Hawaii, Illinois, Indiana, Minnesota, Missouri, Montana,
Itron, Inc. P1-78 Portfolio Best Practices Report
Nevada, New Mexico, Oregon, Vermont and Washington. The state of Arizona does not have an IRP requirement, but does mandate that Arizona Public Service establish procurement policies that evaluate demand-side and supply-side resources in a comparable manner. Other states require the filing of separate energy efficiency plans, either in addition to, or in place of, filed IRPs. These include both California and Iowa. These plans consist of explicit energy savings goals, plus the program strategies employed to achieve them.
All the portfolios involved in this study are operating in states or regions that have favorable resource planning and procurement policies in place. These policies take various forms, for example:
• Both California and the Pacific Northwest have policies which rank cost-effective energy efficiency first in their resource loading order. This requirement affects both filed resource plans and near-term resource procurement decisions. This requires utilities to deploy all cost-effective energy efficiency resources before turning to other supply-side options (including purchased power).
• Both Minnesota and Vermont use IRP procedures that mandate utilities to deploy all cost-effective energy efficiency, and to file integrated resource plans every 2-3 years.
• New York uses a statewide resource planning process that establishes the resource need and considers the potential contribution from Portfolio resources. NYSERDA’s savings goals are based on the results of that process.
• Iowa does not have an IRP requirement; however, utilities are required to file energy efficiency plans with state regulators every 5 years. These are developed by utilities using standard IRP procedures and their impacts are incorporated into utility resource plans and procurement decisions. This is done on a voluntary basis.
• Florida has no formal IRP requirement. However, utilities are mandated to implement all cost-effective energy efficiency. Portfolio and program savings impacts are used to defer power plants, and in the near-term to offset purchased power needs.
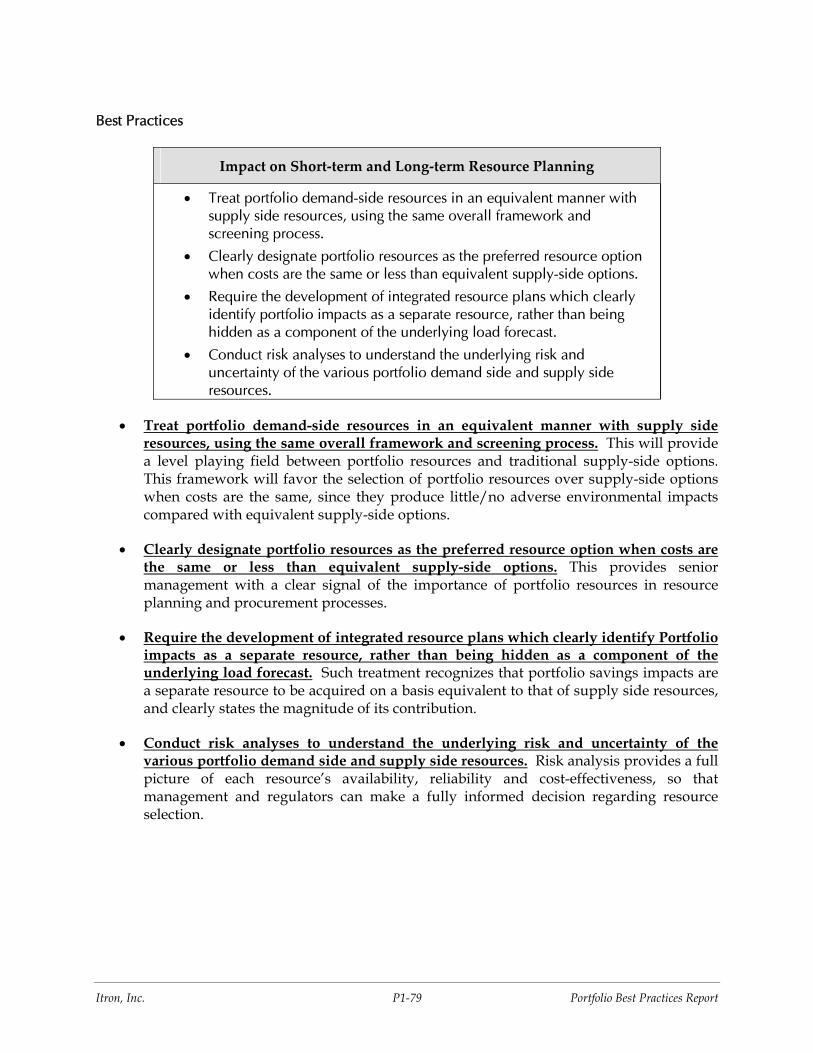
Itron, Inc. P1-79 Portfolio Best Practices Report
Best Practices
Impact on Short‐term and Long‐term Resource Planning
• Treat portfolio demand-side resources in an equivalent manner with supply side resources, using the same overall framework and screening process.
• Clearly designate portfolio resources as the preferred resource option when costs are the same or less than equivalent supply-side options.
• Require the development of integrated resource plans which clearly identify portfolio impacts as a separate resource, rather than being hidden as a component of the underlying load forecast.
• Conduct risk analyses to understand the underlying risk and uncertainty of the various portfolio demand side and supply side resources.
• Treat portfolio demand-side resources in an equivalent manner with supply side resources, using the same overall framework and screening process. This will provide a level playing field between portfolio resources and traditional supply-side options. This framework will favor the selection of portfolio resources over supply-side options when costs are the same, since they produce little/no adverse environmental impacts compared with equivalent supply-side options.
• Clearly designate portfolio resources as the preferred resource option when costs are the same or less than equivalent supply-side options. This provides senior management with a clear signal of the importance of portfolio resources in resource planning and procurement processes.
• Require the development of integrated resource plans which clearly identify Portfolio impacts as a separate resource, rather than being hidden as a component of the underlying load forecast. Such treatment recognizes that portfolio savings impacts are a separate resource to be acquired on a basis equivalent to that of supply side resources, and clearly states the magnitude of its contribution.
• Conduct risk analyses to understand the underlying risk and uncertainty of the various portfolio demand side and supply side resources. Risk analysis provides a full picture of each resource’s availability, reliability and cost-effectiveness, so that management and regulators can make a fully informed decision regarding resource selection.

Itron, Inc. P1-80 Portfolio Best Practices Report
3.5.3 Avoided Cost and Cost-Effectiveness Procedures
Avoided costing and cost-effectiveness procedures influence the economic attractiveness of portfolio resources (relative to competing supply side options), and therefore are a key to Portfolio resource valuation and selection. The guiding principle is to use a framework which values and selects portfolio resources in a manner consistent with that used for long-term resource plans.
• Avoided cost policies should value portfolio resources based on the costs of supply-side resources that are displaced by portfolio savings impacts. Valuation should be done in a manner that is consistent and equivalent with that used for supply-side resources. Avoided costs should be developed for all categories of supply-side resources that are deferred or eliminated, and include generation, transmission and distribution components. In addition, the same methods should be used to develop both short-term and long-term avoided costs. Avoided cost procedures should develop modest credits for other non-energy benefits, such as environmental externalities, based on existing estimates of these factors on a per-kWh of savings basis.
• Cost effectiveness policies should evaluate the portfolio’s cost-effectiveness in an equivalent manner with long-term resource plans, to ensure that portfolio resources are being valued and screened on the same basis as supply side options.
Avoided Cost Procedures
Avoided costs, reflecting the savings in the costs of energy and capacity resources displaced by Portfolio programs, have two components:
• Avoided Energy Costs. These are a function of energy-related benefits based on the need to procure or generate less wholesale electric energy and natural gas, and associated savings in delivery losses.
• Avoided Capacity Costs. These reflect capacity-related benefits based on reduced wholesale electric capacity purchases, deferred or eliminated construction of new facilities, and/or deferred upgrades in system reliability. Avoided capacity costs reflect two categories of savings – generation/purchases and T&D savings. Each of these is discussed separately.
Current Portfolio Practices
Avoided Generation/Purchases and Energy Costs
Portfolios in this study use two distinct approaches to determine avoided cost values as described below:
• Valuation based on market prices. The Trust, NYSERDA and the California IOUs, located in states with well-established energy supply markets, base their avoided costs on long-term forecasts of wholesale market prices for electricity. NYSERDA calculates zonal avoided costs for both the upstate and downstate regions of New York.

Itron, Inc. P1-81 Portfolio Best Practices Report
• Valuation based on future utility supply plans. MidAmerican, Xcel-MN and FPL, located in states that do have well-established energy supply markets, base their avoided costs on a 20 year forecast of future electricity supply options. Avoided generation/purchases capacity costs are based on the future supply option with the highest value, and avoided energy costs reflect the marginal costs of the utility’s generating units.
Each of these approaches fulfills the desired objectives of being: based on the resources that would otherwise be avoided, applied consistently among both supply and demand-side options, and used consistently to develop both short-term and long-term avoided cost values.
Avoided Transmission and Distribution (T&D) Costs
In addition to savings in generation and/or purchased power supply costs, additional benefits can also be realized through the deferral or elimination of T&D facilities. Some states recognize avoided T&D costs as a valid component of their avoided cost structure; however, many do not. In part, this is because T&D cost savings are more difficult to quantify. Of the seven states represented by the portfolios in this study, only three take into account T&D avoided cost savings in their calculation of portfolio benefits. They are Oregon (the Trust), Minnesota (Xcel-MN) and California (California IOUs).
Non Energy Benefits
Most portfolios also account for non-energy benefits in their avoided cost calculations through separate credits. A credit to account for avoided environmental costs is the most commonly used and is typically expressed either as a specified percentage or as $ per ton of emissions. The rationale for including this component is to account for the likely future cost of emissions reductions in the benefits calculation. Other types of Non Energy Benefits include credits to account for water avoided costs, reduced risk and uncertainty, reliability improvements, and the price effect of demand reduction. Exhibit 3-7 summarizes the specific credits applied by portfolios in this study to account for non-energy benefits.
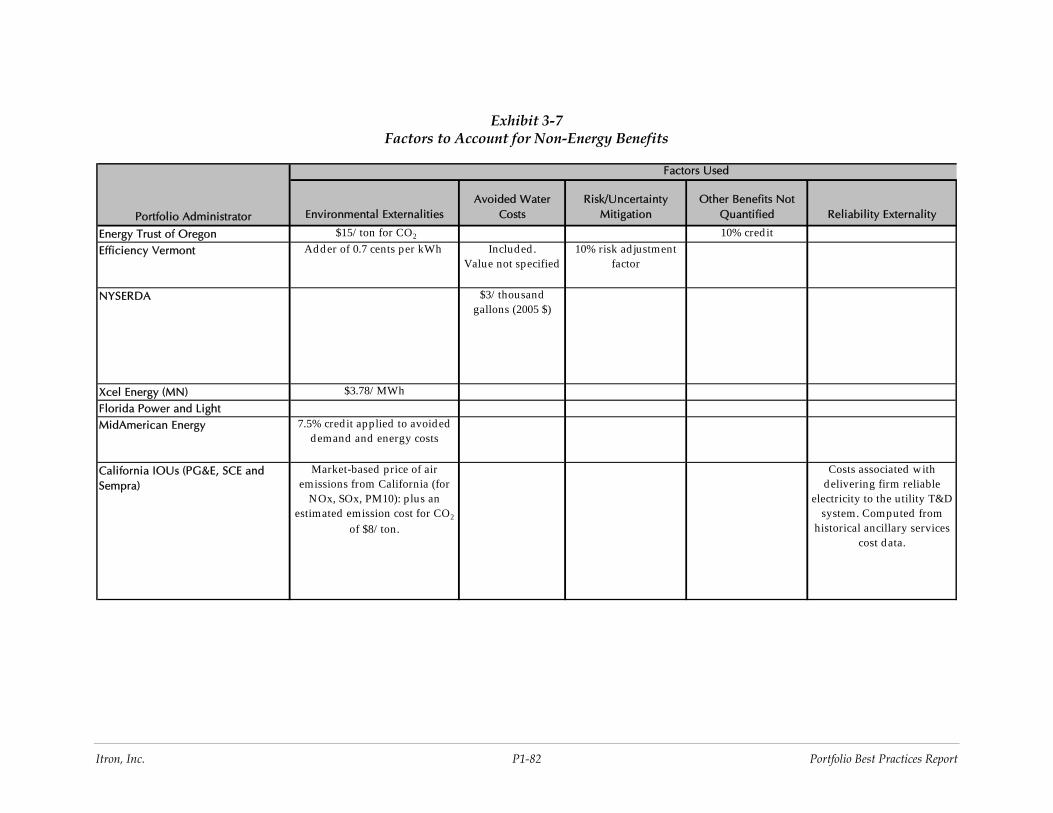
Itron, Inc. P1-82 Portfolio Best Practices Report
Exhibit 3-7 Factors to Account for Non-Energy Benefits
Environmental ExternalitiesAvoided Water
CostsRisk/Uncertainty
MitigationOther Benefits Not
Quantified Reliability Externality
Energy Trust of Oregon $15/ ton for CO2 10% cred itEfficiency Vermont Adder of 0.7 cents per kWh Included .
Value not specified10% risk ad justment
factor
NYSERDA $3/ thousand gallons (2005 $)
Xcel Energy (MN) $3.78/ MWhFlorida Power and LightMidAmerican Energy 7.5% cred it applied to avoided
demand and energy costs
California IOUs (PG&E, SCE and Sempra)
Market-based price of air emissions from California (for
NOx, SOx, PM10): plus an estimated emission cost for CO2
of $8/ ton.
Costs associated with delivering firm reliable
electricity to the utility T&D system. Computed from
historical ancillary services cost data.
Portfolio Administrator
Factors Used
Itron, Inc. P1-83 Portfolio Best Practices Report
Cost-effectiveness Procedures
Cost effectiveness procedures provide a standard framework for evaluating portfolio and program costs and benefits. Cost effectiveness is analyzed based on several different perspectives:
• The portfolio administrator (Program Administrator Cost Test)
• Utility ratepayers as a whole (Rate Impact Measure Test)
• Participating customers (Participant Test)
• Society as a whole (Societal and Total Resource Cost Tests)
Adopted cost effectiveness procedures are instrumental in:
• Providing information about the economic success of the overall portfolio and its component programs
• Influencing decisions regarding whether to continue or terminate a program or substantially revise it
• Determining program funding levels
• Understanding why targeted customers do or do not participate
• Estimating the likely impact of portfolio programs on all utility ratepayers
The cost effectiveness perspectives analyzed and underlying formulas used are standard across the industry. However, states differ with respect to the specific tests used to screen programs, analyze portfolio program success, and allocate funding across programs. The majority of states use the Societal or Total Resource Cost perspectives as the primary cost-effectiveness test, as shown in Exhibit 3-8 below, provided by the Regulatory Assistance Project.
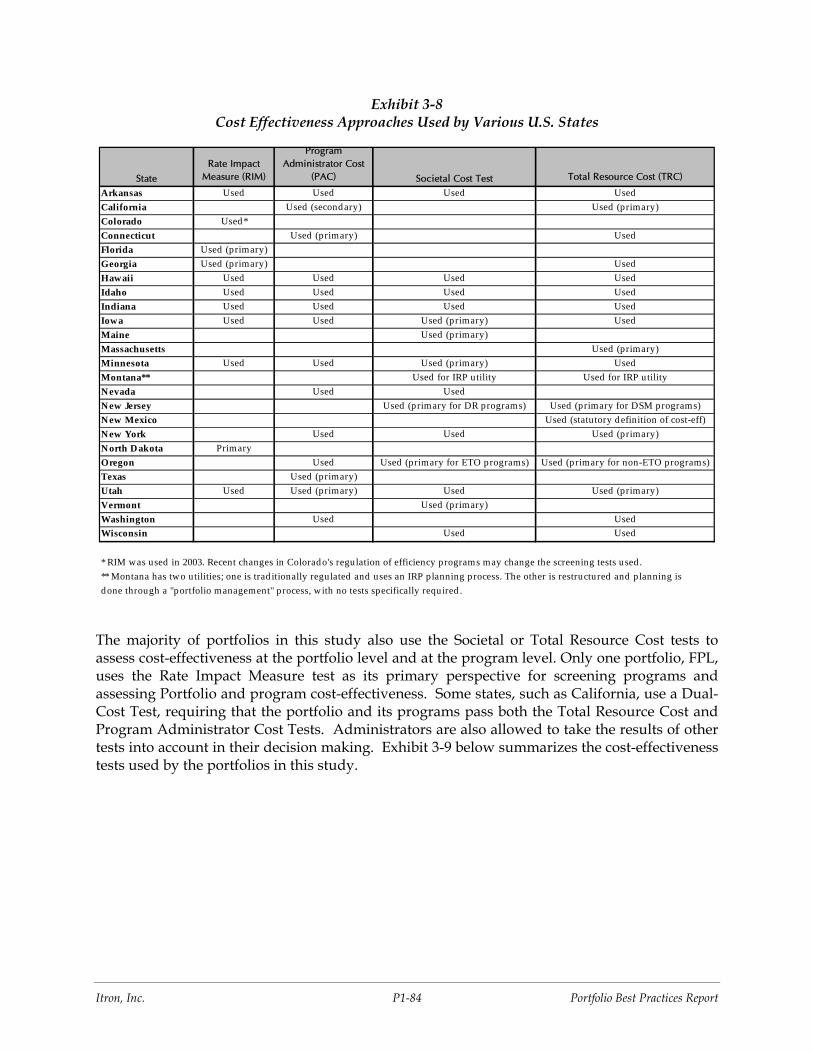
Itron, Inc. P1-84 Portfolio Best Practices Report
Exhibit 3-8 Cost Effectiveness Approaches Used by Various U.S. States
State
Rate Impact Measure (RIM)
Program Administrator Cost
(PAC) Societal Cost Test Total Resource Cost (TRC)
Arkansas Used Used Used UsedCalifornia Used (secondary) Used (primary)Colorado Used*Connecticut Used (primary) UsedFlorida Used (primary)Georgia Used (primary) UsedHawaii Used Used Used UsedIdaho Used Used Used UsedIndiana Used Used Used UsedIowa Used Used Used (primary) UsedMaine Used (primary)Massachusetts Used (primary)Minnesota Used Used Used (primary) UsedMontana** Used for IRP utility Used for IRP utilityNevada Used UsedNew Jersey Used (primary for DR programs) Used (primary for DSM programs)New Mexico Used (statutory definition of cost-eff)New York Used Used Used (primary)North Dakota PrimaryOregon Used Used (primary for ETO programs) Used (primary for non-ETO programs)Texas Used (primary)Utah Used Used (primary) Used Used (primary)Vermont Used (primary)Washington Used UsedWisconsin Used Used
* RIM was used in 2003. Recent changes in Colorado's regulation of efficiency programs may change the screening tests used .** Montana has two utilities; one is trad itionally regulated and uses an IRP planning process. The other is restructured and p lanning isdone through a "portfolio management" process, with no tests specifically required .
The majority of portfolios in this study also use the Societal or Total Resource Cost tests to assess cost-effectiveness at the portfolio level and at the program level. Only one portfolio, FPL, uses the Rate Impact Measure test as its primary perspective for screening programs and assessing Portfolio and program cost-effectiveness. Some states, such as California, use a Dual-Cost Test, requiring that the portfolio and its programs pass both the Total Resource Cost and Program Administrator Cost Tests. Administrators are also allowed to take the results of other tests into account in their decision making. Exhibit 3-9 below summarizes the cost-effectiveness tests used by the portfolios in this study.
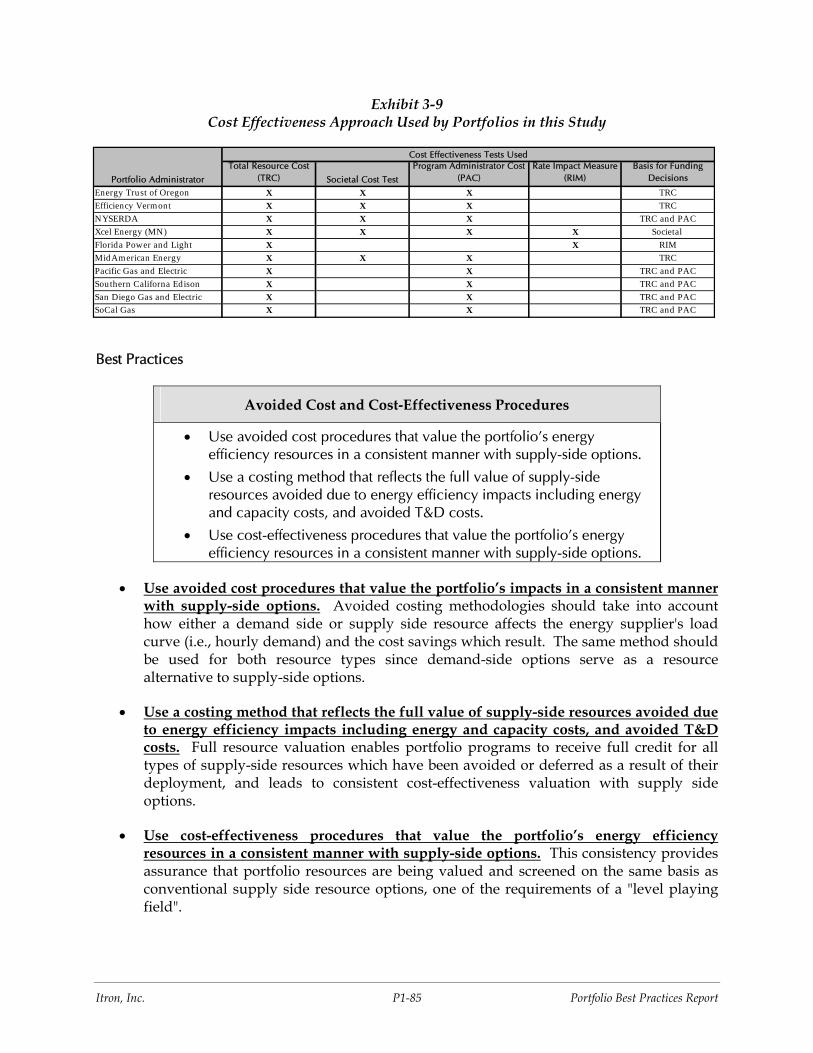
Itron, Inc. P1-85 Portfolio Best Practices Report
Exhibit 3-9 Cost Effectiveness Approach Used by Portfolios in this Study
Total Resource Cost (TRC) Societal Cost Test
Program Administrator Cost (PAC)
Rate Impact Measure (RIM)
Basis for Funding Decisions
Energy Trust of Oregon X X X TRCEfficiency Vermont X X X TRCNYSERDA X X X TRC and PACXcel Energy (MN) X X X X Societal Florida Power and Light X X RIMMidAmerican Energy X X X TRCPacific Gas and Electric X X TRC and PACSouthern Californa Edison X X TRC and PACSan Diego Gas and Electric X X TRC and PACSoCal Gas X X TRC and PAC
Portfolio Administrator
Cost Effectiveness Tests Used
Best Practices
Avoided Cost and Cost‐Effectiveness Procedures
• Use avoided cost procedures that value the portfolio’s energy efficiency resources in a consistent manner with supply-side options.
• Use a costing method that reflects the full value of supply-side resources avoided due to energy efficiency impacts including energy and capacity costs, and avoided T&D costs.
• Use cost-effectiveness procedures that value the portfolio’s energy efficiency resources in a consistent manner with supply-side options.
• Use avoided cost procedures that value the portfolio’s impacts in a consistent manner with supply-side options. Avoided costing methodologies should take into account how either a demand side or supply side resource affects the energy supplier's load curve (i.e., hourly demand) and the cost savings which result. The same method should be used for both resource types since demand-side options serve as a resource alternative to supply-side options.
• Use a costing method that reflects the full value of supply-side resources avoided due to energy efficiency impacts including energy and capacity costs, and avoided T&D costs. Full resource valuation enables portfolio programs to receive full credit for all types of supply-side resources which have been avoided or deferred as a result of their deployment, and leads to consistent cost-effectiveness valuation with supply side options.
• Use cost-effectiveness procedures that value the portfolio’s energy efficiency resources in a consistent manner with supply-side options. This consistency provides assurance that portfolio resources are being valued and screened on the same basis as conventional supply side resource options, one of the requirements of a "level playing field".
Itron, Inc. P1-86 Portfolio Best Practices Report
3.5.4 Funding Stability/Funds Management
Funding adequacy and stability are essential to support continuous portfolio and program operations and to remove any disincentive to capturing all cost-effective portfolio savings available. Conversely, inadequate or unstable funding undermines portfolio operations and performance, leads to gaps in program and project funding and operations, and introduces uncertainty into decisions regarding whether to fund long-lead time projects, or launch new programs. For portfolios to be successful in achieving excellent performance, they need to have a consistent, adequate and long-term funding source.
Unstable and/or inadequate funding has proven to be a problem for some of the portfolios that are funded by revenues originating from a System Benefits Charge (SBC). SBC revenues are prescribed, and therefore limited, by a fixed funding formula, which can lead to funding gaps if the demand for portfolio services outpaces available fixed funding levels. Another problem experienced when SBC revenues pass through state budgets, has been that they have been regarded by state officials as a source of general revenue and diverted to purposes other that they were intended for In these states, the portfolio administrator faces continuing uncertainty each year over whether the portfolio will be fully funded or whether a portion of funds will be taken away.
Fortunately, the portfolios in this study have not experienced any significant funding disruptions. All of the investor owned utility administrators have a funding model where monies pass directly from ratepayers into the administrator’s budget. The Vermont Energy Efficiency Utility structure includes a “Fiscal Agent,” an independent contractor, who receives Public Benefits funds from the utilities and disburses them against bills submitted by Efficiency Vermont. The Trust and NYSERDA, both SBC funded, periodically encounter legislative interest in diverting a portion of the funds to other purposes; to date, this has not occurred25. The fact that SBC funds are ratepayer funds rather than tax revenues provides some degree of legal insulation from this problem.
The fixed funding formula has been more of a problem for the Trust, and has limited its ability to accommodate all the demands for its energy efficiency services throughout the year. In previous years, this was not a problem since the Trust could rely on unspent funds carried over from prior years in order to fully. However, these carryover funds are no longer available and the Trust has needed to put a funds reservation system in place to assure continuous program funding throughout the year. In 2007, the Oregon legislature adopted legislation that could help alleviate this concern by allowing utilities to increase funding for cost-effective energy efficiency above the three percent fixed funding formula.
25 Whether this could happen in New York is speculative; the SBC is an administrative process, not a legislative
process.

Itron, Inc. P1-87 Portfolio Best Practices Report
Best Practices
Funding Stability/Funds Management
• Adopt a funding approach that (1) keeps portfolio funds separate and directs them to their intended uses; and (2) passes program funds directly from the funding source to the program administrator.
• Recognize long project lead times and allow for carryover of funds from year to year to support project commitments from prior years, to be used when projects are implemented.
• Proactively manage funds to prevent program and funding disruptions part-way through the year. Use measures such as reservation systems and funding caps to ensure funding availability throughout the year.
• Leverage other funding sources such as tax credits, grants, co-financing, etc.
• Adopt a funding approach that (1) keeps portfolio funds separate and directs them to their intended uses; and (2) passes program funds directly from the funding source to the program administrator. These measures are needed in order to protect the integrity of funds collected for public benefits programs, and to prevent them from being diverted to other uses.
• Recognize long project lead times and allow for carryover of funds from year to year to support project commitments from prior years, to be used when projects are implemented. Carryover funding procedures provide the flexibility needed when the portfolio is ramping up or ramping down its operation, and when it is trying to reserve funds earmarked for long-lead time customer projects, which may take several years to complete.
• Proactively manage funds to prevent program and funding disruptions part-way through the year. Use measures such as reservation systems and funding caps to ensure funding availability throughout the year. Portfolios with fixed funding may face demands for project incentive funds that exceed the available budget. Tools to help preserve funds throughout the year maintain program continuity, continue to build market momentum, and allow programs to keep market actors continuously engaged.
• Leverage other funding sources such as tax credits, grants, co-financing, etc. A number of other co-funding sources are available for projects developed through portfolio programs, and can be combined with portfolio incentive dollars to make them go farther and have greater impact.
Itron, Inc. P1-88 Portfolio Best Practices Report
APPENDIX A – METHODOLOGY
Portfolio - Definition
We defined “Portfolio” as a set of programs designed to work strategically and comprehensively across specific technologies, practices, and programs at a market level. Portfolios of interest for this study were comprehensive in their coverage and included a wide range of different types of programs that address most or all of the following:
• Multiple customer sectors – residential, commercial, industrial, agricultural, low income
• Multiple equipment markets – lighting, HVAC, motors, VFDs, etc.
• Multiple vintage segments– retrofit, replace-on-burnout, major renovation, and new construction
• Multiple policy goals – e.g., resource acquisition, market transformation, equity, economic development, etc.
Components Used to Assess Best Practices
Best practices at the portfolio level are much more strategic and policy-oriented than those at the program level (which are more tactical in nature). However, there is some overlap with program-level BPs (as defined in the earlier study phase). The reason for this is that program-level BPs can be “rolled up” to the portfolio level. Those practices that are more planning and quality control-oriented are relevant to both programs and portfolios. Therefore, the list of BP components for portfolios consisted of some of the subcomponents from the prior study phase, plus several new attributes that are more big-picture and policy based.
Table A-1 below provides the final list of BP components that were used in the Best Practices assessment at the portfolio level. The table lists both subcomponents from the previous study plus new elements that apply at the portfolio level. Each of these is discussed in more detail below.
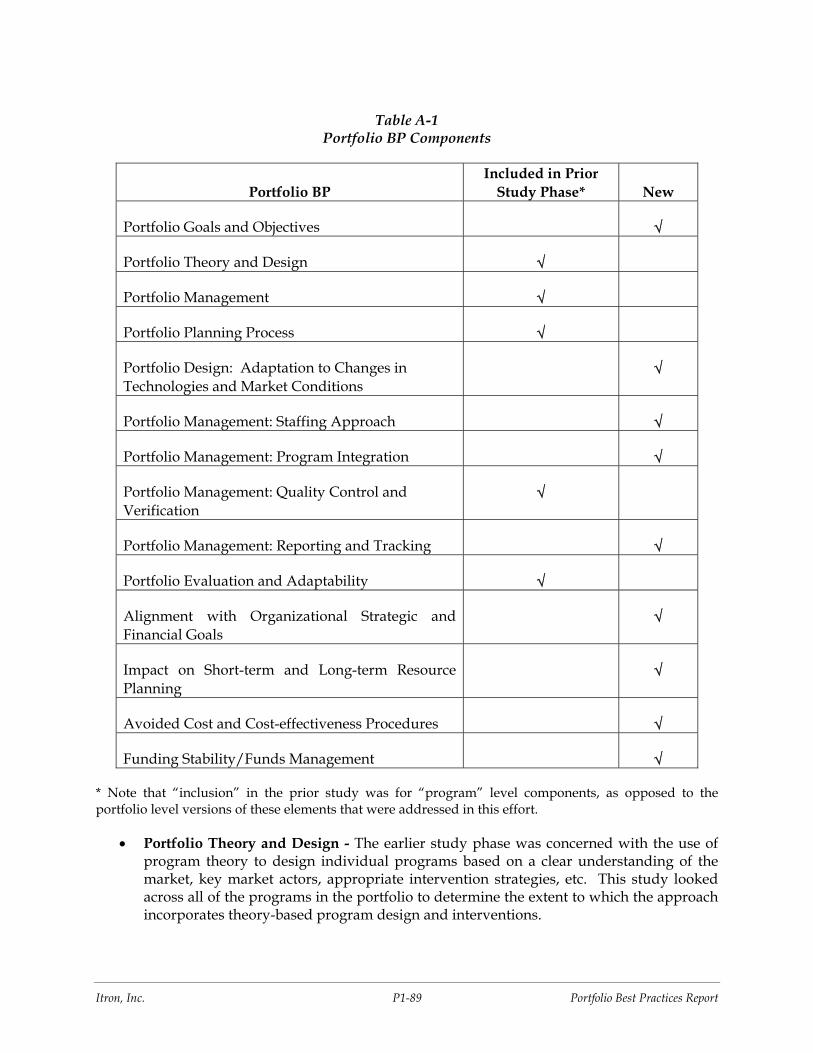
Itron, Inc. P1-89 Portfolio Best Practices Report
Table A-1 Portfolio BP Components
Portfolio BP
Included in Prior Study Phase*
New
Portfolio Goals and Objectives √
Portfolio Theory and Design √
Portfolio Management √
Portfolio Planning Process √
Portfolio Design: Adaptation to Changes in Technologies and Market Conditions
√
Portfolio Management: Staffing Approach √
Portfolio Management: Program Integration √
Portfolio Management: Quality Control and Verification
√
Portfolio Management: Reporting and Tracking √
Portfolio Evaluation and Adaptability √
Alignment with Organizational Strategic and Financial Goals
√
Impact on Short-term and Long-term Resource Planning
√
Avoided Cost and Cost-effectiveness Procedures √
Funding Stability/Funds Management √
* Note that “inclusion” in the prior study was for “program” level components, as opposed to the portfolio level versions of these elements that were addressed in this effort.
• Portfolio Theory and Design - The earlier study phase was concerned with the use of program theory to design individual programs based on a clear understanding of the market, key market actors, appropriate intervention strategies, etc. This study looked across all of the programs in the portfolio to determine the extent to which the approach incorporates theory-based program design and interventions.
Itron, Inc. P1-90 Portfolio Best Practices Report
• Portfolio Management – The earlier study phase defined project management as the ability of the implementer to cost-effectively manage all aspects of the programmatic process by effectively executing the management/organizational plan. This definition applied at the portfolio level as well. We examined specific portfolio and program management practices and assessed which were the most effective.
• Portfolio Planning Process –We examined each administrator’s specific portfolio and program planning functions and related activities, such as conducting market research, developing program theories and plans, and soliciting stakeholder input. Our goal was to discover the most effective practices for developing a sound portfolio plan.
• Portfolio Design: Adaptation to Changes in Technologies and Market Conditions – The portfolio’s procedures for tracking future changes in targeted markets and adapting programs to these changes when they occurred were also researched. Best practices were developed based on the procedures which appear to be the most successful.
• Portfolio Management: Staffing Approach – This component addresses the “people” side of portfolio operations. We researched the portfolio’s human resource practices including recruitment, hiring, retention and staff development approaches to learn which are most effective.
• Portfolio Program Integration – We looked for evidence of integration both between and within programs and markets, in all processes including planning, design and execution
• Portfolio Quality Control (QC) and Verification – We viewed QC and verification broadly, and researched the activities conducted, the administrator’s culture and support of these activities, and the degree of commitment to continuous improvement of the portfolio based on results.
• Portfolio Management: Reporting and Tracking – We examined the current functions performed by each administrator’s tracking and reporting systems, the degree to which these functions and systems are automated and internet-based, and the ability of these systems to provide timely reporting of results to managers.
• Portfolio Evaluation and Adaptability – We researched the energy efficiency administrator’s specific evaluation efforts and their commitment to continuous portfolio improvement based on evaluation findings. We also examined whether evaluation efforts provided portfolio-level results and assessment of portfolio management and procedures, or program-level results only.
• Alignment with Organizational Strategic and Financial Goals – Various mechanisms to make energy efficiency as profitable as supply side resources can include revenue decoupling mechanisms, rate of return bonuses, and performance-based contracts, among others. We researched the specific approaches used in Portfolio jurisdictions for this alignment to determine which were the most effective.
Itron, Inc. P1-91 Portfolio Best Practices Report
• Impact on Short-term and Long-term Resource Planning – We researched how each jurisdiction treats Portfolio impacts in their short-term and long-term resource planning and procurement decision makings in order to determine which policies or procedures appear to have the greatest impact on the Portfolio’s success.
• Avoided Cost and Cost Effectiveness Procedures – Key aspects of this component include the appropriate and comprehensive specification of avoided cost components, program costs and benefits, the use of accurate and empirical data for such inputs, and the alignment of test definitions with policy and resource objectives. We examined each of these to determine which approaches appear to be the most effective.
• Funding Stability/Funds Management – Another facet examined was funding adequacy and stability. We researched the specific approaches used, and assessed their effectiveness and impact on the overall performance of the portfolio.
Program Benchmarking
Benchmarking of Portfolios against these various BP categories was done in similar fashion to the previous study phase, i.e., through structured qualitative analysis. Data were collected from a number of sources: staff and expert interviews, documents from regulatory proceedings and filings, and published reports. Findings for each administrator were then reported for each component area, in the form of the specific practices of that administrator. Common themes across these findings were then developed. Best practices for each component are derived from these common themes, and, at times, from the administrator’s specific practices.
Portfolio Selection
The study originally sought to include up to 10 Portfolios. In order to be considered for inclusion, all Portfolios were required to have a minimum annual budget of at least $25 million. Portfolios also had to be comprehensive, with programs operating in all customer sectors, and to be mature (i.e., have operated for a minimum of 3 years). We used a 2-step process to select Portfolios to evaluate:
• Step 1 – First, we considered Portfolios operating in jurisdictions recognized for their leadership in and sustained commitment to energy efficiency. These included, but were not limited to, California, New York, Wisconsin, Oregon, Vermont, Minnesota (Xcel Energy), New England, and the Pacific Northwest.
• Step 2 – Second, we considered Portfolios from other providers/jurisdictions less well-known for their energy efficiency efforts. We started with a list of energy efficiency providers developed from the previous study phase, and added to it new providers (not considered in the earlier study). Suggestions for portfolios to consider were elicited from study team members, PAC members, and review of related sources, such as organizations with programs nominated for ACEEE's Profiles of Leading Energy Efficiency Programs. Next, we screened this list of providers against the budget, scope and maturity criteria described above, and developed a list of “eligible” portfolios. From this list of eligible portfolios, we randomly drew names. The over-sampled

Itron, Inc. P1-92 Portfolio Best Practices Report
Portfolios were used as backups in case candidate portfolio providers fell out of the study at a later stage in the analysis.
Itron, Inc. P1-93 Portfolio Best Practices Report
APPENDIX B – SOURCES
Blumstein, C, Goldman, G, and Barbose, G, 2003. Who Should Administer Energy Efficiency Markets? August.
Brandt, Dennis (Director of Energy Efficiency, Florida Power and Light). 2006. Best Practices In-Depth Interview. Florida Power and Light’s Energy Efficiency and Load Management Portfolio. September 13.
California Energy Commission. 2005. 2005 Building Energy Efficiency Standards, Residential Compliance Manual. April.
California Energy Commission. 2005. 2005 Building Energy Efficiency Standards, Nonresidential Compliance Manual. April
California Energy Commission and California Public Utilities Commission. 2005. Energy Action Plan II: Implementation Roadmap for Energy Policies. September 21.
California Public Utilities Commission. 2001. California Standard Practice Manual. October.
California Public Utilities Commission. 2004. D. 04-09-060. Interim Opinion: Energy Savings Goals for Program Year 2006 and Beyond. September 29.
California Public Utilities Commission. 2005. D. 05-01-055. Interim Opinion on the Administrative Structure for Energy Efficiency: Threshold Issues. February 3.
California Public Utilities Commission. 2005. D. 05-04-024. Interim Opinion on E3 Avoided Cost Methodology. April 7.
California Public Utilities Commission. 2006. D. 05-04-051. Interim Opinion: Updated Policy Rules for Post-2005 Energy Efficiency and Threshold Issues Related to Evaluation, Measurement and Verification of Energy Efficiency Programs. April 21.
California Public Utilities Commission. 2007. D. 07-09-043. Interim Opinion on Phase 1 Issues: Shareholder Risk/Reward Incentive Mechanism for Energy Efficiency Programs. September 25.
California Public Utilities Commission. 2007. Interim Opinion on Issues Related to Future Savings Goals and Program Planning for 2009-2011 Energy Efficiency and Beyond. October 18.
California Public Utilities Commission. 2007. Energy Efficiency Policy Manual, Version 3. December 20.
Consortium for Energy Efficiency. 2007. U.S. Energy Efficiency Programs: A $2.6 Billion Industry – 2006 Report.
Itron, Inc. P1-94 Portfolio Best Practices Report
DeCotis, Paul (Director of Energy Analysis, NYSERDA) and Pakenas, Larry (Evaluator). 2006. Best Practices In-Depth Interview. NYSERDA’s Energy SmartSM Program Portfolio. October 31.
Efficiency Vermont. 2005. Highlights of Efficiency Vermont’s Plans for 2006: The first year of the 2006-2008 contract term. December 16.
Efficiency Vermont. 2006. Year 2005 Annual Report and Annual Energy Savings Claim. August 21.
Efficiency Vermont. 2006. Vermont's Energy Efficiency Utility Measurement and Verification Plan. November 29.
Energy and Environmental Economics, Inc. 2006. Report on 2006 Update to Avoided Costs and E3 Calculator. March 21.
Energy Trust of Oregon. 2006. 2007-2012 Strategic Plan. November 8
Energy Trust of Oregon. 2006. 2005 Annual Report. April 14.
Energy Trust of Oregon. 2006. 2006 Final Budget. January 9.
Energy Trust of Oregon. 2005. 2006 Final Action Plan. December
Florida Public Service Commission. 2006. Annual Report on Activities Pursuant to the Florida Energy Efficiency and Conservation Act. February.
Energy and Environmental Economics, Inc. 2004. Methodology and Forecast of Long-Term Avoided Costs for the Evaluation of California Energy Efficiency Programs. October 25.
Gaines, Mark (Director of Customer Programs); Besa, Athena (Energy Efficiency Administrative and Policy Manager); Hobbs, Rick (C/I Mass Market Segment Manager); and Williams, Sandra (Demand Response Implementation Manager). Best Practices In-Depth Interview.2006. Sempra Utilities’ Energy Efficiency Portfolio. November 30.
Gordon, Fred (Director of Planning and Evaluation, Energy Trust of Oregon). 2006. Best Practices In-Depth Interview. Energy Trust of Oregon’s Energy Efficiency Portfolio. September 22.
Hamilton, Blair (Deputy Director, Vermont Energy Investment Corp. 2006. Best Practices In-Depth Interview. Efficiency Vermont’s Energy Efficiency Portfolio. September 26.
Iowa Administrative Code. 1999. Chapter 35: Energy Efficiency Planning and Cost Review. January 13.
Kushler, M., York, D., Witte, P., ACEEE. 2006. Aligning Utility Interests With Energy Efficiency Objectives: A Review of Recent Efforts at Decoupling and Performance Incentives. October.

Itron, Inc. P1-95 Portfolio Best Practices Report
Leuthauser, Rick (Manager of Energy Efficiency, MidAmerican Energy). 2006. Best Practices In-Depth Interview. MidAmerican Energy’s Energy Efficiency and Demand Response Portfolio. October 10.
MidAmerican Energy. 2006. Energy Efficiency Plan EEP-03-1, 2005 Annual Report to the Iowa Utilities Board. May 1.
Minnesota Public Utilities Commission. 2006. Order Approving Xcel-Energy’s Application for Approval of its 2005-2019 Integrated Resource Plan. July 28.
North American Electric Reliability Council. 2006. August 14, 2003, Northeast Blackout Impacts and Actions and the Energy Policy Act of 2005. August.
North American Electric Reliability Council. 2007. 2007 Long-Term Reliability Assessment: 2007-2016. October.
NYSERDA. 2006. Financial Statements for Fiscal Year Ending March 31, 2006. March 31.
NYSERDA. 2006. Facing Energy Challenges in the 21st Century: A Three-Year Strategic Outlook 2006-2009. June.
NYSERDA. 2006. Proposed Plan for New York Energy $martSM Programs (2006-2011). March 2.
Public Utility Commission of Oregon. 2006. Order 06-679. Recommendations for 2007 Performance Measures. December 21.
Regulatory Assistance Project. 2006. Energy Efficiency Policy Toolkit. March.
Riiser, Roland (Director Customer Energy Efficiency); Miller, Bill (Energy Efficiency Policy); Larson, Duane (Manager Mass Markets, CEE); and McCarthy, Steve (Director, Demand Side Resources). Pacific Gas and Electric. 2007. Best Practices In-Depth Interview. PG&E’s Energy Efficiency Portfolio. January 9 and February 9.
Rodrigues, Gene (Director of Energy Efficiency); Nall, John (Manager of Residential programs); Bruder, David (Manager of Nonresidential programs); and Arambula, Don (Energy Efficiency Policy Expert). Southern California Edison. 2006. Best Practices In-Depth Interview. SCE’s Energy Efficiency Portfolio. November 28.
Southern California Edison. 2006. Energy Efficiency Annual Report. May.
Sundin, Deb (Director, Business Product Marketing and CIP/DSM, Xcel Energy-Minnesota). Best Practices In-Depth Interview. Xcel Energy-Minnesota’s Energy Efficiency Portfolio. October 3.
TecMarket Works et. al. 2005. A Management Audit of the Energy Trust of Oregon. January 31.
Itron, Inc. P1-96 Portfolio Best Practices Report
TecMarket Works et. al. 2005. The California 2006-2008 Energy Efficiency Portfolio: A Review of Early IOU Planning Documents. May 27.
TecMarket Works et. al. 2004. The California Evaluation Framework. June.
U.S. Department of Energy, Federal Energy Regulatory Commission. 2006. Staff Assessment of Demand Response and Advanced Metering. July 20.
U.S. Department of Energy and U.S. Environmental Protection Agency. 2006. National Action Plan for Energy Efficiency. July.
U.S. Department of Energy. 2006. Five-Year Program Plan For Fiscal Years 2008 to 2012 for Electric Transmission and Distribution Programs. August.
U.S. Department of Energy and U.S. Environmental Protection Agency. 2007. National Action Plan for Energy Efficiency Vision for 2025: Developing a Framework for Change. November.
U.S. Department of Energy. 2007. State and Regional Policies that Promote Energy Efficiency Programs: A Report to The United States Congress Pursuant to Section 139 of the Energy Policy Act of 2005. March.
U.S. Energy Information Administration. 2006. Electric Power Annual.
U.S. Energy Information Administration. 2006. Residential Natural Gas Prices: What Consumers Should Know (Brochure). November.
U.S. Energy Information Administration. 2008. 2008 Annual Energy Outlook Overview.
U.S. Environmental Protection Agency. 2006. Clean Energy-Environment Guide to Action: Policies, Best Practices and Action Steps for States. April.
Vermont Department of Public Service. 2006. Update to the 2005 Vermont Electric Plan. October 20.
Xcel Energy. 2006. 2007/2008/2009 Triennial Plan, Minnesota Natural Gas and Electric Conservation Improvement Program.