Volume of Early Atlantic Slave Trade-novo
46
The Volume of the Early Atlantic Slave Trade, 1450-1521 Author(s): Ivana Elbl Source: The Journal of African History, Vol. 38, No. 1 (1997), pp. 31-75 Published by: Cambridge University Press Stable URL: http://www.jstor.org/stable/182945 Accessed: 23/05/2009 14:55 Your use of the JSTOR archive indicates your acceptance of JSTOR's Terms and Conditions of Use, available at http://www.jstor.org/page/info/about/policies/terms.jsp. JSTOR's Terms and Conditions of Use provides, in part, that unless you have obtained prior permission, you may not download an entire issue of a journal or multiple copies of articles, and you may use content in the JSTOR archive only for your personal, non-commercial use. Please contact the publisher regarding any further use of this work. Publisher contact information may be obtained at http://www.jstor.org/action/showPublisher?publisherCode=cup. Each copy of any part of a JSTOR transmission must contain the same copyright notice that appears on the screen or printed page of such transmission. JSTOR is a not-for-profit organization founded in 1995 to build trusted digital archives for scholarship. We work with the scholarly community to preserve their work and the materials they rely upon, and to build a common research platform that promotes the discovery and use of these resources. For more information about JSTOR, please contact [email protected]. Cambridge University Press is collaborating with JSTOR to digitize, preserve and extend access to The Journal of African History. http://www.jstor.org
description
d
Transcript of Volume of Early Atlantic Slave Trade-novo

The Volume of the Early Atlantic Slave Trade, 1450-1521Author(s): Ivana ElblSource: The Journal of African History, Vol. 38, No. 1 (1997), pp. 31-75Published by: Cambridge University PressStable URL: http://www.jstor.org/stable/182945Accessed: 23/05/2009 14:55
Your use of the JSTOR archive indicates your acceptance of JSTOR's Terms and Conditions of Use, available athttp://www.jstor.org/page/info/about/policies/terms.jsp. JSTOR's Terms and Conditions of Use provides, in part, that unlessyou have obtained prior permission, you may not download an entire issue of a journal or multiple copies of articles, and youmay use content in the JSTOR archive only for your personal, non-commercial use.
Please contact the publisher regarding any further use of this work. Publisher contact information may be obtained athttp://www.jstor.org/action/showPublisher?publisherCode=cup.
Each copy of any part of a JSTOR transmission must contain the same copyright notice that appears on the screen or printedpage of such transmission.
JSTOR is a not-for-profit organization founded in 1995 to build trusted digital archives for scholarship. We work with thescholarly community to preserve their work and the materials they rely upon, and to build a common research platform thatpromotes the discovery and use of these resources. For more information about JSTOR, please contact [email protected].
Cambridge University Press is collaborating with JSTOR to digitize, preserve and extend access to TheJournal of African History.
http://www.jstor.org

Journal of African History, 38 (1997), pp. 3 -75 3 Copyright ? 1997 Cambridge University Press
THE VOLUME OF THE EARLY ATLANTIC SLAVE
TRADE, 1450-1521
BY IVANA ELBL
Trent University
ALTHOUGH slaves were the most common merchandise1 in the Portuguese- dominated opening period of the seaborne trade between Europe and Africa, relatively little conclusive information is available on their overall numbers. Even less is known about the distribution of these early exports of slaves in space and time, although these are two of the key factors in assessing the much debated societal impact of the early Atlantic slave trade and the role of slavery in West and West-Central African economic, social and political life.2
The paucity of the surviving numerical sources makes answers very difficult to formulate particularly in the early era. Even in later periods, for which substantially more data are available, the surviving sources reveal only a part of the total volume of African slave exports. As David Henige pointed out, missing are the slaves who might have been recorded in sources not yet known to historians and in sources now lost, not to mention unregistered exports and unrecorded transit mortality.3 Any estimate based on surviving numerical data is thus necessarily minimalist. Missing numbers are a particularly pressing consideration in the case of the early Atlantic slave trade, for which the sources are few, very fragmentary and difficult to analyze, and where the contemporary general estimates seem to be contra- dicted by the available quantitative data, the former suggesting much higher volume of trade than the latter. Modern historians have magnified this confusion by placing emphasis exclusively either on estimates contained in narrative documents or on the figures preserved in the few well-known letters of quittance issued to Crown officers,4 without attempting to reconcile the two kinds of figures (see Table i). Another problem is that the vast majority of the quantitative data relate only to the slave dealing activities of
1 While the most common, slaves were not necessarily either the most profitable or the most desired commodity: the cost of shipping and handling was high and the potential of loss due to mortality serious. For a discussion of these factors in the context of later periods see D. Eltis, 'The relative importance of slaves and other commodities in the Atlantic trade of seventeenth-century Africa', J. Afr. Hist., xxxv (1994), 237-49; E. van den Boogaart, 'The trade between western Africa and the Atlantic world, I600-90', J. Afr. Hist., xxxIII (1992), 369-85; and R. N. Bean, 'A note on the relative importance of slaves and gold in West African exports', J. Afr. Hist., xv (I974), 35 -6.
2 The other key factors include sex, age and ethnic group distribution. For a review of the debate see P. E. Lovejoy, 'The impact of the Atlantic slave trade on Africa: a review of the literature', J. Afr. Hist., xxx (1989), 365-94, and J. Thornton, Africa and Africans in the Making of the Atlantic World (Cambridge, 1992), 72-5.
3 D. Henige, 'Measuring the immeasurable: the Atlantic slave trade, West African population and the Pyrrhonian critic', J. Afr. Hist., xxvII (1986), 296-8. The names of the categories have been paraphrased to suit the context of the present article.
4 For a discussion of letters of quittance, see the section 'Evaluation of sources' below.

IVANA ELBL
Table i. Existing estimates of the volume of the early European slave trade with Atlantic Africa, I450-I521 (in ascending order, from lowest to highest volume projection)a
Author and year of estimate
Verlinden (1959)b
Curtin (1969)?
Vogt (I973)d
Periods covered
1486-1498
1451-1475 1476-1500 1501-1525
Annual averages
883
600
740 1,700
1486-1521 I,000
Lovejoy 145I-I475 (I982)e 1476-1500
1501-1521
Saunders 1441-1470 (I982)f 1470-1490
I490-I530
Luttrell (I965)g
Godinho (I984)h
704-800 872-988
2,000-2,268
0-I,000 no data 300-2,000
I44I-1500 1,695
I450-I459 1460-1469 1470-I475 1476-1495 I496-1505 I506-1599
955-I,I36 1,455-1,636 2,122-2,636
3,955-4,136 3,455-3,636 2,000-3,000
Maximum volume
projection for
1450-1521
63,576
Type of evidence used
royal quittances, 1486-98
69,940 evaluation of Deerr's estimate, based on Cadamosto and a parallel with the Atlantic Islands
72,000 royal quittances, I486-98; some other quantitative data
93,128 Curtin, plus adjustment for transit losses
104,000 reconciliation of
contemporary estimates of potential and of quantitative evidence
122,034 unidentified
210,616 contemporary estimates of potential and quantitative data (the former prevailing), in particular Cadamosto and Pacheco Pereira
a The existing estimates are difficult to compare. They look at different aspects of the trade and different evidence from different periods. Except for Curtin and Lovejoy, none adopted the same periodization and none considers exactly the same period as this paper. Thus, to gain an idea of how the existing estimates relate to the period I450-I52I, it was necessary to reduce them, whenever possible, to a
[Table I notes continued on p. 33
Index
9I
100
103
I33
I49
175
30I
32

VOLUME OF THE EARLY ATLANTIC SLAVE TRADE, 1450-1521 33
common denominator. First, all the estimates were reduced to annual averages (see the column 'Annual averages') for the periods covered. Then the maximum estimate for the entire period was calculated by multiplying the averages of annual volume by the number of years in each period identified and adding up the sub- totals to achieve a projected total for the period 1450-1521. The calculation is listed in detail in the notes on individual estimates. It is noted that in some cases the calculations may be conjectural, but the overall result shows quite clearly the range of opinions on the subject.
b C. Verlinden, L'esclavage dans l'Europe me'dievale (Bruges, 1959), i, 626-8. Verlinden concentrated on the quittance issued to the almoxarife of the Slave House for 1486-93, and supplemented it with the letter of quittance to the almoxarife of Lagos for I490-8. He reached an annual total of 883 slaves, and considered it too high (ibid. 127-8). See column 'Maximum volume projection': 883 slaves per year x 72 years. This projection is highly conjectural and the sample period (1486-98) too short to serve as a safe base.
e P. D. Curtin, The Atlantic Slave Trade: A Census (Madison, 1969), iI6, Table 33. Curtin's estimates were based mainly on a critical evaluation of Deerr's data for the Atlantic Islands, which in turn are mostly built on Cadamosto's contemporary estimate of the Arguim trade in the I45os and on parallels with developments in the Caribbean (ibid. 17-20; Deerr, The History of Sugar [London, I950], ii, 283). See column 'Annual averages': 1451-75 (15,000 slaves:
25 years); I476-I500 (18,500 slaves: 25 years); 1501-25 (42,500 slaves: 25 years); also column 'Maximum volume projection': 600 slaves per year x 25 years (1450-74)+740 slaves per year x 26 years (I475-I500) + ,700 slaves per year x 2I
years (1501-2I). d J. L. Vogt, 'The Lisbon Slave House and the African trade, I486-1521',
Proceedings of the American Philosophical Society, CXVII (1973), 8. Vogt, after examining the documents concerning the Lisbon Slave House, suggested that the annual volume of the entire Portuguese slave trade could not have been more than I,000 slaves a year. See column 'Maximum volume projection': I,ooo slaves per year x 72 years. This is a conjectural projection: the sample period (1486-152I) does not cover the first three decades of the trade.
e P. D. Lovejoy, Transformations in Slavery (Cambridge, 1983), 36, Table 2.3. See column 'Annual Averages': I451-75 (17,600 slaves-2o,ooo slaves: 25 years); 1476-1500 (21,000-24,700 slaves: 25 years); 1501-21 (50,000-56,700 slaves: 25 years). Also column 'Maximum volume projection': 800 slaves per year x 26 years (I450-75)+988 slaves per year x 25 years (I476-I500)+2,268 slaves per year x 2 years (150I-2I).
f A. C. de C. M. Saunders, A Social History of Black Slaves and Freedmen in Portugal, 144I-1555 (Cambridge, 1982), 19-23. Only slaves who entered Portugal are included. Saunders points out that the figures derived from the two key letters of quittance used by Verlinden and Vogt, which supposedly represented the total imports of slaves to Portugal, were smaller than the re-exports of slaves to Valencia in the same period. The explanation was that while all slaves were required by law to pass through Portugal, they did not necessarily have to be cleared through, and therefore registered by the Slave House (Casa dos Escravos). A substantial number of slaves could have been cleared by customs agencies closer to the source. On this ground, Saunders suggested that the contemporary annual estimate of 3,500 slaves reported by Pacheco Pereira might be quite reasonable, especially for the sixteenth century. Saunders also made a concerted effort at reconciling contemporary estimates with quantitative data but, given the focus of his book, only with regard
[Table i notes continued on p. 34

the Portuguese Crown, obscuring the share commanded by private slave trade.
The purpose of this article is to establish a comprehensive estimate of the early Atlantic slave trade, based on an exhaustive collection of data, newly
to the number of slaves actually landed in Portugal. Saunders' figures thus do not include slaves retained on the islands in the Atlantic and in the Gulf of Guinea, or those shipped to Mina. His actual estimate of slave imports to Portugal is deliberately vague and the margin extremely broad. See column 'Maximum volume projection': I,ooo slaves per year x 40 years (1450-89)+ 2,000 slaves x 32
years (1490-I52I). This projection must be considered highly conjectural because: (i) the original estimate counted only slaves who actually entered Portugal; and (ii) the maximum of i,000 slaves per year for 1441-70 has been used to fill the 1470-90 gap in the estimate.
g A. Luttrell, 'Slavery and slaving in the Portuguese Atlantic (to about I500)', in The Transatlantic Slave Trade from West Africa (Edinburgh, I965), 68. See column 'Annual averages': ioo,ooo slaves; 59 years. See column 'Maximum volume projection': 1,695 slaves per year x 72 years. Another conjectural pro- jection: the original estimate ends in I500.
h V. Magalhaes Godinho, A economia dos descobrimentos Henriquinos (Lisbon, I962), 208-9 and V. Magalhaes Godinho, Os descobrimentos e a economia mundial (Lisbon, I984), iv, i6-8. Godinho also attempted a reconciliation of the con- temporary estimates of potential (in particular Cadamosto and Pacheco Pereira) and quantitative evidence. He is to be credited with the most comprehensive treatment of data relating to the volume of the early Portuguese slave trade with West Africa. Apart from the wide, but not exhaustive array, of both narrative and quantitative data, the most valuable aspect of Godinho's I984 contribution was his method: he clearly saw the need to arrange the available data according to regional provenance and distribution in time. Godinho's partial estimates for individual regions and periods are often more important than his overall figures, because they can be evaluated against concrete historical developments. Despite Godinho's innovative approach, his estimates embody two serious weaknesses. The first is the lack of clear periodization of the sixteenth-century slave trade. Compared to his treatment of the first fifty years of the trade, the period after I505 is very fuzzily defined, and the data, which range over a century, are often piled up without any clear order. The second and even more troubling problem is that Godinho neither explained the reasoning behind any of the estimates nor linked the raw data with the projected figures. The estimates thus appear arbitrary and are open to criticism.
See column 'Annual averages': 1450-9: 455-636 slaves from Arguim (25-35,000 slaves: 55 years [1450-1505])+500 slaves from Upper Guinea (5,000 slaves: io
years [I450-9]); I460-9: 455-636 slaves from Arguim+ I,000 slaves from Upper Guinea (io,ooo slaves: io years [I1460-9]); I470-5: 455-636 slaves from Arguim + 1,667-2,000 slaves from Upper Guinea (io,000-i2,000 slaves: 5 years [I470-5]);
I476-95: 455-636 slaves from Arguim+3,500 from Upper Guinea; I496-I505: 455-636 slaves from Arguim+ 2,500 from Upper Guinea (I495-I505)+ 500 from Lower Guinea. Also column 'Maximum volume projection': I,136 slaves per
year x io years (1450-9)+ 1,636 slaves per year x io years (146o-9)+2,636 slaves
per yearx6 years (I470-5)+4,I36 slaves per yearx20 years (I476-95)+3,636 slaves per year x io0 years (I496-I505)+ 3,000 slaves per year x I6 years (1506-21).
34 IVANA ELBL

VOLUME OF THE EARLY ATLANTIC SLAVE TRADE, 1450-1521 35
added sources,5 and systematic evaluation of the diverse evidence relevant to its volume in the period I450-1521, when it remained almost exclusively under the control of Portugal.6 The first section of the paper describes the available sources, evaluates them and outlines calculation methods applicable to them; the second section establishes the respective shares of the Portu- guese Crown and of private parties engaged in the Atlantic slave trade. The third section estimates the temporal and spatial distribution of slave exports from Atlantic Africa, based on reconciliation of contemporary volume estimates and quantitative data. The conclusion addresses the general patterns in the early Atlantic slave trade in terms of supply and demand mechanisms, and in the context of the debate on the European impact on slavery and slave trade in Africa.
EVALUATION OF SOURCES AND CALCULATION METHODS
Contemporary volume estimates
Contemporary volume estimates contained in narratives - travelogues, chronicles or diplomatic and commercial reports - are the most commonly used sources of information on the volume of the early slave trade. Relatively few are available. Cadamosto, a young and adventurous Venetian trader, observed that 8oo-i ,ooo slaves were exported each year from Arguim, off the coast of Mauritania, in the I450s.7 Duarte Pacheco Pereira, a royal pilot, reported on the basis of his personal experience in West Africa in the I480S and I490s that 3,500 slaves were exported yearly from the area between the Senegal River and Sierra Leone when trade was good, but substantially fewer at other times.8 Of these, 400 came from the Senegal River in a good year, and fewer than 200 in a bad one.9 Cha' Masser suggested that at least 2,000 slaves were imported to Portugal each year in the early I50os.10 In 1516, Bernardo Segura, a Crown inspector, estimated the slave trading potential at 6,750 for the following year, 1517, based on the assumption that nine ships were available to undertake three expeditions a year, each bringing back some 250 slaves.1
5In particular tax farms, leases on slave-trading regions and assessments of revenue potential.
6 The year 1450 represents the approximate beginning of the commercial slave trade. Gomes Eanes de Zurara designated 1448 as the end of the raids, but the first documented commercial expeditions date only to the early I450s. 1521 is the year of the death of D. Manuel, the last Portuguese king strongly interested in West Africa, and it also marks the beginning of the decline in Portuguese fortunes in West Africa and of a somewhat scantily documented period as far as the slave trade is concerned.
7 L. de Cadamosto, Viagens de Luis de Cadamosto e de Pedro de Sintra (Lisbon, 1948), i8.
8 Duarte Pacheco Pereira, Esmeraldo de situ orbis, ed. A. E. da Silva Dias (Lisbon, 1905; reprinted 1975), 98. 9 Ibid. 79.
10 L. L. Cha Masser, 'Relacao', Carta de el-Rei D. Manuel ao Rei Catholico narrando- lhe as viagens portuguezas a India desde 15oo ate I505... seguem em appendice a relacao analoga de Lunardo Cha Masser e dois documentos de Cantino e Pasqualino, ed. P. Peragallo (Lisbon, I892), 82-3.
11 Ant6nio Brasio (ed.), Monumenta missionaria africana: Africa Occidental (17 vols.) (Lisbon, 1952-continuing), i (1471-1531), 379, doc. Io8.

The reliability of this information is subject to debate. As P. D. Curtin has shown, such data usually represented a personal estimate by informed outsiders as to what they thought the volume of trade was at a given time, and their estimates may be substantially higher than the actual volumes of trade.12 In the case of the British slave trade in I70I-I807, Curtin demon- strated that contemporary estimates proved to be consistently c. 90 per cent higher than his 'preferred series'.13 If this percentage is assumed to apply to all contemporary estimates, a formula dividing an estimate by I90 and multiplying the result by ioo would presumably yield the actual volume of trade, as would deducting 47 per cent from the estimate. On its own, this assumption is admittedly arbitrary, but it can be very helpful in adjusting the contemporary estimates, if the adjustments can be corroborated from other evidence.
Direct and indirect quantitative evidence
The surviving quantitative evidence presents many problems. Only a small portion of the surviving data falls into the category P. D. Curtin has identified as optimal 'direct evidence'-'a systematic record of the slaves imported through a particular port or into a given colony over a period of years'.14 The only sources registering day-to-day transactions for the Portuguese in this period are the 1513-16 customs register from the Cape Verde Islands, the 1508 and I519 ledgers of the Arguim factory, and the bailiff's customs registers of slave imports to Valencia from I445 to i5i6.15 There also exists a number of bills of lading or cargo manifests, the second type of 'direct evidence' mentioned by Curtin,16 especially in connection with the Arguim slave trade.17 The problem with the bills of lading as sources is that some of them tend to overlap with data derived from documents covering longer periods, for example, factory ledgers or letters of quittance. Double-counting is thus an ever-present danger. Bills of lading can, however, serve as evidence for periods not covered by longer-run series, or, especially, the letters of quittance can accentuate yearly fluctuations
12 Curtin, The Atlantic Slave Trade, I7. 13 Ibid., I48. Curtin's term 'preferred series' refers to the reconstruction of the slave
trade volume in a given location, based on the most optimal numerical sources available. 14 Ibid. I5. 15 Arquivo Nacional da Torre do Tombo [hereafter ANTT], Ndcleo Antigo [hereafter
NA], no. 888 ('Livro da feitoria de Arguim', 1508); ANTT, NA, no. 889; ANTT, NA, no. 757 ('Livro dos quartos e vintenas', Ribeira Grande, Santiago, Cape Verde Islands, 1513-I6), published in Luis de Albuquerque and Maria Emilia Madeira Santos (eds.), Histdria geral de Cabo Verde: corpo documental (2 vols.) (Lisbon, I990), ii, 35-328; A. Teixeira da Mota, 'Entree d'esclaves noirs h Valence (1445-I482): le remplacement de la voie saharienne par une voie atlantique', Revue franfaise d'histoire d'outre-mer, LXVI
(I979), I95-2IO; V. Cortes [Alonso], La esclavitud en Valencia durante el reinado de los reyes catdlicos (I479--I516) (Valencia, I964), 217-471; V. Cortes Alonso, 'Valencia y el siglo XV', Studia, XLVII (1989), 8I-145. 16 Curtin, Atlantic Slave Trade, i6.
17 These documents are preserved in the ANTT, scattered across the monumental collection of 40,000 short documents called 'Corpo Cronol6gico' (hereafter 'CC'). For some examples see ANTT, CC, parte II, maco ii, docs. I4, i6, I7, I48; CC, parte II, maco I4, doc. 22; CC, parte II, maco 28, doc. 89; CC, parte II, maco 58, doc. I55; CC, parte II, maco 62, doc. 92; CC, parte II, maco 65, doc. 39.
36 IVANA ELBL

VOLUME OF THE EARLY ATLANTIC SLAVE TRADE, I450-I521 37
within periods covered that would otherwise be smoothed over by the annual
averages derived from the other sources. The royal letters of quittance (cartas de quitafao) constitute the most
common source of the surviving numerical data. A letter of quittance was a document the Crown issued to its high-ranking employees as a token of honourable discharge for a period of service in a specific position. It could either simply declare that the office holder had fulfilled his duties to the Crown's satisfaction and was declared released and free (quite e livre) of any further accountability, or it could contain a detailed summary of accounts.18 These summaries were prepared from actual ledgers listing day-by-day transactions. In principle, the letters of quittance are only one step removed from the status of 'direct evidence', but in practice the uneven degree of detail and consistency in this source reduce their informative value.
Most of the surviving documents containing quantitative data on the early slave trade were generated for the internal use of those Crown agencies that administered the Crown's direct commercial interests overseas. The nu- merical data from them are thus likely to give disproportionate prominence to the Portuguese Crown's share of all commercial activity and may, unless caution is exercised to account for private slaving, lead to an artificially low overall estimate of the early Atlantic slave trade.
First of all, the slave trade was of only secondary interest to the Crown. While in the early years the Crown often sent its own ships to the slave
trading regions,19 after the founding of Sao Jorge da Mina, on the Gold Coast, in 1481 it concentrated mostly on the gold trade and left much of the slave trading to lease holders and private merchants. The sole exception was the royal factory at Arguim, and even there the factor was expected to concentrate on purchases of gold rather than slaves. The Crown trade alone thus does not accurately reflect the supplies of slaves taken from African markets.
More importantly, however, the numerical sources tend to obscure the share of private participants in the slave trade. The slaves recorded as received by the almoxarife of the Slave House in Lisbon (Casa dos Escravos) or by the factor of the Guinea House (Casa da Guine e Mina), also in Lisbon, include both those acquired directly by the Crown and brought to Portugal and those received there in payment of customs or lease instalments, if
payments were required in kind.20 Thus, while in principle the sources generated by Crown agencies record the total number of slaves purchased by the Crown, they reflect privately traded slaves only to the extent that they were paid to settle customs and tax obligations. The slave trade figures listed
18 Most surviving quittances were published by A. Braamcamp Freire as 'Cartas de quitacao del-Rei Dom Manuel', Archivo Historico Portugues, I-X (I903-I5).
19 See, for example, Archivo Municipal de Sevilla, Actas Capitulares, 1452, Aug.-Oct., f. 89; Diogo Gomes, As viagens dos descobrimentos, ed. J. M. Garcia (Lisbon, 1983), 45-6. 20 The rent on the Sierra Leone trade and revenue from the farm on the Cape Verde Islands in 1511, for example, were payable in slaves (ANTT, NA, no. 532, ff. ioo and 103). However, Marchione's 1486-95 rent was payable in money (ANTT, Livro i da Estremadura, f. 268), contrary to Verlinden's opinion (Verlinden, L'esclavage dans l'Europe medievale, i, 626-7). See also John L. Vogt, 'The Lisbon Slave House and the African trade, 1486-152 ', Proceedings of the American Philosophical Society, cxvII (1973), I4.

in the internal documents of the Crown agencies are thus, in most cases, very incomplete indicators of overall volume in the trade.
If analyzed with care, however, the Crown records can provide a basis for estimating the volume of the private share in the slave trade, in terms of both direct and indirect evidence. The most important source in the direct category is the Customs Register of the Cape Verde Islands (I513-I6),21 which gives us an unequivocal idea of the impressive volume of trade carried on by the settlers during those years. Unfortunately, this document is the only one of its kind surviving. The rest of the available customs data must be derived from less optimal sources - letters of quittance of royal customs officials and tax farm documents. Letters of quittance issued to the royal almoxarifes (administrative officers also acting as revenue collectors) are more reliable for reconstructing the overall volume of the private slave trade than the tax farms, because the revenue the almoxarifes gathered constituted a set portion of the declared merchandise. This portion could be either the quarto (25 per cent of the merchandise cleared) or the quarto and vintena (28-75 per cent of the merchandise cleared).22 A simple formula - volume of customs receipts divided by the percentage of the total merchandise they represented and multiplied by Ioo23- will yield acceptable overall volume estimates.
The one complication with this type of estimate is the fact that the customs were not always levied in slaves but were sometimes collected in money, or in goods other than slaves. A sum of money can be converted into the approximate number of slaves it represents if the customs in specie are divided by the average price of a slave in the importing region, obtaining the number of slaves paid in customs. The average wholesale prices/assessed values per slave in Portugal was 5,900 reis;24 in the Cape Verde Islands 3,900 reis;25 and in the Gulf of Guinea Islands 4,000 reis.26 The total volume of slaves cleared can be obtained by dividing the number of slaves equivalent to the customs payment by the customs rate and multiplying the result by oo100.
21 ANTT, NA, no. 757. 22 Vintena literally means 'one-twentieth' or 5 per cent of the total sum. However, in
practice it was calculated from that part of merchandise which was left after the quarto had been deducted: i.e. 75 per cent of the total. The vintena thus represented an actual toll of only 3-75 per cent. The combined quarto and vintena therefore amounted to 28-75 per cent of the declared merchandise.
23 For example, customs receipts of ioo slaves from the quarto and vintena mean an overall shipment of 348 slaves. If only quarto had been collected, the overall shipment would have been 400 slaves.
24 The average wholesale price in 1485-1510 was 5,005 reis and in 1510-21, 6,835 reis. The overall average wholesale price was (5,005 +6,835) divided by 2 = 5,920; rounded down = 5,900. I. Elbl, 'The Portuguese trade with West Africa, I440-I521' (Ph.D. thesis, University of Toronto, I986), Table 39.
25 Elbl, 'Portuguese trade', Tables 28 and 28a. 26 Because numerical data comparable to those used in calculating the average price per
slave in Portugal and the Cape Verde Islands are not available for Sao Tome and Principe Islands, the Crown price of 4,000 reis paid for slaves to the merchants of these islands by the factor of Sao Jorge da Mina will be used as the average wholesale price: J. M. da Silva Marques, Descobrimentos portugueses: documentos para a sua hist6ria (3 vols.) (Lisbon, 1971), iii, 429, doc. 289.
38 IVANA ELBL

VOLUME OF THE EARLY ATLANTIC SLAVE TRADE, I450-I52I 39
Thus, for example, if the average price of a slave was 3,900 reis and the customs paid in money were I 80,ooo reis, the money collected represents an equivalent of 46 slaves and implies that a total of 16 I slaves had been cleared. This calculation inevitably introduces an element of inaccuracy, but there is evidence that it remains within tolerable limits, as the following example demonstrates. The above figure of I8o,ooo reis represents the customs receipts received in specie by the almoxarife of the Cape Verde Islands in the last four months of 1513. As outlined, this figure implied a total clearance of 161 slaves. In addition, the almoxarife received 49 slaves in taxes paid in kind, suggesting the clearance of I70 more slaves. The calculation thus implies that the almoxarife had cleared an overall total of 331 slaves. He did in fact clear 384 slaves, and the calculation embodies a 14 per cent underestimate. In this particular case, the difference was caused by a large number of low-priced slaves among those taxed in specie. Given the fact that this calculation opens up a whole new class of valuable and previously unexploited quantitative data, the margin of inaccuracy can be deemed acceptable.
Tax farms, revenue potential assessments and leases
A similar method of calculation can be also applied to another group of hitherto untapped sources, which straddles the categories of contemporary volume estimates and indirect quantitative evidence. The group includes tax farms, royal assessments of revenue potential and trading leases. The tax farms are excellent indicators of slave trade volume. Like other sources of revenue, the Crown often ceded customs and other income from the African trade to private entrepreneurs, in exchange for fixed sums of money. This payment represented, at the very least, the minimum revenue obtainable from the farmed area. The potential number of slaves involved can be determined by dividing the tax farm payment by the average wholesale price per slave, either in Portugal or at a place of clearance closer to the source region. However, as the tax farmer would expect not only to recoup the outlay but also to make a profit, the total of the farm should be augmented by a sum deemed necessary to make the venture viable for the entrepreneur. There is sufficient evidence to believe that these leases and tax farming ventures usually did not result in a loss.27 To calculate the increment, the documented ventures (one lease and two tax farms) were examined in order to establish a sample profit margin. The results in all three cases were
27 Bartolomeu Marchione, for example, was not only able to meet the lease payments (Braamcamp Freire, 'Cartas', IV, 477-8, doc. 404) but exceed them by c. 31 per cent through his slave exports to Valencia alone (see following note). Similarly, there is evidence that all the tax farmers and lease-holders with interest in Upper Guinea, the prime slave exporting regions, met their payments (compare the data in 'Alfandegas e Rendimentos do Reino, I51 ', ANTT, NA, no. 532, ff. 100-20, with the receipts of the almoxarife dos escravos 1511-13, Chancelaria de D. Manuel, Liv. ii, f. 69v; Liv. 6 de Misticos, f. I30; published in Braamcamp Freire, 'Cartas', III, 440-I, doc. 297) but also made a profit (see following note). This assumption is also supported by the increase in the annual payments imposed by the Crown; ibid.

remarkably consistent: 31 per cent,28 33 per cent29 and 34 per cent.30 The
average of the three figures, 32 per cent, will be used as an assumed average gross profit margin to calculate the overall volume of slave trade that the tax farms represented. The resulting figure will inevitably be arbitrary, but in the absence of more direct evidence the result may allow us to obtain a more balanced picture of the volume of the private slave trade.
In principle, this method of calculation also applies to the lease payments that private entrepreneurs (tratadores, rendeiros) made to secure trading privileges in certain trading regions. Such a lease entitled the tratador either to pursue trade within his trato or resgate (trading region) alone and to the exclusion of non-licensed parties or to issue trading licenses to third parties. The level of lease payments was reassessed at regular intervals by the officials
28 Marchione's lease on trade with West Africa, I486-95; Braamcamp Freire, 'Cartas', III, 477-8, doc. 44; and Ieronimo Miinzer, 'De inventione Africae', in A. Brasio (ed.), Monumenta missionaria africana Africa Occidental, 2a ser. (3 vols.) (Lisbon, 1958), i, 246. The number of slaves needed to pay the yearly lease can be obtained by dividing the
yearly lease of i,ioo,ooo reis by the average wholesale price per slave in Portugal, i.e.
5,900 reis per slave: I,Ioo,ooo reis divided by 5,900 reis = I86 slaves. Marchione thus needed approximately i86 slaves to pay the lease. In 1489-95, Marchione exported on
average 270 slaves per year to Valencia for sale (Cortes, La esclavitud, 230-82). If Valencia was his only market, Marchione's gross profit (unadjusted for operating expenses and
overheads) can be calculated by deducting from the 270 slaves exported to Valencia the i86 slaves needed to pay the lease. Marchione would have been left with 84 slaves, which represent 31 per cent of his exports to Valencia. The profit margin, of course, could have been higher if Marchione also sold slaves in locations other than Valencia. The present calculation thus represents a minimum gross profit margin.
29 Tax farm on the quarto of the Cape Verde Islands, I504-7 (ANTT, CC, parte II, mago 8, doc. 104). The tax farmer was required to make a payment of 2,100oo,ooo reis over the three years of the contract; that means 700,000 reis per year. To arrive at a possible profit margin, this yearly payment of 700,000 reis can be compared to an average of three documented quarto yields from the period I49I-I515. Because the I504-7 tax farm is conveniently placed at the mid-point of this period, there is reason to believe that the
range of the yield will make up for the possible fluctuation in the volume of trade in this
period. First yield: the annual quarto and vintena yield in 149I-3 was 864,500 reis, representing 28-75 per cent of the total number of slaves cleared. The amount of quarto without vintena can thus be calculated if we divide the sum of 864,500 reis by 28-75, multiply the result by ioo and divide the total by 4 to obtain 25 per cent, the amount of the quarto. The result is 751,739 reis. Second yield: in I514, the documented quarto and vintena payments brought 1,466,156 reis. Following the same procedure as in the I491-3 instance, we arrive at a quarto yield of 1,274, 82 reis. Third yield: in I515, the documented quarto and vintena yield was 1,270,854 reis. Following the same procedure as above, we obtain a quarto yield of I, 105,094 reis. The average annual quarto yield, based on the three documented instances, is I ,043,672 reis. The tax farmer's gross profit margin can be obtained, with acceptable reliability, if we deduct the annual tax farm payment of
700,000 reis from the average annual quarto yield of 1,043,672 reis. The result is 343,672 reis, which represents 33 per cent of the quarto yield.
30 The tax farm on the quarto and vintena of the Cape Verde Islands, 1510-I3 (Brasio [ed.], Monumenta, 2a ser., ii, 4I, doc. 15), required an annual payment of 9oo,ooo reis. We can compare this sum to the documented quarto and vintena yields from 15I4 and I515, the two years immediately following the end of the tax farm. In I514, the quarto and vintena yield was 1,466,I56 reis; in 1515 it was 1,270,854 reis. Based on the two above
instances, the average annual yield comes to 1,368,505 reis. If we deduct from this sum the annual tax farm payment of 900,000 reis, we obtain a gross profit margin of 468,505 reis, which represents 34 per cent of the average yield.
40 IVANA ELBL

VOLUME OF THE EARLY ATLANTIC SLAVE TRADE, 1450-1521 41
of the Guinea House (Casa da Mina e Guine) according to the trading potential of the region.31 Lease payments on primarily slave-exporting regions can therefore be taken as indirect evidence for the volumes of the slave trade within them. In some leases, slaves were actually stipulated as the required means of payment. The lease payments represent the minimal revenue the Crown estimated it could derive from a given region in addition to the usual customs. Unlike the tax farms, the leases cannot serve as a basis for estimating the full trade of the regions covered. The lease-holder not only expected to issue licences to other traders to increase his profit, but he also had to compete with other beneficiaries of entrenched commercial privileges. The lease-holders in Senegambia and Guinea Rivers, for example, had to compete with the Cape Verde Islanders, who had the right to trade all along the coast explored up to 1466, the year in which they had been granted the Royal Charter of Privileges that guaranteed them freedom of trade with the mainland.32 In the Gulf of Guinea, the lease-holders had to contend with similar claims asserted by settlers on the islands of Sao Tom6 and Principe.33 The lease figures can thus serve only as data relating to the lease-holders' shares of the slave trade, or at best as indicators of the strictest minimum of slaves obtainable from a certain region.
Even when assembled and analyzed, the available sources, including the new types of evidence identified above, are likely to prove insufficient to provide a systematic picture suitable for statistical analysis. They are liable, however, to reveal the general dimensions and components of the trade and help determine the distribution of slave exports in space and time. Only a lower boundary, minimalist estimate can however be expected from this analysis,34 given that the overwhelming majority of direct quantitative evidence has been lost.
THE VOLUME OF THE CROWN AND PRIVATE SLAVE TRADE
The Crown slave trade
The Crown received slaves bought directly by its agents, and in payments in slaves made by third parties, through three main locations - the central agencies in Portugal, the Arguim factory off the coast of Mauritania, and Sao Jorge da Mina, located on the Gold Coast, and two secondary ones - the Cape Verde Islands almoxarifado and factory, and the Sao Tome almoxari- fado. As far as Portugal is concerned, Lisbon, the seat of the Guinea House
31 The assessment was supposed to be carried out annually (Regimento das Casas das Indias e Mina, ed. D. Peres [Coimbra, I947], 25-6). Two examples survive: one from 1511, and one from I525 (ANTT, NA, nos. 532 and 590).
32 The text of the original I466 charter is preserved in ANTT, Livro das Ilhas, ff. Io-i I. The terms were curtailed in I472 (Silva Marques, Descobrimentos, iii, Io7-8, doc. 81), but many of the restrictions were soon lifted and in 15Io the terms of 1466 charter were re-confirmed (Brasio [ed.], Monumenta, 2a ser., ii, 38-9, doc. 14).
33 Silva Marques, Descobrimentos, iii, 428-9, doc. 289; ibid. iii, 585-7, doc. 370; ibid. iii, 587-8, doc. 361; ANTT, Livro das Ilhas, ff. 81-2.
34 The overall estimate will be minimalist because it cannot take into consideration such factors as Henige's categories 'b' (data not known yet), 'c' (data now lost), 'd' (unrecorded data) (Henige, 'Measuring the immeasurable', 296-8), unless we consider the most optimistic of the contemporary estimates as a top-level delimiter.

and of its auxiliary agency, the Slave House, was the main but not the only point of entry of slaves into Portugal. From 1473 onward, the Crown made periodic legislative efforts to force all traffic in slaves to pass through Lisbon, but with only partial success. Slaves continued to be cleared through other almoxarifados (revenue-collecting districts) and alfdndegas (custom houses). Lagos, a port town in the extreme south of Portugal, played a particularly important role. Not even all slaves purchased directly by the Crown passed through Lisbon, to be duly entered in the records of the central agencies. Only slaves purchased by the Arguim factory and by royal ships occasionally dispatched to trade off the coast of Upper Guinea were as a rule sent to Lisbon's Guinea House. Even in these instances, however, the records of the central agencies are often incomplete. The annual export records of the Arguim factory frequently show larger figures than the corresponding import figures of the Guinea House or the Slave House, even though it is clear from the appropriate letters of quittance issued to the Arguim factors that the slaves were in fact received in Lisbon. The same is true of the records of the Cape Verde Islands almoxarifado. Slaves from the Gulf of Guinea and, later, from West-Central Africa, either bought by royal agents, obtained from the settlers of Sao Tome or Principe or collected there by the local almoxarifes, were sold mostly in Sao Jorge da Mina and seldom passed through Lisbon. It is thus useful to present the available figures according to the locations to which they pertain.
Crown slaves received in Portugal
From 1486 to 1493, the almoxarife of the Slave House received 475 slaves annually.35 From 1494 to 1497, the factor of the Guinea House received 724 slaves annually, which represented a significant increase.36 In addition, the almoxarife of Lagos received o16 slaves annually between 1490 and I496.37 The data relating to the early I50os are more fragmentary. In the last four months of 1504 the Guinea House received 175 slaves of undisclosed provenance.38 Assuming that double that number arrived in the preceding two-thirds of the year,39 the total - 525 slaves - would suggest a decline of almost 37 per cent from the mid-I49os level. This figure, however, may be too optimistic, given that in I506-8 the number of slaves received by the almoxarife dos escravos was only 226 per year.40 In 1509-0o, the recebedor of
35 ANTT, Liv. I de Estremadura, f. 268; published in Braamcamp Freire, 'Cartas', III, 396-7, doc. 380.
36 ANTT, Chancelaria de D. Manuel, Liv. 17, f. 20; Liv. 5 de Estremadura, f. 98; published in Braamcamp Freire, 'Cartas', IV, 285-6, doc. 449.
37 ANTT, Chancelaria de D. Manuel, Liv. 31, f. 97v; Liv. i de Guadiana, f. I3Iv;
published in Braamcamp Freire, 'Cartas', III, 396-7, doc. 380. 38 ANTT, NA, no. 799, ff. 507-8v. 39 175 slaves were received in one third of the year. Assuming that the level of imports
was the same in the other two thirds, the calculation 175 x 3 = 525 will give the full yield. 40 ANTT, Liv. 13 de Estremadura, f. 22; published in Braamcamp Freire, 'Cartas', vI,
158, doc. 6i i. Calculation: 3,773,655 reis received for sale of slaves divided by 5,900 reis per slave = 640 slaves; 640 slaves +38 slaves received in kind = 678 slaves; 678 slaves divided by 3 years = 226 slaves per year.
42 IVANA ELBL

VOLUME OF THE EARLY ATLANTIC SLAVE TRADE, I450-I52I 43
the Slave House received in kind only 55 slaves.41 In the same period, however, the Slave House was leased out for 6,383,624 reis over two years.42 The annual payment, 3,I91,812 reis, suggests c. 541 slaves as the minimum number sold, assuming that the lease-holder broke even. If we adjust the number by a projected 32 per cent profit margin, the total would be 714 slaves per year.43 In both cases, the figures would be comparable to those from the I490S.
In 1511 , the Crown began to demand fees from tax farms and leases on trade with certain African regions in slaves rather than in specie.44 The impact of this policy is uncertain. In I 5 I -1 3 the almoxarife received in kind as many as 425 slaves annually.45 The majority of these, however, originated in Arguim.46 The rest may have come from lease and tax farm payments, but there is no direct evidence. On the contrary, all documented leases and tax farms made in this period appear to have been paid in money.47 The number of slaves received in kind dropped significantly in 1515-16, when the almoxarife dos escravos received only 143 slaves per year. This figure is
curiously low, given that in I514-I7 Arguim sent to Portugal, on average, as many as 744 slaves per year.48 This discrepancy is one of the examples of how incomplete the records of the Slave House are, even when it comes to the Crown slave trade alone, not to mention the overall Portuguese slave trade.
After 15 12 the Crown also began receiving direct shipments from Kongo, both as gifts from the King of Kongo and as merchandise. The volume is difficult to establish because the surviving documents frequently do not contain figures. Slaves arrived from 'Manicuongo' in 1513; in 1 54 a ship carrying slaves was stranded in Galicia; in 1515 a shipment of 78 slaves was announced; and in 1516 a ship with 400 slaves aboard was dispatched from Kongo.49 It would seem reasonable to assume that, starting in 15I3, the Crown obtained at least 200 slaves from West-Central Africa each year.
The Arguim factory
Arguim was the chief source of slaves directly purchased by the Crown. By the beginning of the sixteenth century, the conditions did not resemble the booming i,ooo slaves-per-year trade mentioned by Cadamosto. In I499-
41 ANTT, Liv. 6 de Misticos, f. 118; published in Braamcamp Freire, 'Cartas', III,
392, doc. 370. 42 ANTT, Liv. 6 de Misticos, f. II8; published in Braamcamp Freire, 'Cartas', III,
392, doc. 370. 43 Average annual lease payments = 6,383,624 reis divided by 2 years = 3,i91,812 reis.
Minimum number of slaves sold or cleared: 3,I91,812 reis divided by 5,900 reis per slave = 54I slaves. Number of slaves adjusted by a projected 32 per cent profit margin: 541 +32 per cent = 714 slaves. 44 ANTT, NA, no. 532, ff. Ioo and 103.
45 ANTT, Chancelaria de D. Manuel, Liv. II, f. 69v; Liv. 6 de Misticos, f. I30v; published in Braamcamp Freire, 'Cartas', II, 44I-2, doc. 298.
46 The factor of Arguim received 419 slaves in 151i, and an annual average of 294 slaves in 1512-13 (see Table 2).
47 ANTT, Chancelaria de D. Manuel, Liv. ii, f. 69; Liv. 6 de Misticos, f. I30; published in Braamcamp Freire, 'Cartas', II, 440-1, doc. 297.
48 Saunders, Social History of Black Slaves and Freedmen, 20, Table i. 49 Brasio (ed.), Monumenta, i, 278-80, docs. 75 and 76; 285-6, doc. 79; 339, doc. 90;
360, doc. 99.

1501, 257 slaves on average were bought each year.50 In 1505-8, the volume was down to I 19 slaves per year,51 but it picked up again in 1508-1 I, reaching an annual average of 543 slaves.52 In 1511-13, it dropped down to 294 slaves,53 and from January and August I514 the factory bought only 146 slaves.54
The trade increased again after I515. By adding up bills of lading, Saunders calculated that between July 1514 and August 1517 the captain of Arguim dispatched to Portugal at least 744 slaves per year.55 In i517-20, Arguim exports rose more dramatically to 1,340 slaves per year.56 There could have been many reasons for this increase, among them an improvement in the running of the trading station and an increase in the supply of slaves, as a result of drought and the wars that accompanied the redrawing of the political map of the territories of the dying empire of Mali. The main reason, however, may have been an inter-regional shift in the slave trade, away from the coast of Upper Guinea, prompted by the temporary suppression of the trading activities of the Cape Verde Islanders by the Crown in 1517-21.57
The Mina factory and the Gulf of Guinea
Approximately I o per cent of the gold the Crown factory bought in Mina was paid for in slaves.58 The factory therefore felt an acute need for a regular and plentiful supply of slaves. It had to rely mostly on shipments from the Gulf of Guinea, because there was no trade on the adjacent Ivory Coast, and on the Malagueta Coast the supply was too scattered and navigation dangerous in the rainy season.59 Trade with the Gulf of Guinea was more feasible. In I479, two caravels brought to Mina over 400 slaves purchased in the Niger Delta.60 As a source of supply, however, the Niger Delta presented many problems. The return passage was long, tedious and often dangerous. Moreover, the vessels used by the Mina factory were mostly small caraveloes that could only take a limited number of slaves.61 The trips of the Niger
50 ANTT, Livro das Ilhas, f. 42; published in Braamcamp Freire, 'Cartas', II, 353-4, doc. 235.
51 ANTT, Chancelaria de D. Joao III, Liv. i de Doacoes, f. 5iv; published in
Braamcamp Freire, 'Cartas', VIII, 400-I, doc. 642. 52 ANTT, Chancelaria de D. Manuel, Liv. 9, f. 53v; Livro das Ilhas, f. 2IOv;
published in Braamcamp Freire, 'Cartas', II, 354, doc. 237. 53 ANTT, CC, parte II, maco 29, doc. 64. 54 ANTT, CC, parte II, maco 50, doc. i82. 55 Saunders, Social History of Black Slaves and Freedmen, 20, Table i. 56 Ibid. 57 See below, section 'Private trade'. 58 John L. Vogt, The Portuguese Role on the Gold Coast, 1469-I682 (Athens OH, 1979),
76. 59 In the last quarter of the fifteenth century some slaves were bought on the Malagueta
Coast for sale on the Gold Coast (E. de la Fosse, 'A viagem de Eustache de la Fosse a costa ocidental de Africa', in Brasio [ed.], Monumenta, 2a ser., i, 464-5, doc. 73). Pacheco Pereira confirms that slaves were bought on the Malagueta Coast. He also confirms however that the coast was dangerous to navigate, especially from May to Sept. (Esmeraldo, 105-6). 60 de la Fosse, 'Viagem', 472.
61 In 1515-I6 the Mina factory had at its disposal two caraveloes (Braamcamp Freire, 'Cartas', I, 367-8, doc. I23). See also John L. Vogt, 'The early Sao Tome-Principe slave trade with Mina, 1500-1540', Int. J. Afr. Hist. Studies, vi (I973), 453. A caraveldo was
44 IVANA ELBL

VOLUME OF THE EARLY ATLANTIC SLAVE TRADE, 1450-1521 45
Delta, and especially Benin, were unpopular among the Portuguese sailors because of the health hazards involved, and so the larger caravels from Lisbon would only seldom fetch slaves from there.62 According to J. L. Vogt, in the last decades of the fifteenth century Crown vessels shipped at most 300 slaves per year from this area to the Mina factory.63 It was partly to address these shortages that a Crown factory was founded in Benin in 1486, but the initiative did not prove very successful.64 The number of slaves that the factory purchased was not large. Bastiam Fernandez, who served as factor there in the early I5oos, bought only 227 slaves in more than twenty months, or 134 slaves per year.65
In order to ensure a satisfactory supply of slaves at Mina, the Crown usually had to combine its own expeditions with purchases from the Sao Tome and Principe islanders, who had by then begun importing slaves from the Niger Delta and the Bight of Biafra, and eventually resorted to slave delivery contracts with larger entrepreneurs who were granted exclusive trading privileges in various regions of the Gulf of Guinea. The quantitative evidence suggests that even this combination was not necessarily adequate. In 1499, Pero da Caminha, the captain of Sao Tome, announced a shipment of thirty slaves and promised sixty more, ninety slaves in total.66 In 1504-7 the Mina factory received about i87 slaves per year,67 and in I 51 1-13 some 210 slaves per year,68 consistently below the 300 slaves per year suggested by Vogt.
The slave purchases of the Mina factory expanded significantly only after I5I3. In 1513-14 they increased to 553 slaves annually.69 In I517-19 the
a derivative of a fishing caravel, showing tonnage from 40 to 50 toneis. They carried a crew of 25 and differed from fishing caravels in that they had a fully covered deck and sometimes a castle. They had three masts, of which the foremast and main mast could be either lateen or square rigged (M. M. Elbl, 'The Portuguese caravel and European shipbuilding: phases and developments and diversity', Revista da Universidade de Coimbra, xxxIII [I985], 568-9).
62 Between October I504 and the end of I505, only three royal ships visited the Niger Delta (ANTT, NA, no. 799, ff. II 5-59v). At least one of these ships suffered disastrous mortality: 8 out of 15 sailors died during the expedition (ibid. ff. I23v-6v). See also the records of the trading expedition to the Niger Delta by the ship 'Conceicao' in 1522: ANTT, CC, parte II, maco 102, doc. 20; translated into English and published by A. F. C. Ryder, 'An early Portuguese trading voyage to the Forcados River', J. Hist. Soc. Nigeria, I (1959), 300-21. Portuguese original published by A. Brasio, 'Um extraordinario documento quinhentista', Studia, no. 15 (I965), 155-74. Also published in French by R. Mauny, 'Le livre du bord de navire Samta Maria de Conceifc (1522)', Bulletin de l'IFAN, xiII, B (I967), 512-33. Further references will be to Ryder's edition.
63 Vogt, 'Early Sao Tome-Principe slave trade', 453. 64 Ruy de Pina, Chronica de el-Rey D. Joao II (Coimbra, 1950), 74-5; Joao de Barros,
Da Asia: Decada I (Lisbon, 1778), I78-9. 65 ANTT, Chancelaria de D. Manuel, Liv. 7, f. 24; Livro das Ilhas, f. I92; published
in Braamcamp Freire, 'Cartas', v, 473, doc. 574. 66 Ibid. 456. 67 ANTT, Chancelaria de D. Manuel, Liv. 3, f. 9Iv; Livro das Ilhas, f. i8ov;
published in Braamcamp Freire, 'Cartas', II, 75, doc. i8i. 68 ANTT, Chancelaria de D. Joao III, Liv. i, f. 34v; published in Braamcamp Freire,
'Cartas', I, 200-1, doc. 18. 69 ANTT, Chancelaria de D. Manuel, Liv. 9, f. 27; Livro das Ilhas, f. 205v; published
in Braamcamp Freire, 'Cartas', IV, 479, doc. 502.

volume dropped to 319 slaves,70 and in 1519-21 it rose to 444 slaves.71 The drop between I 514 and 1519 can be explained by the fact that the Crown was bound by a contract to buy only from Antonio Carneiro, the donatdrio of Principe, who had severe difficulties filling his quota.72 After Carneiro's contract had expired, the Mina factor bought slaves not only from contract holders but also from individual merchants.73 The main reason for the post- 1513 increase may have been, however, the dramatic rise in overall slave exports from West-Central Africa.
Secondary locations
Just as the Cape Verde Islands and the Gulf of Guinea islands (Sao Tome and Principe) quickly became important slave trade centres, they also came to constitute major slave collection points for the Crown after almoxarifados had been established there. Direct quantitative data for these locations are less readily available than for the primary locations, because they were frequently farmed out. Relatively more information is available regarding the receipts of the Cape Verde almoxarifado than regarding the Gulf of Guinea. In 149 I-3 the almoxarife of the Cape Verde Islands received a quarto of 1,914,950 reis and 174 slaves in kind.74 In the last four months of 1513, he received 49 slaves in kind as a part of customs payments; in 1514, 214 slaves; and in 1515, 139 slaves.75 The revenue generated by the royal factory of Santiago and Fogo, the two main islands of the Cape Verde archipelago, was estimated at 450,000 reis,76 which would represent c. 15 slaves77 if we assume that the factory dealt primarily in slaves. However, because in other years the factory was known to deal mostly in other merchandise, such as pelts and ivory,78 in this case the quarto and vintena payments cannot be safely accepted as an indicator of slave trade volume.
The same applies to the data relating to the Crown agencies in the Gulf of Guinea islands. It is almost impossible to reach an estimate of the con- tribution of these locations to the overall Crown slave trade. After 1512 the Sao Tome Crown agency began to receive as revenue substantially more slaves from West-Central Africa than from West Africa, all of them as revenue from Sao Tom6. In 1516, the almoxarife of the Sao Tome royal factory received as many as I,247 slaves in quarto and vintena.79 Unfortu- nately, no further customs data are available to confirm that the level was sustained.
70 ANTT, Chancelaria de D. Manuel, Liv. 35, f. I27; Livro das Ilhas, f. 222V;
published in Braamcamp Freire, 'Cartas', IV, 442, doc. 472. 71 ANTT, Chancelaria de D. Joao III, Liv. 4 de Doacoes, f. 22v; published in
Braamcamp Freire, 'Cartas', VIII, 408, doc. 662. 72 Vogt, 'Early Sao Tome-Principe slave trade', 457; A. F. C. Ryder, Benin and the
Europeans (London, I969), 47-53. 73 Ibid. 74 ANTT, Livro das Ilhas, f. 68; published in Braamcamp Freire, 'Cartas', I, 95, doc.
4. 75 ANTT, NA, no. 757, ff. 114-I6. 76 ANTT, NA, no. 532, f. I00. 77 450,000 reis divided by 3,900 reis per slave = I 115 slaves. 78 ANTT, Chancelaria de D. Manuel, Liv. 3, f. 5ov; Liv. 6 de Misticos, f. 90;
published in Braamcamp Freire, 'Cartas', II, 440, doc. 296. 79 Brasio (ed.), Monumenta, i, 378.
46 IVANA ELBL

VOLUME OF THE EARLY ATLANTIC SLAVE TRADE, 1450-1521 47
Crown slave trade: conclusions
Quantitative data on the volume of the Crown slave trade become available only by the end of the fifteenth century and cover, in a rather fragmentary fashion, the period 1486-1521. For most of this period, we do not have simultaneous data for all four receiving areas: Portugal, Arguim, Cape Verde Islands and Mina/Gulf of Guinea agencies. The sole exception is the year 1511, when 978 slaves are documented as received by Crown agencies (see Table 2). Moreover, the overall volume of the Crown slave trade cannot be derived by simply adding up the volume for each area. Double-counting is a real danger in years for which data are available for both Portugal on the one hand, and Arguim and the Cape Verde Islands on the other. It is very likely that the slaves received originally by the Arguim or Cape Verde Crown agencies found their way to Portugal soon after the original purchase. The same danger exists, to a lesser degree, where data on the Crown slave trade in the Gulf of Guinea are concerned. Slaves received by the Crown agencies in Sao Tome or Principe might be double-counted among the slaves received in Mina. Where such potential conflict exists, the highest of the available figures is adopted here, and the other component figures disregarded (Table 2, sub-column 'Adjusted for Double Count') in order to arrive at the minimum number of slaves actually received by the Crown.
Table 2 suggests that in the late fifteenth century the Crown received between 500 and 800 slaves per year, with an average of c. 620 in 1486-97. Numerical data for the Gulf of Guinea are too sporadic to yield a clear picture for this period, but sufficient to support a projection of c. 200 slaves per year.80 The minimum overall slave trade carried on by the Crown in this period was thus approximately 800 slaves per year, within a range of between 700 and I,ooo. In the first decade of the sixteenth century, the Crown slave trade appears to have declined slightly. The numerical evidence suggests an annual volume of trade ranging between 400 and 950 slaves, with a sharp increase by the end of the decade. The increase continued into the early 15Ios, when the documented Crown slave trade ranged widely between c. 650 and 1,500 slaves per year. The peak occurred in the late 15Ios, when the figures rose dramatically to 1,700-2,000 slaves per year, mostly as a result of the sharp upswing in the Arguim trade and imports to Sao Tome.
In the period for which numerical data are available, the Crown trade thus ranged from a low of c. 700 slaves per year to a high of 2,000 slaves in the late
I5ios. The minimum average volume in the period 1486-1521 was c. 1,1OO slaves per year.81
Private slave trade
The Crown's slave trade was complemented by sizable private trading. The private slave dealers fall into three main categories: single expeditions
80 This figure is an approximation based on Vogt's estimate that 300 slaves per year were imported to Mina, the two figures from the period (400 in 1479 and 90 in 1499) and the number of slaves received in Mina in I504-7.
81 [800 slaves per year x 15 years (1486-99)+700 slaves per year x io years (I500-9)+ 900 slaves per year x 6 years ( 5 o- 5)+ 1,700 slaves per year x 6 years ( 5I 5-21)] divided by 31 years (1486-1521) = c. I,IOO slaves per year.

IVANA ELBL
Table 2. Crown slave trade (distribution of evidence)a
Number of slaves received annually Annual total
Col. 4 Un- Col. 3 Mina adjusted Adjusted Cape and for for
Col. I Col. 2 Verde Gulf of double double Year Portugal Arguim Islands Guinea count Col. count Col.
1486 1487 1488 475 475 I 475 I
1489 1490 58 I 581 I
1491 I492 58I 8 639 ,2 58I I
I493 ___
I494 I495 830 830 . 830 I
1496 1497 724 724 I 724 I
1498 1499 347 2,4 347 2,4 1500 257 1501 90 257 2
1502 1503 I504 I75b 362 2,4 362 2,4 1505 306 2,4 36 2,4 I506 II9 I87
1507 223 _529 I,2 4,4 4
I508 331 554 1,2 331 2
1509 I510 55C 543 5 1,2 2
1511 =I4I9 1,064 1,2,4
1513 294 49d 382 I,I60 1,2,3,4 817 1,4
1514 214 553 1,511 2,3,4 I,511 2,3,4 1515 221 744 I39 I,I04 1,2,3 883 2,3
I5I6 I43 I,247 2,I34 1,2,4 1,99I 2,4
1517
15I8 3I ,659 2,4 659 2,4 1519 I62 1,340 382 1,884 1,2,4 1,722 2,4 1520 _ 1,784 2,4 1,784 2,4
1521 L444 444 4 444 4
a Sources: see text section,'The Crown slave trade'. b Guinea House: four months only (Sept.-Dec. 1504). cAlmoxarife dos escravos. An incomplete figure: in 1509-10, the almoxarife had
received an average of 55 slaves per year plus an undifferentiated amount of money, part of which could have been proceeds of slave sales or customs.
d Almoxarife of the Cape Verde Islands: slaves received as part of custom payments Aug.-Dec. 1513 only.
48

VOLUME OF THE EARLY ATLANTIC SLAVE TRADE, 1450-1521 49
originating in Portugal; settlers of the islands off the coast of Africa; and, finally, lease-holders and tax farmers. The traders were not necessarily Portuguese: except for relatively short periods of attempted Crown mon- opoly, the trade was open to both Portuguese subjects and foreigners, provided that they had obtained a license, privilege or contract from the Crown.
Expeditions originating in Portugal
This type of private slave trade prevailed in the opening decades, before the settlement of the Cape Verde and Gulf of Guinea Islands. As in the case of the Crown slave trade, numerical data are extremely fragmentary and accidental for the first three decades and for the expeditions originating in Portugal in general. In the I450s, these expeditions carried back between 40 and Ioo slaves each, but it is impossible to say how many of them sailed each year. In 1470, I02 privately owned slaves were licensed to be exported to Castile. In 1508, Mem Galvam cleared through the Lagos almoxarifado some 29 slaves,82 and in 1511-13 c. 190 slaves per year were cleared through the Slave House by private parties.83 These figures are certainly incomplete, and very likely represent only the tip of an iceberg, but the records make it impossible to establish a more exact figure. In 1509-10, for example, the Slave House was farmed out for a sum which suggests that between 541 and 714 slaves were received there each year.84 It is, however, difficult to say how many of these slaves belonged to the Crown and how many to private parties, or how many represented direct sales as opposed to customs collected from sales outside the Slave House. If most of the Slave House income came from customs, the number of slaves would have been substantially higher than
82 Mem Galvam paid 17,300 reis in dizima (io per cent tax) on the slaves imported from Guinea to Lagos. Total receipts: 17,300 reis = Io per cent. Number of slaves cleared: 17,300 reis divided by o x oo00 = 173,000 reis; divided by 5,900 reis per slave = 29 slaves (Chancelaria de D. Manuel, Liv. 3, f. 2ov; Liv. 7 de Guadiana; published in Braamcamp Freire, 'Cartas', III, 397, doc. 474).
83 In I5I I-I2, the Almoxarife dos escravos e vintena and feitor das Ilhas collected in vintena on slaves and miscellanea belonging to private persons 162,350 reis. 162,350 reis divided by 3 years = 54,117 reis = 5 per cent of the total number of slaves cleared. Number of slaves cleared annually: 54,117 reis divided by 5 x I00 = I,082,340 reis; divided by 5,900 reis per slave = 183 slaves. In the same period, he also received 28,615 reis in quarto on slaves belonging to various private persons. 28,615 reis divided by 3 years = 9,538 reis = 25 per cent of the total. Number of slaves cleared annually: 9,528 reis divided by 25 x I00 = 38, 12 reis; divided by 5,900 reis per slave = 7 slaves (Chancelaria de D. Manuel, Liv. I I, f. 69v; Liv. 6 de Misticos, f. 130; published in Braamcamp Freire, 'Cartas', III, 440-I, doc. 297). The total number cleared this way by private parties is 190 slaves per year.
84 In 1509-10, the Casa dos Escravos was rented out for a total of 6,383,624 reis (Liv. 6 de Misticos, f. 18; published in Braamcamp Freire, 'Cartas', III, 370, doc. 392). Average annual lease payments = 6,383,624 reis divided by 2 years = 3,191,812 reis. Minimum number of slaves sold or cleared: 3,191,812 reis divided by 5,900 reis per slave = 541 slaves. Number of slaves adjusted by projected 32 per cent profit margin: 541 + 32 per cent = 714 slaves.

c. 500-700 because the received sums would reflect only about 28-75 per cent (quarto and vintena) of the total annual imports. The volume of the private slave trade carried on directly from Portugal is thus extremely difficult to quantify.
Cape Verde Islanders
The surviving quantitative data are more illuminating in the case of the settlers of the Cape Verde Islands and of Sao Tome and Principe. The Cape Verde Islands, where slaves were the main trading commodity, were first settled in 1466 and quickly became the most prominent slave trading centre in the Portuguese commercial system. Ships from a variety of Portuguese ports, from Castile and from other Atlantic islands regularly called on the island of Santiago to load slaves.85 The first numerical evidence available pertains to the I490s. The quarto and vintena receipts of the almoxarife of Cape Verde Islands suggest that in I49I-3 the settlers bought as many as c. 770 slaves per year,86 thus not only matching the known volume of the Crown slave trade in the same period but possibly even surpassing it.
The value of the i504-7 tax farm on the quarto from the Cape Verde Islands trade suggests that in the early I5oos the volume of the Cape Verde Islands slave trade was not only sustained but increased even further: the settlers were expected to clear at least 720 slaves for the tax farmers to meet their contractual obligations, but as the farmers likely entered into the contract with the intention to make profit, the potential of the trade might have been c. 950 slaves.87
The viability of this figure is supported by developments in the 151 s. In 1509, a four-year tax farm contract on the quarto and vintena from the Cape Verde Islands trade called for annual payments of 900 slaves. This sum suggests an annual volume of c. 804-I,06 slaves.88 The i 5i i estimate of
85 Brasio (ed.), Monumenta, 2a ser., ii, 54, doc. 19. Also ANTT, NA, no. 757, ff. 223v-62: in i514, for example, two Castilian ships left Ribeira Grande with 92 slaves purchased there; in 15I5 it was three ships with 142 slaves.
86 In I491-3, the almoxarife of the Cape Verde Islands received in quarto and vintena customs payments 1,914,950 reis and 174 slaves (ANTT, Livro das Ilhas, f. 68; published in Braamcamp Freire, 'Cartas', I, 95, doc. 4). Annual receipts (equal to 28-75 per cent of the total number of slaves cleared) thus amounted to 638,317 reis plus 58 slaves, an equivalent of 222 slaves (638,317 reis divided by 3,900 reis per slave)+ 58 slaves = I64 slaves+ 58 = 222 slaves). Total volume of slave imports: 222 slaves divided by 28-75 X 100I = 772 slaves.
87 Between mid- 1504 and mid- 1507, the quarto from the Cape Verde Islands trade was farmed out for 2,oo100,000ooo reis (ANTT, CC, parte II, maco 8, doc. 104). Annual payment was (2,ioo100,000ooo divided by 3 years) 700,000 reis. Minimum number of slaves cleared: 700,000 reis divided by 3,900 reis per slave = i8o slaves divided by 25 x 100oo per cent = 720 slaves. Number of slaves adjusted by a projected 32 per cent profit margin: 720 slaves + 32 per cent = 950 slaves (for a discussion of the projected profit margin see the section 'Evaluation of Sources').
88 The quarto and vintena of the Cape Verde Islands was to be farmed out between mid-15io and mid-1513 for an annual payment of 900,000 reis (Brasio [ed.], Monumenta, 2a ser., 41, doc. I5). Minimum number of slaves cleared: 900,000 reis divided by 3,900 reis per slave = 23I slaves (28-75 per cent of cleared slaves), 28-75 x 100 = 804 slaves. Number of slaves adjusted by a projected 32 per cent profit margin: 804 slaves+ 32 per cent = i,o06 slaves.
50 IVANA ELBL

VOLUME OF THE EARLY ATLANTIC SLAVE TRADE, 1450-1521 51
royal revenues confirmed this contract and specified that it was to be paid out in slaves. The author of the summary complained, however, that the contract underestimated the potential of the trade and that the payments could have been as high as 1,033,333 reis, a figure suggesting a range of 922-1,217 slaves per year,89 approximately 200 slaves more than indicated by the original value of the tax farm. The tax farm payments for the second half of the contract period, mid-151 to mid-15 I3, were eventually raised even higher than proposed in the 15I I summary of royal revenues. In this period, the almoxarife dos escravos received 1,043,666 reis annually from the Cape Verde Island tax farmers.90 This figure represents c. 936-1,264 slaves,91 about 2-3 per cent more than the 1511 estimate of potential would suggest.
These projections, based on the volume of customs receipts and tax farm payments, are borne out by the direct evidence contained in the I513-16 customs register, which survives intact for the period from September 1513 to December 5 I5.92 In the last four months of 15 3 alone, 384 slaves landed in Santiago. If we assume that the share of last four months of the year in the overall annual volume of slaves was the same as in the two following years, i.e. 26 per cent, the overall projection of 1513 would be I,477 slaves. This figure is more than 200 slaves higher that the one indicated by the size of the tax farm payments. It is thus possible that the results of tax farm-based projections are too conservative.
The slave trade volume in 1514 and I515, the two years for which complete records are available, constitutes unequivocal direct evidence that the Cape Verde Islands slave trade not only matched the tax-farm-based projections but exceeded them in both cases. In 1514, the Cape Verde Islands almoxarife cleared 1,358 slaves, and in I55, 1,402 slaves.93 The variance between the two years is only 44 slaves, or 3'2 per cent. Even if the projections for 15 0-I2 are too conservative, it is safe to suggest that between 1490 and I515 the Cape Verde slave trade nearly doubled, growing from c. 770 slaves to c. 1,400 slaves.
This volume was, however, not sustained in the period 15 I6-21. In these years the Crown attempted to take over the trade and carry it on either
89 ANTT, NA, 532, f. o00. Calculation procedure: current amount of the annual tax
farm: 900,000 reis. Minimum number of slaves to pay the amount: 900,000 reis divided by 3,900 reis per slave = 231 slaves (28-75 per cent of the total number of slaves dared); divided by 28'75 x Ioo per cent = 804 slaves. Number of slaves adjusted by a projected 32 per cent profit margin: 804 slaves+32 percent = 1,057 slaves. Annual tax farm potential: I,033,333 reis divided by 3,900 reis per slave = 265 slaves (28-75 per cent of the total number of slaves cleared); divided by 28'75 x 100 = 922. Number of slaves adjusted by a projected 32 per cent profit margin: 922+ 32 per cent = 1,217 slaves.
90 Chancelaria de D. Manuel, Liv. I , f. 69v; Liv. 6 de Misticos, f. 130; published in Braamcamp Freire, 'Cartas', III, 440-I, doc. 297.
91 In 1511-13, the Almoxarife dos escravos e vintena and feitor das Ilhas received 3,130,999 reis from the tax farm on the Cape Verde Islands (Chancelaria de D. Manuel, Liv. I I, f. 69v; Liv. 6 de Misticos, f. 130; published in Braamcamp Freire, 'Cartas', III, 440-1, doc. 297). Average annual tax farm payment: 3,130,999 reis divided by 3 years = 1,043,666 reis; divided by 3,900 reis per slave = 269 slaves (28-75 per cent of total number of slaves cleared). Minimum number of slaves cleared: 269 slaves divided by 28-75 X I00 = 936 slaves. Number of slaves adjusted by a projected 32 per cent profit margin: 936 slaves+32 per cent = 1,264 slaves. 92 ANTT, NA, no. 757, if. I4-II9. 93
ANTT, NA, no. 757, ff. 14-32 (1513); 32V-74V (1514); 75-1I9 (1515).
directly or through lease-holders. The settlers were permitted to import to the Cape Verde Islands only as many slaves as were needed by the local economy. As a result, customs receipts and tax farms dropped drastically: in 1518-21, the settlers cleared, at best, 67 to 78 slaves annually.94 Once the legal obstacles were removed, however, the trade returned to around the volume in the I5IOs. In 1525, the Cape Verde Islanders were expected to pay I,2 2,000 reis in quarto and vintena, an amount corresponding to I ,o8o slaves cleared.95
Settlers of the Gulf of Guinea Islands
The other major pockets of Portuguese settlement, on the islands in the Gulf of Guinea, were at first established only slowly. Sao Tome was granted a settlement charter only in i485,96 almost 15 years after it had been discovered. The terms were not favourable, and a new trading license was issued in I493, which allowed the settlers to trade along the Gulf of Guinea and in the kingdom of Kongo but required them to sell slaves to the Crown at a fixed price.97 It was only in 500, however, under the captaincy of Fernao de Mello, that both Sao Tome and Principe received liberal charters, which lifted many previous restrictions.98 The Crown originally intended the settlers to supply slaves exclusively to Sao Jorge da Mina,99 but by I500 it was forced to lift this restriction and allow them to trade freely with all Portuguese territories.100 The settlers depended heavily on slave imports, not only for the purposes of trade, but also to obtain the manpower needed for their farms, fledgling sugar plantations and households.1'1
The available numerical evidence for this slave trade is scanty and very fragmented. The figures pertaining to the 1490o and 50oos are very low. In I499 the Crown managed to purchase only ninety slaves from Antonio de Caminha, the captain of Sao Tome. The islanders were selling to the settlers and officials of Mina in the same period, I495-9, 67 slaves each year.102 Sao Jorge da Mina, the closest export market for the settlers' slaves, received only C. 200 slaves per year in the 50oos, whether originating from the Crown's own expeditions or from purchases from the Sao Tome settlers. These low
94 In 1518-2I, the quartos and vintenas of the Cape Verde Islands amounted to only 243,096 reis (Chancelaria de D. Joao III, Liv. 23 de Doa,oes, f. 44; published in Braamcamp Freire, 'Cartas', x, 4, doc. 764). Annual receipts: 243,096 reis divided by 39 months x I2 = 74,799 reis; divided by 3,900 reis = 19 slaves (28-75 per cent of total number of slaves cleared). Minimum number of slaves cleared: I9 slaves divided by 28'75 x 100 = 67 slaves; one half of the 67 slaves adjusted by a projected 32 per cent profit margin for the period under tax farm: 67 slaves+(67 slaves divided by 2 x 32 per cent) = 78 slaves.
95 NA, no. 590, f. 59. Expected revenue from quarto and vintena: 1,212,000 reis divided by 3,900 reis per slave = 310 slaves; divided by 28-75 per cent x 100 = 1,078 slaves.
96 Silva Marques, Descobrimentos, iii, 646-8, doc. 385. 97 Ibid. iii, 428-9, doc. 289. 98 Ibid. iii, 585-8, docs. 360 and 36I; ANTT, Livro das Ilhas, ff. 8I-2. 99 Silva Marques, Descobrimentos, iii, 429, doc. 289. 100 Ibid. iii, 588, doc. 361. 101 See R. Garfield, A History of Sao Tome Island, 1470-I655: A Key to Guinea (San
Francisco, 1992), chs. I, 2 and 4. 102 Silva Marques, Descobrimentos, iii, 520-40, doc. 336.
52 IVANA ELBL

VOLUME OF THE EARLY ATLANTIC SLAVE TRADE, 1450-1521 53
numbers can in part be explained by the inflexible and unrealistic pricing policy of the Crown, which set the price of a slave at only 4,000 reis, while the open retail market would have paid about double that amount.103 It may have been more profitable for the settlers to keep their slaves or try to sell them elsewhere.
Lack of transportation and merchandise, however, hampered the trade with the mainland even more than did Crown policy. In 1499, Pero de Caminha, the acting captain of Sao Tome, pleaded with the King D. Manuel for at least one well-equipped ship and more merchandise with which to buy slaves, promising that a sharp increase in Crown's revenues would result.104 The quarto and vintena that in Caminha's reckoning was due to the Crown for the period from 1493 to early 1499 suggests that the islanders bought 320 taxable slaves from the mainland over six years.105 In addition, the islanders serving in the expeditions to the mainland were paid in slaves who, presumably, were not taxable. This adds approximately I, oo slaves over the same period,106 suggesting annual imports of c. 240 slaves to Sao Tome in the I490S.
The leases and tax farms paid in connection with trade in the Gulf of Guinea also suggest a low volume of trade. The 1502-3 leases on two Niger Delta trading areas point to maximum purchases of 202 to 267 slaves.107 However, as leases seldom excluded trading by other privileged parties, such as the settlers of Sao Tome and Principe, these figures do not necessarily reflect the overall size of the trade. More informative is the tax farm on Sao Tome revenues in 1504-6, sold for 300,000 reis a year.108 This would suggest minimum annual imports of some 260 slaves, or, assuming that profit was realized at the level assumed, 340 slaves.109
This figure is consistent with the 15 I I assessment of revenue potential, the level of expected quarto and vintena revenue from both Sao Tome and Principe, which suggests that the volume of settlers' slave trade was in the
103 According to a royal letter from 1493, the settlers were supposed to sell their slaves to the Mina factor for 4,000 reis (Silva Marques, Descobrimentos, iii, 429, doc. 289), about half of the regular price (see Elbl, 'Portuguese trade', Table 39). This requirement was abolished in 1500, but the policy of fixed prices continued in Mina (Vogt, Portuguese Rule, 74-5). 104 Brasio (ed.), Monumenta, i, 176-7, doc. 44.
105 The King was owed Ioo,ooo reis and 55 slaves from the quarto, according to the accounting carried out by Pero de Caminha (Brasio [ed]., Monumenta, i, 174, doc. 44). Ioo,ooo reis x 4 = 400,000; divided by 4,000 reis per slave = ioo slaves. 55 slaves from quarto payments x 4 = 220 slaves. ioo slaves+ 220 slaves = 320 slaves.
106 Brisio (ed.), Monumenta, i, 175, doc. 44. 107 In 1502-3, Fernao de Noronha administered three two-year leases on parts of the
Niger Delta: a lease on the Rio dos Escravos in the amount of 1,600,000 reis, a lease on Rio Primeiro in the amount of 780,000 reis (ANTT, Chancelaria de D. Manuel, Liv. 36, f. 24v; Livro 6 de Misticos, f. 70; published in Braamcamp Freire, 'Cartas', II, 239-40, doc. 220). Annual lease of Rio dos Escravos: 1,600,000 reis divided by 2 years = 800,000 reis; annual lease of Rio Primeiro: 780,000 reis divided by 2 years = 390,000 reis. Total annual leases: 800,000 reis+ 390,000 reis = 1,190,000 reis. Number of slaves needed to pay the leases: 1,190,000 reis divided by 5,900 reis per slave = 202 slaves. Number of slaves adjusted by a projected 32 per cent profit margin: 202 slaves+32 per cent = 267 slaves. 108 Brasio (ed.), Monumenta, i, 199-200 and 20I-2, docs. 55 and 56.
109 300,000 reis divided by 28-75 (quarto and vintena) x Ioo = 1,043,478; divided by 4,000 reis per slave = 260 slaves; plus profit of 32 per cent = 343 slaves.

range of 334-441 slaves per year,110 assuming that slaves constituted the better part of the settlers' imports fru;n the mainland. The 15 I0-I4 tax farm on the quarto and vintena of Principe alone suggests slave imports ranging from 132 to 178 slaves per year.111 In 1515, the king received 78 slaves in payment of Sao Tome taxes, which means that at least 280 slaves must have been imported that year.112 Together, these figures for Sao Tome and Principe suggest annual imports almost identical with the volume derived from the 151 i assessment.
The Gulf of Guinea settlers' trade may have been even higher in this period because of the seemingly flourishing illicit trade. The surviving documentation is scarce because it deals only with those rare cases when the rule-breakers were caught. In 1514, for example, an unauthorized Sao Tome expedition to the Niger Delta and Benin brought back 400 slaves purchased over a period of five to six months.113 In 1516, a similar expedition bought 600 Benin slaves, using Ijo intermediaries and soliciting the goodwill of the Oba of Benin with rich presents. The success of the expedition sparked an inquiry that stretched over several years.114 The lack of other documentation makes it impossible to say whether these expeditions represented exceptions or routine infractions. The Crown had difficulty controlling the slave- trading activities of the islanders, especially in Kongo. On the other hand, the fact that large scale transgressions were promptly denounced to the Crown suggests that illicit trading was difficult to conceal in the small island societies. If the illicit traffic was indeed heavy and sustained, a substantial upward adjustment would be necessary, but given the available numerical evidence, an estimate of ,00ooo slaves annually in 15 0-I5 can probably serve as a safe minimum figure.
In I5I6, however, Sao Tome imported as many as 4,307 slaves, and the potential for the following year was estimated by the royal corregedor, Bernardo Segura, at 6,750 slaves. Segura based his estimate on the fact that
110 The 'Alfandegas e Rendimentos do Reino, I5Ii' show that the tax farm on the quarto and vintena of Principe Island was assessed at 150,000 reis and that of Sao Tome at 230,000 reis (ANTT, NA, 532, ff. 116-I7). Annual amount of the Principe tax farm:
150,000 reis divided by 4,ooo rdis per slave = 38 slaves (28-75 per cent of slaves cleared). Minimum number of slaves cleared: 38 slaves divided by 28-75 x I00 per cent = I32
slaves. Number of slaves adjusted by a projected 32 per cent profit margin: 98 slaves + 32
per cent = 174 slaves. Annual amount of the Sao Tome tax farm: 230,000 reis. Minimum number of slaves cleared: 230,000 reis divided by 4,ooo reis per slave = 58 slaves (28-75 per cent of the total cleared); divided by 28-75 x ioo00 per cent = 202 slaves. Number of slaves adjusted by a projected 32 per cent profit margin: 202 slaves+32 per cent = 267 slaves. Combined total for Sao Tom6 and Principe Islands: from 334 (132+202) to 44I
(174+ 267) slaves per year. 111 The Almoxarife dos escravos e vintena e feitor das Ilhas received in payment of the
four-year tax farm on the quarto and vintena of Principe Island, 15 10-14, a sum of 6o6,ooo reis (Chancelaria de D. Manuel, Liv. I I, f. 69v; Liv. 6 de Misticos, f. i30; published in
Braamcamp Freire, 'Cartas', III, 440-1, doc. 297). Annual amount of the tax farm:
6o6,ooo reis divided by 4 years = 151,500 reis. Minimum number of slaves cleared:
151,500 reis divided by 4,000 = 38 slaves; divided by 28-75 x I00 = I32 slaves; number of slaves adjusted by a projected 32 per cent profit margin: 132 + 32 per cent slaves = 178.
112 ANTT, CC, parte I, maco i8, doc. II6. 113 ANTT, CC, parte I, maco 20, doc. I27. 114 ANTT, CC, parte I, maco 20, doc. I9.
54 IVANA ELBL

VOLUME OF THE EARLY ATLANTIC SLAVE TRADE, 1450-1521 55
seven (and potentially nine) ships were available to bring slaves from the mainland, each capable of making at least three return trips per year with some 250 slaves.115 Unfortunately, no figures are available for the next few years, except for the period between September I519 and January i522, when Sio Tom6 sent 266 slaves per year to Sao Jorge da Mina.116 It is thus difficult to establish whether the high level of imports in 15 I6 was sustained, but it is not likely that it was. The availability of slaves might have been contingent on the ongoing wars, both in Benin and in Kongo. Finally, in 1519 the Crown banned private slave trade from Kongo.117 While this measure eventually proved ineffective, it might have slowed down the trade in the short run. In 1525 the reve'nues from the slave and sugar trade of Sao Tome were assessed at 5,000,000 reis, and Principe's revenues at only 156,500oo reis.118 Assuming that sugar and slaves each accounted for 50 per cent of those revenues, the slave trade volume would have been c. 2,200 slaves per year.119 To this figure must be added the 600 slaves to be shipped from Sao Tome to Mina120 and 140 slaves suggested by Principe revenues.121 The total thus comes to slightly fewer than 3,000 slaves. This figure, while decidedly lower than the 1516 volume and much lower than Segura's estimate for 1517, still supports the notion that after 1516 the Gulf of Guinea settlers claimed the lion's share of the Atlantic slave trade.
Lease-holders
To simplify administration and, more importantly, secure large cash ad- vances, the Portuguese Crown leased sections of the West African coast to prominent entrepreneurs for fixed payments. The lease-holder was issued an assurance that the Crown would refrain from issuing other licences to trade in the same region, and he was free either to carry on trade directly or to issue licences to interested third parties. The lease-holders, however, were not monopolists; they still had to compete with holders of standing privileges, such as the settlers of the Cape Verde Islands, Sao Tome, and Principe. As slaves were the most important commodity exported from those West African regions that did not trade in gold, most of the leases on those regions were probably expected to be paid for in slaves or proceeds from their sales.
Bartolomeu Marchione's contract with the Crown late in the fifteenth century constitutes the earliest documented example of such a lease. From I486 to 1495, Marchione, a Florentine naturalized in Portugal, leased for an annual sum of I, 00,ooo reis a trading area identified alternately as 'Rios dos Escravos' or simply 'Rios' [Rivers]. The designation 'Rios dos Escravos' normally referred to the Niger Delta, but as the overwhelming majority of slaves purchased by Marchione were Wolof, and therefore natives of
115 Brasio (ed.), Monumenta, i, 378-9, doc. o18. 116 ANTT, Chancelaria de D. Joao III, Liv. 4 de Doacoes, f. 22v; published in
Braamcamp Freire, 'Cartas', vII, 408, doc. 662. 117 Brasio (ed.), Monumenta, i, 429, doc. 126. 118 ANTT, NA, no. 590, ff. 6I-2. 119 5,000,000 reis divided by 2 = 2,500,000 reis; divided by 28-75 x 1oo = 8,695,652
reis; divided by 4,000 reis = 2,174 slaves. 120 ANTT, NA, no. 590, f. 6i. 121 156,500 reis divided by 28'75 x Ioo = 544,348 reis; divided by 4,000 reis = 136
slaves.
Senegambia, it is likely that Marchione's lease in fact extended to all the coastal regions trading in slaves. To meet his lease payments, Marchione would have needed approximately i80 slaves, but from 1489 to 1495 he exported an average of 270 slaves a year to Valencia alone.122 His actual annual shipments to Valencia fluctuated sharply: out of the seven years for which data are available, three years were significantly above average (1491, 1493 and I495) and four below average (1489, 1490, 1492 and I494). Marchione, however, not only always managed to pay his lease, but he was also able to pay two thirds of the renewed contract in advance. He could have of course resorted to revenue from his other ventures to provide this advance, but even if he relied solely on his slave trade to Valencia, over the seven years he would have paid his lease and made a modest profit.
Leasing continued in the first decade of the sixteenth century. A 1502-3 lease on two Niger Delta trading areas suggests that 202 to 267 slaves were purchased there annually.123 In I509, leasing policies were codified in D. Manuel's Regimento das Casas das Indias e Mina and made subject to annual reassessment by the officials of the Casa da Mina.124 The surviving 151 i reassessment offers a glimpse of the lease value of the various slave trading regions from the Senegal River to Sierra Leone. The annual lease of 195,000 reis on the Senegal River suggests that the lease-holder was expected to find a relatively small supply there - only 33 to 44 slaves. The lease on the Guinea Rivers area was assessed substantially higher: the suggested annual payment of 9 i ,6oo reis would have required the lease-holder to purchase
55 to 205 slaves per year. At 917,746 reis per year, the actual lease payments for the period from January I51 to June 1512 were only slightly higher than the 1511 i assessment. In the following lease period, from June 1512 to June 15I3, payments rose sharply to I,2I2,000 reis, so that the lease holder would have had to purchase 205 to 271 slaves a year to cover them. The actual payments covering the 151 1-13 lease on the next area, Sierra Leone, were also higher than the 15I I assessment. The lease-holder paid 538,667 reis per year, 88,667 reis more than called for in I5I i. The Sierra Leone lease of I 5I I-I3 thus likely yielded between 91 and I20 slaves, that is, c. 20 slaves more than the I 5 1 i assessment would suggest.
After 1515, the leasing situation became more complicated both in terms of surviving documentation and variety of arrangements. In I515-i6, the Arguim trade was leased out. In I 55, the lease-holders sent to the Guinea House as many as 261 slaves in lease instalments, and 493 slaves in 5 6.125 If we apply the previously projected profit margin, the volume of their trade would thus be 498 slaves per year over the two years. This figure would be consistent with the volume of Arguim slave trade in the previous 5 years but not with the number of slaves the Crown received from Arguim in the period 1514-17: 744 slaves. The lease-holders either did not have exclusive trading rights or achieved very high profits. In the Gulf of Guinea trade, the Crown began to prefer contracts under which the contract-holder was required to deliver a set number of slaves to Sao Jorge da Mina and could keep the surplus for himself, or was granted exclusive trading privileges only in a
122 Cortes, La esclavitud, years 1489-96. 123 See note 107. 124 Peres (ed.), Regimento das Casas das Indias e Mina, 25-6. 125 ANTT, CC, parte II, maco 58, doc. I55; ibid. maco, 62, doc. 92; ibid. ma;o 65, doc.
39.
56 IVANA ELBL

VOLUME OF THE EARLY ATLANTIC SLAVE TRADE, 1450-1521 57
specific area. The outcome could vary widely: while Antonio Carneiro, who in 1514-18 held a four-year contract on trade with the Niger Delta, had serious problems with meeting his quota,126 four years later, in 1519-20, Duarte Bello not only supplied 221 slaves to Mina in fulfillment of his contract127 but in 1519 also had 300 slaves coming from Guinea to Portugal aboard a vessel that was wrecked and plundered of its cargo.128 In 15I7, the royal corregedor Bernardo Segura claimed that Pero Aluarez and Ferna de Castilho, who held a lease on a part of the Sao Tome trade with the mainland, accumulated 1,448 slaves in profit. Unfortunately, he does not specify over what period of time.129
Private slave trade: conclusions
In the I49os when quantitative data first become available, the settlers of the Cape Verde Islands dominated the private trade, buying over 800 slaves per year. Their share was complemented by Marchione's trade, the only known lease-holder in this period. He paid on average for 240 slaves a year. The settlers of the Gulf of Guinea Islands added another 240 slaves. The total documented volume of private slave trade in the I490s was thus almost 1,300 slaves per year, a figure c. 40 per cent higher than the minimum documented Crown trade. In the I5oos, the quantitative data are very fragmentary, especially where lease-holders are concerned, but there is evidence that the volume of the Cape Verde Islands slave trade was not only sustained but that it increased slightly, ranging between 700 and 950 slaves per year. The trade of the Gulf of Guinea settlers increased to at least 300 slaves per year. The quantitative evidence for this period will sustain a minimum estimate of 1,400 slaves per year,130 a slight increase over the previous period.
In the period 15Io-I5, the records show a dramatic rise in the volume of private trade, but part of this apparent increase must be ascribed to improved documentation, which during these years provides much more reliable information on the volume of trade carried on by lease-holders, settlers of the Gulf of Guinea Islands, and other participants. In this period, the Cape Verde Islands trade increased from a minimum of c. 900 slaves in 15 10 to the full documented I,402 slaves in 1515. The volume of the lease-holders' trade ranged between 300 and 400 slaves per year and that of the Gulf of Guinea settlers between 450 and 550 slaves per year. Other private parties accounted for c. 200 slaves per year. The overall volume of private trade in West African slaves ranged between a minimum of 1,700 and a documented maximum of almost 2,500 slaves in given years.
This distribution was significantly altered in the period 1516-21, when the Crown's legislative intervention reduced the Cape Verde Islands slave trade to a trickle, while its contract policies resulted in a sharp increase in interloping in the Gulf of Guinea. However, very high slave imports from
126 ANTT, CC, parte I, maco 20, docs. 19 and 127. 127 ANTT, Chancelaria de D. Joao III, Liv. 4 de Doacoes, f. 22V; published in
Braamcamp Freire, 'Cartas', vIII, 408, doc. 662. 128 V. Magalhaes Godinho, Os descobrimentos e a economia mundial (2nd ed., 4 vols)
(Lisbon, 1981-3), iv, i68. 129 Brisio (ed.), Monumenta, i, 380, doc. o08. 130 Cape Verde islanders: 720+950 divided by 2 = 835 slaves; plus Gulf of Guinea
settlers: 300 slaves; plus lease-holders: 250 (based on the i49os and the data for 1502-3) = 1385 slaves = c. 1,400 slaves.

IVANA ELBL
Table 3. Private slave trade (distribution of evidence)
Number of slaves received annually
Col. 3 Col. I Col. 2 S. Tome
Lease- Cape Verde and Col. 4 Annual total Year holders Islanders Principe Others Partial set Full set
771
240
I59
260-340
720-950
804-I,06I 936-I,235
I,477 1,358 1,402
334-44I
132-174
532-574 280
4,907
5I9 55I 520 67-78 266
52I 221
Source: see text section,'Private slave trade'.
239 I,OIO
1,250
479
240
159
267
980-I,290
720-950 29 29
804-I,06I
I90
1,890-I,932 1,682 4,907
884-896
554-565
1486 1487 1488 1489 I490 I49I I492
1493 1494 1495 I496 I497 I498 1499 1500
1501 1502
1503 1504 1505
I5o6 1506 1507 I5o8 1509 1510 I5IO 151I
1513
1514
1515
1516
I517 I5I8
239
267
280-370 305-403 329-435
1,740-2,236 1,587-2,034 2, 28-2,274
I,
I,
I,
58

VOLUME OF THE EARLY ATLANTIC SLAVE TRADE, 1450-1521 59
Kongo pushed the private slave trade to new heights, at least in some years. The trade carried on by contract-holders and the Gulf of Guinea settlers represents the largest share: a minimum of 1,800 and a maximum of 3,000 slaves per year; lease-holders came next, with some 300; and the Cape Verde Islanders came last with only about seventy to eighty slaves per year.
Throughout most of the three decades for which numerical data are available, the overall minimum annual volume of the private slave trade with Africa showed a steady increase. It rose slowly but steadily from 1,300 slaves in the I490s to 1,400 in the I500S. This slow increase was followed by a dramatic jump to 2,100 slaves in 15I0-15 and to 2,800 in the period 1516-21. The overall annual average for the entire period 1490-1521 amounts to almost I,800 slaves.131
CROWN AND PRIVATE SLAVE TRADE: EVALUATION OF RESULTS AND
AN ESTIMATE OF VOLUME
The compilation of the available quantitative data on the volume of Crown and private slave trade helps to define the basic dimensions of the early Atlantic slave trade after 1490. If only the direct data are taken into consideration, it would appear that the combined Crown and private trade grew from an average of 2,I00 slaves per year in the I49os and the I500s132 to a dramatic 3,800 slaves in the I5Ios.133 Much of the increase was the result of expanding private trade. The question is, however, to what degree the random distribution of, and the gaps in, the surviving evidence influence this impression. Combined with the attempt to control double-counting, the exclusive reliance on the tabulated raw figures could result in an under- estimate, in particular in the case of the Crown trade.
Table 5 seeks to fill in the gaps by adding up the maximum yearly figures documented in each column of Tables 2 and 3 for the periods 1490-9, 1500-9, 151 0- 5 and 1516-2 1, dividing the result by the number of years for which data were available, and assuming that the resulting average applies to all years of the period.
The result yields an estimate of the maximum annual figures that the quantitative data will support for the main participants in the Atlantic slave
131 (I,IOO slaves x IO years)+(I,300 slaves x Io years)+(2,000 slaves x 6 years)+(700 slaves x 5 years) = 39,500 slaves; divided by 31 years = 1,274 slaves per year = c. I,300 slaves per year.
132 In I490-9 the Crown traded on average 800 slaves, and private parties 1,300 slaves annually. The combined figure for I490-9 is thus 2,100 slaves per year. In I500-9, the Crown traded on average 700 slaves annually, and private parties traded 1,400 slaves annually (see text, 'Crown slave trade: conclusion' and text, 'Private slave trade: conclusions'). The combined figure for 1500-9 is thus also 2,Ioo slaves per year.
133 In 1510-15 the Crown traded on average 900 slaves annually (minimum 750+ maxi- mum I,050; divided by 2 = 900); and private parties traded 2,100 slaves annually (see text, 'Private slave trade: conclusion'). The combined figure for 151o-I5 is thus 3,000 slaves per year. In 1516-2I, the Crown traded on average I,800 slaves annually (see text, 'Crown slave trade: conclusion'), and private parties traded 2,800 slaves annually. The combined figure for 1516-21 is thus 4,600: 3,000 slaves (151o-I5)+4,600 slaves (1516-21); divided by 2 = 3,800 slaves per year in the I5Ios.
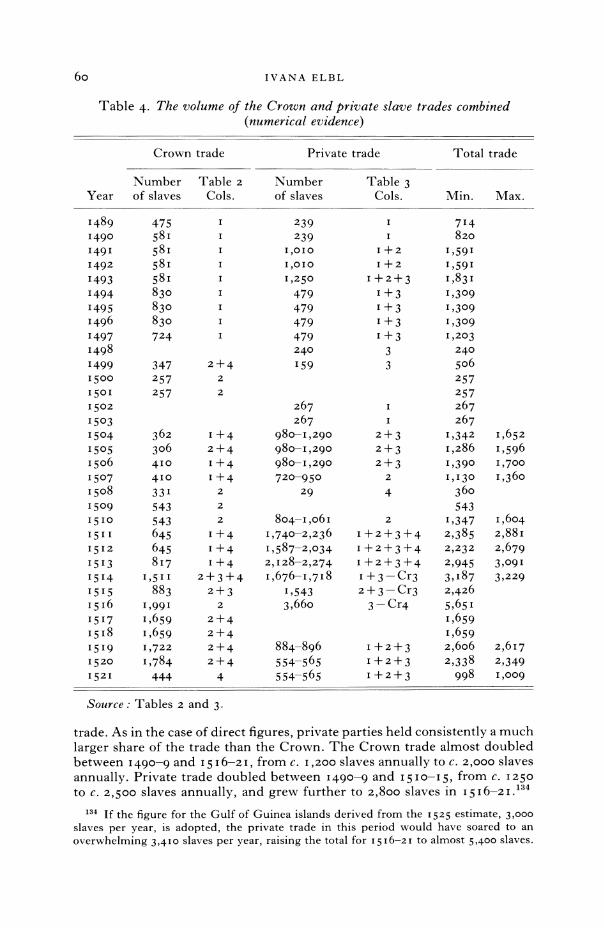
IVANA ELBL
Table 4. The volume of the Crown and private slave trades combined (numerical evidence)
Crown trade Private trade Total trade
Number Table 2 Number Table 3 Year of slaves Cols. of slaves Cols. Min. Max.
1489 1490 149I 1492
1493 1494 1495 1496 1497 1498 1499 1500 1501
1502
1503 1504 1505
50o6 1507 1508 1509
I510 1511
1512
1513 1514
1515
1517
1519 1520 I521
475 58I 58i 58i 58I 830 830 830 724
347 257 257
362 306 410 410 331 543 543 645 645 817
1,511 883
1,991 1,659
,659 1,722
1,784 444
I
I
I
I I
I
I
2+4 2
2
I +4
2+4
I+4
I+4 2
2
2
1+4 1+4 I+4
2+3+4 2+3
2
2+4
2+4
2+4
2+4
4
239 239
I,010
I,OIO
1,250
479 479 479 479 240
159
267 267
980-1,290 980-1,290 980-I,290 720-950
29
804-1,o6 1,740-2,236 1,587-2,034 2,128-2,274
1,676-1,718
1,543 3,660
884-896 554-565 554-565
I
I
+2
I+2
I+2+3
1+3
I+3
I+3
I+3 3 3
1
2+3 2+3
2+3
2
4
2
1+2+3+4 1+2+3+4 I1+2+3+4
I +3-Cr3 2+3-Cr3
3-Cr4
1+2+3
1+2+3
1+2+3
714 820
1,59I 1,591 1,831 1,309 1,309 1,309 1,203
240
506 257 257 267 267
1,342 1,286 1,390 1,130
360 543
1,347 2,385 2,232
2,945 3,I87 2,426 5,651 1,659 1,659 2,606 2,338
998
1,652 1,596 1,700 1,360
1,604 2,88 2,679 3,091 3,229
2,617 2,349 I,009
Source: Tables 2 and 3.
trade. As in the case of direct figures, private parties held consistently a much
larger share of the trade than the Crown. The Crown trade almost doubled between 1490-9 and 1516-2 , from c. 1,200 slaves annually to c. 2,000 slaves
annually. Private trade doubled between 1490-9 and I510-15, from c. 1250 to c. 2,500 slaves annually, and grew further to 2,800 slaves in I5I6-2I.134
134 If the figure for the Gulf of Guinea islands derived from the 1525 estimate, 3,000 slaves per year, is adopted, the private trade in this period would have soared to an overwhelming 3,410 slaves per year, raising the total for 1516-2I to almost 5,400 slaves.
6o

Table 5. Principal participants in the early Atlantic slave trade. An annual volume of trade estimate, based on quantitative evidencea
Crown
1.3 Private participants Mina 1.4 and Cape 2.1 2.2 2.3 Private
I.I 1.2 Gulf of Verde Crown Lease- C. Verde Gulf of 2.4 trade Total Period Portugal Arguim Guinea Islands total holders Islands Guinea Others total volume
1490-9 700 260 200 60 1,220 240 770 230 1,240 2,460 1500-9 300 250 200 750 270 950 340 30 1,590 2,340 15I0-I5 400 500 340 I80 1,420 400 1,300 6oob 190 2,490 3,890 1516-21 150 1,220 6o00 ,970 330 80 2,400 2,810 4,780 All 390 480 300 105 1,250 300 800 740 90 1,900 3,100
a Source: Tables 2 and 3. The annual averages for the various participants were obtained by adding up the available yearly figures for each period in the relevant column of Tables 2 and 3 and dividing the result by the number of years covered by the data. For example, the average for Crown imports to Portugal in 1490-9 was calculated in the following way: [(58I x 4)+(830 x 3)+724]: 8. The result was then assumed to apply to the entire period. Where Table 3 offered a range, the maximum value was adopted. Unlike in Tables 2, 3 and 4, no allowance was made for double-count, in order to obtain the maximum estimate allowed by the surviving quantitative data.
b Because the figures for 5 I 2-13 represent only the imports of Principe and would unduly distort the results, the following calculation was adopted: [(441 + I 74)] + 574: 2. The assumption was that the I 5 I I figure for Sao Tome can be safely combined with the I 5 12 figure for Principe.
0 rI1
4
0 It
tTi
Cl) H
0
r-I tTi
0-3
t:i tT
-p- Ul 0

Together, the Crown and private trade figures suggest that in the 149os the Atlantic slave trade stood at almost 2,500 slave per year and that it declined slightly in I500-9 to c. 2,350 slaves. While private trade increased in this
period, the Crown trade decreased. The volume of trade shot up in 15 Io-I6, to c. 3,900 slaves per year, almost doubling in size. Despite the legislative damage to the trade of the Cape Verde Islanders, this overall high volume further rose in the following period to c. 4,800 slaves, owing to increases in the Crown trade and in the activity of the Gulf of Guinea settlers.
Both the direct figures, adjusted for double-counting, and the maximum estimates relating to the chief participants, suggest a slave trade volume far higher than most historians, with the exception of Magalhaes Godinho, have been willing to consider (see Table i). The gap between the quantitative evidence and the contemporary estimates of trading potential appears much narrower than it does when only the partial quantitative evidence is considered. The evidence pertaining to the chief participants unquestionably helps to shed light on the scope of the early Atlantic slave trade, and offers a base for judging the credibility of the contemporary general estimates of potential. It also provides key clues to the chronological and spatial distribution of the early Atlantic slave trade.
AN ESTIMATE OF THE REGIONAL AND CHRONOLOGICAL
DISTRIBUTION OF THE VOLUME OF THE EARLY ATLANTIC SLAVE
TRADE
Together, the narrative sources and quantitative evidence supply sufficient data to define the basic spatial and chronological categories needed for a slave trade distribution grid. The early Atlantic slave trade may be broken down into six distinct periods: 1450-64; I465-79; 1480-99; I500-9; I5I0-I5; and
1516-21. The opening years, 1450-64, combined fixed-point trading in the newly founded outpost of Arguim, and shipboard trading in Senegambia. The second period, I465-79, was marked by an expansion of the slave trade into the rest of Upper Guinea (Guinea Rivers, Sierra Leone and the Malagueta Coast), by severe disruptions attributable to Crown policies and by raids and interloping that arose from the war between Portugal and Castile in I474-9. The third period, I480-99, represented the 'good years' mentioned by Duarte Pacheco Pereira, the years of his first personal experience in West Africa in the service of D. Joao 11. In this period, the Portuguese control over access to the West African coast was reasserted, trading contacts in Upper Guinea were expanded and new ones were forged in the Gulf of Guinea. The years from 1500 to 1509 were marked by a slow but steady growth in slave exports from Upper Guinea and the Gulf of Guinea, accompanied by a significant decline of the Crown-controlled Arguim slave trade. The period from 15I0 to 15 was characterized by a dramatic increase in private trade, particularly in Upper Guinea, and a solid increase in the Arguim trade. The last period, 1516-21, was defined by a sudden predominance of the Crown-controlled Arguim trade, a dramatic expansion of the Gulf of Guinea trade and a sharp, if temporary, decline of the Upper Guinea trade.
The spatial distribution is determined not only by the supply potential of the African slave markets but also by the fact that areas of operation of the
62 IVANA ELBL

VOLUME OF THE EARLY ATLANTIC SLAVE TRADE, I450-I52I 63
Table 6. Regional provenance in the early Atlantic slave trade. An annual average volume estimate, based on quantitative evidencea
Gulf of Guinea and
Mauritanian Upper West-Central Period coast Guinea Africa Unspecified Total
1490-9 260 I,o70b 430c 700 2,460 1500-9 250 950 8 od 33oe 2,340 1510-15 500 1,88of 940g 590h 3,910 1516-21 1,220 80 3,3301 150 4,780
a Source: Table 5 and text. f Table 5, Cols. 1.4+2. +2.2. b Table 5, Cols. I.4+2. +2.2. g Table 5, Cols. 1.3+2.3. c Table 5, Cols. 1.3+2.3.
h Table 5, Cols. 1.1+2.4. d Table 5, Cols. 1.3 + 2.3. Table 5, Cols. 1.3+2.1+2.3.
Table 5, Cols. 1.1+2.4.
principal European participants tended to be geographically well defined. The early trade was concentrated in four broad regions: the Mauritanian coast, Upper Guinea, the Gulf of Guinea and West-Central Africa. Each of these main supply areas had its own characteristics and dynamics and drew on a different hinterland and different types of internal commercial networks, and each played a distinct role in the early slave trade. The quantitative evidence generated in connection with the Crown and private trade offers a basic insight into the relative contribution of each region (Table 6) but is again limited to the last three decades of the trade. It does help, however, to clarify the overall potential of the regional supply.
The Mauritanian coast
The Arguim trading station constituted the westernmost extension of the desert-edge trade routes linking the western trans-Saharan trade with the long-distance and interregional commercial networks that extended from the Niger Bend region to Senegambia and its hinterland. Arguim's supply capacity could thus have been very broad. However, the long-distance trade with the Niger Bend involved mostly gold, and most of the slaves sold by the Sanhaja and Arab merchants in Arguim came from inter-regional exchange circuits along the desert fringe of the Western Sahel, and represented the fallout of political frictions along the Senegal River and the Upper Niger.
In the period 1450-64 the Arguim outpost was the main Portuguese slave market. Cadamosto reported in the mid-I45os that as many as 800 to i,ooo slaves a year were purchased in Arguim by D. Henrique's men.135 Caddeo's 1929 critical edition of Cadamosto quotes a lower range: 700 to 800 slaves.136 Cadamosto obviously was not certain of his information and entered different figures in different drafts of his manuscript. The reliability of the
135 Cadamosto, Viagens, 18. 136 Ibid. n. 26.

information is clearly open to question. On the one hand, Cadamosto did not base his estimate on personal observation but on second hand reports. On the other hand, he was a Venetian raised in the tradition that each citizen traveling abroad should gather as much reliable, accurate information as possible and make it available to the Venetian state.'37 He probably tried to verify the information by consulting several sources, and that probability would explain the different sets of figures. The top estimate of i,ooo slaves per year likely refers to an exceptionally good year, whereas the estimate of 800 slaves per year represents an optimistic assessment of the overall potential of the area as a supplier of slaves. If we assume that Cadamosto's sources were well informed about the trade but that they referred to its potential rather than its actual performance and that Cadamosto's figures were exaggerated by c. go per cent, we obtain a range of c. 370-530 slaves per year, or an average of c. 440 slaves per year. This figure is almost identical with Arguim's overall yearly average in the period for which numerical evidence is available. However, the numerical evidence for I5I4-I9 also shows that Arguim was capable of supplying large numbers of slaves that would either match or even sharply exceed Cadamosto's figure. Adopting an average between Cadamosto's lowest figure (700 slaves per year) and the highest adjusted estimate (530 slaves per year), 600 slaves per year, for the first 15 years of the trade, when Arguim was the best established supplier to the Portuguese slave trade, appears to be the best compromise between excessive trust in a contemporary estimate and excessive caution.
The same reasoning partly applies to the following period, 1465-79, when Arguim's place as a leading slave trade centre had not yet been overshadowed by the Upper Guinea trade dominated by the Cape Verde islanders. The management of the outpost deteriorated, however, when the Crown took it over in the fall of 1463 and imposed direct administrative control from Lisbon.l38 Given the well-documented impact that mismanagement and administrative problems had on the Arguim slave trade in the 500s,139 some downward adjustment is indicated. The adjusted average of Cadamosto's estimates, 440 slaves per year, appears appropriate for this period. While there is no numerical evidence to support this figure, the value that the Crown placed on the Arguim factory was obviously high if its insistence on administering it directly is any indicator.
In the I48os and I490s, however, Upper Guinea not only replaced Arguim as the main supplier, but it may also have drawn slaves away from Arguim. The dramatic reversal of positions between Arguim and Upper Guinea in the late 15 Ios suggests that the two regions may indeed have at least partly relied on a shared inter-regional supply. The lowest adjustment of Cadamosto's estimate, 370 slaves per year, thus would appear as a reasonable 'guessti- mate'.
The problem is, of course, that no direct corroborating numerical evidence for this period is available. However, it is known that slaves from Arguim represented a large proportion of the slaves received by the Crown in Portugal. The number of slaves received by the central agencies can thus
137 A. B. Bozeman, Politics and Culture in International History (Princeton, I960), 467-8. 138 ANTT, Chancelaria de D. Afonso V, Liv. 9, f. 96.
139 See, for example, ANTT, Gaveta 20, maco 5, doc. 42.
64 IVANA ELBL

VOLUME OF THE EARLY ATLANTIC SLAVE TRADE, 1450-1521 65
help to ascertain whether the figures based on contemporary estimates are realistic. The numerical evidence shows that in 1486-97 these agencies received on average 6io slaves per year.140 Table 6 estimates 260 slaves from Arguim and 700 slaves of unspecified provenance in the 1490-9 period. These figures support the suggestion that the Arguim slave trade in the last two decades of the fifteenth century supplied some 400 slaves per year, while still allowing a generous margin for slaves originating from elsewhere.
In the first decade of the sixteenth century, the Arguim slave trade declined significantly. The numerical evidence shows that in this period the outpost supplied on average only 250 slaves per year.141 The decline resulted from a combination of two factors: severe problems in the management of the factory, and an increased supply of gold, a commodity which the Crown preferred to slaves, and which also put fewer demands on the operations and logistics of the factory.142
Arguim's slave trade began to grow again towards the end of the decade, partly as a result of the attempts by the new captain, Francisco de Almeida, to improve the factory's competitiveness and to promote it among the Sanhaja long-distance and inter-regional traders. As a result, the slave trade volume increased to 543 in I509-o0, but Almeida's recall in 1511 was followed by a dramatic drop to 294 slaves per year in 1512-13. In the course of 1514 the trading situation changed again, partly because of a switch from direct to indirect administration. In 1515, Arguim exported as many as 744 slaves, a sharp increase matching Cadamosto's figures for the opening decade. Because of the 1514 and 1515 expansion, the annual average for the period from 1510 to I5I5 is as high as 500 slaves (Table 6), double the annual average for the previous period.143
The last period, 1516-21, is characterized by an even sharper increase in the annual slave trade volume. Numerical evidence indicates that in this period the trade nearly doubled, from 744 slaves per year in 15i6 to 1,340 in 1517-20. As already suggested, the decline of the Upper Guinea trade may be partly responsible. The fact that in 1525 the lease on the Arguim outpost was set at an overwhelming 5,000,000 reis can be taken as an indirect sign that heavy trading was sustained into the i520S. The annual average for this period, 1,220 slaves,144 surpassed Cadamosto's highest figure, i,ooo slaves per year, attesting to the supply potential of the desert fringe networks. The overall annual average for I499-I52I, the period during which the Arguim
140 (475 slaves x 5 years) + (581 slaves x 4 years) + (830 slaves x 3 years) + (724 slaves x i
year) divided by 13 documented years = 609 slaves per year (see section 'Crown slave trade').
141 (257 slaves x 2 years)+(I 19 slaves x 3 years)+(33 slaves x i year) + (543 slaves x i year) divided by 7 (2+ 3 + + I years) = 249'3 slaves = annual average of c. 250 slaves.
142 The Arguim factory possessed a rather limited capacity to handle a larger volume of slaves at this time. Even when the assortment of merchandise used to pay for slaves matched the requirements of the market, and when the slaves were actually brought to the factory, the factor often did not have enough food for them, or else there was no suitable transport available to take them to Portugal (ANTT, Gaveta 20, maco 5, no. 42).
143 (543 slaves x I year)+(419 slaves x I year)+(294 slaves x 2 years)+(744 slaves x 2 years) divided by 6 years = annual average of 506 slaves.
144 (744 slaves x i year)+ (1,340 slaves x 4 years) divided by 5 years = annual average
of 1,221 slaves.

trade is covered by numerical evidence, is only 585 slaves,145 a figure that comes close to Cadamosto's estimate of i,ooo slaves per year adjusted for exaggeration, or 530 slaves.146
Upper Guinea
'Upper Guinea' refers to the portion of the West African coast bending south-east, from the month of the Senegal River to Cape Palmas. Where the early Portuguese slave trade is concerned, Upper Guinea can be divided into three trading sub-regions, each with specific characteristics: Senegambia (the coastal area between the Senegal and Gambia rivers); Guinea Rivers and Sierra Leone (from the mouth of the Gambia River to Sherbro Island); and the marginal slave trading region from the Sherbro Island to Cape Palmas, which included the Malagueta Coast. There are a number of reasons, however, for treating them under the broader term 'Upper Guinea', including the fact that Duarte Pacheco Pereira's key contemporary estimate pertains to this larger 'umbrella' region, and that all three sub-regions were included in the original privileges issued to the Cape Verde Islands settlers, the leading slave trade participants in the early period.
During the opening period, 1450-64, most of the Upper Guinea slaves were bought in Senegambia, the northernmost section of the coast. As late as 1460, the Gambia River represented the southernmost boundary of the European trade, although explorations progressed as far as the Guinea Rivers. Sierra Leone and part of Malagueta Coast were first explored only in 1461, and contact with the rest of Upper Guinea was established only in 1470-I.
The evidence for reconstructing the volume of the Senegambian slave exports in the opening period is fragmentary but illustrative. It consists of scattered contemporary references to the number of slave trading expeditions and the size of their cargo. In 1453 at least four royal caravels were trading off the coast of Senegambia.147 In 1455 three private ships are documented, all trading in slaves, and the same number again in I456.148 In 1460 five ships were present off the Senegambian coast.149 The surviving documentation shows that on average at least four slave trading ships visited the Sene-
gambian coast each year in the period. The actual number was very probably higher. The cargo of three of these expeditions is known, and this information can serve as a basis for an average cargo estimate: one of D. Henrique's ships, captured by Andalusian pirates in 1452, carried 66 slaves;150 Cadamosto bought ioo slaves in 455 ;151 and Usodimare returned with forty slaves the
145 This figure was obtained by adding up the volume of trade in the years for which data are available and then dividing the result by the number of years.
146 Assuming that Cadamosto's contemporary estimate of i,ooo slaves per year represents I90 per cent of the actual volume (see 'Evaluation of evidence'), the adjusted average can be obtained by dividing I,ooo by 190 and multiplying the result by o00. ,000o
slaves divided by I90 (per cent) x I00 = 526 slaves = c. 520 slaves. 147 Silva Marques, Descobrimentos, i, 501-2, doc. 309; and ibid. Supplement to i, 352,
doc. 226. 148 Cadamosto, Viagens, 50, 60. 149 Gomes, Viagens, 45-6. 150 Archivo Municipal de Sevilla, Actas Capitulares, Aug.-Oct., f. og9. 151 Ibid. 35.
66 IVANA ELBL

VOLUME OF THE EARLY ATLANTIC SLAVE TRADE, I450-I52I 67
same year.152 The average of these three figures suggests that seventy slaves may represent a reasonable estimate of the number of slaves carried by each slave-trading expedition. As at least four documented expeditions visited the Senegambian coast each year in this period, 280 slaves constitute the minimum annual volume of the Upper Guinea slave trade in this period.
The next period, 1465-79, is poorly documented, ambiguous and con- fusing. On the one hand, there is indirect evidence that the Upper Guinea slave trade not only continued but intensified. The two principal reasons are the entry of the Guinea Rivers and Sierra Leone into the Atlantic slave trade and the establishment of the Cape Verde Islands settlement, which provided a permanent trading base close to the African mainland. The Cape Verde islanders quickly developed an intense interest in the slave trade and defended it eloquently before the Crown.153 Also, exports of horses from Portugal to Upper Guinea increased considerably in this period and were seen by many Portuguese as an attractive source of profit. Since horses were mostly sold for slaves, the increasing exports of horses indicate a lively trade in slaves. On the other hand, in 1469-74 the trade probably suffered as a result of Crown intervention, especially the restriction on licences author- izing trade in West African waters, and from attempts to protect the interests of Fernao Gomes, who obtained a five-year lease on the entire coast of West Africa. Between 1474 and I479, the war between Portugal and Castile sparked an intense wave of Castilian interloping, raiding and attacks on Portuguese vessels. Santiago, the main Cape Verde Islands settlement, was raided and briefly seized in 1475, and a number of Castilian and foreign expeditions licensed by Queen Isabela competed with the Portuguese- sponsored trade. Under these circumstances, the best way of reaching an estimate for this period is to adopt Pacheco Pereira's suggestion that when the trade was not 'well ordered' it dropped by one half, and reduce his overall estimate for the subsequent period, 3,500 slaves, to 1,750 slaves and further adjust this figure by the 47 per cent exaggeration margin. The result would be c. 900 slaves per year, a figure quite compatible with later developments in the Upper Guinea trade.
The years 1480-99 are those covered by Duarte Pacheco Pereira's comprehensive estimate of the Upper Guinea slave trade. The estimate is included in his summary of the explorations of D. Henrique (Henry the Navigator) and their benefits to Portugal. In a context that is thus panegyric and inviting of exaggeration, Pacheco Pereira states that 'quando o comercio d'esta terra estaua bem ordenado, em cada hum anno se tirauam d'ella tres mil e quinhentos escrauos e mays...' ['when the commerce of this land [Upper Guinea] was well ordered, each year 3,500 slaves were brought from there and more...'].154 This volume, which according to Pacheco Pereira was sustained over a number of years, was not reached even in 15 10- 5, when the Upper Guinea slave trade stood at its peak, although the overall volume from
152 A. J. Dias Dinis (ed.), Monumenta henricina (I5 vols.) (Coimbra, I960-74), xiii, 192.
153 See the founding charter from 1466 (ANTT, Livro de Extras, ff. 0o-i ) and the violations of the charter that the Santiago settlers supposedly committed in the early I470s (Silva Marques, Descobrimentos, iii, 107-9, doc. 8I). 154 Pacheco Pereira, Esmeraldo, 98.

all sources probably exceeded it (Table 6). The estimate is thus obviously exaggerated. The question is by how much. If the 47 per cent exaggeration margin is applied, the estimate is reduced to 1,855 slaves per year, a figure that roughly corresponds to the 1510-15 volume of the Upper Guinea slave trade (Table 6).
There are two ways of putting the applicability of this estimate to the test: the first one involves looking at the rate of exaggeration involved in Pacheco Pereira's estimate of the volume of the Portuguese gold trade; the second requires that one consider the numerical evidence for the I490S. Pacheco Pereira's gold trade estimate is particularly valuable, because there exists more or less complete numerical evidence against which it can be compared. In his view, the Gold Coast exported 890 to 899 kg (200,000-202,000 dobras) of gold each year. The quantitative evidence shows, however, that in his time the Mina gold exports fluctuated between 225 and 647 kg (225-4 kg in
1487-9; 647-2 kg in 1494-6; 37I'I kg in 1497-1500). The average volume is
4I102 kg of gold per year,155 a figure that matches the average Mina exports in the first two decades of the sixteenth century. J. L. Vogt argued that 20 per cent most be added to this figure to account for undocumented private trade, which raises the annual average to 492 kg of gold. With this adjustment, Pacheco Pereira's estimate of the Gold Coast trade would be 45-3 per cent higher than the actual volume, which is almost exactly the level of the exaggeration margin suggested by Curtin's figures.
This procedure gives some credibility to the adjusted estimate for the Upper Guinea slave trade volume based on Pacheco Pereira. The question is whether the numerical evidence for this period will support it as well. The fullest set of quantitative data for this period, relating to I49I-3, suggests a volume of slightly over ooo slaves, a figure more than 800 slaves lower than the adjusted contemporary estimate. The quantitative data are, however, incomplete, and the number of slaves who were received in Portugal but whose regional origin cannot be ascertained is very high. If many of these slaves had come from Upper Guinea, the gap between Pereira's adjusted estimate and the numerical evidence would be considerably narrowed. Still, the figure of I,8oo slaves per year can be accepted only as referring to exceptionally good years within the 1480-99 period. A more reliable estimate can be obtained if we work with the range of Pacheco Pereira's assessment of the Senegal slave trade in the same period: he claimed that whereas in 'good years' 400 slaves were exported from that region, in those 'years when the trade was not well ordered' the number dropped to 200. Thus if we take the average between 1,800 (the 3,500 slaves estimate adjusted for exaggeration) and cut that figure by 50 per cent, the resulting overall estimate will be I,350 slaves per year, one that is easily compatible with the numerical evidence.
The numerical evidence suggests that in the following period, I500-9, exports from Upper Guinea increased, at least as far as the settlers of the Cape Verde Islands were concerned. This development is not entirely consistent with Pacheco Pereira's claim that the volume of the Upper Guinea slave trade was in decline at the time when he wrote his Esmeraldo de Situ Orbis, c. 1505-6. It is possible, however, that he was influenced solely by the
155 (225.4 kg x 3 years) + (647-2 kg x 3 years) + (371 kg x 4 years) divided by io years =
4I0'2 kg per year.
68 IVANA ELBL

VOLUME OF THE EARLY ATLANTIC SLAVE TRADE, I450-I52I 69
downward trend in the Crown trade. The surviving numerical data offer evidence only for the trade carried on by the Cape Verde islanders. Little information is available concerning the Crown trade, trade carried on by private parties based in the Cape Verde Islands, or by lease-holders. However, since the trade of the Cape Verde islanders shows a possible increase of up to 19 per cent, it would seem reasonable to adjust upward by I9 per cent the overall estimate for the previous period (1,350 slaves per year), arriving at I,600 slaves per year.
The following period, 1510-15, is by far the best documented, and even more important, optimal direct evidence is available for the years 15 4 and 155. This evidence is, again, limited to the Cape Verde islanders' trade, but it unequivocally documents sharp growth, up to the level of i,400 slaves per year. Slave exports by lease-holders amounted to c. 300-400 slaves per year. Figures for the Crown trade and private expeditions not originating in the Cape Verde Islands are not available. The quantitative data thus easily bear out Duarte Pacheco Pereira's maximum estimate (minus a 47 per cent exaggeration margin): 1,850 slaves per year. The estimate based solely on quantitative evidence suggests almost I,900 slaves. An upward adjustment may in fact be necessary, given the close fit between the adjusted estimate of potential and the numerical evidence, and given the fact that data on some participants are not available. Thus, 2,000 slaves from Upper Guinea per year may represent a more realistic figure for this period. The 15 11 estimate of revenue potential suggests that most of these slaves were purchased in the Guinea Rivers. Senegal, Gambia and Sierra Leone played a much lesser role at that time.
As already mentioned, the last period, 1516-21, was characterized by heavy Crown intervention in the Upper Guinea trade. The Crown's policies seem to have almost completely disabled the Cape Verde islanders' trade and reduced it, between 1519 and 1521, to c. seventy to eighty slaves per year. It is impossible to establish whether the Crown picked up some of the slack, because no figures are available. However, the fact that before 1525 the Crown had reversed its policy and that by 1525 the islanders' trade had almost returned to its I510 level suggests that the Crown's attempt at monopolizing the region was not successful. From 1516 to 1521, however, the disruption was severe and the volume of trade may have dropped to the level at which it had stood in the beginning (I450-64), c. 280 slaves annually. Direct Crown involvement might have increased but there is no evidence to support the assumption or to allow a guess.
The Gulf of Guinea and West-Central Africa These two broad areas must be considered together because exports from both are recorded indiscriminately in documents pertaining to the Gulf of Guinea Islands. The Gulf of Guinea region encompassed the Niger Delta, the Bight of Biafra, and the Cameroons, all of which were frequented primarily by expeditions from Sao Tome and Principe, although the Portuguese Crown was also an important participant, particularly in the Niger Delta, and lease-holders also played an important role. Most exports from West-Central Africa originated in the Kingdom of Kongo, although
toward the end of the opening period its southern neighbors were gradually pulled into the trade, including Angola.
In the Gulf of Guinea trading began almost at the same time as the Portuguese arrived there in the i470s. The trade was limited mostly to the Niger Delta. The Lagos Lagoon in the west and Mount Cameroon in the east constituted the boundaries of the Portuguese operations in this period. Until the establishment of viable settlements on the Sao Tome and Principe Islands, slave trading was limited to shipborne expeditions originating in Portugal. However, the number of slaves these expeditions could carry could be substantial: in 1479, for example, Fernao de P6's expedition returning from the Niger Delta carried 400 slaves.156 It may thus be reasonable to assume that in the opening period of the Niger Delta slave trade, 1475-9, the volume may have been as high as 400 slaves a year.
This volume may have been sustained into the next period, 1480-99, and it may even have grown somewhat. The establishment of the fortress of Sao Jorge da Mina, coupled with the attempts at settling Sao Tome, should have intensified the demand for slaves. However, because the numerical data are extremely scanty for this period and, if anything, suggest a very low volume of trade, it is impossible to determine whether this demand was translated into a corresponding increase in the volume of the slave trade. In the absence of reliable evidence, it may be safer to assume that 450 slaves constituted the average annual volume of the slave trade from the two areas in this period.
The period 1500-9, when both Sao Tome and Principe were effectively settled, is much better covered by quantitative evidence, and it also offers a contemporary general estimate. In I506, Valentim Fernandes, or rather his informant, Goncalo Piriz, claimed that in the early I50os there were at least 2,000 slaves in Sao Tome serving some i,ooo settlers, and at times as many as 5,000-6,000 slaves for resale.157 If the estimate were accurate, Sao Tome would have been the most important slave trade entrepot in this period. However, Fernandes' figures seem far too large when confronted with the available numerical evidence.
First of all, the persistent shortage of slaves in Sao Jorge da Mina, the closest market for slaves, has to be considered. In the I490s, Sao Jorge da Mina was able to purchase only fewer than a hundred slaves per year from Sao Tome, a situation which did not improve much in the first decade of the sixteenth century. The Sao Tome settlers imported only about 240 per year in the I490s. As already mentioned, in 1500-9 Mina received only c. 200 slaves per year, both from its own trade and through purchase from the Sao Tome settlers. While these low figures can be blamed on unrealistic Crown policies, they are still far too small to support a turnover of the magnitude claimed by Fernandes.
The credibility of Fernandes' high estimate is further undermined by the low volume of the settlers' trade and by the modest value of leases and tax farms paid in connection with trade in the Gulf of Guinea. The 1502-3 leases on two Niger Delta trading areas suggest maximum purchases of only 202 to 267 slaves.158 Admittedly, we must take into consideration unrecorded trade
156 de la Fosse, 'Viagem', 472. 157 Valentim Fernandes, 0 manuscrito 'Valentim Fernandes', ed. Ant6nio Baiao
(Lisbon, 1940), 122. 158 See n. 107.
70 IVANA ELBL

VOLUME OF THE EARLY ATLANTIC SLAVE TRADE, 1450-1521 71
by other privileged parties, such as the settlers of Sao Tome and Principe. Around 1511, the settlers bought between 330 and 440 slaves per year.159 If we assume that this figure can be extended to the period 1500-9 as well, the volume of the Gulf of Guinea slave trade, combining the Crown trade, lease proceeds and settlers' trade, would amount only to a maximum of c. 8io slaves (Table 6), less than a seventh of Fernandes' estimate. It also can be argued that the figures for Mina and the Gulf of Guinea islands cannot simply be added because Sao Tome was a major source of slaves for Mina. On the other hand, there was the illicit trade, which may have been substantial and might make up for possible double-counting. All things considered, 800 slaves per year appears to be a reasonable estimate for the combined Gulf of Guinea and West-Central Africa exports.
This conclusion leaves the difficult question of the respective shares of the two regions. West Central Africa did not enter the Atlantic slave trade until after the establishment of relations between Portugal and the Kingdom of Kongo in 1491 and the effective settlement of Sao Tome after 1500. In the 1490s, Kongo played a very limited role as a supplier of slaves. According to Duarte Pacheco Pereira, slaves were available there, but only in small quantities.160 Hilton claimed that Kongo did not export slaves until after i506, when D. Afonso I assumed the kingship.161 According to her, some war captives were exported between 1506 and 516, as Fernao de Mello, the captain of Sao Tome, and as a significant number of Sao Tomeans established residence in, and firmer trading relations with, Kongo. Exports intensified only after 1512, the year of the renewed Portuguese diplomatic initiative, as the king of Kongo became pressed to reciprocate for Portuguese gifts with shipments of slaves.162 Thornton, on the other hand, had argued that Kongo became an important exporter of slaves already around 1500 and that half or more of the Sao Tome slaves came from there.163 However, the evidence provided by Pacheco Pereira, the terms of the leases and implicit hints in documentary sources, suggest that in the 149os and 50oos Sao Tome drew mostly on the Gulf of Guinea for its supply of slaves and that Kongo was only a marginal source. In the I49os Kongo's contribution was probably negligible, and in the first decade of the sixteenth century 20 per cent of the trade may represent a generous estimate of its share.
The I5 Ios saw a dramatic growth in slaving, as both the Gulf of Guinea islands and the Portuguese Crown targeted West Central Africa as a potentially important supplier of slaves. For the Crown the impetus was the intensification of diplomatic ties with Kongo, for the islanders the urgent need for labor and the complications that Ant6nio Carneiro's lease on the Niger Delta created in the trade with the Gulf of Guinea, which probably declined slightly in this period. There was a sharp struggle for the West- Central African markets between the Crown and the Sao Tome islanders, in which the latter temporarily gained an upper hand. Although the letters from D. Afonso I of Kongo hint at relatively large shipments to Portugal, the
159 See n. IIo. 160 Pacheco Pereira, Esmeraldo, 134: 'nesta terra se Resguatam alguus escrauos em pouca
candidade'. 161 Anne Hilton, The Kingdom of Kongo (Oxford, 1985), 52. 162 Hilton, Kingdom of Kongo, 57-8. 163
Thornton, Africa and Africans, 96.

volume is very difficult to establish.164 The quantitative evidence supports an annual volume of slightly less than I,ooo slaves for both regions in 1510-15 (Table 6). Given the troubles in the Gulf of Guinea trade, West-Central Africa may have been responsible for most of the increase, assuming a share of c. 40 per cent of the trade.
It is very likely that by 1516 West Central Africa had become the fastest growing, and possibly even the largest, supplier of the Atlantic slave trade. In 1516, an unprecedented 4,307 slaves were registered as imported to Sao Tome. A qualified observer predicted potential imports of almost 7,000 slaves in 15 17. The common assumption is that they came from Central West Africa. However, the document from which this figure comes does not state that Kongo, or West Central Africa, was the sole or even principal source of these slaves. Still, the fact that the imports from the Gulf of Guinea were usually in the range of hundreds, not thousands, supports the notion that trade with West Central Africa accounted for the dramatic increase. The wars waged within the kingdom of Kongo and on its periphery could conceivably have generated a large volume of captives. Moreover, ships from both Sao Tome and Principe continually sought to expand their contacts and sources of supply both inside and outside of Kongo, drawing Angola into the trade by 1519 at the latest.
The question is whether the high volume documented in 1516 was sustained. The available quantitative data, which are quite fragmentary for the rest of the period, justify a maximum estimate of only some 3,300 slaves per year (Table 6). Even this figure, however, represents a dramatic increase over the previous periods. Another projection, based on the I 525 estimate of revenue potential, suggests an annual figure of c. 3,000 slaves. Given the scanty nature of the evidence available for most of the I 517-21 period, the latter projection might be more realistic. Such sizeable annual imports, however, raise the question of the final destination of the slaves. Garfield estimated that at the peak of the sugar boom, Sao Tome plantations required some I2,000 field hands.165 The rest of the island economy may have generated an equal demand for labor, so that the overall demand for a sustained labor force could have stood at about 24,000 slaves. Mina's average imports are estimated at 600 slaves annually in the late I5ios (Table 6), a demand which continued into the I520S. Given the acute labor shortage experienced by Sao Tome earlier in the 15IOS, it seems quite realistic that 3,000 slaves imported annually would have found an easy market, with a vast majority of them (some 75 per cent) most likely originating from West- Central Africa.
CONCLUSIONS
In the opening period of the Atlantic slave trade the Europeans are estimated to have purchased almost 156,000 slaves, or almost 2,200 slaves annually (Table 7). The trade experienced steady growth, in particular as a result of the involvement of settlers from the Cape Verde and Gulf of Guinea Islands. At the end of the fifteenth century, the annual volume of the trade tripled,
164 Thornton suggested that from i512 onward Kongo may have shipped 300-500
slaves annually to Spain (Africa and Africans, 97). 165 Garfield, History, 79-80.
72 IVANA ELBL

0
Table 7. The early Atlantic slave trade. An estimate of its volume and spatial and chronological distribution
Mauritanian coast Upper Guinea Gulf of Guinea West-Central Africa -------_ ~Total volume
Slaves Slaves Slaves Slaves Slaves Slaves Slaves Slaves -t
per per per per per per per per Slaves Slaves
year period year period year period year period per per year period >
Regional Change Regional Change Regional Change Regional Change Change d
share from share from share from share from Change from from < over preceding over preceding over preceding over preceding preceding opening >
Period period period period period period period period period period period H
1450-64 600 9,000 280 4,200 0 0 0 0 880 13,200 n/a z
68 % n/a 32% n/a n/a o % n/a o n/a n/a I465-79 440 6,6oo 900 13,500 [I33] [2,000] 0 0 1,470 22,100 +67 % Q
30% -27 % 6i% +2215% 9 % n/a/ 0% n/a +670% 0
I480-99 400 8,o000 ,350 27,000 450 9,000 0 0 2,200 46,000 +150O% 18 % -10 % 6 % + 50 % 21% + 238 % 0 % n/a +50% <
I500-9 250 2,500 i,6oo I6,000 640 6,400 i60 1,600 2,650 25,500 +201 % M
9 % -37.5 % 61 + I8-5 % 24 o +42 % 6 % n/a +20-5 % H 1510-15 500 3,000 2,000 12,000 600 3,600 400 2,400 3,500 21,000 +298% >
14 % + Io00 57 % +25o 1 - 25% -62 o 12% +I50% +32% tt
I5I6-21 1,220 7,320 280 i,680 750 4,500 2,250 13,500 4,500 27,000 +411'4%0
27 % + 44% 60% -85% I 7% +25 o 50% +462-5 % +28-6 %o - All 506 36,420 1,033 74,380 534 25,500 795 I7,500 2,164 i55,8oo +146% O
t3o

from under 900 slaves in I450-65, to 2,200 slaves in I480-99. In the course of the first two decades of the sixteenth century it nearly doubled again, from 2,650 slaves in 1500-9 to 3,500 slaves in 1510-15 and 4,500 slaves in 15 16-21.
Upper Guinea was the richest source of supply most of the time: in four out of the six periods documented in this paper it supplied some 60 per cent of the slaves bought by the Portuguese (Table 7). The Mauritanian Coast was the main supplier in the first period, I450-65. In the last period, when trading in Upper Guinea was temporarily choked off by the Crown, it was West-Central Africa that assumed the leading role, delivering 50 per cent of the slaves, with the Mauritanian Coast coming a distant second with its 30 per cent. The share of the Gulf of Guinea lingered from 1480-99 onward at c. 20 per cent of the total. In the last period, 1516-2I, the West African
regions appear outperformed by West-Central Africa, which dramatically boosted the trade of the Gulf of Guinea islands.
The overall pattern suggests that the African slave supply was very responsive to the European demand, as witnessed by the rapid establishment of commercial contacts in newly explored regions and by the equally rapid growth in volume. Most instances of either regional or overall decreases were not the consequence of bottlenecks in supply but rather of Crown policy and the problems the Crown enterprise faced in West Africa. The best examples of this are the decline in the volume of the Mauritanian trade over most of the period, at least in part due to the poor management of the Arguim factory; the temporary suppression of the Cape Verde Islands trade; the impact of the trading restraints that the Crown imposed on the Gulf of Guinea islanders; and the unrealistic Crown pricing policies. Where such constraints were absent, volume increases invariably followed the es- tablishment and consolidation of the Portuguese trading infrastructure. The best example is the trade with Upper Guinea, which expanded dramatically after the settlement of the Cape Verde Islands had provided a permanent offshore base and removed the logistic limitations faced by shipborne expeditions from Portugal.
However, the role of the supply side must not be underestimated. The Europeans were competing with a domestic and inter-regional demand for slaves, which could effectively limit, and in some cases choke off, the supply. The periodic drying-out of the Mauritanian supply may have resulted from the re-orientation of the Senegambian inter-regional trade to the Guinea Rivers as well as from the competitive pull of the Saharan and North African markets. The relative decline of Senegal as a slave supplier may attest to the domestic demand for slaves, especially in the on-going power struggles, as well as to the availability of other market outlets. The iron-handed control that the Oba of Benin exercised over slave supply to the Portuguese represents another instance of stiff competition for allocation of slaves. The domestic importance of slaves and the keen struggle for profits from the slave trade also emerge from the attempts of the rulers of Kongo to control supply from West-Central Africa.
Overall, the supply patterns discernible in the early Atlantic slave trade
support John Thornton's key conclusions about slavery as a core aspect of African social structures and the indirect interaction between enslavement and the export slave trade. The early Atlantic slave trade tapped into pre-
74 IVANA ELBL

VOLUME OF THE EARLY ATLANTIC SLAVE TRADE, 1450-1521 75
existing patterns of reliance on slaves as sources of wealth and power. Converting slaves into another form of wealth was one possible utilization of slaves as a resource, as opposed to domestic exploitation. The Europeans were seldom the only available buyers, and their success depended very much on their competitiveness and appeal.166
SUMMARY
The article seeks to establish a comprehensive estimate of the volume of the Atlantic slave trade in its opening period, 1450-I521, when it was almost
exclusively under the control of Portugal. The conclusions appreciably raise the figures hitherto suggested by most modern scholars. The first section describes and evaluates the available sources, both narrative and quantitative, and outlines calculation methods applicable to them. The second section establishes the respective shares of the Portuguese Crown and of private traders in the Atlantic slave trade, as reflected in the surviving quantitative data. It shows that the private trade significantly exceeded that of the Crown. The third part reconciles con- temporary volume estimates and quantitative data in order to assess the temporal and regional distribution of slave exports from Africa. The study concludes that Europeans exported approximately 156,000 slaves from Atlantic Africa between I450 and I52I. The trade experienced steady growth. The annual volume had tripled between I450-65 and I480-99, from 900 slaves to 2,200 slaves per year, and it doubled again in the course of the first two decades of the sixteenth century. Upper Guinea was the most important supplier of slaves for most of the period under investigation, accounting for 60 per cent of the total number of slaves. The Mauritanian coast was the key player in the opening period, 1450-65, and became significant again in 15 16-2 I, when the Upper Guinea trade was temporarily choked off by the Crown. By then, however, it was outperformed by West-Central Africa. The overall pattern of trade suggests that the African slave supply was very responsive to European demand but that the Europeans' success in the slave trade depended on their competitiveness and on the market appeal of their goods, as they seldom were the only available buyers.
166 Thornton, Africa and Africans, 73-I i6.