Volume No. I Issue No. 71 HCL Technologies Ltd. · PDF fileoutsourcing and IT infrastructure...
10
. . 50 70 90 110 130 May-15 Jun-15 Jul-15 Aug-15 Sep-15 Oct-15 Nov-15 Dec-15 Jan-16 Feb-16 Mar-16 Apr-16 May-16 HCLTECH NIFTY One year Price Chart Poised for growth HCL Technologies is engaged in providing a range of software, business process outsourcing and IT infrastructure services. The company has a wide geographical presence across 32 countries. It has a strong workforce of more than 104,000 employees. Investment Rationale Well poised to exploit the growth opportunity: NASSCOM estimates SMAC (social, mobility, analytics and cloud) revenues to account for c.20% of the total revenue of Indian IT companies in 2020, from current levels of ~5%. Internet of Things (IoT) connected devices are expected to increase to 6.4 bn and 20.8 bn by 2016 and 2020 respectively. The IoT spending is expected to witness 22% growth in 2016 to reach USD235 bn. Importantly, HCL Tech has made huge investments in Beyond Digital and IoT space over the last couple of quarters. We expect the company to make further investment to capture the huge growth opportunity in this space and that gives us confidence of continued traction in large deal wins going ahead. Focus on digitalization to provide scale: In an environment where severe competition and pricing pressure in traditional IT services are eating away the margins of the software service providers, the company has made a strategic shift towards digital technologies and automation in the traditionally manual areas of business. HCL Tech has created differentiation by focusing on Beyond Digital, Next– Gen ITO and IoT WoRKS initiatives. The higher adoption of digital technologies will enhance its pricing power and will also provide scalability to its business. Uptick in deal wins; key to growth: HCL Tech is witnessing traction in large deals, which is clearly visible from its 25 transformational deal wins in 9MFY16 with TCV of more than USD 4 bn. Besides, HCL Tech’s leadership position in the Infrastructure management services (IMS) space and its continued deal wins in the rebid market reinforces our confidence of further deal wins from this space (TCV worth ~USD 146 bn expected over the next three years; IMS to account for 55% of the total rebid opportunity). Acquisition of Geometric strengthens its engineering services capabilities: Engineering and R&D Services (ER&D) services remains the key focus area of HCL Tech (contributing 19% to total revenue). The acquisition of Geometric will further enhance its capabilities primarily in the product lifecycle management (PLM) consulting as well as in mechanical and manufacturing engineering. The deal brings in various synergy benefits and provides HCL Tech access to Geometric’s 60 global clients in US and Europe. It would enable the company to cross sell its ER&D expertise to Geometric’s clients. Valuation: Sustained momentum in large deal coupled with its competence in the IMS and ER&D space, will aid growth and provides scalability to its business. We expect revenue and Adj. PAT to grow at a CAGR of ~31% and ~22% over FY16-18E. We initiate coverage on the stock with a BUY rating with a target price of Rs. 828 (based on FY18E P/E of 14x), implies a potential upside of ~15% over the next 1 year. Rating BUY CMP (Rs.) 723 Target (Rs.) 828 Potential Upside 15% Duration Long Term Face Value (Rs.) 2 52 week H/L (Rs.) 1,044.9/706.4 Adj. all time High (Rs.) 1,058 Decline from 52WH (%) 30.8 Rise from 52WL (%) 2.3 Beta 0.8 Mkt. Cap (Rs.Cr) 101,972 Market Data Fiscal Year Ended May 13, 2016 BSE Code: 532281 NSE Code: HCLTECH Reuters Code: HCLT.NS Bloomberg Code: HCLT:IN For private circulation only Promoters (%) 60.4 60.4 0.0 Public (%) 39.6 39.6 0.0 Others (%) - - - Y/E FY15 FY16 FY17E FY18E Revenue (Rs.Cr) 36,701 30,781 46,046 52,500 Adj. Net profit (Rs.Cr) 7,317 5,643 7,526 8,343 Adj. EPS (Rs.) 52.0 40.0 53.4 59.2 Adj. P/E (x) 13.9 18.1 13.5 12.2 P/BV (x) 4.2 3.7 3.2 2.7 ROE (%) 33.4 21.9 25.4 24.1 Shareholding Pattern Mar-16 Dec-15 Chg. Volume No. I Issue No. 71 HCL Technologies Ltd. .
Transcript of Volume No. I Issue No. 71 HCL Technologies Ltd. · PDF fileoutsourcing and IT infrastructure...

.
.
507090
110130
May
-15
Jun
-15
Jul-
15
Au
g-1
5
Sep
-15
Oct
-15
No
v-1
5
Dec
-15
Jan
-16
Feb
-16
Mar
-16
Ap
r-1
6
May
-16
HCLTECH NIFTY
One year Price Chart
Poised for growth HCL Technologies is engaged in providing a range of software, business process outsourcing and IT infrastructure services. The company has a wide geographical presence across 32 countries. It has a strong workforce of more than 104,000 employees.
Investment Rationale
Well poised to exploit the growth opportunity: NASSCOM estimates SMAC
(social, mobility, analytics and cloud) revenues to account for c.20% of the total
revenue of Indian IT companies in 2020, from current levels of ~5%. Internet of
Things (IoT) connected devices are expected to increase to 6.4 bn and 20.8 bn by
2016 and 2020 respectively. The IoT spending is expected to witness 22% growth in
2016 to reach USD235 bn. Importantly, HCL Tech has made huge investments in
Beyond Digital and IoT space over the last couple of quarters. We expect the
company to make further investment to capture the huge growth opportunity in this
space and that gives us confidence of continued traction in large deal wins going
ahead.
Focus on digitalization to provide scale: In an environment where severe
competition and pricing pressure in traditional IT services are eating away the
margins of the software service providers, the company has made a strategic shift
towards digital technologies and automation in the traditionally manual areas of
business. HCL Tech has created differentiation by focusing on Beyond Digital, Next–
Gen ITO and IoT WoRKS initiatives. The higher adoption of digital technologies will
enhance its pricing power and will also provide scalability to its business.
Uptick in deal wins; key to growth: HCL Tech is witnessing traction in large
deals, which is clearly visible from its 25 transformational deal wins in 9MFY16 with
TCV of more than USD 4 bn. Besides, HCL Tech’s leadership position in the
Infrastructure management services (IMS) space and its continued deal wins in the
rebid market reinforces our confidence of further deal wins from this space (TCV
worth ~USD 146 bn expected over the next three years; IMS to account for 55% of
the total rebid opportunity).
Acquisition of Geometric strengthens its engineering services capabilities:
Engineering and R&D Services (ER&D) services remains the key focus area of HCL
Tech (contributing 19% to total revenue). The acquisition of Geometric will further
enhance its capabilities primarily in the product lifecycle management (PLM)
consulting as well as in mechanical and manufacturing engineering. The deal brings
in various synergy benefits and provides HCL Tech access to Geometric’s 60 global
clients in US and Europe. It would enable the company to cross sell its ER&D
expertise to Geometric’s clients.
Valuation: Sustained momentum in large deal coupled with its competence in the
IMS and ER&D space, will aid growth and provides scalability to its business. We
expect revenue and Adj. PAT to grow at a CAGR of ~31% and ~22% over FY16-18E.
We initiate coverage on the stock with a BUY rating with a target price of Rs. 828
(based on FY18E P/E of 14x), implies a potential upside of ~15% over the next 1 year.
Rating BUY CMP (Rs.) 723
Target (Rs.) 828 Potential Upside 15% Duration Long Term
Face Value (Rs.) 2
52 week H/L (Rs.) 1,044.9/706.4
Adj. all time High (Rs.)
1,058
Decline from 52WH (%)
30.8
Rise from 52WL (%) 2.3
Beta 0.8
Mkt. Cap (Rs.Cr) 101,972
Market Data
Fiscal Year Ended
May 13, 2016
BSE Code: 532281 NSE Code: HCLTECH Reuters Code: HCLT.NS Bloomberg Code: HCLT:IN
For private circulation only
Promoters (%) 60.4 60.4 0.0
Public (%) 39.6 39.6 0.0
Others (%) - - -
Y/E FY15 FY16 FY17E FY18E
Revenue (Rs.Cr) 36,701 30,781 46,046 52,500
Adj. Net profit (Rs.Cr)
7,317 5,643 7,526 8,343
Adj. EPS (Rs.) 52.0 40.0 53.4 59.2
Adj. P/E (x) 13.9 18.1 13.5 12.2
P/BV (x) 4.2 3.7 3.2 2.7
ROE (%) 33.4 21.9 25.4 24.1
Shareholding Pattern Mar-16 Dec-15 Chg.
Volume No. I Issue No. 71 HCL Technologies Ltd.
.

IOT connected devices is
expected to increase to 6.4 bn
in 2016 and to 20.8 bn by
2020.
For private circulation only
HCL Technologies Ltd: Business overview
Incorporated in 1991, HCL Technologies is engaged in providing a range of software, business
process outsourcing and IT infrastructure services. The company provides technology service
across various verticals including financial services, manufacturing (automotive, aerospace, hi-
tech and semiconductors), telecom, retail and consumer packaged goods services.
Geographically, the company has diverse presence across 32 countries including Americas,
Europe, Asia Pacific, Middle East and Africa. Its global strategic alliances have some reputed
names that includes Microsoft, Cisco, SAP, HP, etc. It has a strong workforce of more than
104,000 employees.
HCL tech’s service mix Geographic mix
Source: Company, In-house research
Well placed to ride on strong growth opportunities in IT industry
NASSCOM estimates SMAC (social, mobility, analytics and cloud) revenues to account for
c.20% of the total revenue of Indian IT companies in 2020, from current levels of ~5%. IoT
connected devices is expected to increase to 6.4 bn in 2016 and to 20.8 bn by 2020 with the
IoT spending to witness 22% growth in 2016 to reach USD235 bn. HCL has made strong inroads
into the digital space through its deep focus on the Next-Gen ITO (Next Generation
Information Technology Outsourcing), IoT (Internet of things) and digital. Beyond Digital was
launched in 2015 and provides digitalization services to its customers. Further, the company
has established a dedicated Business Unit, IoT WoRKS, in an endeavor to become the most
valued IoT service provider globally by providing end–to–end offerings for organizations across
different IoT adoption levels. All these initiatives are bearing fruits as the company is already
witnessing traction with 30% of the new deals are coming from discrete offerings around
Digitalization and IoT.
HCL Tech has made huge investments made in Beyond Digital and IoT space over the last
couple of quarters and we expect the company to make further investment to capture the
huge growth opportunity in this space, lends confidence of further traction in large deal wins
going ahead.
Application
Services, 40.4%
Infrastructure
Services,35.5%
Business Services,
5.3%
Engineering and
R&D Services,
18.8%
Americas,
60.2%
Europe, 30.1%
ROW, 9.7%
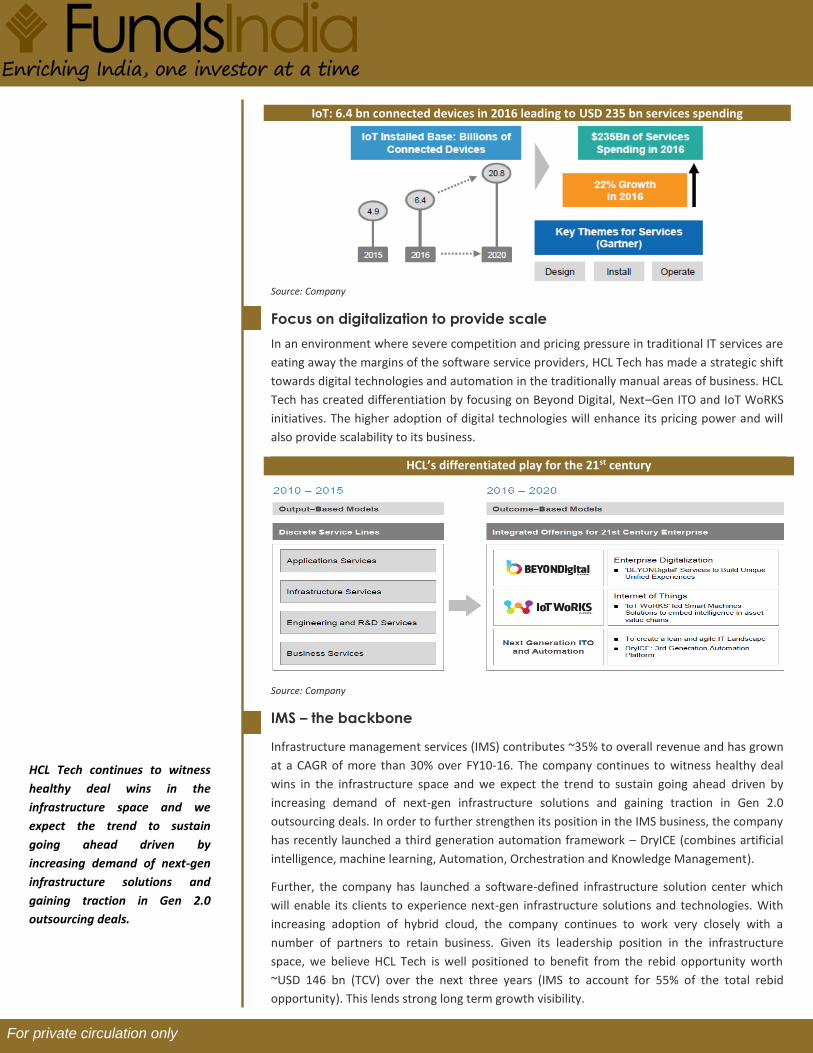
IoT: 6.4 bn connected devices in 2016 leading to USD 235 bn services spending
Source: Company
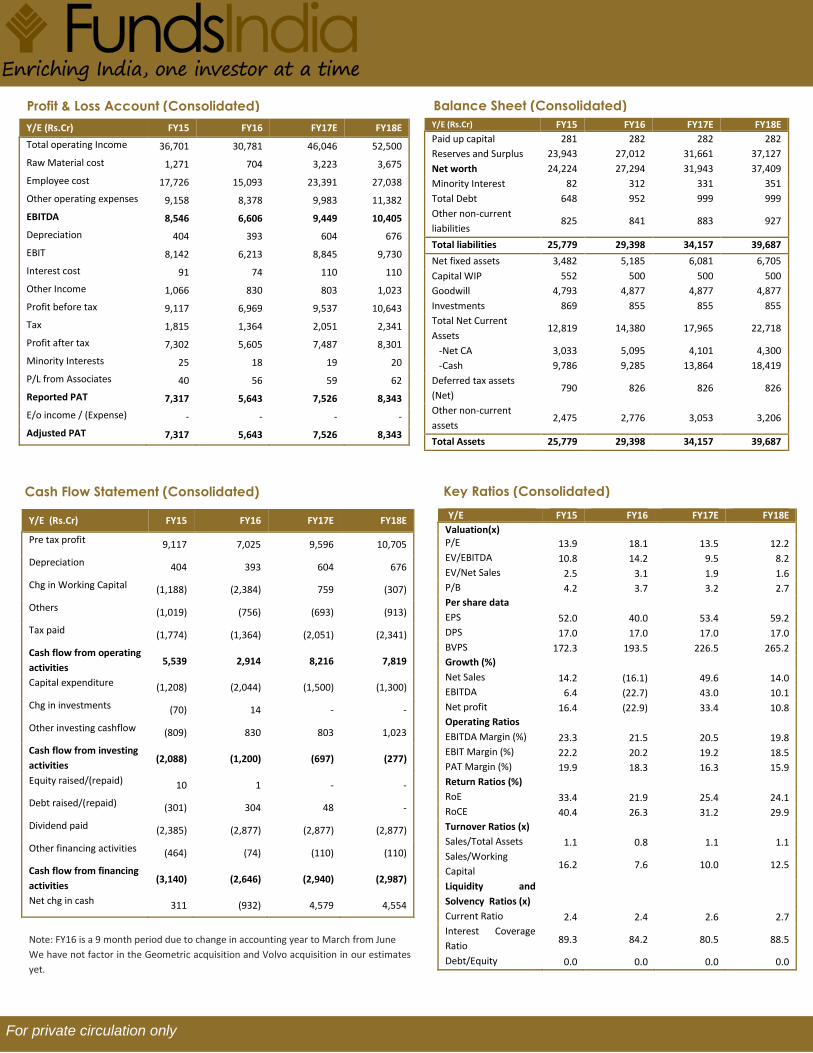
Focus on digitalization to provide scale
In an environment where severe competition and pricing pressure in traditional IT services are
eating away the margins of the software service providers, HCL Tech has made a strategic shift
towards digital technologies and automation in the traditionally manual areas of business. HCL
Tech has created differentiation by focusing on Beyond Digital, Next–Gen ITO and IoT WoRKS
initiatives. The higher adoption of digital technologies will enhance its pricing power and will
also provide scalability to its business.
HCL’s differentiated play for the 21st century
Source: Company
IMS – the backbone
Infrastructure management services (IMS) contributes ~35% to overall revenue and has grown
at a CAGR of more than 30% over FY10-16. The company continues to witness healthy deal
wins in the infrastructure space and we expect the trend to sustain going ahead driven by
increasing demand of next-gen infrastructure solutions and gaining traction in Gen 2.0
outsourcing deals. In order to further strengthen its position in the IMS business, the company
has recently launched a third generation automation framework – DryICE (combines artificial
intelligence, machine learning, Automation, Orchestration and Knowledge Management).
Further, the company has launched a software-defined infrastructure solution center which
will enable its clients to experience next-gen infrastructure solutions and technologies. With
increasing adoption of hybrid cloud, the company continues to work very closely with a
number of partners to retain business. Given its leadership position in the infrastructure
space, we believe HCL Tech is well positioned to benefit from the rebid opportunity worth
~USD 146 bn (TCV) over the next three years (IMS to account for 55% of the total rebid
opportunity). This lends strong long term growth visibility.
HCL Tech continues to witness
healthy deal wins in the
infrastructure space and we
expect the trend to sustain
going ahead driven by
increasing demand of next-gen
infrastructure solutions and
gaining traction in Gen 2.0
outsourcing deals.
For private circulation only

Traction in ER&D space augurs well
HCL Tech has gradually enhanced its focus on Engineering and R&D Services (ER&D) and has
created a dominance in this space (~19% of HCL Tech’s revenue). The revenue contribution
from this business exceeded USD 1bn milestone. Further, the company continues to witness
good pipeline in Engineering Services driven by both internet of things as well as digital
engineering. The increasing demand from first time outsourcers is also driving growth. The
company is further strengthening its presence in this space by remaining a differentiator by
building intellectual properties. The company’s rich expertise is clearly reflected from its
current involvement with more than 50% of the top 100 global R&D companies. We believe the
growth in the engineering services space will be majorly driven by IoT and loacalisation
initiatives. In order to strengthen its presence in IoT space, HCL Tech has made huge
investments to provide end-to-end offerings to its clients. The company is also scaling up its
presence in Engineering Services both in China and Mexico as clients prefer engineering
services outsourcing to be closer to the manufacturing base.
We believe the company will stand to gain from the increase in engineering services
outsourcing given its focused investment in this space. This also lends confidence on the future
deal wins.
….Geometric’s acquisition will further strengthen its engineering service
capability
In a bid to further strengthen its presence in the ER&D space, the company has recently
acquired Geometric Ltd (India’s leading services provider of PLM consulting, mechanical
engineering and manufacturing engineering) in all stock deal. HCLT would issue 10 equity
shares of Rs. 2 each to Geometric shareholders for every 43 equity shares of Geometric held by
them. The deal will add ~2% to HCL Tech’s overall revenues and will also help company onboard
close to 2,606 Geometric employees across 13 global delivery locations in the US, France,
Germany, Romania, India and China. Geometric garnered revenues of Rs. 673.5 Crores in
9MFY16 and Rs 813.9 Crores in FY15. This acquisition excludes Geometric’s 58% stake in 3DPLM
Software Solutions, a JV with Dassault Systems.
This acquisition will further enhance its capabilities primarily in the PLM consulting as well as
mechanical and manufacturing engineering. Given, HCL Tech’s leadership position in this
domain, the deal will bring in various synergistic benefits. It will get access to Geometric’s 60
global clients in US and Europe primarily in the automotive and industrial engineering
segments. HCL Tech will also acquire several unique IPs in PLM and digital manufacturing space
and would enable the company to cross sell its ER&D expertise to Geometric’s clients.
Geometric’s financial integration is expected by the end of this year. Hence, currently we are
not building it in our revenue estimates.
Traditional verticals performance
HCL Tech’s traditional verticals – Manufacturing and Financial Services (accounts for more than
50% of overall revenue) has grown at a modest pace in FY16 (LTM basis) (constant currency
growth of ~9% and ~7% respectively). Though the traditional verticals continue to reel under
pricing pressure, the shift in spend from traditional services to newer technologies is expected
to provide some respite. The management expects further growth opportunity in this vertical
on the back of momentum across its client base and opportunity from vendor consolidation.
For private circulation only
The company continues to
witness good pipeline in
Engineering Services driven by
both internet of things as well as
digital engineering.
Geometric’s acquisition will
further enhance its capabilities
primarily in the PLM consulting
as well as mechanical and
manufacturing engineering.

As regards manufacturing (largest revenue contributor ~32%), HCL Tech has prowess in
automotive, aerospace, hi-tech and semi-conductors segment. With increasing engineering
services opportunity in manufacturing space, we expect the company is well placed (given
its competence) to drive growth. Financial Services on the other hand is the second largest
revenue contributor (26%). The company continues to witness deal wins in this space on
the back of growing vendor consolidation and adoption of digital technologies.
The management has highlighted that the emergence of Fintech and shift focus from Gen 1
to Gen 2/3 outsourcing is creating demand for IT simplification, automation and artificial
intelligence. The clients looking for Gen 2/3 outsourcing is resulting in vendor consolidation
to drive efficiency. As a result, this creates opportunity for HCL Tech to target large deals in
this space. Further, the emergence of Fintech in the financial services business is driving
investments in customer experience, digital and cloud. The company’s strategy to make
huge investments in Beyond Digital space augurs well for the company.
Uptick in deal wins; a key growth trigger
HCL Tech is witnessing traction in large deal, which is clearly visible as it has bagged 25
transformational deals with TCV of more than USD 4 bn in 9MFY16 as against 58
transformational engagements signed in FY15 with USD 5bn+ TCV. The deal signing has
remained healthy driven by Next-gen ITO, Engineering Services Outsourcing, Digital, etc.
We expect the growth will be further driven by traction in large deal coupled with ramp up
of existing deals bagged over the last few quarters. We expect the revenue to pick up as the
company starts delivering these deals. The client addition also remains robust with the
company adding 1 new client in USD 100 mn+, 2 new clients in USD 50 mn+ bracket, 7 new
clients in USD 40 mn+ bracket and 22 new clients in USD 10 mn+ bracket in 9MFY16.
Client mix
Source: Company
Volvo deal
HCL Tech has acquired Volvo's external IT business and also signed a significant five-year IT
outsourcing deal with the Volvo Group (one of the world’s leading manufacturers of
commercial vehicles). With the acquisition of Volvo's external IT business, HCL Tech will add
40 new customers from Nordics and France, further enhancing its market leadership
position in these regions. It will also help the company in strengthening its capabilities in
mainframe and automotive domain. The acquisition will result in addition of approximately
2,500 people working for the Volvo Group across 11 countries to HCL. This will also enable
HCL to create an automotive Centre of Excellence in Gothenburg, based on the domain
expertise of the Volvo team, to serve HCL’s global automotive and manufacturing
customers. As part of the IT outsourcing deal with Volvo, HCL Tech will undertake Volvo’s
infrastructure and operation services. Volvo's financial integration is expected in Q1FY17.
Hence, currently we are not building it in our revenue estimates.
The deal signing has remained
healthy as it has bagged 25
transformational deals with TCV
of more than USD 4 bn in
9MFY16.
The acquisition of Volvo's
external IT business will help HCL
Tech in strengthening its
capabilities in mainframe and
automotive domain.
For private circulation only

Revenue & Adj. PAT to grow at a CAGR of ~31% and ~22% respectively
over FY16-18E
We expect HCL Tech’s revenue to grow at ~31% CAGR over FY16-18E on the back of its
robust order book position. The rebid market opportunity in the IMS space and continued
deal wins bolsters our confidence on the revenue visibility of the company. As the company
have dominance in IMS and ER&D space, it would provide traction and scalability to its
business. However, we expect the margins to moderate over the next two years mainly on
account of investments mostly towards building capability in digital and engineering
services. We expect EBIT margin to ease to 18.5% in FY18E from 20.2% in FY16. The net
profit is projected to grow at a CAGR of ~22% over FY16-18E. ROE & ROCE are likely to
improve to 24.1% and 29.9% in FY18E, respectively. At CMP, the stock trades at a PE of
13.5x/12.2x for FY17E/FY18E. We believe most of the negatives are already priced in the
stock. Hence, we recommend ‘Buy’ rating with a target PE of 14x, which is at a discount to
the past three-year avg of 1 yr fwd PE (15.9x).
Revenue to grow at ~31% CAGR over FY16-18E
Return ratios trend
Source: Company, In-house research
22.2
20.219.2
18.5
16.0
18.0
20.0
22.0
24.0
-
20,000
40,000
60,000
FY15 FY16 FY17E FY18E
%
Rs.
Cro
res
Revenue EBIT margin (%)
0.0
10.0
20.0
30.0
40.0
50.0
FY15 FY16 FY17E FY18E
ROE (%) ROCE (%)
Key risks:
Appreciation of INR against USD.
Slowdown in global IT spend.
Higher-than-expected decline in margin.
For private circulation only
Y/E (Rs.Cr) FY15 FY16 FY17E FY18E
Pre tax profit 9,117 7,025 9,596 10,705
Depreciation 404 393 604 676
Chg in Working Capital (1,188) (2,384) 759 (307)
Others (1,019) (756) (693) (913)
Tax paid (1,774) (1,364) (2,051) (2,341)
Cash flow from operating
activities 5,539 2,914 8,216 7,819
Capital expenditure (1,208) (2,044) (1,500) (1,300)
Chg in investments (70) 14 - -
Other investing cashflow (809) 830 803 1,023
Cash flow from investing
activities (2,088) (1,200) (697) (277)
Equity raised/(repaid) 10 1 - -
Debt raised/(repaid) (301) 304 48 -
Dividend paid (2,385) (2,877) (2,877) (2,877)
Other financing activities (464) (74) (110) (110)
Cash flow from financing
activities (3,140) (2,646) (2,940) (2,987)
Net chg in cash 311 (932) 4,579 4,554
Note: FY16 is a 9 month period due to change in accounting year to March from June
We have not factor in the Geometric acquisition and Volvo acquisition in our estimates
yet.
Y/E FY15 FY16 FY17E FY18E
Valuation(x)
P/E 13.9 18.1 13.5 12.2
EV/EBITDA 10.8 14.2 9.5 8.2
EV/Net Sales 2.5 3.1 1.9 1.6
P/B 4.2 3.7 3.2 2.7
Per share data
EPS 52.0 40.0 53.4 59.2
DPS 17.0 17.0 17.0 17.0
BVPS 172.3 193.5 226.5 265.2
Growth (%)
Net Sales 14.2 (16.1) 49.6 14.0
EBITDA 6.4 (22.7) 43.0 10.1
Net profit 16.4 (22.9) 33.4 10.8
Operating Ratios
EBITDA Margin (%) 23.3 21.5 20.5 19.8
EBIT Margin (%) 22.2 20.2 19.2 18.5
PAT Margin (%) 19.9 18.3 16.3 15.9
Return Ratios (%)
RoE 33.4 21.9 25.4 24.1
RoCE 40.4 26.3 31.2 29.9
Turnover Ratios (x)
Sales/Total Assets 1.1 0.8 1.1 1.1
Sales/Working
Capital 16.2 7.6 10.0 12.5
Liquidity and
Solvency Ratios (x)
Current Ratio 2.4 2.4 2.6 2.7
Interest Coverage
Ratio 89.3 84.2 80.5 88.5
Debt/Equity 0.0 0.0 0.0 0.0
For private circulation only
Y/E (Rs.Cr) FY15 FY16 FY17E FY18E
Total operating Income 36,701 30,781 46,046 52,500
Raw Material cost 1,271 704 3,223 3,675
Employee cost 17,726 15,093 23,391 27,038
Other operating expenses 9,158 8,378 9,983 11,382
EBITDA 8,546 6,606 9,449 10,405
Depreciation 404 393 604 676
EBIT 8,142 6,213 8,845 9,730
Interest cost 91 74 110 110
Other Income 1,066 830 803 1,023
Profit before tax 9,117 6,969 9,537 10,643
Tax 1,815 1,364 2,051 2,341
Profit after tax 7,302 5,605 7,487 8,301
Minority Interests 25 18 19 20
P/L from Associates 40 56 59 62
Reported PAT 7,317 5,643 7,526 8,343
E/o income / (Expense) - - - -
Adjusted PAT 7,317 5,643 7,526 8,343
Y/E (Rs.Cr) FY15 FY16 FY17E FY18E
Paid up capital 281 282 282 282
Reserves and Surplus 23,943 27,012 31,661 37,127
Net worth 24,224 27,294 31,943 37,409
Minority Interest 82 312 331 351
Total Debt 648 952 999 999
Other non-current
liabilities 825 841 883 927
Total liabilities 25,779 29,398 34,157 39,687
Net fixed assets 3,482 5,185 6,081 6,705
Capital WIP 552 500 500 500
Goodwill 4,793 4,877 4,877 4,877
Investments 869 855 855 855
Total Net Current
Assets 12,819 14,380 17,965 22,718
-Net CA 3,033 5,095 4,101 4,300
-Cash 9,786 9,285 13,864 18,419
Deferred tax assets
(Net) 790 826 826 826
Other non-current
assets 2,475 2,776 3,053 3,206
Total Assets 25,779 29,398 34,157 39,687
Balance Sheet (Consolidated)
Profit & Loss Account (Consolidated)
Cash Flow Statement (Consolidated)
Profit & Loss Account (Consolidated)
Profit & Loss Account (Consolidated)
Key Ratios (Consolidated)
Rating criteria
Large Cap. Return Mid/Small Cap. Return
Buy More than equal to 10% Buy More than equal to 15%
Hold Upside or downside is less than 10% Accumulate* Upside between 10% & 15%
Reduce Less than equal to -10% Hold Between 0% & 10%
Reduce/sell Less than 0%
* To satisfy regulatory requirements, we attribute ‘Accumulate’ as Buy and ‘Reduce’ as Sell.
* HCL Tech is a large cap company
Disclaimer:
The SEBI registration number is INH200000394.
The analyst for this report certifies that all the views expressed in this report accurately reflect his / her personal views about the subject
company or companies, and its / their securities. No part of his / her compensation was / is / will be, directly / indirectly related to specific
recommendations or views expressed in this report.
This material is for the personal information of the authorized recipient, and no action is solicited on the basis of this. It is not to be
construed as an offer to sell, or the solicitation of an offer to buy any security, in any jurisdiction, where such an offer or solicitation would
be illegal.
We have reviewed the report, and in so far as it includes current or historical information, it is believed to be reliable, though its accuracy or
completeness cannot be guaranteed. Neither Wealth India Financial Services Pvt. Ltd., nor any person connected with it, accepts any
liability arising from the use of this document. The recipients of this material should rely on their own investigations and take their own
professional advice. Price and value of the investments referred to in this material may go up or down. Past performance is not a guide for
future performance.
We and our affiliates, officers, directors, and employees worldwide:
1. Do not have any financial interest in the subject company / companies in this report; 2. Do not have any actual / beneficial ownership of one per cent or more in the company / companies mentioned in this document, or
in its securities at the end of the month immediately preceding the date of publication of the research report, or the date of public appearance;
3. Do not have any other material conflict of interest at the time of publication of the research report, or at the time of public appearance;
4. Have not received any compensation from the subject company / companies in the past 12 months; 5. Have not managed or co-managed the public offering of securities for the subject company / companies in the past 12 months; 6. Have not received any compensation for investment banking, or merchant banking, or brokerage services from the subject
company / companies in the past 12 months; 7. Have not served as an officer, director, or employee of the subject company; 8. Have not been engaged in market making activity for the subject company;
This document is not for public distribution. It has been furnished to you solely for your information, and must not be reproduced or
redistributed to any other person.
Funds India Uttam Building, Third Floor| No. 38 & 39| Whites Road| Royapettah|Chennai – 600014| T: +91 7667 166 166 Email: [email protected]
Contact Us:
For private circulation only

Dion’s Disclosure and Disclaimer
I, Abhijit Kumar Das, employee of Dion Global Solutions Limited (Dion) is engaged in preparation of this report and hereby certify that all the views expressed in this research report (report) reflect my personal views about any or all of the subject issuer or securities.
Disclaimer
This report has been prepared by Dion and the report & its contents are the exclusive property of the Dion and the client cannot
tamper with the report or its contents in any manner and the said report, shall in no case, be further distributed to any third party
for commercial use, with or without consideration.
Recipient shall not further distribute the report to a third party for a commercial consideration as this report is being furnished to the recipient solely for the purpose of information. Dion has taken steps to ensure that facts in this report are based on reliable information but cannot testify, nor make any representation or warranty, express or implied, to the accuracy, contents or data contained within this report. It is hereby confirmed that wherever Dion has employed a rating system in this report, the rating system has been clearly defined including the time horizon and benchmarks on which the rating is based. Descriptions of any company or companies or their securities mentioned herein are not intended to be complete and this report is not, and should not be construed as an offer or solicitation of an offer, to buy or sell any securities or other financial instruments. Dion has not taken any steps to ensure that the securities referred to in this report are suitable for any particular investor. This report is not to be relied upon in substitution for the exercise of independent judgment. Opinions or estimates expressed are current opinions as of the original publication date appearing on this report and the information, including the opinions and estimates contained herein, are subject to change without notice. Dion is under no duty to update this report from time to time. Dion or its associates including employees engaged in preparation of this report and its directors do not take any responsibility, financial or otherwise, of the losses or the damages sustained due to the investments made or any action taken on basis of this report, including but not restricted to, fluctuation in the prices of securities, changes in the currency rates, diminution in the NAVs, reduction in the dividend or income, etc. The investments or services contained or referred to in this report may not be suitable for all equally and it is recommended that an independent investment advisor be consulted. In addition, nothing in this report constitutes investment, legal, accounting or tax advice or a representation that any investment or strategy is suitable or appropriate to individual circumstances or otherwise constitutes a personal recommendation of Dion. REGULATORY DISCLOSURES:
Dion is engaged in the business of developing software solutions for the global financial services industry across the entire
transaction lifecycle and inter-alia provides research and information services essential for business intelligence to global companies
and financial institutions. Dion is listed on BSE Limited (BSE) and is also registered under the SEBI (Research Analyst) Regulations,
2014 (SEBI Regulations) as a Research Analyst vide Registration No. INH100002771. Dion’s activities were neither suspended nor has
it defaulted with requirements under the Listing Agreement and / or SEBI (Listing Obligations and Disclosure Requirements)
Regulations, 2015 with the BSE in the last five years. Dion has not been debarred from doing business by BSE / SEBI or any other
authority.
In the context of the SEBI Regulations, we affirm that we are a SEBI registered Research Analyst and in the course of our business,
we issue research reports /research analysis etc that are prepared by our Research Analysts. We also affirm and undertake that no
disciplinary action has been taken against us or our Analysts in connection with our business activities.
In compliance with the above mentioned SEBI Regulations, the following additional disclosures are also provided which may be
considered by the reader before making an investment decision:
For private circulation only

1. Disclosures regarding Ownership
Dion confirms that:
(i) Dion/its associates have no financial interest or any other material conflict in relation to the subject company (ies)
covered herein at the time of publication of this report.
(ii) It/its associates have no actual / beneficial ownership of 1% or more securities of the subject company (ies) covered
herein at the end of the month immediately preceding the date of publication of this report.
Further, the Research Analyst confirms that:
(i) He, his associates and his relatives have no financial interest in the subject company (ies) covered herein, and they
have no other material conflict in the subject company at the time of publication of this report.
(ii) he, his associates and his relatives have no actual/beneficial ownership of 1% or more securities of the subject
company (ies) covered herein at the end of the month immediately preceding the date of publication of this report.
2. Disclosures regarding Compensation:
During the past 12 months, Dion or its Associates:
(a) Have not managed or co-managed public offering of securities for the subject company (b) Have not received any compensation
for investment banking or merchant banking or brokerage services from the subject company (c) Have not received any
compensation for products or services other than investment banking or merchant banking or brokerage services from the subject .
(d) Have not received any compensation or other benefits from the subject company or third party in connection with this report
3. Disclosure regarding the Research Analyst’s connection with the subject company:
It is affirmed that I, Abhijit Kumar Das employed as Research Analyst by Dion and engaged in the preparation of this report have not
served as an officer, director or employee of the subject company
4. Disclosure regarding Market Making activity:
Neither Dion /its Research Analysts have engaged in market making activities for the subject company.
Copyright in this report vests exclusively with Dion.
For private circulation only