Volume I - The Coastal Bend Bays & Estuaries Program
127
Characterization of Anthropogenic and Natural Disturbance on Vegetated and Unvegetated Bay Bottom Habitats in the CCBNEP Study Area Corpus Christi Bay National Estuary Program CCBNEP-25 • May 1998
Transcript of Volume I - The Coastal Bend Bays & Estuaries Program
Characterization of Anthropogenic andNatural Disturbance on Vegetated andUnvegetated Bay Bottom Habitatsin the CCBNEP Study Area
Corpus Christi Bay National Estuary Program CCBNEP-25 • May 1998

This project has been funded in part by the United States EnvironmentalProtection Agency under assistance agreement #CE-9963-01-2 to the TexasNatural Resource Conservation Commission. The contents of this documentdo not necessarily represent the views of the United States EnvironmentalProtection Agency or the Texas Natural Resource ConservationCommission, nor do the contents of this document necessarily constitute theviews or policy of the Corpus Christi Bay National Estuary ProgramManagement Conference or its members. The information presented isintended to provide background information, including the professionalopinion of the authors, for the Management Conference deliberations whiledrafting official policy in the Comprehensive Conservation andManagement Plan (CCMP). The mention of trade names or commercialproducts does not in any way constitute an endorsement or recommendationfor use.

CHARACTERIZATION OF ANTHROPOGENIC AND NATURAL DISTURBANCE ONVEGETATED AND UNVEGETATED BAY BOTTOM HABITATS IN THE
CORPUS CHRISTI BAY NATIONAL ESTUARY PROGRAM STUDY AREA
Volume I:Literature Review
Paul A. Montagna, Ph.D. – Co-Principal InvestigatorScott A. Holt, M.S. – Co-Principal Investigator
Christine Ritter, M.S. – Graduate Research AssistantSharon Herzka – Graduate Research Assistant
Kathy F. Binney, - Research AssistantKenneth H. Dunton, Ph.D. – Co-Principal Investigator
The University of Texas at AustinMarine Science Institute750 Channelview Drive
Port Aransas, Texas 78373
Publication CCBNEP-25AMay 1998

Policy Committee
Commissioner John BakerPolicy Committee Chair
Texas Natural Resource ConservationCommission
Mr. Gregg A. CookePolicy Committee Vice-ChairRegional Administrator, EPA Region 6
The Honorable Vilma LunaState Representative
Commissioner Ray ClymerTexas Parks and Wildlife Department
The Honorable Carlos TruanTexas Senator
Commissioner Garry MauroTexas General Land Office
The Honorable Josephine MillerCounty Judge, San Patricio County
Commissioner Noe FernandezTexas Water Development Board
The Honorable Loyd NealMayor, City of Corpus Christi
Mr. Ray AllenCoastal Citizen
Mr. Bernard PaulsonCoastal Citizen
Management CommitteeMr. Ray Allen, Co-Chair Mr. Bob Wallace, Co-Chair
Local Governments Advisory CommitteeCommissioner Gordon Porter, Chair Mr. James Dodson, Vice-Chair
Scientific/Technical Advisory CommitteeDr. Terry Whitledge, Chair Dr. Wes Tunnell, Vice-Chair
Citizens Advisory CommitteeMr. Robert Corrigan, Chair Mr. Jay Reining, Vice-Chair
Program Implementation CommitteeJudge Josephine Miller, Chair
Program DirectorMr. Richard Volk
Natural Resources Center, Suite 3300, TAMU-CC • 6300 Ocean Drive • Corpus Christi, TX 78412512/980-3420 • FAX 512/980-3437 • CCBNEP home page: //www.sci.tamucc.edu/ccbnep
iii

Barry R. McBee, ChairmanR. B. Ralph Marquez, Commissioner
John M. Baker, Commissioner
Dan Pearson, Executive Director
Authorization for use or reproduction of any original material contained inthis publication, i.e., not obtained from other sources, is freely granted. TheCommission would appreciate acknowledgment.
Published and distributedby the
Texas Natural Resource Conservation CommissionPost Office Box 13087
Austin, Texas 78711-3087
iv
The TNRCC is an equal opportunity/affirmative action employer. The agency does not allow discrimination on the basis of race, color,religion, national origin, sex, disability, age, sexual orientation or veteran status. In compliance with the Americans with Disabilities Act,this document may be requested in alternate formats by contacting the TNRCC at (512) 239-0028, Fax 239-4488 or 1-800-RELAY-TX(TDD), or by writing P.O. Box 13087, Austin, TX 78711- 3087.

CORPUS CHRISTI BAY NATIONAL ESTUARY PROGRAM
The Corpus Christi Bay National Estuary Program (CCBNEP) is a four-year,community based effort to identify the problems facing the bays and estuaries of theCoastal Bend, and to develop a long-range, Comprehensive Conservation andManagement Plan. The Program's fundamental purpose is to protect, restore, or enhancethe quality of water, sediments, and living resources found within the 600 square mileestuarine portion of the study area.
The Coastal Bend bay system is one of 28 estuaries that have been designated as anEstuary of National Significance under a program established by the United StatesCongress through the Water Quality Act of 1987. This bay system was so designated in1992 because of its benefits to Texas and the nation. For example:
• Corpus Christi Bay is the gateway to the nation's sixth largest port, and home to thethird largest refinery and petrochemical complex. The Port generates over $1 billionof revenue for related businesses, more than $60 million in state and local taxes, andmore than 31,000 jobs for Coastal Bend residents.
• The bays and estuaries are famous for their recreational and commercial fisheriesproduction. A study by Texas Agricultural Experiment Station in 1987 found thatthese industries, along with other recreational activities, contributed nearly $760million to the local economy, with a statewide impact of $1.3 billion, that year.
• Of the approximately 100 estuaries around the nation, the Coastal Bend ranks fourthin agricultural acreage. Row crops -- cotton, sorghum, and corn -- and livestockgenerated $480 million in 1994 with a statewide economic impact of $1.6 billion.
• There are over 2600 documented species of plants and animals in the Coastal Bend,including several species that are classified as endangered or threatened. Over 400bird species live in or pass through the region every year, making the Coastal Bendone of the premier bird watching spots in the world.
The CCBNEP is gathering new and historical data to understand environmental statusand trends in the bay ecosystem, determine sources of pollution, causes of habitatdeclines and risks to human health, and to identify specific management actions to beimplemented over the course of several years. The 'priority issues' under investigationinclude:
• altered freshwater inflow • degradation of water quality• declines in living resources • altered estuarine circulation• loss of wetlands and other habitats • selected public health issues• bay debris
The COASTAL BEND BAYS PLAN that will result from these efforts will be thebeginning of a well-coordinated and goal-directed future for this regional resource.
v
STUDY AREA DESCRIPTION
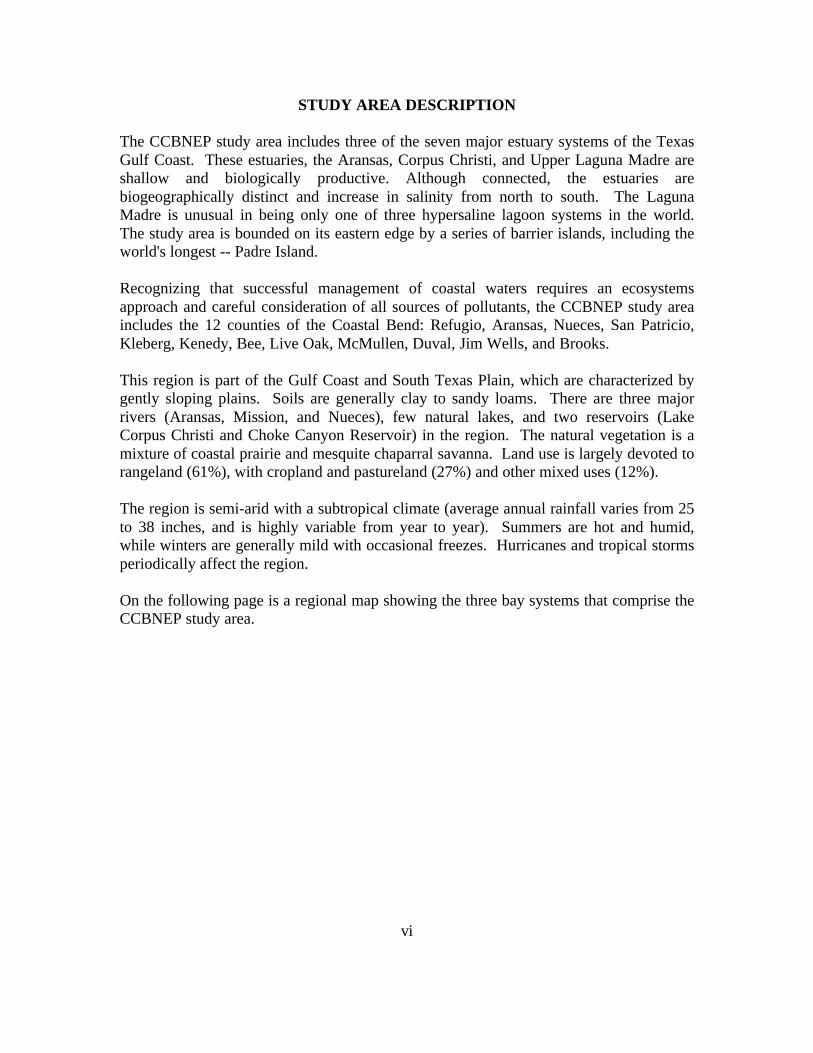
The CCBNEP study area includes three of the seven major estuary systems of the TexasGulf Coast. These estuaries, the Aransas, Corpus Christi, and Upper Laguna Madre areshallow and biologically productive. Although connected, the estuaries arebiogeographically distinct and increase in salinity from north to south. The LagunaMadre is unusual in being only one of three hypersaline lagoon systems in the world.The study area is bounded on its eastern edge by a series of barrier islands, including theworld's longest -- Padre Island.
Recognizing that successful management of coastal waters requires an ecosystemsapproach and careful consideration of all sources of pollutants, the CCBNEP study areaincludes the 12 counties of the Coastal Bend: Refugio, Aransas, Nueces, San Patricio,Kleberg, Kenedy, Bee, Live Oak, McMullen, Duval, Jim Wells, and Brooks.
This region is part of the Gulf Coast and South Texas Plain, which are characterized bygently sloping plains. Soils are generally clay to sandy loams. There are three majorrivers (Aransas, Mission, and Nueces), few natural lakes, and two reservoirs (LakeCorpus Christi and Choke Canyon Reservoir) in the region. The natural vegetation is amixture of coastal prairie and mesquite chaparral savanna. Land use is largely devoted torangeland (61%), with cropland and pastureland (27%) and other mixed uses (12%).
The region is semi-arid with a subtropical climate (average annual rainfall varies from 25to 38 inches, and is highly variable from year to year). Summers are hot and humid,while winters are generally mild with occasional freezes. Hurricanes and tropical stormsperiodically affect the region.
On the following page is a regional map showing the three bay systems that comprise theCCBNEP study area.
vi

ix
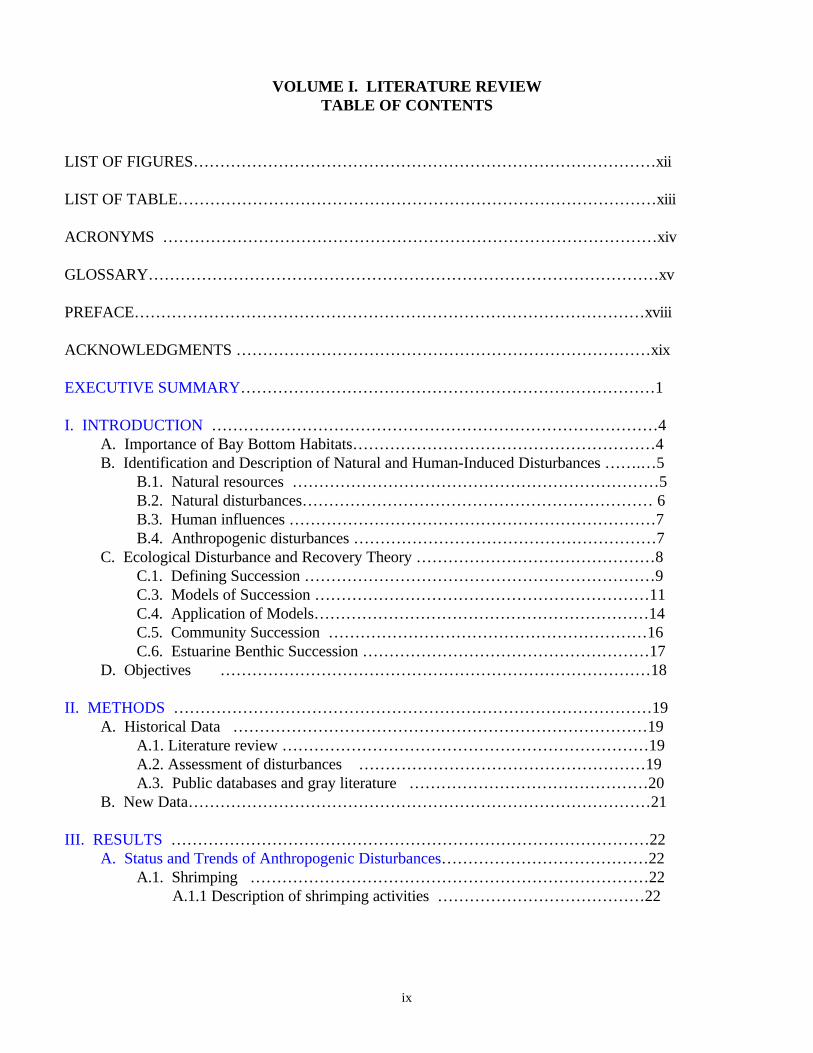
VOLUME I. LITERATURE REVIEWTABLE OF CONTENTS
LIST OF FIGURES……………………………………………………………………………xii
LIST OF TABLE………………………………………………………………………………xiii
ACRONYMS …………………………………………………………………………………xiv
GLOSSARY……………………………………………………………………………………xv
PREFACE……………………………………………………………………………………xviii
ACKNOWLEDGMENTS ……………………………………………………………………xix
EXECUTIVE SUMMARY……………………………………………………………………1
I. INTRODUCTION …………………………………………………………………………4A. Importance of Bay Bottom Habitats…………………………………………………4B. Identification and Description of Natural and Human-Induced Disturbances …….…5
B.1. Natural resources ……………………………………………………………5B.2. Natural disturbances………………………………………………………… 6B.3. Human influences ……………………………………………………………7B.4. Anthropogenic disturbances …………………………………………………7
C. Ecological Disturbance and Recovery Theory ………………………………………8C.1. Defining Succession …………………………………………………………9C.3. Models of Succession ………………………………………………………11C.4. Application of Models………………………………………………………14C.5. Community Succession ……………………………………………………16C.6. Estuarine Benthic Succession ………………………………………………17
D. Objectives ………………………………………………………………………18
II. METHODS ………………………………………………………………………………19A. Historical Data ……………………………………………………………………19
A.1. Literature review ……………………………………………………………19A.2. Assessment of disturbances ………………………………………………19A.3. Public databases and gray literature ………………………………………20
B. New Data……………………………………………………………………………21
III. RESULTS ………………………………………………………………………………22A. Status and Trends of Anthropogenic Disturbances…………………………………22
A.1. Shrimping …………………………………………………………………22A.1.1 Description of shrimping activities …………………………………22
x
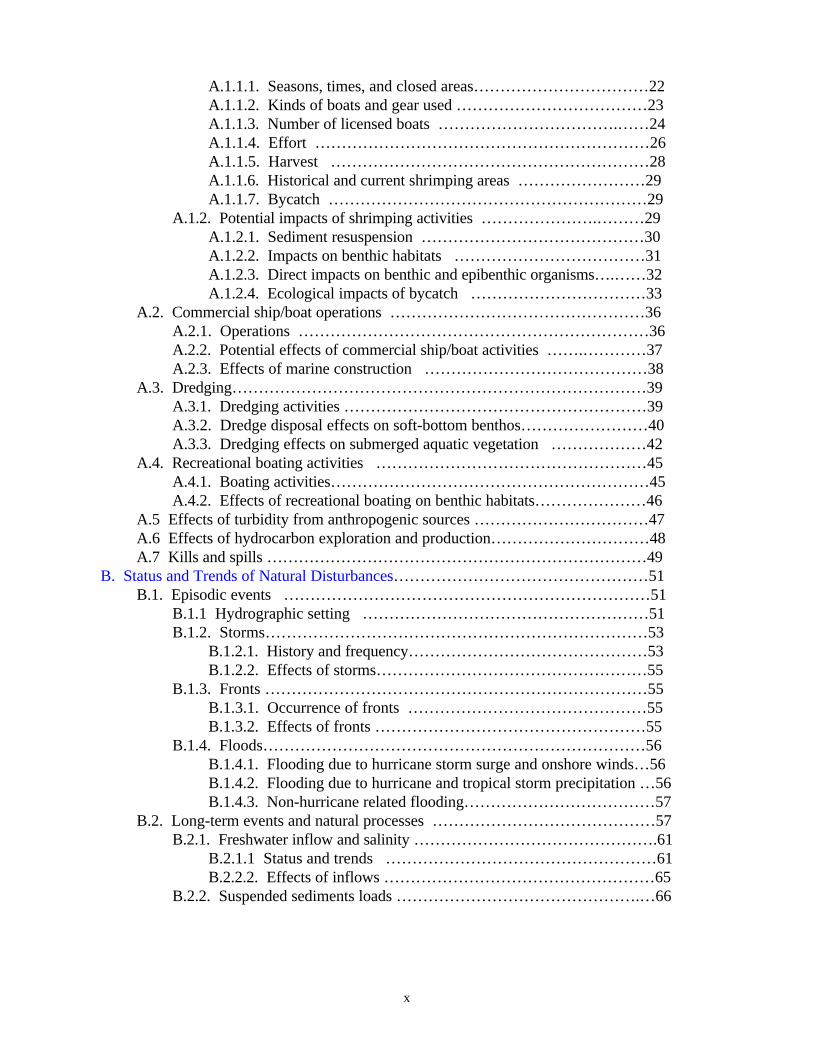
A.1.1.1. Seasons, times, and closed areas……………………………22A.1.1.2. Kinds of boats and gear used ………………………………23A.1.1.3. Number of licensed boats …………………………….……24A.1.1.4. Effort ………………………………………………………26A.1.1.5. Harvest ……………………………………………………28A.1.1.6. Historical and current shrimping areas ……………………29A.1.1.7. Bycatch ……………………………………………………29
A.1.2. Potential impacts of shrimping activities ………………….………29A.1.2.1. Sediment resuspension ……………………………………30A.1.2.2. Impacts on benthic habitats ………………………………31A.1.2.3. Direct impacts on benthic and epibenthic organisms….……32A.1.2.4. Ecological impacts of bycatch ……………………………33
A.2. Commercial ship/boat operations …………………………………………36A.2.1. Operations …………………………………………………………36A.2.2. Potential effects of commercial ship/boat activities …….…………37A.2.3. Effects of marine construction ……………………………………38
A.3. Dredging……………………………………………………………………39A.3.1. Dredging activities …………………………………………………39A.3.2. Dredge disposal effects on soft-bottom benthos……………………40A.3.3. Dredging effects on submerged aquatic vegetation ………………42
A.4. Recreational boating activities ……………………………………………45A.4.1. Boating activities……………………………………………………45A.4.2. Effects of recreational boating on benthic habitats…………………46
A.5 Effects of turbidity from anthropogenic sources ……………………………47A.6 Effects of hydrocarbon exploration and production…………………………48A.7 Kills and spills ………………………………………………………………49
B. Status and Trends of Natural Disturbances…………………………………………51B.1. Episodic events ……………………………………………………………51
B.1.1 Hydrographic setting ………………………………………………51B.1.2. Storms………………………………………………………………53
B.1.2.1. History and frequency………………………………………53B.1.2.2. Effects of storms……………………………………………55
B.1.3. Fronts ………………………………………………………………55B.1.3.1. Occurrence of fronts ………………………………………55B.1.3.2. Effects of fronts ……………………………………………55
B.1.4. Floods………………………………………………………………56B.1.4.1. Flooding due to hurricane storm surge and onshore winds…56B.1.4.2. Flooding due to hurricane and tropical storm precipitation …56B.1.4.3. Non-hurricane related flooding………………………………57
B.2. Long-term events and natural processes ……………………………………57B.2.1. Freshwater inflow and salinity ……………………………………….61
B.2.1.1 Status and trends ……………………………………………61B.2.2.2. Effects of inflows ……………………………………………65
B.2.2. Suspended sediments loads ……………………………………….…66

xi
B.2.2.1. Turbidity ………………………………………………….…66B.2.2.2. Sedimentation …………………………………………….…70
B.2.3. Subsidence ……………………………………………………….…71B.2.4. Hypoxia ……………………………………………………….……72B.2.5. Brown tide …………………………………………………….……76B.2.6. Bioturbation…………………………………………………………76
C. Key Resource Management Concerns………………………………………………78C.1. Resource issues………………………………………………………..……78C.2. Social and economic concerns………………………………………………79C.3. Management recommendations ……………………………………………80
IV. DISCUSSION……………………………………………………………………………82A. Relative Contribution of Anthropogenic and Natural Disturbances…………………82B. Comparison of Anthropogenic and Natural Disturbances in Different Areas……..…85
V. DATA AND INFORMATION GAPS……………………………………………………87
VI. CONCLUSION …………………………………………………………………………89
VII. REFERENCES …………………………………………………………………………90
VIII. APPENDIX A…………………………………………………………………………108

xii
LIST OF FIGURES
Figure I.1. Conceptual model of succession …………………………………………………….........…11Figure I.2. Conceptual model of disturbance …………………………………………………........……12Figure I.3. Conceptual model of the role disturbance plays in the successional process ……….........…13Figure I.4. Conceptual model of the physiological response of an organism to disturbance….........……13Figure I.5. Conceptual models illustrating the influence of early colonist species on the progression of
succession……………………………………………………………………………….….......…15Figure III.1. Number of licenses issued on the Texas coast for bait, bay, and gulf shrimping between
1962-1993…………………………………………………………………………………........…24Figure III.2. Trend in number of licensed boats in Aransas and Corpus Christi Bays during the period
1979-1993…………………………………………………………………………………........…25Figure III.3. Number of days fished by shrimp boats along the Texas coast …………………….........…26Figure III.4. Coast-wide trend in pounds of brown shrimp caught per hour of trawling………........……27Figure III.5. Total landings of shrimp for each of the major bays in the CCBNEP region…….........……28Figure III.6. Energy-flow diagram of the north-central Gulf of Mexico…………………….......…..……35Figure III.7. Tonnage transported each year between 1985 and 1994 in Corpus Christi and Harbor Island
ports………………………………………………………………………………….................…36Figure III.8. Percentage of total tonnage transported in 1979 (left pie) and 1994 (right pie) for
commodities of regional importance ……………………………………………………......……37Figure III.9. Cubic yards of sediment dredged from the CCBNEP study area each year between 1946 and
1992…………………………………………………………………………………….............…40Figure III.10. Record of salinity, gross photosynthesis and total respiration in Thalassia testudinum
meadows in Redfish Bay, Texas…………………………………………………………......……43Figure III.11. Reports of kills and spills in bays of the CCBNEP study area ………………......………50Figure III.12. Total number of kills and spills incidents reported annually in the CCBNEP study
area………………………………………………………………………………………....…… 51Figure III.13. Macrofauna long-term trends for the Nueces Estuary……………………………....……58Figure III.14. Macrofauna long-term trends for the Laguna Madre-Baffin Bay Estuary…………......…60Figure III.15. Average annual salinity and gauged freshwater inflow in Mission-Aransas, Nueces and
Upper Laguna Madre Estuaries ………………………………………………………….....……63Figure III.16. Isopleths of hydrographic surface patterns in Corpus Christi Bay associated northerly
winds ………………………………………………………………………………….....………68Figure III.17. Isopleths of surface hydrographic patterns in Corpus Christi Bay associate with
southeasterly winds……………………………………………………………………….....……69Figure III.18. Long-term hydrographic conditions in Corpus Christi Bay, Station D, near Shamrock
Island ……………………………………………………………………………………....……73Figure III.19. Stratification at normoxic and hypoxic stations in Corpus Christi Bay …………….....…75Figure III.20. Number of people interviewed who expressed concern, or lack of concern, about a
resource management issue ………………………………………………………………....….78Figure III.21. Number of people interviewed who provided a particular resource recommendation.......80

xiii
LIST OF TABLES
Table I.1. General characteristics of early and late succession ………………………....……12Table III.1. Chlorophyll a in Thalassia testudinum beds ……………………………………43Table III.2. Macrofauna abundances in vegetated habitats ……………………………………45Table III.3. Acreage of scarred seagrasses in each region of Florida …………………………47Table III.4. Physical and hydrological characteristics of selected Gulf of Mexico bays ….……52Table III.5. Number of tropical storms and hurricanes making landfall ………………………53Table III.6. Local effects of landfall of major hurricanes on the Texas coast from 1961-1980…54Table III.7. Effects of major hurricanes on Corpus Christi, Texas between 1961 and 1980……54Table III.8. Sources of freshwater input…………………………………………………………61Table III.10. Response of salinity to forcing mechanisms………………………………....……64Table III.11. The relationship between freshwater and marine-influenced zones………….……66Table III.12. Wind speed and direction in Corpus Christi………………………………………67Table III.13. Effects of benthic hypoxia in Corpus Christi Bay in July 1996 …………….……74

xiv
ACRONYMS
CCBNEP Corpus Christi Bay National Estuary ProgramCPUE Catch-per-unit-effortDGPS Differential global positioning systemEPA U.S. Environmental Protection AgencyGCPS Ground control pointsGIWW Gulf Intracoastal WaterwayGIS Geographic Information SystemJFK John F. Kennedy CausewayMSL Mean sea levelNBS National Biological ServiceNMFS National Marine Fisheries ServiceNOAA National Oceanic and Atmospheric AdministrationSTAC Science and Technical Advisory Committee of the CCBNEPTGFOC Texas Game, Fish and Oyster CommissionTNRCC Texas Natural Resource Conservation CommissionTWDB Texas Water Development BoardTPWD Texas Parks and Wildlife DepartmentULM Upper Laguna MadreUSGS U.S. Geological SurveyUTMSI University of Texas Marine Science Institute

xv
GLOSSARY
Anaerobic Said of an organism, or life process, that does not utilize, or cannot exist in, thepresence of oxygen.
Anoxic Zero dissolved oxygen.Anthropogenic Refers to influences caused by man, e.g. cultivation.Azoic No living organisms present.Benthic Refers to the bottom of any body of water.Benthos Organisms which live on or in the bottom of the ocean of bodies of fresh water, from
the water’s edge down to the greatest depths.Biocide Compounds that can kill or harm living things.Biodeposition Depositing of organic matter of biotic origin on the sea floorBiodiversity DiversityBiomass The total quantity of all the species in a community.Biotic Living components of the ecosystem.Bioturbation Alteration of substrate through burrowing and feeding activities of benthic organisms
such as crabs, polychaetes, and molluscs.Brines Discharged fluid from production well high in salt content.Bycatch Non-targeted organisms caught in trawls.Commensal One of the organisms living together with benefit usually to one and with injury to
none.Contaminant Materials discharged into the environment by man’s activities.Correlation Statistical relationship between two variables.Demersal Swimming organisms.Detrital Origin in detritus, or dead organic matter.Diatoms One-celled plants.Disturbance Abrupt change in the environment.Diversity Different kinds (or species) of organisms in a community.Dredging Digging of or in sediment from the bottom.Ecosystems The community, including all the component organisms together with the abiotic
environment, forming an interacting system.Effluent The outflow of water from subterranean storage.Epifauna Organisms living on or near the sediment surface.Euryhaline Able to live in waters of a wide range of salinity.Eustatic Characterized by a worldwide change of sea level.Eutrophication Nutrient enrichment to the point that algal blooms occur.Grain sizes Sediment is composed of grains size classes defined as:
Clay: <2 µm.Silt: 2 to 50 µm.Sand: 50 to 200 µm.Rubble (cobble and gravel): > 2000 µm.
Hydrocarbon Compounds made of carbon and hydrogen only, such as, oil or petroleum.Hydrographic Physical-chemical conditions of the water.Hypoxic Low oxygen conditions.

xvi
Herbivores Consumes plants, either unicellular or multicellular, that are primary producers.Heterogeneous Consisting of dissimilar or diverse ingredients.Hydrology The science dealing with water and snow, including their properties and distribution.Hypersalinity Salinities greater than that of seawaterInfaunal Living in sediments.Inflow Freshwater that flows into an estuary. Sources can be diverse including river, rain,
treated effluent, and runoff.Invertebrates An animal lacking a spinal column, e.g., insects.Isoleth A line drawn on a map or chart connecting places having the same value of a certain
factor.Macrofauna Benthic organisms greater than 0.5 mm in size.Meiofauna Benthic organisms greater than 0.063 mm, but smaller than 0.5 mm in size.Metazoan Multicellular organisms.Models A description or analogy of something that can not be visualized. A system of
postulates, data, or inferences presented as equations to describe or simulate asystem.
Morphology Study of form.Nektonic Strong swimming of animals in water.Normoxic Normal oxygen conditions.Omnivores A diet of both plants and animals.Osmotic Properties of osmosis, which is movement of a solvent through a semi-permeable
membrane.Oxygenation Introduction of oxygen.Parasites Organisms that live in or on other organisms.Pelagic Inhabiting the mass of water of sea or lake in contrast to the sea or lake bottom.Photosynthesis Utilization of light energy to produce carbohydrates.Phytoplankton One-celled plants in the plankton.Planktonic The floating or weakly swimming animal and plant organisms occurring at any depth
in lakes, ponds, streams, or seas: often microscopic in size.Pollutants A substance that makes the environment unpure or unclean.Resuspension Sediment or sediment particles in suspension in the water column.Sediment Bulk and water phase of sea floor composed of: interstitial water (about 50% by
volume), inorganic phases, e.g., rock fragments and minerals (about 48% byvolume), organic matter (about 1% by volume), and anthropogenically derivedmaterials (<1% by volume).
Sessile Organisms attached to a surface, or not free to move about.Scarring Tracks made by boat propellers is the sediment.Silt See grain size.Spatial Relating to space.Stability State of being stable or unchanging.Stratification The appearance of plants or plant parts, or their remains, in horizontal divisions.

xvii
Stress Systemic. The condition of an organism where large parts of the body deviate fromtheir normal resting state, either because of their activity or because of an injury.
Substratum Layer beneath surface soil.Succession The replacement of one kind of a community by another kind.Symbiotic Living together in mutually beneficial relationship.Synergistic Interaction of discrete agents where total effects is greater than sum of effects.Temporal Relating to time.Tertiary Third order, as in a bay removed from the ocean by two other bays.Trawling Fishing by dragging a large net along the bottom.Trophic Refers to nutrition. Strata of a food chain.Turbidity The condition of a body of water that contains suspended material such as clay or silt
particles, dead organisms or their parts, or small living plants and animals.Xenobiotic A chemical compound that is foreign to a living organism.
xviii
PREFACE
The purpose of this report is to characterize the impact of anthropogenic and natural disturbances onestuarine benthic habitats within the Corpus Christi Bay National Estuary Program (CCBNEP) studyarea. In general, all CCBNEP characterization reports include the following items: 1) determination ofthe current status and trends in the physical, chemical, and biological characteristics of the study area; 2)identification of probable causes of these trends through correlation with status and trends of humanactivities and natural events; and 3) identification of missing data critical to the management andmonitoring of the CCBNEP study area. Information presented in this report will aid in identification ofappropriate data acquisition programs and management activities needed to assure long-termmaintenance of benthic habitats within the CCBNEP study area.
Three objectives were established to meet the project’s goal of characterizing estuarine benthicdisturbances in the CCBNEP study area: A) to assess relative contribution of anthropogenic and naturaldisturbances on benthic habitats; B) to quantify aerial extent of propeller damage in submerged aquatichabitats; and C) to determine effects of anthropogenic disturbances on biological processes.
Objective B is fulfilled by the acquisition of new data, while objectives A and C are fulfilled by aliterature review. Because there are different methods and scopes of work in a review and a new fieldproject, this report is prepared in two volumes. Volume I fulfills objectives A and C and Volume IIfulfills objective B.

xix
ACKNOWLEDGMENTS
The authors wish to thank the many people who helped in the preparation of the literature reviewpresented in Volume I. Hudson DeYoe and Sandra Alvarado facilitated program management for theCCBNEP, Sheila Meyers provided quality control advice, and Laura Radde provide suggestions onimproving the work plan. We also thank Mr. Lonnie Jones (Human Resources Report) for passingalong dredge data, and the Port of Corpus Christi for recent shipping data. Several University of TexasMarine Science Institute staff were helpful in preparing the report: Heather Alexander provided input onthe seagrass section, and Greg Street provided input on the bay bottom section.
The authors also had considerable help in preparing Volume II. We thank the GIS team at the ConradBlucher Institute for Surveying and Science, led by Dr. Gary Jeffress, for their valuable and considerablecontribution of time and equipment to this project. In particular we thank Oscar Cantu, Kirk Rutkofskeand Dan Prouty for both their intensive efforts and valuable friendships, especially during the final hecticdays of final report preparation.
Finally, the manuscript was improved considerably by suggestions made by the project review team.The authors thank Pam Baker, Paul Carangelo, Robyn Cobb, Billy Fuls, David Jensen, LarryMcEachron, Laura Radde, Windle Taylor, and Kim Withers for their time and attention to editorialdetail.
1
CHARACTERIZATION OF ANTHROPOGENIC AND NATURAL DISTURBANCE ONVEGETATED AND UNVEGETATED BAY BOTTOM HABITATS IN THE CORPUS
CHRISTI BAY NATIONAL ESTUARY PROGRAM STUDY AREA
VOLUME I. LITERATURE REVIEW
Authors: Paul Montagna, Scott Holt, Christine Ritter,Sharon Herzka, Kathy F. Binney and Ken Dunton
University of Texas Marine Science Institute
EXECUTIVE SUMMARY
Benthic (i.e., bottom dwelling) communities are a dominant feature in the shallow, well-mixed estuariesof South Texas, and play a very important role in the functioning of these ecosystems. Benthos (aGreek word meaning “bottom dwelling”) encompasses creatures that dwell in or near the bottom of allfresh water, estuarine, and marine environments. Small invertebrates in the benthos are often referred toas “the invisible fauna” because they are hard to see, but are very important in marine ecosystems,especially shallow estuaries. Benthic habitats are important because they store energy for the entireecosystem and regulate or modify most physical, chemical, geological, and biological processes. Thisenergy is in the form of detritus, and becomes available when nutrients are regenerated by detritaldecomposition. In this way, sediments act as the “memory” of the estuarine ecosystem. Recyclednutrients are key elements which support primary production in the overlying water column. Benthicorganisms live in or on the sediment and are important in almost all aspects of living marine resources.Benthic organisms are important food sources for many bottom feeding fish and wildlife, such as drumsand wading birds. Most benthic invertebrates have planktonic larval stages; these larvae are importantfood sources for planktonic and nektonic organisms. The benthos supplies economic resources andfood for humans in the form of shellfish, such as shrimps, crabs, oysters, mussels, and clams. Insummary, benthos are key components of the environmental health of shallow-water marine ecosystems.
Benthic organisms are especially useful in applied research. Benthos are usually the first organismsaffected by pollutants or environmental degradation. Benthic invertebrates are sensitive to pollutants.Due to gravity, everything ends up in bottom sediments. Even pollutants in freshwater will betransported to the coastal sea bottoms. Everything dies and ends up in the detrital food chain, which isutilized by the benthos. Pollutants are usually tightly coupled to organic matrices, therefore benthoshave great exposure through their niche (food) and habitat (living spaces) to pollutants. Benthos arerelatively long-lived and sessile, so they integrate pollutants effects over long temporal and spatialscales. Bioturbation and irrigation of sediments by benthos affect mobilization and burial of xenobioticmaterials. There are also ecological models that provide a scientific basis for interpreting data generatedin benthic monitoring and detection studies. These approaches utilize many single species, communitystudies, and statistical models. One of the most important concepts is the succession model, whichposits that normal sediments will have a diverse assemblage of

2
deeper dwelling organisms than a polluted or disturbed environment. In summary, benthos are wellknown indicators of environmental change in marine ecosystems.
Benthic habitats can be broadly classified as either vegetated or unvegetated. Seagrasses are thedominant form of submerged vegetation. Vegetated bay bottoms are generally more productive thanunvegetated bottoms. Over 85% of seagrasses in Texas occur in estuaries of the Corpus Christi BayNational Estuary Program (CCBNEP) study area. Seagrass ecosystems are noted for high commercialand sport fishery landings. This correlation is often attributed to the high primary and secondaryproductivity associated with large seagrass beds in the CCBNEP study area. Disturbances, operating atmany different scales, however, can profoundly affect benthic processes in estuaries and threaten fisheryresources. For example, upper Laguna Madre appears to be undergoing a dynamic transition from aseagrass-dominated to a phytoplankton-dominated system as a result of a brown tide algal bloom. Thislarge scale disturbance has resulted in pronounced changes in the trophic dynamics and relativeimportance among key plant and animal species within the system. What is not known is if thedisturbance in Upper Laguna Madre is natural or influenced by man’s activities, or if there areinteractive effects due to natural fluctuations in the environment and anthropogenic input. Therefore,there is a need to identify natural and anthropogenic disturbances and characterize effects on benthichabitats.
The four most important benthic habitats in the CCBNEP study area are: seagrass beds, oyster reefs,open bay muddy bottoms and shoreline sandy bottoms. Disturbances to benthic habitats are wellknown. Seagrasses are stressed by nutrient enrichment, propeller scarring, and especially lightreduction caused by brown tide, turbidity, and dredging. Oyster reefs are stressed by reducedfreshwater inflows and concomitant higher salinities. Bay bottom habitats are a victim of their ownbounty. The large economic benefit the CCBNEP region derives from shrimping and sport fishing,which is supported by bay bottom habitats, is at risk due to mechanized harvest. Trawling continuallyturns over sediment, keeping the benthos in a continual state of low abundance and biodiversity.Bycatch removes potential food for recreationally and commercially important fish species.
Numerous disturbances resulting from human activities and natural events that affect physical, chemical,and biological characteristics of estuarine benthic habitats have been identified within the CCBNEPstudy area. Examples of human activities include: shrimp harvesting with bottom trawls, commercialtug and barge operations, recreational boating, dredging, altered currents, altered inflow, nutrient andcontaminant input, and hydrocarbon exploration and production. Each activity has variable effects onthe different types of bay bottom habitats. Examples of natural disturbances include: wind-generatedresuspension and deposition of fine sediments, abrupt salinity changes due to direct rainfall and runoff,erosion due to storms, fish mortality due to freezes, long-term climatic changes, and harmful algalblooms.
The major finding of this report is natural and anthropogenic disturbances are synergistic. That is, thenet effect of both disturbances is greater than the sum of each disturbance. Synergistic interactionsbetween multiple stressors (including both natural and anthropogenic disturbances) are very important,but quantification of these effects represents the largest data gap. Each kind of
3
anthropogenic disturbance is important in specific sites where the disturbance occurs and if thedisturbance affects an ecological process or community that is present in the site. Overall, reducedinflows appear to be the most severe problem, because the CCBNEP study area is already severelystressed by a naturally arid climate, which produces naturally low inflow rates to the estuaries. Effectsof low inflow rates (and resulting high salinities) are low biodiversity and low benthic secondaryproduction. Effects of low inflow rates are exacerbated by the naturally small tidal range and highresidence times of water in the bays. Altered circulation further restricts flow rates and exacerbateseffects of high salinities. This may be the cause of hypoxia in a portion of Corpus Christi Bay. Whereasaltered inflows and circulation affect the entire study area, the main effects of two activities appear to berestricted. Dredging is of concern mostly in seagrass habitats. Shrimping is a concern mostly in openprimary bays. Again, both activities occur in the setting of altered inflows and circulation, whichincreases net effects of both activities due to synergistic interactions. The largest potential source ofenvironmental degradation is from accidents during transportation of oil products in pipelines , barges,and tankers. Estuaries are very valuable, sensitive environments, and long-term catastrophic effectshave resulted due to accidents in other parts of the world. Although accidents are rare in the CCNBEPstudy area, habitat degradation due to produced water discharge is a current problem. Finally, furthercharacterization and understanding of the effects of natural and anthropogenic disturbances on benthichabitats within the CCBNEP study area are needed to develop management strategies of South Texasestuarine resources.

4
I. INTRODUCTION
A. Importance of Bay Bottom Habitats
Benthic (i.e., bottom dwelling) communities are a dominant feature in the shallow, well-mixed estuariesof South Texas, and play a very important role in the functioning of these ecosystems. Benthos (aGreek word meaning “bottom dwelling”) encompasses creatures that dwell in or near the bottom of allfresh water, estuarine, and marine environments. Small invertebrates in the benthos are often referred toas “the invisible fauna” because they are hard to see, but they are very important in marine ecosystems,especially shallow estuaries. Benthic habitats are important because they store energy for the entireecosystem and regulate or modify most physical, chemical, geological, and biological processes in theocean. This energy is in the form of detritus, and becomes available when nutrients are regenerated bydetrital decomposition. In this way, sediments act as the “memory” of the estuarine ecosystem.Recycled nutrients are key elements that support primary production in the overlying water column.Benthic organisms live in or on the sediment and are important in almost all aspects of living marineresources. Benthic organisms are an important food source for many bottom feeding fish and wildlife,such as drum and wading birds. Most benthic invertebrates have planktonic larval stages, and theselarvae are important food sources for planktonic and nektonic organisms. Finally, the benthos supplieseconomic resources and food for humans in the form of shellfish, such as shrimp, crabs, oysters,mussels, and clams.
Analysis of benthic invertebrate communities has been widely used in pollution detection and monitoringstudies. We expect indicator organisms to do for us today what canaries did for miners in the 18th and19th century. Indicator organisms should have the following characteristics (Soule, 1988): 1) theyshould direct our attention to qualities of the environment, 2) they should give us a sign that somecharacteristic is present, 3) they should express a generalization about the environment, 4) they shouldsuggest a cause, outcome or remedy, and 5) they should show a need for action. Benthic organismshave been especially useful in applied research and can be used as indicator organisms. Benthos areusually the first organisms affected by pollution. There are several reasons why benthos are goodindicators of environmental stress. 1) Gravity insures that everything eventually ends up in bottomsediments. Even pollutants in freshwater will be transported to the sea bottoms. 2) Everything dies andends up in the detrital food chain, which is utilized by the benthos. Pollutants are usually tightly coupledto organic matrices, therefore benthos have great exposure through their niche (food) and habitat (livingspaces) to pollutants. 3) Benthos are relatively long-lived and sessile, so they integrate pollutants’effects over long temporal and wide spatial scales. 4) Benthic invertebrates are sensitive to pollutants.5) Bioturbation and irrigation of sediments by benthos effect mobilization and burial of contaminatedmaterials.
There are ecological theories and models that provide a scientific basis for interpreting data generated inbenthic monitoring and detection studies. These approaches utilize many single species, communitystudies, and statistical models. One of the most important concepts is the succession model proposedby Rhoads et al., (1978). They applied scientific theories of ecological succession

5
and its relation to productivity to suggest ways that dredge-spoil could be managed to enhanceproductivity. One important aspect of this theory is that normal sediments will have a more diverseassemblage of deeper-dwelling organisms than polluted or disturbed environments. Thus, we have ascientific justification for biological diversity studies. Since this classic study, numerous other studieshave demonstrated that benthic biological diversity is an excellent indicator of environmental health.
B. Identification and Description of Natural and Human-Induced Disturbances
B.1. Natural resources
The CCBNEP study area is rich in natural resources. Perhaps the most economically important livingresources are commercial and recreational fisheries, but oil and gas reserves beneath bay bottoms arealso economically important. Oil and gas reserves are not discussed in this report, because they arenon-living, subsurface resources. However, extraction of oil and gas often results in benthicdisturbances from dredging, construction, and drilling.
Benthos can be defined in four different ways: by size, sub-habitat, sediment preference, or feeding type.There are four size distributions: megafauna (> 2 mm), macrofauna (> 0.5 mm), meiofauna (> 0.063mm, but <0.5 mm), and microfauna (<0.063 mm). There are three sub-habitats: motile epifauna (whichmove about the sediment surface), infauna (which live in the sediment), and interstitial fauna (which livebetween the grains of sand). It is common for organisms to be restricted to or prefer either muddy,sandy, or hard bottoms. There are six feeding types: 1) suspension feeders that are non-selectivetrappers, 2) filter feeders that are a subset of suspension feeders using filters to capture particles fromthe water, 3) deposit feeders that ingest sediment and can either be non-selective or selective, 4)omnivores that are either raptors or scavengers, 5) herbivores that browse the surface of plants or eatdiatoms, and 6) parasites and commensals that live in association with other animals.
Benthic epifauna are dominated by crustaceans (primarily shrimp and crabs), and some fishes. Densitiesrange from <1 to over 100 per square meter. Benthic macroinfaunal communities are dominated bypolychaetes, crustaceans (mostly amphipods), and molluscs (mostly bivalves and gastropods). Densitiesrange from 2,000 to 100,000 per square meter, and biomasses range from 0.1 to 20 grams dry weightper square meter (Montagna, unpublished data). Meiofauna communities are dominated by Nematodaand Harpacticoida (Copepoda), but also include many other metazoan taxa (e.g., Hydroida, Turbellaria,Gnathostomulida, Gastrotricha, Oligochaeta, Halacaridae, and Bryozoa). Densities range from 500,000to 2,000,000 per square meter, and biomass is about 0.1 to 1 grams dry weight per square meter.Smaller meiofauna have faster turnover rates than macrofauna, so productivity for the two groups isabout equal. Benthic communities can influence physical and sediment properties by bioturbation,oxygenation of anaerobic sediments, carbon depletion, production of binding and stabilization agents(mucus), and biodeposition. Benthos can also reduce effects of eutrophication in estuaries by filterfeeding on phytoplankton and other particulate matter.

6
Many benthic animals are economically important commercial and sport fishery resources. Examplesinclude shrimp (Penaeus spp.), blue crab (Callinectes sapidus), eastern oysters (Crassostrea virginica)and flounder (Paralichthys spp.). These animals depend on organic resources in close association withthe bay bottom. Other fishery resources, such as Atlantic croaker (Micropogonias undulatus), spot(Leiostomus xanthurus), and black drum (Pogonias cromis), depend on benthic animals as food. Forexample, adult black drum will eat bivalves (e.g., Mulinia lateralis). Juvenile spot, Atlantic croaker,and black drum, consume benthic mysids and harpacticoid copepods. Relationships between thesefishery resources and benthic organisms will be discussed in further detail in section IV.
Benthic communities are dependent on benthic habitats. Habitats are elements of an environment thatsustains a population or community. The three most important benthic habitats in the CCBNEP studyarea are: seagrass beds, open bay bottoms, and oyster reefs. Subtidal seagrass habitats support therichest benthic community, followed by oyster reefs, and bay bottom. The two richest habitats (seagrassbeds and oyster reefs) have benthic structure in common. That is, where there are places to attach, orwhere structural complexity exists, certain habitat characteristics are amplified. In particular, food websare more diverse and structure provides a refuge from predators. Open bay habitats are very extensivein the CCBNEP study area and are much more heterogeneous than they appear. This is due to theinteractions of different sediment types, salinity regimes, and water depths (Mannino and Montagna,1996; 1997).
A more detailed description of the living natural resources in the CCBNEP study area can be found inTunnell et al. (1996). A complete description of benthic, as well as other, habitats in the CCBNEPstudy area can be found in Montagna et al. (1996).
B.2. Natural disturbances
Storms, floods, droughts, and freezes are examples of natural disturbances that affect estuarine biota.Disturbances by large storms can result in potentially massive sediment redistribution. But, stormevents often have variable impacts on estuarine and coastal biotic communities. For example, HurricaneAndrew had no significant impact on seagrass beds in South Florida (Chris Dawes, University of SouthFlorida, personal communication), but Hurricane Gilbert did impact turtle grass (Thalassia testudinum)communities in Puerto Morelos, Mexico (van Tussenbroek, 1994). Thus, the effect of large scaledisturbances on benthic and epibenthic plants and animals can be quite different depending on a numberof factors, e.g., storm frequency, intensity, and the local community present. Storms are also stochasticevents that cannot be predicted and a changing climate may also affect storm frequency and intensity.
Turbidity, sedimentation, and bioturbation are other natural disturbances. Shading due to high turbiditycan limit photosynthesis, and thus primary production. Sedimentation may bury organisms whereasturbidity may hinder suspension feeding organisms. Additionally, bioturbation can either hinder orenhance life styles of other animals. Turbidity and sedimentation are often associated with storm events,but also result from freshwater inflow and wind mixing. Sediment carried by freshwater flowing intobays and estuaries may be kept in suspension or resuspended by wind mixing. Turbidity is caused by thesediment load of the freshwater and the resuspension of sediment by wind and tidal

7
mixing. Bioturbation results from the activities of benthic animals (e.g., burrowing, locomotion, andfeeding). Unlike storms, all of these particulate related events are predictable, if the communitystructure, and certain rates (e.g., river flow) are known. Storms, however, can contribute both to thetiming and intensity of resuspension events since high winds are often associated with storms.
B.3. Human influences
Numerous human influences exist within the CCBNEP area. Although nearly 75% of the land withinthe CCBNEP area is used for agriculture, many people live on the bays’ borders. Corpus Christi(population over 250,000) is the largest city in the area and the largest city in Texas situated directly onthe shores of a major bay. Therefore, the Nueces Estuary (which includes Corpus Christi and NuecesBays) is generally more impacted that the Mission-Aransas Estuary and the Baffin Bay-Laguna MadreEstuary.
There are a variety of human uses of the bays within the CCBNEP study area (Montagna et al., 1996).The Gulf Intracoastal Waterway (GIWW) and the Corpus Christi Ship Channel are used for shipping,tug, and general maritime transportation operations. Shrimp, a natural resource associated with benthichabitats, supports a commercial fishing industry. Finfish such as, black drum (Pogonias cromis), reddrum (Sciaenops ocellatus) and spotted seatrout (Cynoscion nebulosus) utilize benthic habitats andsupport an extensive recreational fishing industry. Oil and gas wells are regionally important economicresources that provide energy to support the nation’s economy.
B.4. Anthropogenic disturbances
Anthropogenic disturbances have potential to greatly disrupt benthic ecosystems. Generally, theseecosystems are adapted to cyclic natural phenomena such as seasonal storms and climatic fluctuations.Organisms are also generally adapted to natural perturbations such as high winds and tides, and pulsesof freshwater inflow. In contrast, human disturbances are generally continuous, non-cyclic events (e.g.,trawling) for which organisms are not adapted. Some events are episodic, (such as oil and chemicalspills) and can be toxic. Anthropogenic disturbances that impact bay bottom habitats include a varietyof activities related to marine transportation, commercial and recreational fishing and tourism.Frequency of these activities and their impact increases with increasing human populations and humanuse of the ecosystem.
The Port of Corpus Christi is the sixth largest port in the United States, making marine transportation adominant industry in South Texas. All ship traffic enters the CCBNEP study area via Aransas Pass,located in the center of the CCBNEP study area. Ship traffic destined to the Port of Corpus Christicrosses Corpus Christi Bay via the Corpus Christi Ship Channel. Barge traffic mainly uses the ICWW.Corpus Christi Bay is only 3-4 m deep while the Corpus Christi Ship Channel is dredged to a depth of15 m. Commercial maritime traffic includes tankers, container ships, grain ships, barges, and associatedtugboats. Another important maritime industry is the offshore supply and crew boats, which areprimarily ported in Port Aransas and Aransas Pass. Commercial shipping

8
operations do not directly influence the benthos. However, chemical discharges, often related toshipping and tug activities, may disturb benthic habitats and ship wakes can cause erosion or disturbancein shoals. The largest influence due to maritime traffic is maintenance dredging of channels and marineconstruction. Dredging disrupts benthic processes during digging and deposition of dredged material.The main concerns are death of organisms, habitat loss through dredging or burial, and increasedturbidity caused by resuspension of fine sediments.
Hydrocarbon exploration and production is a very large business in South Texas, much of it occurringin public, submerged lands. Bay bottoms are subject to disturbance during all phases. Exploration oftenbegins with seismic testing. Seismic testing causes large holes in the sediment, this is potential problemin rich habitats, e.g., seagrass beds. Drill cuttings often contain toxic amounts of heavy metals whichcan cause toxicity in sediment communities. Construction of semi-permanent production wells has twoopposing effects: toxicity and habitat enrichment. There may not be a general net effect of production,because it is often a function of local environmental conditions. The largest concern with hydrocarbonproduction is with transportation. Pipelines leak or break, and accidental spills occur. Spills can benumerous, but small as occurs during loading and offloading operations, or large as when ships orbarges ground or collide.
There are five primary commercial fisheries in South Texas: black drum, flounder, shrimp, oyster, andcrab. Shrimping constitutes the largest commercial fishery in Texas, and there are several potentialeffects from activities related to shrimping. The shrimp fishery consists of the bait fishery and the foodshrimp fishery. Bait shrimp are captured over open bottom with bottom trawls and are occasionallycaught over seagrass beds using small boats equipped with push nets. Food shrimp are harvested onlywith bottom trawls. Trawls capture many other animals besides the targeted shrimp. These non-targeted organisms are bycatch. Trawls also disturb the bay bottom, leading to sediment resuspensionand localized higher turbidity. It is possible that both the digging or turning over of sediment andresulting turbidity are causing biological effects. In addition, endangered species such as sea turtles arecaught in trawls. This has led to adoption of regulations requiring use of turtle excluder devices intrawls. Oyster harvesting produces significant turbidity and the oyster boats may disturb the bottomnear the relatively shallow reefs. The potential impact of the crabbing industry is disturbance ordestruction of seagrasses when crab pots are placed in seagrass meadows.
Tourism and recreational fishing have increased during the last ten years. There has been an increaseddemand for bait shrimp, bait fish, marinas, and lodging associated with these industries. The mainaffects of these activities are related to bait shrimping, marine construction, and small localized oil spillsin marinas. Recreational boating may disturb the benthos through propeller scarring of bottom habitats,especially seagrass beds. Tourism is increasing as use of the coastal zone increases. Therefore, it islikely that tourism related impacts will increase in the future.
C. Ecological Disturbance and Recovery Theory
Through time, populations and communities recover from disturbances via succession, a process studiedby ecologists for more than 60 years. Numerous models describe ecological succession and

9
the role of disturbance in determining community structure. Initially, these models were created for,and applied to, terrestrial ecosystems (Cooper, 1939; Keever, 1950; Krebs, 1972; Odum, 1969). Later,these models were refined for application to marine and estuarine ecosystems (Dauer, 1993; Pearsonand Rosenberg, 1978; Rhoads et al., 1978). An inherent aspect of succession is initiation by some sortof ecosystem or community disturbance. Several generalities can be drawn from succession models todistinguish early stages of succession from later stages. For example, early succession is characterizedby low diversity, opportunistic species, simple food chains and poor nutrient conservation. Latesuccession is characterized by high diversity, specialized slow- growing species, complex food web, andgood nutrient conservation.
In general, when an ecosystem is severely disturbed, existing fauna and flora are destroyed and/ordislocated creating open niche space for colonization. This colonization occurs as a succession ofspecies, beginning with pioneer species that typically have high biomass, high growth rates, and shortgeneration periods (Rhoads et al., 1978; Walker and Alberstadt, 1975). Pioneer species are eventuallyreplaced with intermediate, and then climax species. Species of later successional stages live longer andgrow slower than pioneer species. As a result of these dynamic processes, disturbance is thought toplay a critical role in maintaining high productivity for certain elements of the ecosystem. Generally,catastrophic disturbance dramatically reduces biodiversity. However, disturbance of intermediatefrequency and intensity can maintain species diversity by continually opening new space for colonizationby pioneer species, while other areas progress through successional stages.
Benthic estuarine environments of South Texas bays appear to be in a state of perpetual earlysuccession. Benthic estuarine communities in this area are characterized by low diversity andopportunistic species (Montagna and Kalke, 1992; Martin and Montagna, 1995). There are severalpossible reasons for this. First, estuarine succession models developed for application in other areasmay not apply to South Texas estuaries due to physical (e.g., depth and tides) and climatological (e.g.,rainfall and wind speed) differences. Second, benthic communities of South Texas may be in a state ofconstant disturbance. Examples of disturbances that could play a role in community development in thisregion include: trawling, sediment resuspension, wide salinity ranges (including hypersalinity), lowdissolved oxygen, and pollution.
C.1. Defining Succession
The concept of community succession was initially developed to describe changes in terrestrialvegetation. J. E. B. Warming and H. C. Cowles (1899; 1901) are credited with inception of thisconcept (Krebs, 1972), which they used to describe changes in sand dune vegetation as the communitydeveloped. Succession theory was formalized by F. E. Clements (1916; 1936) who referred to it as the“monoclimax hypothesis” (Krebs, 1972). In Clements’ theory, succession was viewed as a linearprocess that begins with a pioneer stage that facilitates colonization of subsequent species. Speciesreplacement continues until the climax stage is reached.

10
The term “succession” is used to describe community dynamics. A community is “... a group oforganisms occurring in a particular environment, presumably interacting with each other and with theenvironment, and separable by means of ecological survey from other groups (Mills, 1969; p. 1427).”Succession has been used as a means of characterizing, and sometimes predicting, community changesthrough time (Odum, 1969; Horn, 1974; Pearson and Rosenberg, 1978; Anderson, 1986). Odum(1969) defined succession by three parameters:
“(i) It is an orderly process of community development that isreasonably directional and, therefore, predictable. (ii) It resultsfrom modification of the physical environment by the community;that is, succession is community-controlled even though thephysical environment determines the pattern, the rate of change,and often sets limits as to how far development can go. (iii) Itculminates in a stabilized ecosystem in which the maximumbiomass (or high information content) and symbiotic functionbetween organisms are maintained per unit of available energyflow (Odum, 1969, p. 262).”
General features described in Odum’s (1969) model are fairly uniform throughout the literature. It isgenerally agreed that succession is a directional process in which species alter the environment toculminate in a terminal climax, or equilibrium, community. However, the role disturbance plays in thegeneral successional process is not a consistent feature in the application of the theory.
C.2. Defining Disturbance
Though many studies use a concept of disturbance, it is difficult to find a universal definition describingcharacteristics of disturbance. Disturbance is often used synonymously with stress and perturbationwhen applied to ecosystem dynamics (Rykiel, 1985). However, these words may confuse the issues ofcause and effect. In Rykiel (1985), disturbance is defined as “A cause; a physical force, agent, orprocess, either abiotic or biotic, causing a perturbation [an effect of disturbance] (which includes stress)in an ecological component or system; relative to a specified reference state and system; defined byspecific characteristics (p. 364).”
Disturbance is often defined as a physical process, e.g., as dredging, storms or construction (Wilson,1987; Horn, 1974; Rhoads et al., 1978). Focus on the physical nature of disturbance probably arisesfrom early applications of succession theory to the terrestrial environment, where key disturbances werefire and cattle grazing. As succession theory has become more frequently applied to marine andestuarine environments, the definition of disturbance has been broadened to include chemical alterationsof the environment, e.g., nutrient enrichment and industrial pollution (Simboura et al., 1995; Warwickand Clarke, 1994).
Chemical disturbance may be more important in aquatic environments than in terrestrial environments.Estuarine communities are subject to two critical chemical stresses that do not

11
influence terrestrial communities: fluctuations in salinity and oxygen. Both of these stresses cancause mortality and declines in community diversity. Other chemical disturbances may arisefrom spills of oil or chemical products and the discharge of municipal and industrial effluent.
Zajac and Whitlatch (1982a) define disturbance as “...any stochastic event initiating speciespopulation change either from density-independent mortality and/or change in the resource baseof the community... (p. 1).” This definition is sufficiently broad to incorporate both physical andchemical disturbances. It also may include alterations in food availability, which is a“disturbance” that is not ordinarily considered in succession models.
C.3. Models of Succession
At least five different disturbance and succession models have been proposed to describe andpredict community development through time. These models describe: 1) the generalsuccessional sequence, 2) the influence of a disturbance on a community, 3) the influence ofdisturbance on the progression of succession, 4) the physiological influence of a disturbance, and5) the various means by which early succession species influence subsequent colonization.
The conceptual model presented in Figure I.1 is adapted from Odum (1969). In this model, earlysuccession species are the first to colonize a substratum. These species modify the physicalenvironment making it more suitable for species later in the successional sequence. Successioncontinues until a stabilized ecosystem is achieved. Many of the characteristics Odum (1969)associated with either end of the successional sequence are presented in Table I.1.
Figure I.1. Conceptual model of succession. Adapted from Odum (1969).

12
Table I.1. General characteristics of early and late succession.Characteristic Early Succession Late Succession
Food chain complexity linear grazing based1
moderate/low2complex detrital based1
moderate/high2
Total organic matter small1 large1
Species diversity low1, 2 high1, 2, 4
Pattern diversity/stratification poorly organized1
low2well organized1
high2
Niche specialization broad1
low2narrow1
high2
Organism size small1, 3 large1, 3
Life cycle short3
simple1long3
complex1
Role of detritus in nutrient regeneration unimportant1
unclear3important1
more important3
Growth form rapid (r-selection)1 feedback controlled(k-selection)1
Growth rate high2, 3 low2, 3
Nutrient conservation poor1, 3 good1, 3
Stability (resists external perturbations) poor1 good1
1Odum (1969), 2Walker and Alberstadt (1975), 3Rhoads et al. (1978), 4Dauer (1993)
The disturbance model presented in Figure I.2 is adapted from Dauer (1993). It is based on theassumption that “...healthy benthic communities can be characterized by high biomass estimatesdominated by long-lived, often deep-dwelling, species and high species richness (Dauer 1993, p. 252).”As depicted in the model, a healthy community is exposed to stress, such as low dissolved oxygen,contaminated sediments (in this case stress is a synonym of disturbance), which alters the community.Characteristics of the altered community, compared to the healthy counterpart include loweredcommunity biomass, decreased species richness, a lower percentage of biomass representing deep-dwelling and equilibrium species, and a greater percentage of biomass representing fast growingopportunistic species.

13
Rhoads et al. (1978) described the role of disturbance in the successional sequence. A conceptualdiagram adapted from Rhoads et al. (1978) is presented in Figure I.3. In this model, the occurrence of adisturbance prevents a community from reaching the equilibrium stage. However, in the absence ofdisturbance, community succession will progress until a stable equilibrium is reached.
The fourth model (Figure I.4) illustrates how a disturbance may induce a physiological response in anorganism. This diagram is adapted from Forbes et al. (1994) who investigated the influence of thedisturbances nutrient enrichment and low oxygen on capitellid polychaetes. Organic enrichment andlow oxygen caused physiological responses in the polychaetes that resulted in decreased feeding anddecreased conversion efficiency. The physiological-based model illustrates how a community responseto a disturbance may represent the sum total of the physiological responses of individual species.
Figure I.2. Conceptual model of disturbance. Adapted from Dauer (1993).
Figure I.3. Conceptual model of the role disturbance plays in the successional process.Adapted from Rhoads et al. (1978).
Figure I.4. Conceptual model of the physiological response of an organism todisturbance. Adapted from Forbes et al. (1994).

14
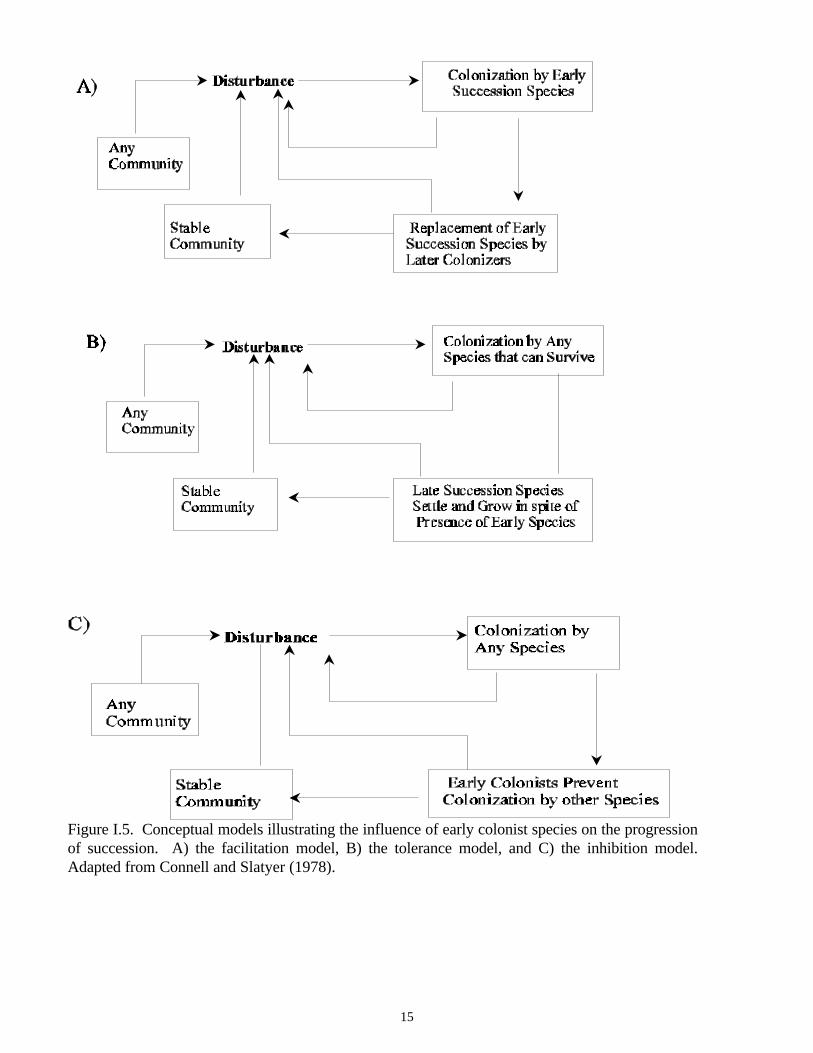
Connell and Slatyer (1977) developed a successional model in which early succession colonists influencecommunity development through three different mechanisms. They referred to these three mechanismsas the: 1) facilitation, 2) tolerance, and 3) inhibition models. Conceptual diagrams of each model arepresented in Figure I.5.
In the facilitation model (Figure I.5A; Connell and Slatyer, 1977), early succession species modify theenvironment so that it is less suitable for species earlier in the sequence, but more suitable for laterspecies. Thus, succession continues until environmental modification no longer facilitates communitydevelopment and a stable community is attained. This model is analogous to Odum’s (1969) modelpresented in Figure I.1.
In the tolerance model (Figure I.5B; Connell and Slatyer, 1977), early succession species modify theenvironment so that it is less suitable for species earlier in the successional sequence. However, itdiffers from the facilitation model in that the environmental modifications have no affect on therecruitment of, and colonization by, species later in the sequence. Thus, succession continues until nospecies can invade and grow in the presence of resident species.
The inhibition model (Figure I.5C; Connell and Slatyer, 1977) is different than the facilitation andtolerance models. In the inhibition model, early succession species modify the environment, making itless suitable for any species to colonize the area. Thus, early colonists exclude new recruits as long asthey persist.
C.4. Application of Models
Applying disturbance and succession models to benthic estuarine communities is not easy. Problemsarise due to specificity of some models to certain environmental conditions or habitats, and over-generalization of ecological mechanisms modeled. With these cautions, it is possible to interpret andpredict changes in benthic habitats.
Though generalized, succession models were developed with respect to specific conditions,disturbances, and habitats making the broad application of a universal theory difficult. For example,Dauer’s (1993) disturbance model was developed based on the effects of low oxygen and contaminatedsediments as disturbances. Another potential problem is the possibility of geographic bias in thesuccession and disturbance literature (Pearson and Rosenberg 1978). This is due to the predominanceof data from North America and Western Europe. Furthermore, succession models were initiallydeveloped for, and applied to, terrestrial ecosystems.
It is difficult to apply terrestrial succession models to estuarine ecosystems. In an estuary, communitiesare subjected to two primary stressors that do not exist in the terrestrial environment: fluctuations ofambient salinity and dissolved oxygen. These fluctuations can be large in Texas bays and estuaries thatare shallow and subjected to pulses of freshwater inflow, high evaporation, and high temperatures.Thus, numerous natural disturbances (e.g., high salinity, low oxygen) may intermittently and repeatedlyaffect benthic organisms making it difficult to differentiate between anthropogenic and naturaldisturbances.
15
Figure I.5. Conceptual models illustrating the influence of early colonist species on the progressionof succession. A) the facilitation model, B) the tolerance model, and C) the inhibition model.Adapted from Connell and Slatyer (1978).

16
Few organisms can tolerate broad salinity fluctuations. The number of species in an aquatic habitatdecreases with salinity below 30‰ until about 6‰ (Britton and Morton, 1989). At salinities less than6‰, freshwater species begin to tolerate saline conditions and diversity sharply increases (Britton andMorton, 1989). Thus, broad salinity fluctuations have the effect of a disturbance in estuaries, especiallywhen pulses of freshwater cause sudden salinity declines. The effect is to cause a successionalsequence.
Decease in diversity with decreasing salinity is due to the inability of euryhaline species to cope with theosmotic influx of water into their bodies. Euryhaline species are able to tolerate broad salinity changesby one of two mechanisms. Some allow their bodies to equilibrate with the surrounding environment.Others maintain tolerable ionic concentrations within their bodies through osmoregulation (Britton andMorton, 1989).
Few organisms are able to survive hypoxic (< 2 mg O2 l-1) or anoxic (<1 mg O2 l-1) conditions thatoccur in some estuarine environments. Estuarine water is susceptible to sudden increases in nutrientconcentrations due to influx of detritus, nutrients and animal wastes transported by terrestrial runoff.Some estuaries also receive point source inputs from sewage outfalls and industrial effluent discharges.These nutrient inputs may lead to increased respiration, which consumes available oxygen, creatinghypoxic, and sometimes anoxic, conditions.
Though succession and disturbance models are derived with respect to specific environmentalconditions and habitats, mechanisms described by models are sometimes overgeneralized. For example,influence of species’ life histories and physiological responses to disturbance on community successionare not incorporated directly into models. In addition, influence of interspecific interactions, e.g.,competition, predation, and food availability for colonizing species are omitted from models. Theseelements are directly related to the progression of succession and are important factors influencingcommunity dynamics and ultimate outcome of succession.
Frequency and intensity of disturbances may also influence the outcome of succession. Frequency ofdisturbance may maintain ecosystem productivity by inhibiting a community from reaching equilibrium(Rhoads et al., 1978). In addition, disturbance frequency at various stages may interrupt the progress ofsuccession and reset progression back to the beginning of the sequence (Connell and Slatyer, 1977). Itis obvious that magnitude of a disturbance may influence succession, but we are not aware of asuccession model in which disturbance intensity has been incorporated.
C.5. Community Succession
Community succession is often described as exhibiting distinct patterns (Cooper, 1939; Odum, 1969;Horn, 1974; Rhoads et al., 1978; Dauer, 1993). Succession is generally initiated by a disturbance thatcreates an empty patch for colonization. This open patch is then colonized by early succession specieswith the characteristics presented in Table I.1. Species that occur early in the succession sequence mayfacilitate, inhibit, or not affect subsequent species colonization (Connell and Slatyer, 1978). Communitysuccession then continues through a variety of mechanisms until a stable climax community is attained.

17
The emphasis of most succession models is directed toward early succession versus climaxcommunities. This is thought to arise from the variety of mechanisms that affect communitycolonization during the progression of succession between the two extremes. Examples of suchmechanisms include: species’ life histories, food resource availability, predation, competition, speciesinteractions with the environment, disturbance frequency, and intensity of disruption. Thesemechanisms may act in concert and to varying degrees influence progression of succession. Thus,characterization of succession stages between early succession and climax communities is difficult andprobably geographically and temporally specific.
C.6. Estuarine Benthic Succession
Many studies apply disturbance and succession models to estuarine benthic communities. Some studiesfocus on colonization of newly deposited, defaunated sediment (Rhoads et al., 1978; Zajac andWhitlatch, 1982a; 1982b Gallagher et al,. 1983). Others investigate disturbance based successionarising from organic enrichment (Pearson and Rosenberg, 1978; Levin and Smith, 1980; Dauer, 1993;Forbes et al., 1994 ), hypoxia (Santos and Simon, 1980; Dauer, 1993; Forbes et al., 1994), industrialpollution (Moran and Grant, 1989a; 1989b; Simboura et al., 1995), and bioturbation (Brenchley, 1981).Other benthic succession studies concerned deep sea communities (Levin and Smith, 1984; Grassle andMorse-Porteous, 1987), fouling communities (Sutherland and Karlson, 1977; Moran and Grant, 1989a;1989b), rocky intertidal communities (Lubchenco and Menge, 1978; Soussa and Connell, 1992), andmeiofauna (Sherman and Coull, 1980; Fegley, 1988; Alongi and Christoffersen, 1992).
Most estuarine benthic succession studies focus on early stages of succession. This is probably due tothe relatively short duration of a scientific study compared with length of time it may take a communityto fully develop. Few studies have a duration longer than two or three years due to funding constraints.Another less obvious barrier to long-term studies is the time limitation of a graduate students degreeplan.
It is not known how long it takes a marine benthic community to reach a climax state. There isevidence that estuarine benthic communities may progress through succession faster than those of thedeep sea benthos (Levin and Smith, 1984). The best evidence is from studies on succession followingdredging, effects of large storms, and recovery from accidental spills. These studies indicate from oneto five years may be necessary for full recovery.
Many succession models focus on defining characteristics of an early succession community. The keycharacteristic of an early succession species is community dominance by opportunistic species, e.g.,Mediomastus ambiseta, Streblospio benedictii, and Mulinia lateralis (Dauer, 1993). Othercharacteristics include lower biomass and diversity compared to a climax community (Dauer, 1993).Composition of an early succession community will largely depend on species’ life histories, time ofyear, prevailing weather patterns, and larval recruitment dynamics. Presence of early successioncommunities can be an indicator of recent disturbance.

18
Opportunistic species, characteristic of early succession benthic communities, can alter the environmentto affect further colonization. For example, spionid polychaete tubes have been found to facilitatecolonization of azoic sediment (Gallagher et al., 1983). Infaunal polychaetes can play an important rolein controlling community structure (Commito, 1982). This can occur directly by preying on newlysettling larvae or indirectly when bioturbation or bioirrigation alters sediment.
Large infauna (e.g., Enteropneusta), often associated with climax communities, may facilitateoxygenation of deeper sediments by bioturbation (Flint and Kalke, 1986). With oxygenation of deepersediments, infauna are able to live more deeply in sediments, enhancing colonization by new infaunalspecies (Flint and Kalke, 1986). Thus, colonization of a community by larger infauna appears tofacilitate an increase in community diversity and promotes progression of succession.
It has been suggested that we have a poor understanding of characteristics of a benthic climaxcommunity (Rhoads et al., 1978). However, there is evidence indicating a benthic climax communityconsists of larger, deep-dwelling animals (Flint and Kalke, 1986), high biomass, high diversity, andlonger-lived species (Rhoads et al., 1978; Dauer, 1993;).
It is uncertain whether benthic climax communities have been observed in the field. Many study areaslack climax species altogether (Sutherland and Karlson, 1977; Santos and Simon, 1980; Gallagher etal., 1983; Alongi and Christoffersen, 1992). Concurrent with these findings, estuarine benthiccommunities of South Texas tend to be dominated by opportunistic species (Montagna, unpublisheddata). Opportunistic species are characteristic of early succession and highly disturbed communities.Areas supporting only these kinds of communities may be in a state of continual disturbance.
Absence of climax species has been associated with tidal and storm disturbances (Alongi andChristoffersen, 1992), and experimental effects such as tray avoidance and hydrodynamic interactionswith equipment (Levin and Smith, 1984). Other disturbances that may prevent a climax communityfrom being attained include hypoxia, salinity fluctuations, and resuspension of sediments. Each type ofdisturbance may individually act to inhibit the progress of succession. However, it is more likely theyinteract synergistically in space or time to maintain the community at its early development stage.
D. Objectives
Two objectives of the present study are to: 1) determine effects of anthropogenic disturbances onbiological processes, and 2) assess relative contribution of anthropogenic and natural disturbances onbenthic habitats. The approach to fulfill these objectives was to perform a literature survey, andsynthesize available data in the context of disturbance and succession theory. First, anthropogenic andnatural influences are identified. Then, status and trends of disturbances, as well as potentialenvironmental impacts, are characterized. Together, influences and trends represent study results. Thediscussion section compares disturbance effects on different bottom types and identifies key resourcemanagement concerns. Finally, data information gaps were identified.

19
II. METHODS
A. Historical Data
Effects of anthropogenic and natural disturbance on benthic flora and fauna were evaluated basedprimarily on available literature and databases. The evaluation includes special emphasis on assessmentof anthropogenic disturbances resulting from: 1) shrimp harvesting, 2) commercial tug and bargeoperations, 3) recreational boating, 4) maintenance channel dredging, and 5) open water placement ofdredged material and effects of natural processes including: 1) storms, 2) fronts, 3) floods, 4) freshwaterinflow, 5) suspended sediments, 6) subsidence, 7) hypoxia, 8) brown tide, and 9) bioturbation on thephysical, chemical, and biological processes of bay bottom habitats. Qualities of disturbances (depth,duration, and frequency) were considered when comparing influences of each type of disturbance.
A.1. Literature review
Available literature relating to anthropogenic and natural disturbances of estuarine benthic communitieswithin the CCBNEP study area was reviewed. We identified and incorporated pertinent findings fromCCBNEP projects that were completed or in progress. Because some reports were not published, draftcopies were reviewed. Primary scientific literature on disturbance and succession ecology, as well asother relevant topics, was reviewed. Literature sources included those identified in current CCBNEPcharacterization reports. We compiled detailed information on status and trends of anthropogenicdisturbances including: shrimp harvesting, commercial tug operations, recreational boating, anddredging practices. Several literature resources were identified a priori for issues related to: freshwaterinflow (Texas Department of Water Resources, 1982; Montagna and Kalke, 1992; Longley, 1994),commercial fish and shrimp harvesting (Matlock, 1982; National Marine Fisheries Service, 1990;Nichols et al., 1990; Hoar et al., 1992; Boyd et al., 1994; Food and Agriculture Organization, 1994;Robinson et al., 1994; Campbell and Choucair, 1995; Fuls, 1995), sportfish harvesting (Warren et al.,1994), and dredging (Windom, 1972; 1975; James, et al., 1977; Rhoads et al., 1978). Recreationalboating trends, based on angler surveys, were obtained from the Texas Parks and Wildlife Department(TPWD). Information on commercial tug operations was obtained from the U.S. Department ofCommerce and the Corps of Engineers (COE). The COE also provided information regarding channeldredging and the deposition of dredged material. Information regarding the construction of structures(e.g., piers, docks, cabins, oil and gas facilities) over state-owned submerged land was available fromthe Texas General Land Office (GLO).
A.2. Assessment of disturbances
Natural and anthropogenic disturbances to submerged aquatic habitats were identified based on historicand current levels, as well as projected trends. Key sources for identification and assessment ofdisturbances were characterization reports completed in Year 1 of the CCBNEP. A second source wasmembers of the CCBNEP Scientific and Technical Advisory Committee. Status and trends of naturaldisturbances (e.g., storms, floods, bioturbation, salinity effects, ambient turbidity, siltation rates,subsidence) and impacts on estuarine benthos within the CCBNEP study area were identified.

20
Particular attention was given to natural disturbances that may result in impacts similar to those ofhuman activities. Commonalities or differences that may exist between effects of natural andanthropogenic disturbances were identified.
Influence of anthropogenic and natural disturbances on benthic plant and animal communities wasassessed in the context of ecological disturbance and succession theory. Several models have beendeveloped to describe benthic disturbances and subsequent succession of benthic organisms (Walker andAlberstadt 1975; Pearson and Rosenberg 1978; Rhoads et al., 1978). These models served as the basisfor assessment of disturbance effects within the CCBNEP study area. A conceptual model of theCCBNEP ecosystem and food web (Montagna et al., 1995) served as the basis for food web analysis.This model contains a diagrammatic representation of the study area's estuarine food web and habitats.In addition, specific anthropogenic and natural disturbances that may affect trophic dynamics and energytransfer were illustrated. Alterations in the food web were assessed using disturbance and successiontheory. Magnitude, frequency, and areal extent of anthropogenic disturbances on each bottom type(e.g., vegetated, unvegetated, mud, sand, and shell) were compared.
Relative level of disturbances was difficult to compare based on literature reviews. In some cases directcomparisons between anthropogenic and natural disturbances were possible, because the same habitator biota was affected, and endpoints were in the same units. Examples of these disturbances includehypoxia, freshwater inflow, and shipping effects on macrofaunal abundance and biomass. However,comparing these disturbances to other types of disturbances was more problematic because ecologicalprocesses affected were different or endpoints were in different units. For example, it was desirable tocompare effects of dredging and hypoxia on macrofauna, but it was not possible, because time scales ofdredging events and hypoxic events were discordant. Also, the primary ecological process affected bylight is photosynthesis (because increased turbidity reduces light), but the primary ecological processaffected by hypoxia is respiration (because of reduced availability of dissolved oxygen). Clearly, theseare not comparable. Another problem was dredging and hypoxia do not occur in the same areas orhabitats. The only way effects of different disturbances could be compared to one another was in alarge, complex ecosystem model with standardized units. By linking all processes in one model,changes in levels of a disturbance in one compartment is easily comparable to changes in anothercompartment. However, construction of such a model was well beyond the scope of the current study.Therefore, our approach was to characterize extent and/or trends in disturbances, contrast those thatwere directly comparable to each other, and determine which benthic habitats were affected by eachtype of disturbance.
A.3. Public databases and gray literature
Appropriate local, state, and federal agencies (e.g., Port of Corpus Christi, GLO, TPWD, Texas NaturalResource Conservation Commission (TNRCC), Texas Water Development Board (TWDB), NationalBiological Service (NBS), U.S. Geological Service (USGS), and COE) were contacted to identifypertinent databases and publications that were not readily available.

21
B. New Data
Members of the CCBNEP Science and Technical Advisory Committee (STAC) were consulted tocompile a list of resource management concerns. Specific members, whose expertise complementedthat of the authors, were targeted for interviews. Interviews were conducted using a set of standardquestions (Appendix A). Questions were framed to illicit responses on concerns about benthic habitats.
Information collected during interviews was also used to identify information gaps that were pertinentto long-term management and monitoring of the CCBNEP study area. These gaps were analyzed todetermine how they may influence findings or conclusions related to effects of anthropogenic andnatural disturbances on the physical, chemical, biological, and ecological components of estuarinebenthos.
22
III. RESULTS
A. Status and Trends of Anthropogenic Disturbances
This section provides results from literature reviews on status and trends of man’s activities that canaffect bay bottom habitats. Activities reviewed include: shrimping, commercial maritime transportation,dredging, and recreational boating.
A.1. Shrimping
A.1.1 Description of shrimping activities
The commercial shrimping industry in Texas has evolved from a man-powered fishery which used castnets, haul seines, sail-powered vessels, and other primitive methods to become the most valuablecommercial food fishery in Texas. Landings in 1993 totaled 74 million pounds and the total economicimpact to the Texas economy was estimated to be at least $500 million per year (TPWD, 1995b).Fishermen began using trawls towed behind motorized vessels for catching shrimp around 1920(TGFOC, 1923). Two primary factors that determine the extent to which shrimp trawling will affectbenthic habitats are time spent trawling (i.e., effort) and area covered per unit time (i.e., net sizemultiplied by towing speed). Data on effort are compiled for the entire Texas coast but data are notavailable specifically for the CCBNEP study area. Neither historical nor current data are available onarea covered by trawling. Commercial harvest data might serve as a measure of effort and area coveredbut there are numerous limitations to using harvest data for this purpose. Ponwith and Dokken (1996)described limitations of using harvest data to measure status of the target resource and most of thoselimitations apply to our use of the data as well. Primary among them are: inaccurate/incompletereporting, changes in technology (i.e., catch per unit effort), and changes in regulations. Other datawhich might provide information on amount of trawling effort over time include: seasons and closedareas, kinds of boats and gear used, number of licenses issued, and areas fished. These factors arereviewed below in an effort to assess changes or patterns in trawling effort within the CCBNEP studyarea.
A.1.1.1. Seasons, times, and closed areas
The first comprehensive management plan regulating shrimp harvest was contained in the 1959 ShrimpConservation Act, which established licenses for each of the user groups. This legislation set size, bag,possession, time and gear limits and established fishing seasons and areas for fishing (e.g., major bays,bait bays, nursery areas, Gulf waters). In 1985, the 69th Texas Legislature delegated to the Texas Parksand Wildlife Commission authority to regulate the shrimp fishery (Cody et al., 1989). This led todevelopment of the Texas Shrimp Fishery Management Plan, which was published in 1989. This planallows the Texas Parks and Wildlife Commission to regulate catching, possession, purchase, and sale ofshrimp.

23
For the purposes of regulating shrimping activity, estuarine waters are divided into three zones: majorbays, which in the CCBNEP area includes Aransas and Corpus Christi Bays; bait bays, which includesmost of Copano, Nueces, Upper Laguna Madre, Baffin, and Alazan Bays; and nursery areas, whichincludes all tributary bays, bayous, inlets, lakes and rivers. Shrimping is permanently excluded innursery areas. Areas supporting submerged vegetation within major bays or bait bays are not excludedfrom shrimping except by virtue of shallow water depth, which excludes most shrimp boats. A tableshowing size restrictions and the commercial bay and bait shrimp regulations for the CCBNEP area forthe 1979, 1990 and 1994 seasons is given in Ponwith and Dokken (1996). Regulations for 1996 arealmost identical to those for 1994. Regulations have become more restrictive over the years, especiallyrelative to 1979, and might have served to reduce trawling effort.
A.1.1.2. Kinds of boats and gear used
Commercial shrimp boats are divided into three length classes for management and data reportingpurposes: < 7.6 m (25') = part-time commercial bay boats, 7.6 - 16.8 m (25' - 52') = commercial bayboats, and > 16.8 m (52') = commercial Gulf vessels (Crowe and Bryan, 1986; 1987). For the purposesof this report, only the first two size classess will be addressed. Of these smaller boats, bait shrimpersuse the smallest, usually < 9.1 m (30') in length (Iversen et al., 1993). Bay shrimping boats are usuallyflat-bottom, shallow-draft boats, which make it easier to work in shallow bay waters. In the CCBNEParea, depths range from 0.6 m (2') in Mission Bay to 4.0 m (13') in Corpus Christi Bay. Mean depth inthe Laguna Madre is about 1.2 m (4') (Baird et al., 1996).
Commercial bay boats may use only a single otter trawl or a beam trawl as the main net and a smallversion of the otter trawl as a “try” net (to sample shrimp in a given area). The shrimp net is basically alarge-mesh, wide-mouth funnel with lateral wings on each side. These wings are attached to top andbottom ends of doors, which are flat and weighted. Trawls are towed along bottom and as waterpressure forces the doors upright they act as kites that hold the net open and keep it on the bottom. Atickler chain, located on the bottom between the wings, disturbs the shrimp, which jump up off thebottom and are captured as the net passes (Iversen et al., 1993). A beam trawl is a rectangular frame,typically suspended from the bow of the vessel and does not touch the bottom. A try net may notexceed 6.4 m (21') in total width and its doors may not exceed 0.29 m2 (3 sq. ft.) each. A beam trawlused as a try net may not exceed 3.0 m (10') and, if used as a main net, may not exceed 7.6 m (25').Two doors used to keep the main net open may range from 0.9 - 3.0 m (3' - 10') lengthwise, and totalwidth of the net and doors may range from 12.2 - 15.8 m (40 - 52'), depending on door size (TPWD,1995a). During the fall shrimping season only (see below), the maximum width of the net and doorsmay not exceed 19.0 m (62'). Most commercial bay boats use nets that are near the maximum allowablesize (Fuls, 1995). Bait-shrimp boats may also use either an otter trawl or beam trawl as the main net.Net size restrictions in the bait shrimp fishery are the same as for bay shrimping, except that a try-netused by bait shrimp boats may not exceed 3.7 m (12') in total width (TPWD, 1995a).
Tow times for the bait shrimp boats are usually about 30 minutes to insure the retrieval of shrimp in livecondition, while bay shrimp boats will pull trawls an average of one to three hours (Page Campbell,personal communication, TPWD, Rockport, Texas). Tow speeds for bay boats are
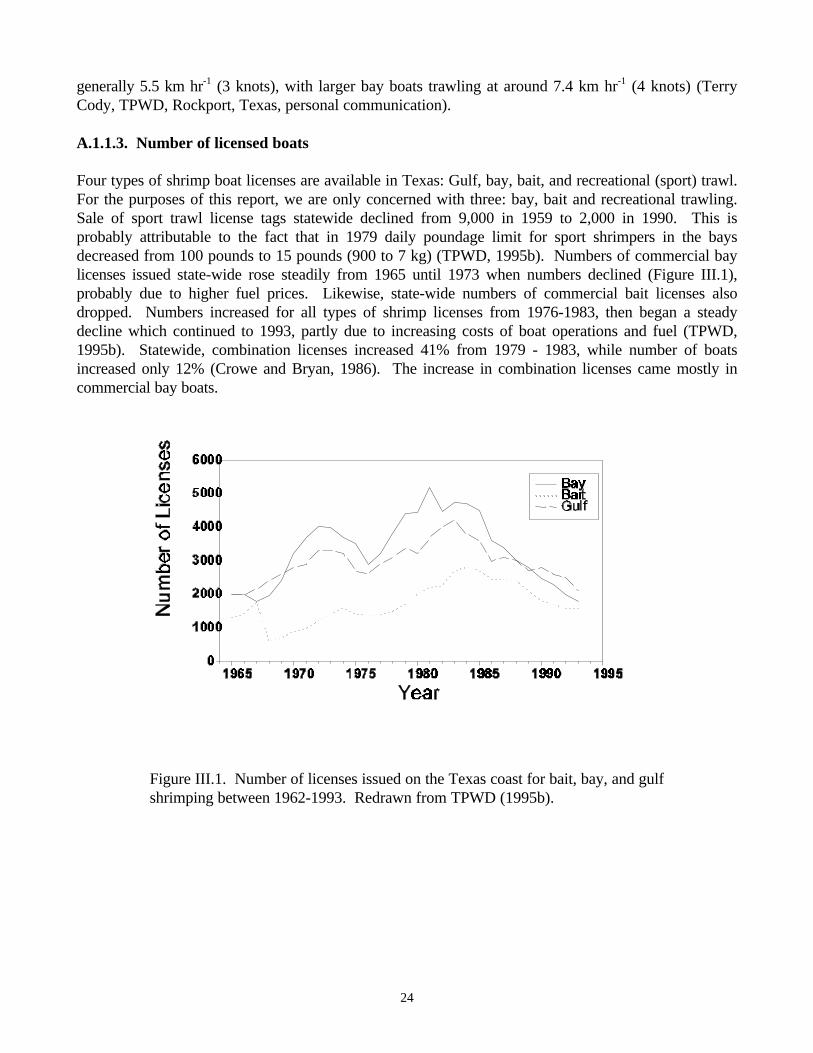
24
generally 5.5 km hr-1 (3 knots), with larger bay boats trawling at around 7.4 km hr-1 (4 knots) (TerryCody, TPWD, Rockport, Texas, personal communication).
A.1.1.3. Number of licensed boats
Four types of shrimp boat licenses are available in Texas: Gulf, bay, bait, and recreational (sport) trawl.For the purposes of this report, we are only concerned with three: bay, bait and recreational trawling.Sale of sport trawl license tags statewide declined from 9,000 in 1959 to 2,000 in 1990. This isprobably attributable to the fact that in 1979 daily poundage limit for sport shrimpers in the baysdecreased from 100 pounds to 15 pounds (900 to 7 kg) (TPWD, 1995b). Numbers of commercial baylicenses issued state-wide rose steadily from 1965 until 1973 when numbers declined (Figure III.1),probably due to higher fuel prices. Likewise, state-wide numbers of commercial bait licenses alsodropped. Numbers increased for all types of shrimp licenses from 1976-1983, then began a steadydecline which continued to 1993, partly due to increasing costs of boat operations and fuel (TPWD,1995b). Statewide, combination licenses increased 41% from 1979 - 1983, while number of boatsincreased only 12% (Crowe and Bryan, 1986). The increase in combination licenses came mostly incommercial bay boats.
Figure III.1. Number of licenses issued on the Texas coast for bait, bay, and gulfshrimping between 1962-1993. Redrawn from TPWD (1995b).
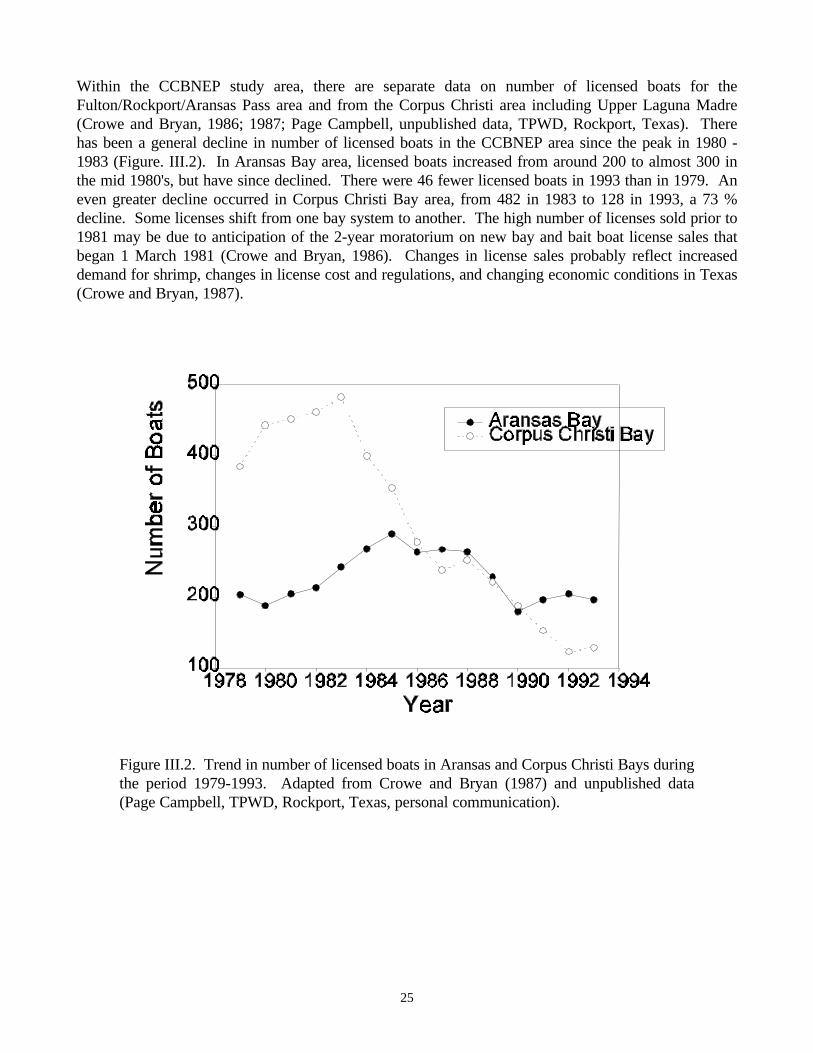
25
Within the CCBNEP study area, there are separate data on number of licensed boats for theFulton/Rockport/Aransas Pass area and from the Corpus Christi area including Upper Laguna Madre(Crowe and Bryan, 1986; 1987; Page Campbell, unpublished data, TPWD, Rockport, Texas). Therehas been a general decline in number of licensed boats in the CCBNEP area since the peak in 1980 -1983 (Figure. III.2). In Aransas Bay area, licensed boats increased from around 200 to almost 300 inthe mid 1980's, but have since declined. There were 46 fewer licensed boats in 1993 than in 1979. Aneven greater decline occurred in Corpus Christi Bay area, from 482 in 1983 to 128 in 1993, a 73 %decline. Some licenses shift from one bay system to another. The high number of licenses sold prior to1981 may be due to anticipation of the 2-year moratorium on new bay and bait boat license sales thatbegan 1 March 1981 (Crowe and Bryan, 1986). Changes in license sales probably reflect increaseddemand for shrimp, changes in license cost and regulations, and changing economic conditions in Texas(Crowe and Bryan, 1987).
Figure III.2. Trend in number of licensed boats in Aransas and Corpus Christi Bays duringthe period 1979-1993. Adapted from Crowe and Bryan (1987) and unpublished data(Page Campbell, TPWD, Rockport, Texas, personal communication).

26
A.1.1.4. Effort
State-wide fishing effort on shrimp stocks increased 95% in the Gulf and 400% in the bay fishery since1961 (Figure III.3). This growth has led to over-fishing in the bay fishery (TPWD, 1995b). Over-fishing was indicated by overall declines in catch rates (i.e., pounds per trawling hour) of brown shrimpin the bays. Average weight of shrimp landed for each hour of shrimping effort decreased by 40%between 1972 and 1993 (Figure III.4), however, there has been a dramatic increase in the pounds of bayshrimp landed over that period (TPWD, 1995b). The net result for the individual shrimper has probablybeen a decline in catch for each hour of shrimping effort. “Thus, shrimpers are fishing harder to catchsmaller shrimp that are worth less in value, forcing shrimpers to fish even harder” (TPWD, 1995b). Ifthe change in state-wide effort reflects changes in effort in the CCBNEP study area then trawling efforthas increased substantially in recent years.
Figure III.3. Number of days fished by shrimp boats along the Texas coast. Redrawn fromTPWD(1995b).

27
On June 8, 1995, the Texas Legislature enacted Senate Bill 750, a limited entry plan for bay and baitshrimp fisheries. This bill established a license program with the intent of limiting numbers of shrimpboats working in Texas bays (TPWD, 1995b). To be eligible for a commercial license for participationin the fishery beginning September 1, 1995, an individual must have held a valid bay and/or bait licenseon April 1, 1995 (TPWD, 1995b). There are also restrictions concerning vessel upgrades and licensetransfers. The TPWD is engaged in a license by-back program as an additional means of reducingnumbers of boats fishing. In the long-term, limited entry would cap numbers of vessels and instituteequitable methods to reduce amount of shrimping effort (TPWD, 1995b). If successful, this plan couldresult in less trawling in the bays in the future assuming effort by remaining license holders does notincrease, or boats from other areas do not shrimp in the controlled areas.
Figure III.4. Coast-wide trend in pounds of brown shrimp caught per hour of trawling. Redrawnfrom TPWD (1995b). Conversion: 1 pound = 0.454 kg)
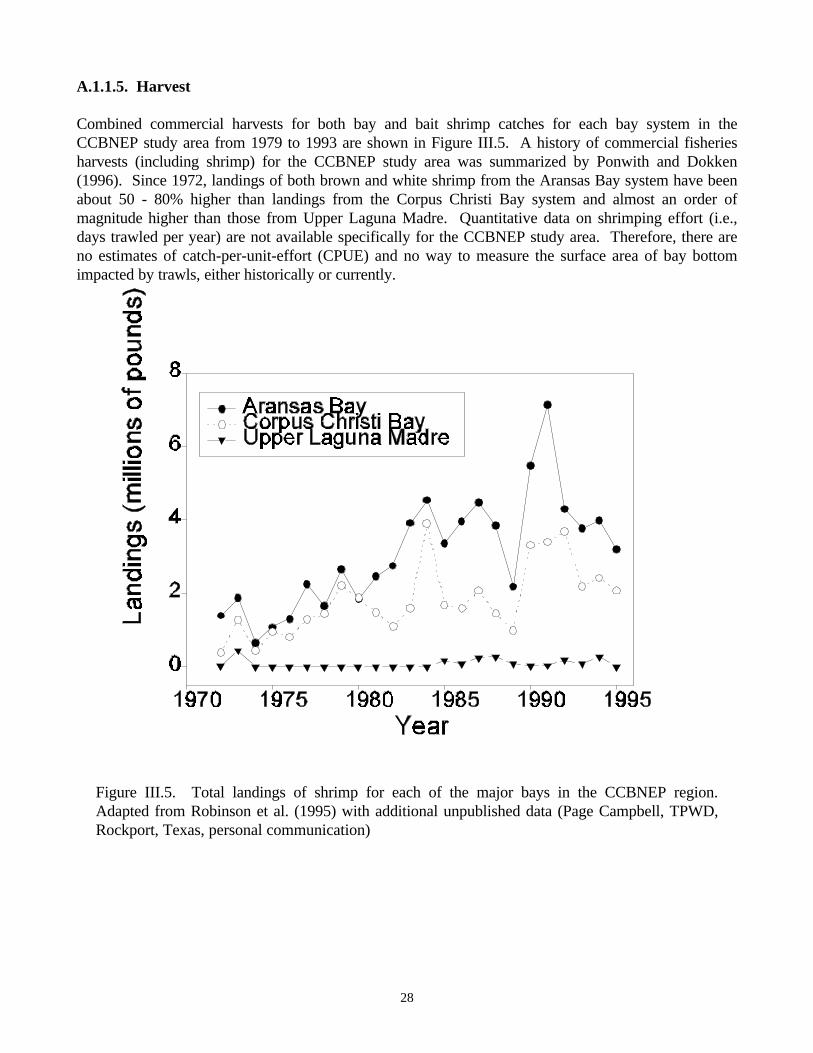
28
A.1.1.5. Harvest
Combined commercial harvests for both bay and bait shrimp catches for each bay system in theCCBNEP study area from 1979 to 1993 are shown in Figure III.5. A history of commercial fisheriesharvests (including shrimp) for the CCBNEP study area was summarized by Ponwith and Dokken(1996). Since 1972, landings of both brown and white shrimp from the Aransas Bay system have beenabout 50 - 80% higher than landings from the Corpus Christi Bay system and almost an order ofmagnitude higher than those from Upper Laguna Madre. Quantitative data on shrimping effort (i.e.,days trawled per year) are not available specifically for the CCBNEP study area. Therefore, there areno estimates of catch-per-unit-effort (CPUE) and no way to measure the surface area of bay bottomimpacted by trawls, either historically or currently.
Figure III.5. Total landings of shrimp for each of the major bays in the CCBNEP region.Adapted from Robinson et al. (1995) with additional unpublished data (Page Campbell, TPWD,Rockport, Texas, personal communication)

29
A.1.1.6. Historical and current shrimping areas
There are no quantitative assessments of either historical or current usage patterns by shrimp harvestersin the CCBNEP study area. There are anecdotal references to concentrated fishing effort in the GIWWand the Corpus Christi Ship Channel in Corpus Christi Bay, but there are no definitive data. It is alsoknown that effort in Aransas Bay shifts seasonally as the shrimp move out of the estuary, butquantitative data do not exist.
A.1.1.7. Bycatch
Virtually every fishery produces an incidental catch or bycatch as part of harvesting. Bycatch is definedas incidental catch of non-target organisms due to fishing activities. In shrimping, many finfish andinvertebrates other than shrimp are captured. Bycatch includes crabs, non-commercial shrimp species,jellyfish, starfish, squids, molluscs, and various fishes. Blue crabs and some fishes in the catch aremarketable, but the largest portion of catch is usually discarded (Cody et al., 1989). Bycatch incommercial bay shrimp fishery in Aransas and Corpus Christi Bays was analyzed by Fuls (1995) duringthe 1993 spring and fall open seasons. Bycatch was composed almost entirely of finfish and thoseresults were summarized in Ponwith and Dokken (1996). There were virtually no infaunal organisms inthe bycatch and only a few epifaunal organisms were caught. Most of these were various crabs andshrimps and with the exception of blue crab (Callinectes sapidus) and lesser blue crab (Callinectessimilis), none of them ever made up more than 1% of the total bycatch within a season and few wereever taken in numbers greater than 10 per hour. There are no other similar data available for theCCBNEP study area to estimate trends in bycatch of infaunal or epifaunal organisms.
A.1.2. Potential impacts of shrimping activities
Concern that fishing practices, especially those that involve dragging fishing gear over the bottom, areharmful to the environment is centuries old. Graham (1955) reports that in 1376, fishermen petitionedthe King of England “that the great and long iron of the wondyrchoun runs so heavily and hardly overthe ground when fishing that it destroys the flowers of the land below water there.” Given this earlyinsight and numerous studies on effects of several bottom-fishing gear types, it is surprising there is stillno consensus regarding impacts of those activities on benthic environments.
The dominant type of gear used in the CCBNEP study area is the otter trawl. We could not find anystudies on direct effects of otter trawls on the sediment structure or benthic infauna in the CCBNEPstudy area. However, Schubel et al. (1978) reported high levels of suspended sediment concentrationsbehind shrimp trawls and found levels comparable to that caused by dredge disposal activities. Data ontrawling effects presented here were drawn from studies conducted in marine environments around theworld. The vast majority of studies are from coastal and oceanic sites rather than bays and estuaries.These studies have focused on effects of three similar types of fishing gear: otter trawls, beam trawls,and scallop dredges. Beam trawls referred to here are heavy, rigid structures towed over the bottomrather than the relatively lightweight nets fished at the surface in the Upper Laguna Madre shrimpfishery. Most studies focused on effects of scallop dredges and

30
beam trawls rather than otter trawls. Dayton et al. (1995) conducted an extensive evaluation of theenvironmental impact of marine fishing, and contrasted effects of various bottom-fishing gear. Effectsof three gear types were similar in his study. However, in another study, intensity of damage to thebottom was generally proportional to weight of the gear (Jones, 1992). Otter trawls are generallylighter weight and thus produce the least amount of physical damage. Assessment of trawling effectspresented here will cover impacts of all three gears, and differences between otter trawls and the othertwo gears will be pointed out where appropriate.
Impacts of trawls and dredges on marine environments range from direct and immediate to indirect andlong-term. Type and degree of impact depends on a multitude of factors. Jones (1992) reviewed theliterature on trawling effects up through 1990. He divided effects into five categories: scraping andploughing, sediment resuspension, destruction of non-target benthos, dumping of processing waste, andindirect effects. Messieh et al. (1991) also reviewed studies on trawling impacts through about the sameperiod and divided potential impacts into physical and biological. Some possible impacts of trawlinglisted by Messieh et al. (1991) are:
• Incidental mortality or damage to target and non-target species by direct contact with mobile fishinggear.
• Increased predation pressure in the dredge track resulting from exposure of infaunal species.• Alteration of sediment chemistry and texture, rendering the seabed less suitable for larval and adult
stages of valuable fishery resources. This alteration can also lead to changes in communitystructure.
• Sediment resuspension can reduce quality of available food for filter feeders, smother spawningareas, detrimentally affect feeding and metabolic rates of benthos, and cause damage to gills ofmarine organisms.
• Resuspension of sediments containing toxic contaminants (i.e., heavy metals) may increase theirbioavailability to marine organisms.
• Increased rates of benthic/pelagic nutrient flux may stimulate phytoplankton production in shallowor well-mixed areas.
A major determinant of degree of impact is nature of substratum being fished. Hard-bottom habitats,such as inshore sponge-coral habitats of the South Atlantic Bight, are subject to substantially greaterand more long-term damage than soft-bottom habitats (Van Dolah et al., 1987). Hard-bottom habitatssupport numerous species of ascidians, sponges, and soft corals that provide excellent habitat for manydemersal fish species. Trawling causes damage or loss of these epifaunal communities and habitat theyprovide. Recovery rates are relatively slow. Even areas of gravel and boulders suffer substantial long-term damage due to loss of sessile organisms. There are virtually no hard-bottom areas impacted bytrawling in the CCBNEP study area, so impacts to hard-bottom communities will not be consideredfurther.
A.1.2.1. Sediment resuspension
A substantial sediment cloud is generated by turbulence behind trawl doors and may enhance catch ratesby herding fish into the net (Main and Sangster, 1981). Sediment clouds may also contribute

31
significantly to total suspended sediment load of the water column, especially in relatively clear waters.Sediment resuspended by trawling reached up to 10 m above bottom and remained detectable for up toa day over the Mud Patch, a Mid-Atlantic Bight fishing site where sediment composition is > 25% siltand clay (Churchill, 1989). Even in fine sand sediments, sediment clouds may reach 3.0-3.5 m high and4.5-6.0 m wide 50 m behind trawl doors (Main and Sangster, 1981). Contribution of trawling toincreased turbidity varies depending on location and ambient conditions. Churchill (1989) concludedtrawling was the primary initiator of sediment resuspension in the Middle Atlantic Bight at depths of >100 m, but the largest contribution to annual average sediment loads in shallower waters was due tocurrents during January-April storm events.
Total suspended solids immediately behind a shrimp trawl working in Corpus Christi Bay have beenestimated to be more than 5000 mg l-1 if disturbed sediments were uniformly distributed throughout thewater column (Schubel et al., 1978). However, observed suspended sediment concentrations rangedfrom 100 to 500 mg l-1 in the top 2 m of the water column at a distance of 100 m behind a shrimp trawl.The discrepancy between estimated and observed values is due to a lack of initial uniform distribution ofsuspended material and to rapid settling of heavier particles. Aerial photographs of bays in theCCBNEP study area regularly show substantial sediment plumes behind working shrimp trawlers(Schubel et al., 1978).
A.1.2.2. Impacts on benthic habitats
Physical damage to soft-bottom habitats has been well documented. Otter doors plow a distinct groovealong the sea floor that can vary from a few cm up to 0.3 m deep. In addition, tickler chains betweenthe otter doors may skim off the sediment surface (Jones, 1992; Krost et al., 1990). Depth of impactvaries with sediment structure and is deepest in soft mud. A recent study by Schwinghamer et al.(1996), using high resolution acoustics, showed substantial changes in sediment structure to a depth ofat least 4.5 cm over the entire area traversed by an otter trawl towed over a hard-packed sandy bottom.Disturbance to greater depths might be expected in silt and clay sediments of the CCBNEP study area.This could be as deep as 30 cm (Jones, 1992; Krost et al., 1990), but Schubel et al. (1978) estimateddisturbance depths to be only about 5 cm in Corpus Christi Bay. Using data for shrimping effort from1975, they estimated that between 25 x 106 and 209 x 106 m3 of in-place sediment are disturbed byshrimp trawling each year.
Rate of physical recovery of sea beds after disturbance varies in relation to sediment structure andenergy level (i.e., tides, waves, and currents) in the environment. Tracks left by trawl doors disappearin as short as a few hours on relatively high-energy sandy bottoms, but may persist as long as five yearsin low-energy areas with a sandy-mud bottom (Krost et al., 1990). Another critical factor regulatingrecovery rate of sediment structure is recurrence of disturbance. Even where the relative amount offishing effort is known, it is difficult to determine exactly how often a particular parcel of bottom isdisturbed because trawling effort is not uniformly distributed (Messieh et al., 1991). In heavily fishedareas of the open ocean, area disturbed by trawls can be substantial. Caddy (1973) estimated 3-7% ofthe sea floor in Chaleur Bay, Gulf of St. Lawrence was disturbed annually by otter trawls and 21% ofthe sea floor of Georges Bank (7700 km2) was swept annually by scallop dredges. In a more extremeexample, Floderus and Pihl (1990) estimated that in a 1300 km2 area of

32
the Kattegat Sea, in the eastern North Atlantic, mean time of recurrence of otter trawl disturbance was28 days. Rate of recurring disturbance can have a significant biological effect, because it affects rate ofrecovery.
A.1.2.3. Direct impacts on benthic and epibenthic organisms
There are extensive studies on direct physical effects of bottom fishing on both epibenthic and infaunalorganisms from regions outside the CCBNEP study area, primarily in oceanic rather than estuarinehabitats. Other potential effects often ascribed to bottom fishing gear, such as modifications tomicrobial activity, resuspension and remobilization of contaminants, and increase on the benthic/pelagicnutrient flux have received little experimental attention. Direct impacts of sediment resuspension due totrawling activities have not been investigated but implications can be derived from studies of natural andother anthropogenic sources of sediment resuspension. A general discussion of turbidity follows insection A.5.
The most obvious impacts are seen on large organisms associated with hard-bottom habitats. Impactson smaller, soft-bodied organisms, especially in soft-bottom habitats, are less clear. There are fewstudies of effects of trawling on soft-bottom communities. It is often difficult to distinguish fishingeffects from natural variation in time and space (Dayton et al., 1995). Furthermore, fishing disturbanceshave been occurring for many decades, or even centuries, so the original nature of many of these bottomcommunities is unknown. Long-term data available for portions of the German Bight indicate a shift inabundance from molluscs and crustaceans to polychaetes has taken place since the 1920's (Messieh etal., 1991). However, long-term, pre-fishing observations are rare.
Theoretical considerations suggest deep-water communities may be more at risk than shallow-watercommunities. Deep-water communities are often characterized by animals with slow growth, extremelongevity, delayed maturation, and low mortality (Dayton et al., 1995), all of which contribute to lowrecovery rates. Organisms from shallow-water communities generally have life-history strategiesadapted to more frequent disturbance (e.g., large ranges in salinity and temperature, and storms).Therefore, shallow-water communities may recover more rapidly. Small-scale or short-perioddisturbance events may increase diversity of functional groups (Hall et al., 1994), but chronicdisturbance has substantially different effects. Recurrent and large-scale trawling activities that removesurface dwelling organisms and modify surface topography will likely reduce heterogeneity of thebenthic community and result in development of short-lived deposit-feeding associations, effectivelyreducing functional diversity (Dayton et al., 1995).
Results of experimental studies of trawling effects on soft-bottom benthos demonstrate the issue iscomplex and dependent on both the community present and fishing methods and intensity. Sedimentstructure and environmental conditions may influence impact of a disturbance. Trawling with heavytickler chains damaged Subularia worm tubes and other fragile projecting structures, but there was littledamage to benthic species preyed on by fish (Graham, 1955). For example, detrimental effects onbenthic communities can be detected on stable sediments, but not mobile sediments (Kaiser andSpencer, 1996). Brylinski et al. (1994) found only minor impacts to an intertidal benthic communitydue to flounder trawling in the Bay of Fundy. Van Dolah et al. (1991) could find no

33
differences in abundance, diversity, or species composition of benthic infaunal assemblages due toshrimp trawling in a South Carolina estuary. Conversely, Thrush et al. (1995) found experimentalscallop dredging produced significant changes in benthic community structure, despite the benthicassemblage being dominated by small, short-lived species prior to dredging. They further argued thattheir assessment of impacts was “quite conservative” because commercial fishing occurs over a muchlarger area than that studied and repeated fishing occurs over the same area of seabed on any one trip,producing higher levels of disturbance than experimental fishing. Changes in sediment structure havebeen detected, even in cases where no significant impact on benthos was demonstrated (Schwinghameret al., 1996). Trawl-induced changes in sediment structure will reduce structural and dynamicunpredictability, or chaos, which may result in a reduction of material and energy transfer within thesystem. This may result in long-term changes in ecosystem function even when immediate changes incommunity structure cannot be demonstrated (Schwinghamer et al., 1996). Furthermore, it is oftendifficult to extrapolate results of a small-scale, short-term study to large-scale, long-term impacts(Thrush et al., 1995).
The power to detect significant differences between treatment effects in experimental fishing studies wasgenerally not considered in studies where no effect was found (Thrush et al., 1996). Dayton et al.(1996) argue that managers and others evaluating trawling impacts should pay more attention topotential impacts of Type II errors, or failure to find differences among treatments when differencesactually exists. Studies that report no treatment effect may have not detected the effect because of smallsample size or poor experimental design. The consequence of ignoring Type II errors (e.g., continuedfishing at the same level or in the same manner when it is actually having an impact) can include loss ofa resource and serious ecosystem effects (Dayton et al., 1996).
A.1.2.4. Ecological impacts of bycatch
There are multiple biological and ecological effects due to shrimp trawl bycatch, but the most obviouseffects are seen in finfish which make up the bulk of bycatch. The only significant impacts of bycatchthat might affect benthos would be through food webs, either through removal of significant predationpressure on benthic organisms or through altered nutrient cycles. Ecosystem level impacts of shrimptrawling due to killing and discarding a wide range of species may range from influencing competitiveinteractions, predator-prey dynamics, and other cascading effects throughout food webs. Kennelly(1995) suggests “consequences of such interactions are difficult to comprehend, let alone quantify, andthere exists very few examinations of such effects”. Up to 55% of finfish and virtually 100% ofcrustacean bycatch sinks to the bottom (Rothlisberg, 1992). As much as 33% of the diet of Australiansand crabs (Portunus pelagicus) is made up of fishes discarded by shrimp trawlers (Wassenberg andHill, 1987) and success of the Australian sand crab fishery may be related to this enhanced food supply(Wassenberg and Hill, 1987). Discarded bycatch that reaches the sea floor is largely consumed bybottom scavengers and detritus feeders (Andrew and Pepperell, 1992), enhancing the detrital food web.Ultimately, this matter enters sediment microbial food webs, and would be recycled to surface water.The microbial loop may be a sink and not source of food for benthos (Pomeroy and Wiebe, 1988).Estimates for rates of bycatch recycling via benthic microbes are unavailable.

34
Sheridan (1984) and Browder (1991) used a theoretical approach to estimate ecosystem level impactsof shrimp trawl bycatch through an energy flow model (Figure III.6). This model contained numerousestimated parameters based largely on information from the eastern Gulf of Mexico, but it serves as aninitial attempt to estimate ecosystem effects. Browder (1991) ran a five-year simulation to estimateimpact of reducing bycatch by 50% and compared results with simulation runs of current baselineconditions where bycatch discard rate is 100%. If a 50% reduction was accomplished by retainingbycatch and removing it from the system, the model predicted that shrimp biomass would decline andnever return to baseline conditions. The decline may have been triggered by an initial decline in high-nitrogen organic material (due to removal of discards from the system) that changed nitrogen cyclingrates. If a 50% reduction were accomplished by the use of BRDs (i.e., bycatch was never caught),shrimp biomass declined initially, but rebounded quickly and grew beyond baseline level. Counter-intuitively, biomass of high-nitrogen material increased substantially over baseline, apparently providingmore food for shrimp populations. Browder’s explanation was that reduction in bycatch mortality leftmore living animals in the system to deposit waste. She suggested living animals contributed more tonutrient recycling by eating, growing, and depositing waste than by dying and being discarded. Thismodel is currently being updated (NMFS 1995) and will be used to reassess the impact of bycatchreduction on shrimp populations as well as other components of the ecosystem.

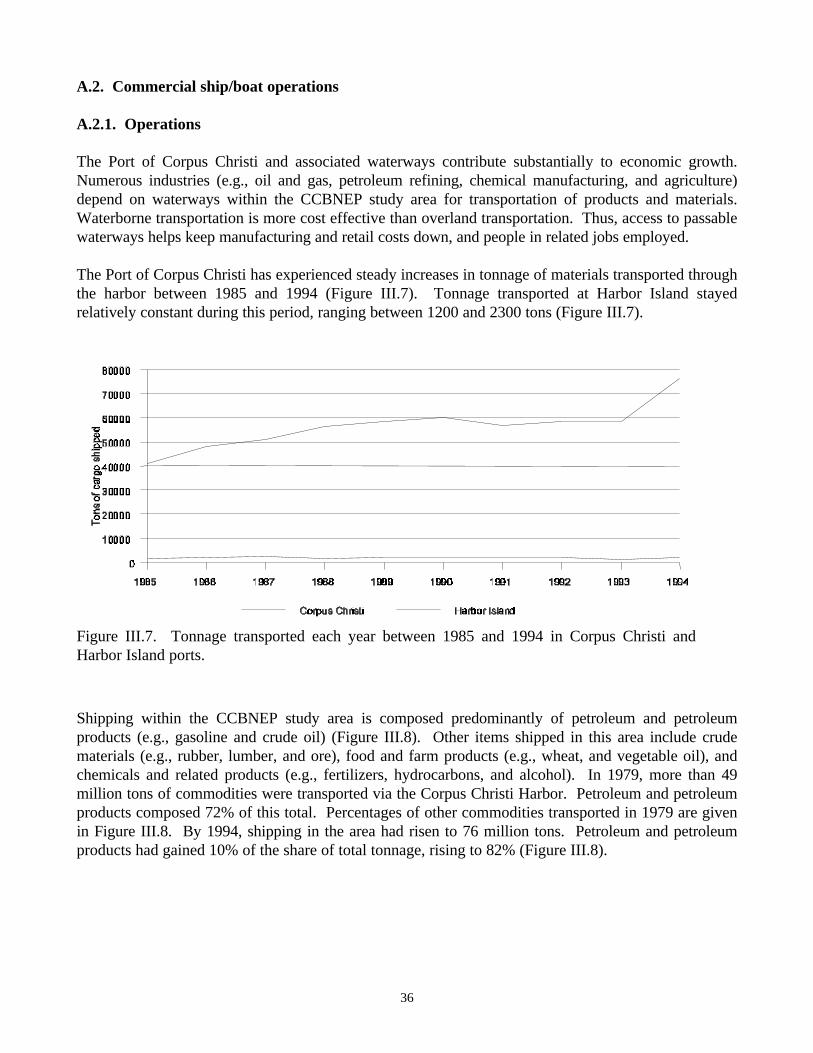
36
A.2. Commercial ship/boat operations
A.2.1. Operations
The Port of Corpus Christi and associated waterways contribute substantially to economic growth.Numerous industries (e.g., oil and gas, petroleum refining, chemical manufacturing, and agriculture)depend on waterways within the CCBNEP study area for transportation of products and materials.Waterborne transportation is more cost effective than overland transportation. Thus, access to passablewaterways helps keep manufacturing and retail costs down, and people in related jobs employed.
The Port of Corpus Christi has experienced steady increases in tonnage of materials transported throughthe harbor between 1985 and 1994 (Figure III.7). Tonnage transported at Harbor Island stayedrelatively constant during this period, ranging between 1200 and 2300 tons (Figure III.7).
Shipping within the CCBNEP study area is composed predominantly of petroleum and petroleumproducts (e.g., gasoline and crude oil) (Figure III.8). Other items shipped in this area include crudematerials (e.g., rubber, lumber, and ore), food and farm products (e.g., wheat, and vegetable oil), andchemicals and related products (e.g., fertilizers, hydrocarbons, and alcohol). In 1979, more than 49million tons of commodities were transported via the Corpus Christi Harbor. Petroleum and petroleumproducts composed 72% of this total. Percentages of other commodities transported in 1979 are givenin Figure III.8. By 1994, shipping in the area had risen to 76 million tons. Petroleum and petroleumproducts had gained 10% of the share of total tonnage, rising to 82% (Figure III.8).
Figure III.7. Tonnage transported each year between 1985 and 1994 in Corpus Christi andHarbor Island ports.


38
A.2.3. Effects of marine construction
Treated lumber, created by pressure-treating wood with toxic compounds of copper, chromium, andarsenic (CCA) has been in widespread use since 1933 (Brooks, 1996). Wood is used to build structuresin and over water to support the marine transportation industry (e.g., pilings, piers, bulkheads, marinas,and docks). However, it has long been known small amounts of these metals leach out of woodenstructures into aquatic environments (Brooks, 1996). These toxic metals accumulate in fine grainedsediment and in benthic animals near the structure (Brooks, 1996; Weis and Weis, 1996).
There are lethal and sublethal effects due to CCA lumber (Weis and Weis, 1996). Benthic infaunaexhibit reduced diversity and species richness in the vicinity of CCA-treated wood structures. The mudsnail (Ilyanassa obsoleta) exhibits a sublethal response in which it retracts into its shell and becomesinactive when exposed to CCA leachates. If snails were placed in clean water they recovered, but aftera few days in water with CCA wood they died. In addition, laboratory studies have demonstratedcopper, chromium and arsenic are trophically transferred metals. Weis and Weis (1996) found “...theextent and severity of effects of pressure treated wood in an estuary depends on the amount and age ofthe wood and the degree of dilution by water movements.” They suggested areas with more CCA-treated wood structures and restricted water flow may permit greater accumulation of contaminants.CCA wood allowed to leach for one month did not deter organism settlement as much as newly placedCCA wood. Wood allowed to leach for two months did not influence community patterns but metalsdid accumulate in animals (Weis and Weis, 1996).
Areas that have naturally occurring epifaunal assemblages can be severely impacted by marinaoperations and boating activities (Turner et al., 1997). There was a loss of cover by abundant andspatially dominant solitary ascidians at sites inside New Zealand marinas. This loss led to open spacethat was increased the cover of sponges, hydroids, erect and encrusting bryozoans, and colonialascidians. The net effect was a total change in community structure of epifauna in marinas.
A computer model was developed to assess environmental risks associated with bulkhead construction(Brooks, 1996). The model is based on known leaching rates and sediment quality criteria developed bythe U.S. Environmental Protection Agency (EPA). The model predicts most projects constructed inwell flushed bodies of water will not have severe impacts. However, exceeding regulatory levels willoccur in closed bodies of water, where circulation is poor, or where the surface of CCA-treated woodis significant in proportion to the water body (Brooks, 1996). In general, water circulation in theCCBNEP study is poor because of the microtidal (< 1 m) range of tides in the area. This implies caremust be taken in engineering marine construction in the CCBNEP area.

39
A.3. Dredging
A.3.1. Dredging activities
Dredging is mechanical removal of sediment to maintain or create a navigable waterway or harbor.Accumulation of sediment in existing channels is a natural process. The COE conducts regularmaintenance dredging to remove accumulated sediment. In particular, the COE is responsible forconstruction and maintenance dredging of the Corpus Christi Ship Channel and GIWW. The COE isalso responsible for permitting private dredge and fill-related activities. Examples of private dredgingactivities include dredging residential canals and access channels to oil and gas production sites.
In addition to purposeful channel and canal dredging, inadvertent (or accidental) channelization mayoccur. For example, a barge may run aground in shallow water, “plowing” through sediment.Accidental groundings occur due to high winds, mechanical failures, negligence, or miscalculation ofwater depth or tidal cycle. Another example is running boat propellers through sediment. Bothactivities create disturbances similar to dredging, but on different scales.
Oyster shell dredging was a common practice in bays north of the CCBNEP study area prior to 1980(Ward, 1997). Although there has been commercial oyster shell dredging in the CCBNEP study area inthe past, it is not presently an issue. Shell dredging was active in the CCBNEP study area from 1960 to1969. During these years, between 0.8 - 1 million m3 (1 - 1.3 million yd3) of shell material was dredgedfrom Nueces Bay. Approximately 96,000 m3 (125,000 y3) was dredged from Copano Bay in 1965.(Rollin MacRae, Texas Parks and Wildlife Department, Personal Communication, May, 1997). It isestimated that a total of 18.7 million m3 (24.4 million y3) was dredged from Nueces Bay in this century(Ward, 1997)
The CCBNEP Human Uses Report (Jones et al., 1997) provides a detailed history of the Port of CorpusChristi and the GIWW. It has been estimated a total of 262 million m3 (343 million yd3)of dredgematerial has been removed from or redistributed within the CCBNEP study area since 1945. However,this does not reflect initial amounts dredged for creation of the GIWW in the early 1940's or the CorpusChristi Channel in 1926. It also does not reflect private dredging. Because initial dredging includedlarge amounts of sediment, the historic trend, in cubic yards of sediment removed, has declined between1946 and 1992 (Figure III.9).
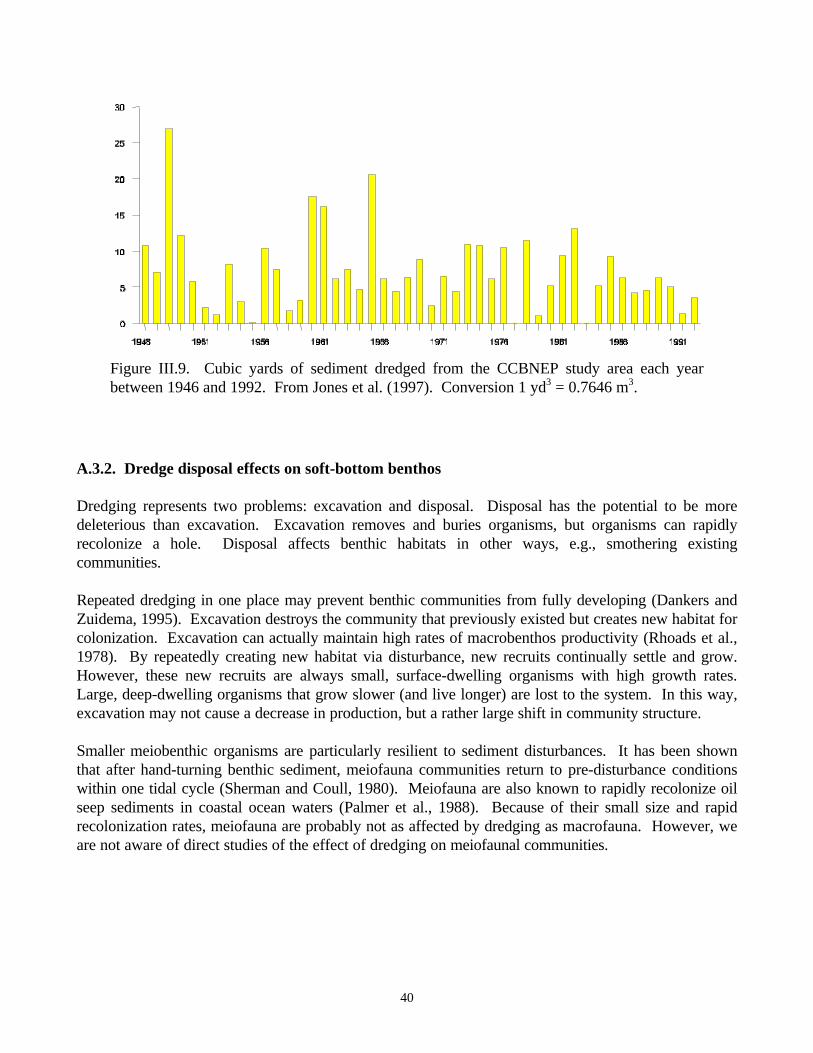
40
A.3.2. Dredge disposal effects on soft-bottom benthos
Dredging represents two problems: excavation and disposal. Disposal has the potential to be moredeleterious than excavation. Excavation removes and buries organisms, but organisms can rapidlyrecolonize a hole. Disposal affects benthic habitats in other ways, e.g., smothering existingcommunities.
Repeated dredging in one place may prevent benthic communities from fully developing (Dankers andZuidema, 1995). Excavation destroys the community that previously existed but creates new habitat forcolonization. Excavation can actually maintain high rates of macrobenthos productivity (Rhoads et al.,1978). By repeatedly creating new habitat via disturbance, new recruits continually settle and grow.However, these new recruits are always small, surface-dwelling organisms with high growth rates.Large, deep-dwelling organisms that grow slower (and live longer) are lost to the system. In this way,excavation may not cause a decrease in production, but a rather large shift in community structure.
Smaller meiobenthic organisms are particularly resilient to sediment disturbances. It has been shownthat after hand-turning benthic sediment, meiofauna communities return to pre-disturbance conditionswithin one tidal cycle (Sherman and Coull, 1980). Meiofauna are also known to rapidly recolonize oilseep sediments in coastal ocean waters (Palmer et al., 1988). Because of their small size and rapidrecolonization rates, meiofauna are probably not as affected by dredging as macrofauna. However, weare not aware of direct studies of the effect of dredging on meiofaunal communities.
Figure III.9. Cubic yards of sediment dredged from the CCBNEP study area each yearbetween 1946 and 1992. From Jones et al. (1997). Conversion 1 yd3 = 0.7646 m3.
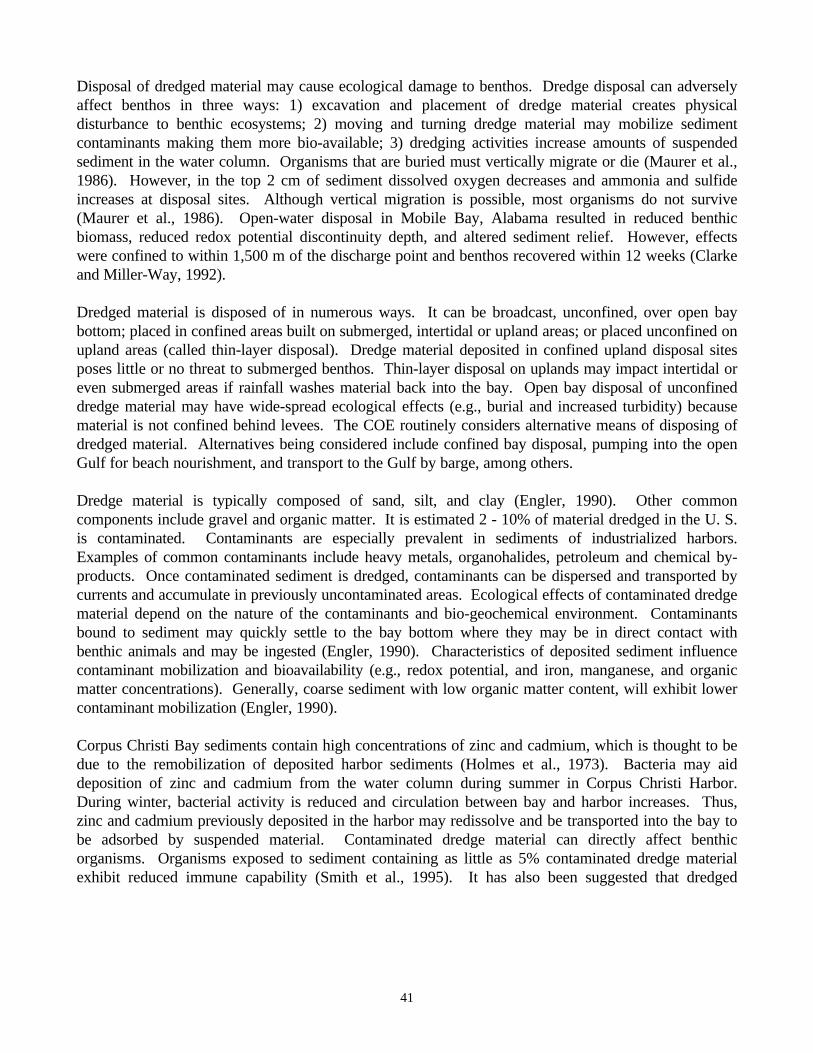
41
Disposal of dredged material may cause ecological damage to benthos. Dredge disposal can adverselyaffect benthos in three ways: 1) excavation and placement of dredge material creates physicaldisturbance to benthic ecosystems; 2) moving and turning dredge material may mobilize sedimentcontaminants making them more bio-available; 3) dredging activities increase amounts of suspendedsediment in the water column. Organisms that are buried must vertically migrate or die (Maurer et al.,1986). However, in the top 2 cm of sediment dissolved oxygen decreases and ammonia and sulfideincreases at disposal sites. Although vertical migration is possible, most organisms do not survive(Maurer et al., 1986). Open-water disposal in Mobile Bay, Alabama resulted in reduced benthicbiomass, reduced redox potential discontinuity depth, and altered sediment relief. However, effectswere confined to within 1,500 m of the discharge point and benthos recovered within 12 weeks (Clarkeand Miller-Way, 1992).
Dredged material is disposed of in numerous ways. It can be broadcast, unconfined, over open baybottom; placed in confined areas built on submerged, intertidal or upland areas; or placed unconfined onupland areas (called thin-layer disposal). Dredge material deposited in confined upland disposal sitesposes little or no threat to submerged benthos. Thin-layer disposal on uplands may impact intertidal oreven submerged areas if rainfall washes material back into the bay. Open bay disposal of unconfineddredge material may have wide-spread ecological effects (e.g., burial and increased turbidity) becausematerial is not confined behind levees. The COE routinely considers alternative means of disposing ofdredged material. Alternatives being considered include confined bay disposal, pumping into the openGulf for beach nourishment, and transport to the Gulf by barge, among others.
Dredge material is typically composed of sand, silt, and clay (Engler, 1990). Other commoncomponents include gravel and organic matter. It is estimated 2 - 10% of material dredged in the U. S.is contaminated. Contaminants are especially prevalent in sediments of industrialized harbors.Examples of common contaminants include heavy metals, organohalides, petroleum and chemical by-products. Once contaminated sediment is dredged, contaminants can be dispersed and transported bycurrents and accumulate in previously uncontaminated areas. Ecological effects of contaminated dredgematerial depend on the nature of the contaminants and bio-geochemical environment. Contaminantsbound to sediment may quickly settle to the bay bottom where they may be in direct contact withbenthic animals and may be ingested (Engler, 1990). Characteristics of deposited sediment influencecontaminant mobilization and bioavailability (e.g., redox potential, and iron, manganese, and organicmatter concentrations). Generally, coarse sediment with low organic matter content, will exhibit lowercontaminant mobilization (Engler, 1990).
Corpus Christi Bay sediments contain high concentrations of zinc and cadmium, which is thought to bedue to the remobilization of deposited harbor sediments (Holmes et al., 1973). Bacteria may aiddeposition of zinc and cadmium from the water column during summer in Corpus Christi Harbor.During winter, bacterial activity is reduced and circulation between bay and harbor increases. Thus,zinc and cadmium previously deposited in the harbor may redissolve and be transported into the bay tobe adsorbed by suspended material. Contaminated dredge material can directly affect benthicorganisms. Organisms exposed to sediment containing as little as 5% contaminated dredge materialexhibit reduced immune capability (Smith et al., 1995). It has also been suggested that dredged

42
sediment was responsible for high amounts of arsenic, 10-146 ug l-1 (ppb) in surface water and 1-82 mgkg-1 (ppm) in sediments, and was related to toxic responses in eastern oyster, Crassostrea virginica(Wirth, et al., 1996). In addition, contaminated harbor sediment has been shown to impair sea urchinembryonic development (Pinto, et al., 1995).
Dredge material may be used to serve numerous beneficial purposes. For example, it has been used toelevate farmland while providing organically rich soil. It has also been used to create rookery islandsfor colonial water birds. One of the more ecologically important uses of dredged material is wetlandcreation. Companies that adversely impact wetland habitat may mitigate for these losses by creatingnew habitat. In some cases, such mitigation involves use of dredge material to increase elevation of baybottom to a level that will support desired vegetative growth (e.g., seagrasses or marsh grasses). Avery large created wetland has just been built in Galveston Bay with dredged material. The largestengineering challenge to be solved in created wetlands is elevation and creek meanders. An importantfeature of wetlands, to which habitat utilization is directly related, is linear distance of creek edges.Wetlands with straight channels would not provide the same ecological functions as natural meanderingcreeks. Beneficial use of dredge material is a promising approach, but there is a need for betterunderstanding of landscape ecology of wetlands and how to engineer a wetland.
A.3.3. Dredging effects on submerged aquatic vegetation
Dredge and fill activities are widely recognized as one of the major anthropogenic disturbancescontributing to destruction of seagrass meadows. Direct and immediate effect of dredging seagrassmeadows is mortality due to removal or burial. In addition, there are indirect losses resulting fromdisturbance of sediments during dredging operations. Seagrasses have high light requirements (Dunton,1994), and decreased light availability associated with sediment resuspension has been associated withlosses of areal coverage in Laguna Madre (Onuf, 1994). Furthermore, spoil areas are usually notsuitable for colonization and growth of seagrasses (Zieman, 1975a). Dredging may also result inhypoxia by increasing biological oxygen demand as organic material exposed by dredging operationsundergoes decomposition, which in turn can lead to changes in the redox potential of sediments withinmeadows (Zieman, 1975a; Nessmith, 1980). Seagrass meadows may also undergo erosion as a result ofchanges in hydrological conditions due to dredging of navigational channels.
There is evidence that suggests dredging is a causative factor of seagrass loss within the CCBNEP studyarea. Odum (1963) found turtle grass beds near a dredged area in Redfish Bay had low productivityand biomass in spring and summer following initiation of dredging operations in 1959 and attributed itto decreased light penetration. Direct losses of areal coverage as a result of burial were also reported.In 1960, however, productivity rates were exceptionally high (Figure III.10). Amount of chlorophyll a,on a g m-2 basis, was also remarkably low during the immediate post-dredging period when compared tothe following year (Table III.1).
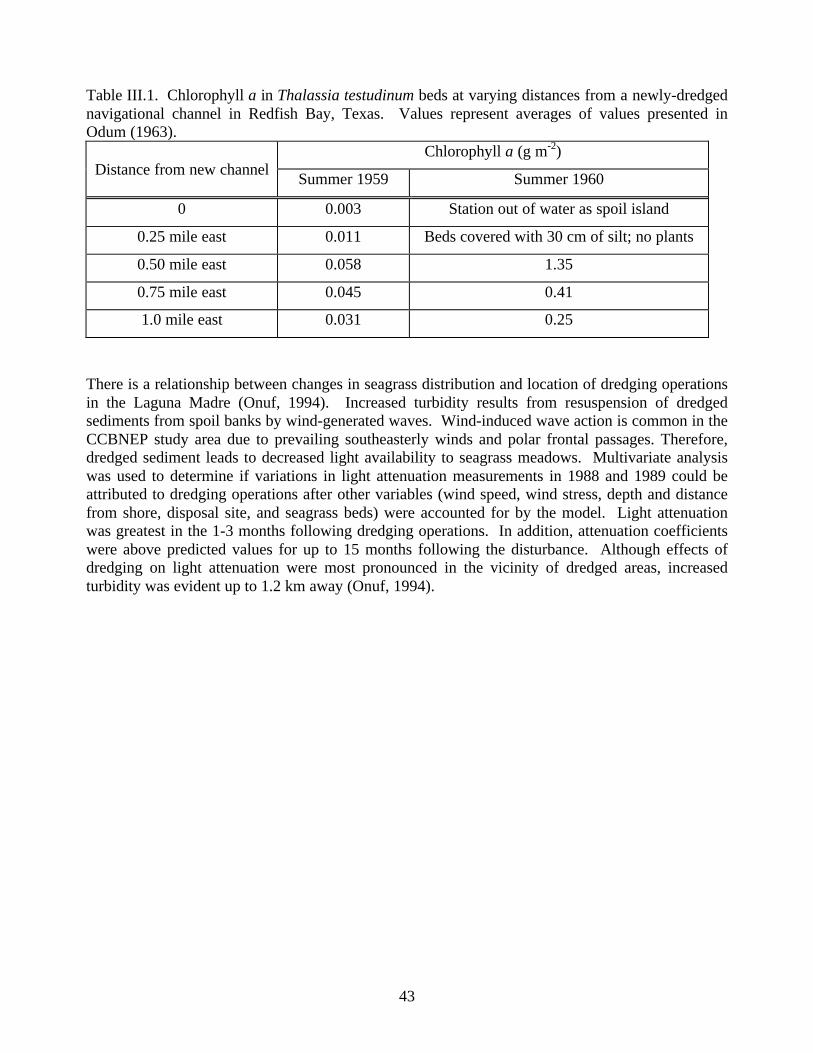
43
Table III.1. Chlorophyll a in Thalassia testudinum beds at varying distances from a newly-dredgednavigational channel in Redfish Bay, Texas. Values represent averages of values presented inOdum (1963).
Chlorophyll a (g m-2)Distance from new channel
Summer 1959 Summer 1960
0 0.003 Station out of water as spoil island
0.25 mile east 0.011 Beds covered with 30 cm of silt; no plants
0.50 mile east 0.058 1.35
0.75 mile east 0.045 0.41
1.0 mile east 0.031 0.25
There is a relationship between changes in seagrass distribution and location of dredging operationsin the Laguna Madre (Onuf, 1994). Increased turbidity results from resuspension of dredgedsediments from spoil banks by wind-generated waves. Wind-induced wave action is common in theCCBNEP study area due to prevailing southeasterly winds and polar frontal passages. Therefore,dredged sediment leads to decreased light availability to seagrass meadows. Multivariate analysiswas used to determine if variations in light attenuation measurements in 1988 and 1989 could beattributed to dredging operations after other variables (wind speed, wind stress, depth and distancefrom shore, disposal site, and seagrass beds) were accounted for by the model. Light attenuationwas greatest in the 1-3 months following dredging operations. In addition, attenuation coefficientswere above predicted values for up to 15 months following the disturbance. Although effects ofdredging on light attenuation were most pronounced in the vicinity of dredged areas, increasedturbidity was evident up to 1.2 km away (Onuf, 1994).


45
extensive seagrass habitats are in Laguna Madre. Smaller, yet still significant, areas of seagrass habitatcan be found in Redfish Bay and along the margins of Corpus Christi and Aransas Bays.
Table III.2. Macrofauna abundances in vegetated habitats. Abundance (individuals m-2) in seagrassbeds adapted from Orth et al. (1984).Location Seagrass Vegetated Unvegetated Source
Florida Thalassia testudinumand Halodule wrightii
33,485 8795 Santos & Simon, 1974
Belize Thalassia testudinum 12,167 6,476
16,7508,000
Young & Young, 1982
Bermuda Thalassia testudinum 13,580 3,145 Orth, 1971
NorthCarolina
Zostera marina 923 170 Thayer et al., 1975
Virginia Zostera marina 51,343 1,771 Orth, 1977
North Sea Zostera noltii 5,088 1,043 Reise, 1978
Florida Thalassia testudinum &Syringodium filiforme
3,185 1,754 Stoner, 1980
Australia Zostera muelleri 1,039 156 Poore, 1982
Florida Thalassia testudinum 1,611 399 Lewis & Stoner, 1983
Florida Thalassia testudinum &Halodule wrightii
17,479 5,844 Virnstein et al., 1983
NorthCarolina
Zostera marina &Halodule wrightii
3,223 720 Summerson & Peterson,1984
Texas Halodule wrightii 63,70026,90036,900
22,20012,70016,300
Conley, 1996
A.4. Recreational boating activities
A.4.1. Boating activities
In 1986, individuals made over 6 million trips to the Texas coast for recreational fishing; 43% of thesewere to the Nueces and Mission-Aransas estuarine systems, while 21% were to the Laguna Madre(Fesenmaier et al., 1987). Since the mid-1970’s, recreational fishing pressure has generally increased inAransas Bay and Corpus Christi Bay, while decreasing in Upper Laguna Madre

46
(Ponwith and Dokken, 1996). Presence of recreational boats in the CCBNEP study area is ubiqutous inspace and time, because of shallow water habitats for fishing and mild climate.
A.4.2. Effects of recreational boating on benthic habitats
There is little evidence that recreational boating has any significant impact on open-bay bottoms, but thenegative impact of recreational boating activities on seagrass habitats are well documented in Floridaand the northeastern Gulf of Mexico (Phillips, 1960; Zieman, 1976; Eleuterius, 1987). Recreationalboating activity causes direct damage to seagrasses through physical destruction of seagrass leaves andbelow-ground tissues (roots and rhizomes) by boat propellers. Prop scars tend to occur in areas with <1 m (3.2') depth at low tide (Zieman, 1976), and are readily visible in seagrass beds from the watersurface and through low altitude aerial photography. Eleuterius (1987) indicated that once a propellerscar is created, wave action leads to erosion within the channel resulting in scouring and deepening ofthe disturbed area. Similarly, Zieman (1976) reported reduced proportions of fine sediments withinpropeller scars.
Long-term effects of propeller scarring are a function of extent of disturbance and species impacted.There are five seagrass species in the Texas coast: shoal grass (Halodule wrightii), turtle grass, widgeongrass (Ruppia maritima), manatee grass (Syringodium filiforme) and clover grass (Halophilaengelmanii). Seagrass recolonization rates vary depending on the ecological role of the species. Shoalgrass is considered a pioneer species and is a rapid recolonizer of disturbed areas; this capability isattributed to a rapidly growing root and rhizome system. Widgeon grass and manatee grass are alsocharacterized by less developed rhizome systems; therefore, colonizing abilities are similar to those ofshoal grass. In contrast, turtle grass is a mature successional, or climax species, characterized byextensive root and rhizome systems that can comprise up to 85% of total plant biomass. Although leafproduction rates for turtle grass are usually very high (500-1000 g dry wt m-2 yr-1), growth rates ofbelow-ground tissues are very slow.
Rates for seagrass recolonization vary by species. Turtle grass did not recolonize denuded plots 10months after disturbance (Phillips, 1960). In contrast, shoal grass quickly invaded bare plots.Recolonization rates of turtle grass in prop scars in south Florida and found two-years were necessarybefore recolonization began and recovery took between three to five years (Zieman, 1976). The slowrecolonizing ability of turtle grass was attributed to slow rhizome growth and potentially unsuitableenvironment for growth in the disturbed area. In an experimental study where 0.25 m (10") widechannels were dug within seagrass beds in Florida, recolonization to normal shoot densities occurred0.9 - 1.8 years for shoal grass and 3.6 - 6.4 years for turtle grass (Durako et al., 1992). Although shoalgrass to recolonization was quicker, recolonization at sparse edges of beds was slower (2.3 - 4.6 years).
The fraction of seagrass habitat impacted by prop scarring can be quantified through analysis of lowaltitude aerial photographs (scales of 1:2,400 to 1:24,000). In Florida, it is estimated 173,000 acres(70,000 ha) of the 2.7 million acres (1.09 million ha) of seagrass coverage is lightly to severely scarred(Sargent et al., 1995, Table III.3).

47
Table III.3. Acreage of scarred seagrasses in each region of Florida. Light scarring is < 5 % of the areawithin a sample polygon, moderate scarring is 5 - 20 %, and severe scarring is > 20 % (Sargent et al.,1991).Region Total
SeagrassLight
ScarringModerateScarring
SevereScarring
TotalScarring
Panhandle 48,170 9,970 2,090 200 12,260
Big Bend 826,770 58,630 6,180 540 65,350
Gulf Peninsula 110,260 16,140 21,330 4,580 42,050
Atlantic Peninsula 69,360 250 3,030 490 3,770
South Florida 1,603,700 19,270 15,990 9,650 44,910
The project in Florida was large, to determine the extent of seagrass and propeller scar coverage in theentire Florida coast. Therefore, analysis was based on large scale aerial photography (1:24,000). At thescale of 1:24,000 < 1 % of the propeller scars, which can be identified at a scale of 1:2,400, arerecognized. Therefore, extent of scarring in Florida is underestimated by one to two orders ofmagnitude (Sargent el al., 1991).
Few data exist regarding extent of prop scarring of seagrass beds within the CCBNEP study area. Aspart of the current report, data regarding the areal extent of seagrass coverage and propeller scarringwithin the CCBNEP study area were collected in winter 1996-1997. Extent of areal coverage ofpropeller scars and seagrass habitat was determined from aerial photography at a scale of 1:2,400.Estes Flats, near Rockport, has the greatest area impacted in the CCBNEP study area. Complete detailsof the study are found in Volume II.
A.5 Effects of turbidity from anthropogenic sources
Coastal and estuarine waters often have relatively high turbidity due to sediment load from terrestrialrunoff and subsequent resuspension of those sediments by winds, tides, and currents. Variousanthropogenic factors, especially shrimp trawling and dredge disposal, can produce significantsuspended sediments loads resulting in very high local turbidities. Natural variations in turbidity cansubstantially influence distribution of estuarine fishes (Cyrus and Blabler, 1992), even though manyspecies are adapted to variable or even consistently high turbidity levels. Few effects of turbidity oneggs or larvae were demonstrated in laboratory studies during short-term experiments. Savino et al.(1994) exposed lake herring (Coregonus artedi) eggs and larvae to 20 - 24 mg l-l (ppm) turbidity typicalof shipping activity in the Great Lakes. Jokiel (1989) exposed eggs or larvae of or mahimahi(Coryphaena hippurus) to test levels as high as 8000 mg l-l (ppm), whereas 5 - 50 mg l-l (ppm) turbidityis typical of marine mining activities near Hawaii. High suspended sediment levels > 1000 mg l-l (ppm)severely impacted feeding rate of mahimahi, indicating potential long term impacts of high suspendedsediment loads. Jokiel (1989), working on dredge spoil disposal plumes in Hawaii, suggested larvaewere rarely subjected to suspended sediment loads > 1 mg l-l (ppm), because higher

48
levels were quickly diluted by currents or settled out of suspension. Data of Schubel et al. (1978)indicates fine sediments of bays in the CCBNEP study area may remain in suspension much longer,increasing potential impacts on larval fish. Eventual settlement of resuspended sediments can havesignificant impacts on benthos, especially in areas of relatively clear water. As little as 1 mm (0.04") ofsilt has been shown to inhibit settlement of oysters (Galsoff, 1964) and scallop (Stevens, 1987) larvae.Even small resuspension levels evoked by deposit-feeding polychaetes can inhibit suspension feedingmolluscs (Rhoads, 1973).
A.6 Effects of hydrocarbon exploration and production
Bay bottoms in the CCBNEP study are utilized for hydrocarbon exploration and production.Exploration activities include anthropogenic disturbances associated with maritime traffic, drilling andseismic testing. Production activities that could cause environment disturbances include drilling, marineconstruction, maritime traffic, produced waters, and product transportation. Modes of producttransportation includes pipeline construction, pumping, and maritime ship and barge traffic.
Many studies have addressed effects of offshore oil and gas development activities on continentalshelves, and especially in the Gulf of Mexico. The Gulf of Mexico is responsible for 95% of all offshoreoil and gas production in the United States. Long-term effects of offshore oil and gas activities havebeen reviewed by Boesch and Rabalais (1987). Concerns and issues related to these activities include:1) chronic biological effects from persistent hydrocarbons in sediment; 2) residual damage form oil spillson coastal wetland, reefs, and vegetated habitats; 3) effects of channelization for pipeline routing andnavigation in coastal wetlands; 4) physical fouling of birds, mammals and turtles; 5) cumulative effectson benthos through field development rather than exploratory drilling; 6) effects of produced waterdischarges into nearshore rather than shelf environments; 7) effects of noise disturbance on birds,mammals and turtles; 8) reduction of fishery stocks due to egg and larval mortality during oil spills; and9) effects artificial islands. Note two of these concerns deal directly with estuaries even though the listwas developed for offshore environments. All issues listed are also concerns in shallow waterecosystems.
Blasts for seismic testing during exploration disturbs bay bottom habitats. Although no formal studieshave been found, Chris Onuf (U.S. Geological Survey) has inspected seismic holes in Upper LagunaMadre. Onuf reports (via personal communication) blasts create circular holes in sediments with araised lip on the outside. The center is excavated to a depth of about 4 m (13'). After one year, threeholes were revisited. One hole was completely refilled and seagrass had overgrown the hole. Twoother holes had an identifiable 10 cm (4") deep depression, which was filled with dead drift material.The dead material retards re-establishment of seagrasses. The total effect of seismic testing would be afunction of density of test holes. At this time, insufficient data exists to assess effects of seismic testing.However, testing in seagrass habitats would be of greatest concern.
Exploratory and production drilling generates drill cuttings. Drill cuttings contain oil- or water-baseddrill mud lubricants and minerals from deposits. Cuttings are a source of hydrocarbons when oil-baseddrill mud is used and trace metals when water-based muds are used. Studies on effects of oil or gasplatforms in the CCBNEP study area have not been found. However, it is known that

49
platforms in the Gulf of Mexico directly offshore of the CCBNEP study area are contaminated withtrace metals (Kennicutt et al., 1996) and benthic organisms are negatively affected within a 100 m (328')radius around the platform (Montagna and Harper, 1996).
Produced water discharges are sources of brines and hydrocarbons. A separator platform was studiedin Trinity Bay, Texas (Armstrong et al., 1979; Carr et al., 1996). Oil field brine effluent at this site wasresponsible for sediment contaminated with hydrocarbons and that were toxic to sea urchin embryos. Aproduced water discharge in New Bayou, Texas was found to depress macrobenthic populations 107 m(350') downstream and 46 m (150') upstream (Nance, 1991). Produced waters can be especiallyharmful to rich seagrass habitats. Thalassia testudinum was not affected by experimental exposures toproduced water, but benthic invertebrate populations were depressed (Weber et al., 1992). Thephysical disturbance related to greater turbidity and sedimentation reduced light, which causes lowerproductivity, whereas toxicity causes declines in plant and animal epiphytes (Kelly et al., 1987).
Produced waters have been discharged into Nueces Bay since the turn of the century (D’Unger et al.,1996). As recently as 1995, a total of 16 water discharge sites were producing 2,477,426 l d-1 (654,538gal d-1) in Nueces Bay and Nueces River Tidal areas (Caudle, 1995). The effluents were toxic as weresediments near the discharges (D’Unger et al., 1996). Produced water in Nueces Bay is characterizedby low dissolved oxygen and high salinity and temperature, relative to receiving water (Caudle, 1995).In addition, produced water contained high amounts of toxic ammonia, trace metals, aromatichydrocarbons, oil, and grease. The contaminants result in degraded valuable habitats and biologicalcommunties of Nueces Bay.
Transportation of hydrocarbon products poses the greatest environmental risks (Boesch and Rabalais,1987). There is potential for spills when hydrocarbon products are moved. Since 1984, there havebeen at least two major spills: an oil pipeline break in Nueces Bay and a cumene spill from a bargecollision in the Corpus Christi Ship Channel near Ingleside. Oil spills are especially devastating tovaluable vegetated habitats (Levings and Garrity, 1994; Wood et al., 1997) and beaches (Amos et al.,1983).
Pipeline construction in vegetated habitats is another source of concern. Plants can recover due toclonal growth as well as seed production. Salt marshes in South Carolina recovered from pipelineconstruction in 34 to 36 months. Seagrasses in Upper Laguna Madre may take 14 to 17 years to fullyrecover ecological functions after a construction project (Montagna, 1993).
A.7 Kills and spills
An indicator of potential disturbance to bay bottoms is reports by the public of fish and wildlife kills andpollution. The TPWD, Resource Protection Division, Kills and Spills Team maintains a data base onreports of fish and wildlife kills and pollution complaints and incidents. The program is popularlyknown for its “kills and spills” hotline, which receives complaints from the public. People can reportkills and spills to the 24-hour TPWD law enforcement dispatcher at (512) 389-4848, or call any localgame warden, or one of the regional offices (during business hours). The regional

50
biologist for the Corpus Christi area is Ken Rice at (512) 980-3245. The data base contains about4,000 records dating back to 1969. The following data was prepared for the CCBNEP study area byCynthia H. Contreras (TPWD). The data base was queried for fish and wildlife kills and pollutioncomplaints in aquatic environments of the CCBNEP study area. Causes of kills and pollutioncomplaints included: diseases, inorganic compounds, low dissolved oxygen, organic compoundsphysical damage, scum, solid waste, low temperature and other unknown environmental conditions.Spatial segments in the database are based on Texas Natural Resource Conservation Commissiongeographical classifications (Figure III.11). Although reported together, kills and spills are different.
Nueces Estuary (Nueces Bay, Corpus Christi Bay, Corpus Christi Inner Harbor, and Redfish Bay) hadthe highest number (58.1%) of 458 reports from 1969 to 1997 in the CCBNEP study area (FigureIII.11). Mission-Aransas Estuary (Copano Bay, St. Charles Bay, and Aransas Bay) had 26.4% ofreports, and Upper Laguna Madre and Baffin Bay had only 15.5% of reports. In the TNRCC system,Baffin Bay includes the tertiary bays: Alazan, Laguna Salada, and Cayo del Grullo. The number ofreports correlates with population density along the shorelines of the three estuaries in the CCBNEPstudy area.
Trends of kills and spills reports increased dramatically in the early 1980's and has since remainedrelatively constant (Figure III.12). There was a spike of increased reports in 1992 and 1993, butrecently reports have remained at levels similar to the 1980's. There has been an average of 23 annualreports of spills and kills in the CCBNEP study area since 1980. Most of these incidences can affectwater column habitats, but can affect bay bottom habitats as well.
Figure III.11. Reports of kills and spills in bays of theCCBNEP study area. Data provided by Cindy Contreras(TPWD).

51
Figure III.12. Total number of kills and spills incidents reported annually in the CCBNEP study area.Data from Cindy Contreras (TPWD).
B. Status and Trends of Natural Disturbances
B.1. Episodic events
B.1.1 Hydrographic setting
Texas bays are typically lagoonal embayments with limited access to Gulf waters. Morphology andhydrodynamics of bays plays a significant role in response of estuarine embayments to naturaldisturbances, such as storms and floods, which in turn influence salinity, turbidity and siltation regimes.The following summary of hydrodynamic characteristics of Gulf of Mexico estuaries, as applicable tothe CCBNEP study area, is adapted from a review by Ward (1980, 1997). A brief discussion of thefactors that influence estuarine circulation is also included.
Gulf of Mexico bay systems, including the Mission-Aransas, Nueces and Laguna Madre Estuaries, arenaturally broad and shallow with maximum depths of < 5 m (16 ft). However, dredged navigationchannels 10 - 12 m (33 - 39 ft) in depth and 50 - 150 m (164 - 492 ft) in width transverse the bays.Access to Gulf waters is limited to narrow inlets.
Freshwater inflow is greatest toward the central area of the Gulf coast (Table III.4). Mean discharge toMobile Bay is 1820 m3 s-1 (65,000 cfs), while Corpus Christi Bay receives only 25 m3 s-1 (893 cfs).Discharge per unit watershed area (Q/DA), an indicator of aridity, is 2 cm y-1 (0.75 in y-1) for CorpusChristi Bay, compared to 41 and 50 cm yr 1 (16 - 20 in y-1) for Pensacola and Mobile Bays, respectively.Likewise, the ratio of bay volume to discharge (V/Q) is a rough descriptor of the

52
influence of freshwater inflow into a bay; Corpus Christi Bay has a comparatively high value of 620days.
Table III.4. Physical and hydrological characteristics of selected Gulf of Mexico bays. Adapted fromWard (1980). Conversions: mile = 1.609 km, ft3 = 0.028 m3, mi2 = km2, 1 in = 2.54 cm.Bay Surface
Area(km2)
Volume
(106 m3)
MeanDischargeQ (m3 s 1)
DrainageArea
DA (km2)
Q/DA*
(cm yr 1)
V/Q**
(days)Tampa 880 2900 40 5800 22 800
Pensacola 265 840 300 22900 41 30
Mobile 1020 3060 1820 114000 50 20
Sabine Lake 240 440 490 48900 32 10
Galveston 1420 4300 275 56500 15 180
Matagorda 1070 3300 115 121900 10 1750
CorpusChristi
435 1340 25 41100 2 620
*Discharge per unit watershed area.**Bay volume to discharge ratio.
Four primary factors governing bay hydrography are: meteorological forcing, tides, freshwater inflow,and density currents. Density currents are average currents from bay-mouth to bay-head resulting froma salinity gradient along an estuary. The single most important factor influencing bay circulation in Gulfestuaries is meteorological forcing (Ward, 1980). Importance of meteorological forcing is attributed tothe relatively small influence of tides. The tidal range is typically 0.3 - 0.7 m (1' - 2') and large surfacearea to volume ratios of Gulf estuaries (Table III.4). Large bay surface area translates into a long fetch,which is conducive to formation of large wind-driven waves that induce mixing of surface and bottomwaters as well as erosion. The Azores-Bermuda High Pressure Zone is responsible for prevailingonshore southeasterly winds during most of the year. In late summer and early fall, the western Gulfregion (including the CCBNEP study area) is subjected to tropical disturbances that usually lead tohighest rainfall periods of the year. During winter, and to a lesser extent during spring and fall seasons,weakening of the Bermuda High renders the Gulf region more susceptible to northern frontal systems(fronts) resulting from mid-latitude westerlies.
Freshwater inflow to Gulf estuaries is variable within and between years. Inflow tends to be higherduring late summer and early fall due to tropical disturbances. Excluding sporadic events such ashurricanes and floods, freshwater inflow to arid regions such as the CCBNEP study area is limited andnot usually capable of driving significant currents within an estuary. Nevertheless, input of freshwaterto the system affects estuarine salinity gradients and is responsible for formation of density currents.Because intensity of density currents varies as a function of depth cubed, presence
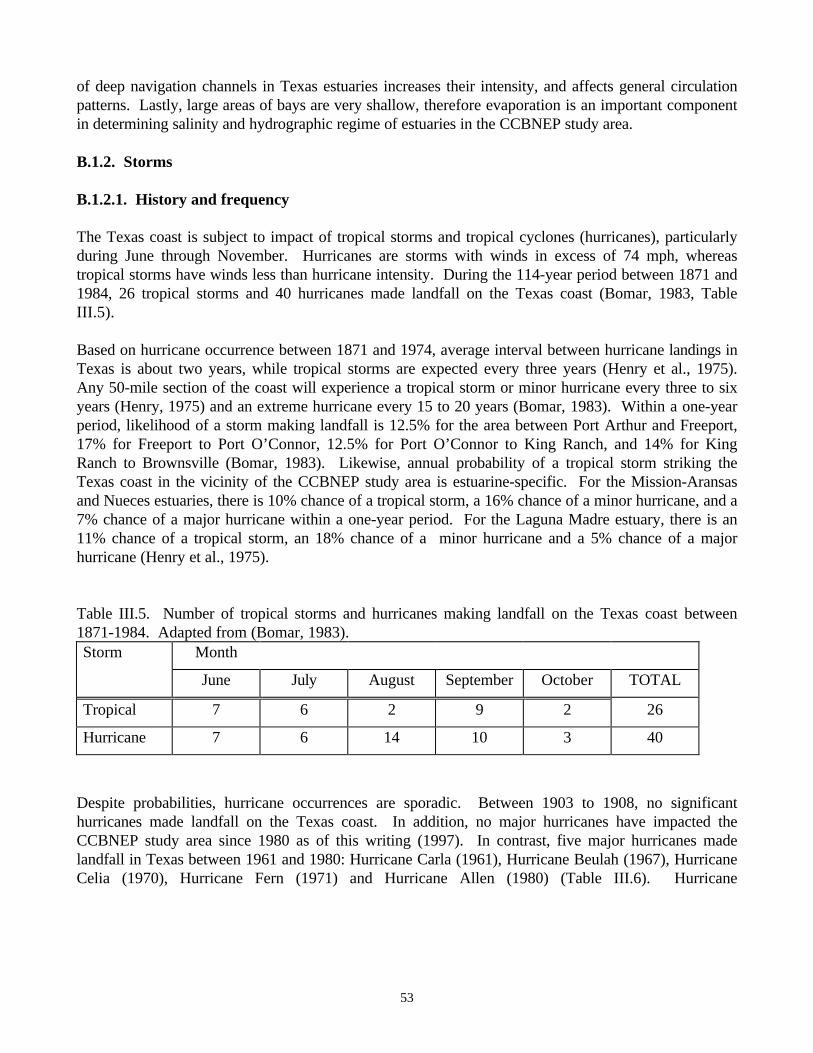
53
of deep navigation channels in Texas estuaries increases their intensity, and affects general circulationpatterns. Lastly, large areas of bays are very shallow, therefore evaporation is an important componentin determining salinity and hydrographic regime of estuaries in the CCBNEP study area.
B.1.2. Storms
B.1.2.1. History and frequency
The Texas coast is subject to impact of tropical storms and tropical cyclones (hurricanes), particularlyduring June through November. Hurricanes are storms with winds in excess of 74 mph, whereastropical storms have winds less than hurricane intensity. During the 114-year period between 1871 and1984, 26 tropical storms and 40 hurricanes made landfall on the Texas coast (Bomar, 1983, TableIII.5).
Based on hurricane occurrence between 1871 and 1974, average interval between hurricane landings inTexas is about two years, while tropical storms are expected every three years (Henry et al., 1975).Any 50-mile section of the coast will experience a tropical storm or minor hurricane every three to sixyears (Henry, 1975) and an extreme hurricane every 15 to 20 years (Bomar, 1983). Within a one-yearperiod, likelihood of a storm making landfall is 12.5% for the area between Port Arthur and Freeport,17% for Freeport to Port O’Connor, 12.5% for Port O’Connor to King Ranch, and 14% for KingRanch to Brownsville (Bomar, 1983). Likewise, annual probability of a tropical storm striking theTexas coast in the vicinity of the CCBNEP study area is estuarine-specific. For the Mission-Aransasand Nueces estuaries, there is 10% chance of a tropical storm, a 16% chance of a minor hurricane, and a7% chance of a major hurricane within a one-year period. For the Laguna Madre estuary, there is an11% chance of a tropical storm, an 18% chance of a minor hurricane and a 5% chance of a majorhurricane (Henry et al., 1975).
Table III.5. Number of tropical storms and hurricanes making landfall on the Texas coast between1871-1984. Adapted from (Bomar, 1983).Storm Month
June July August September October TOTAL
Tropical 7 6 2 9 2 26
Hurricane 7 6 14 10 3 40
Despite probabilities, hurricane occurrences are sporadic. Between 1903 to 1908, no significanthurricanes made landfall on the Texas coast. In addition, no major hurricanes have impacted theCCBNEP study area since 1980 as of this writing (1997). In contrast, five major hurricanes madelandfall in Texas between 1961 and 1980: Hurricane Carla (1961), Hurricane Beulah (1967), HurricaneCelia (1970), Hurricane Fern (1971) and Hurricane Allen (1980) (Table III.6). Hurricane
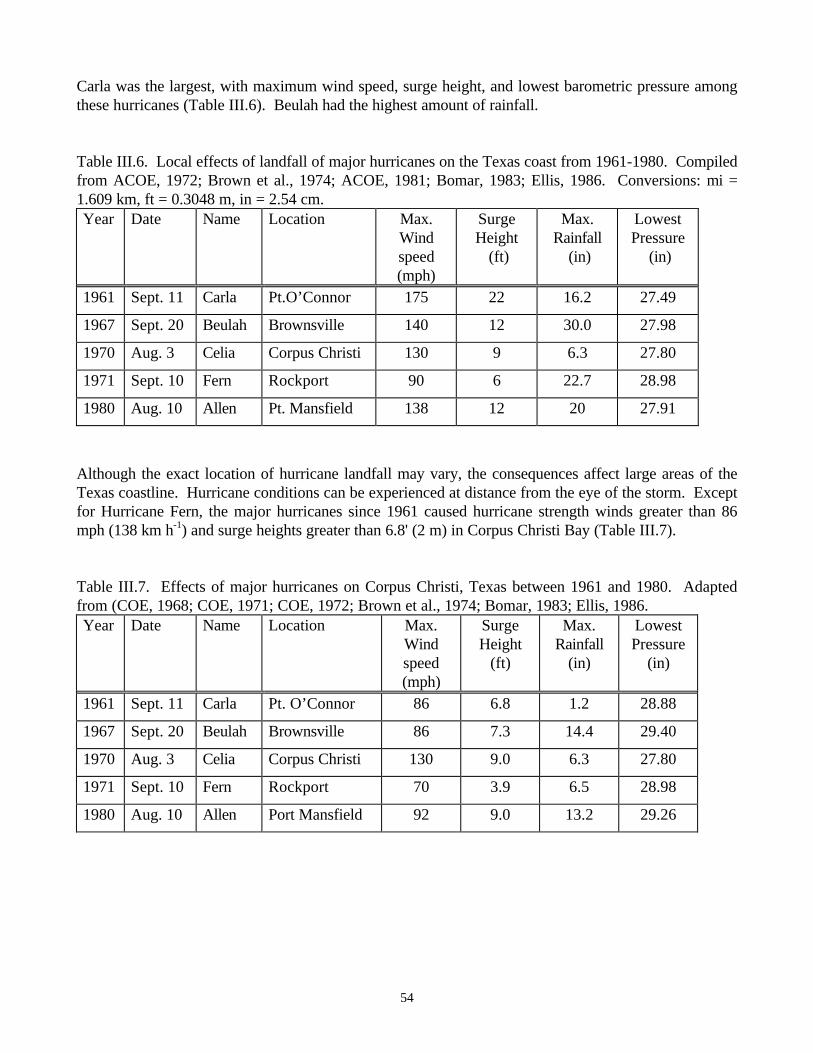
54
Carla was the largest, with maximum wind speed, surge height, and lowest barometric pressure amongthese hurricanes (Table III.6). Beulah had the highest amount of rainfall.
Table III.6. Local effects of landfall of major hurricanes on the Texas coast from 1961-1980. Compiledfrom ACOE, 1972; Brown et al., 1974; ACOE, 1981; Bomar, 1983; Ellis, 1986. Conversions: mi =1.609 km, ft = 0.3048 m, in = 2.54 cm.Year Date Name Location Max.
Windspeed(mph)
SurgeHeight
(ft)
Max.Rainfall
(in)
LowestPressure
(in)
1961 Sept. 11 Carla Pt.O’Connor 175 22 16.2 27.49
1967 Sept. 20 Beulah Brownsville 140 12 30.0 27.98
1970 Aug. 3 Celia Corpus Christi 130 9 6.3 27.80
1971 Sept. 10 Fern Rockport 90 6 22.7 28.98
1980 Aug. 10 Allen Pt. Mansfield 138 12 20 27.91
Although the exact location of hurricane landfall may vary, the consequences affect large areas of theTexas coastline. Hurricane conditions can be experienced at distance from the eye of the storm. Exceptfor Hurricane Fern, the major hurricanes since 1961 caused hurricane strength winds greater than 86mph (138 km h-1) and surge heights greater than 6.8' (2 m) in Corpus Christi Bay (Table III.7).
Table III.7. Effects of major hurricanes on Corpus Christi, Texas between 1961 and 1980. Adaptedfrom (COE, 1968; COE, 1971; COE, 1972; Brown et al., 1974; Bomar, 1983; Ellis, 1986.Year Date Name Location Max.
Windspeed(mph)
SurgeHeight
(ft)
Max.Rainfall
(in)
LowestPressure
(in)
1961 Sept. 11 Carla Pt. O’Connor 86 6.8 1.2 28.88
1967 Sept. 20 Beulah Brownsville 86 7.3 14.4 29.40
1970 Aug. 3 Celia Corpus Christi 130 9.0 6.3 27.80
1971 Sept. 10 Fern Rockport 70 3.9 6.5 28.98
1980 Aug. 10 Allen Port Mansfield 92 9.0 13.2 29.26

55
B.1.2.2. Effects of storms
Oppenheimer (1963) did not find observable damage to seagrass beds of Redfish Bay (60 miles south ofthe storm’s eye) after passage of Hurricane Carla at Port O’Connor. However, he noted silt had beenredistributed within the bay as a result of 3 foot waves caused by the storm, and bays were turbid fourdays after storm landfall. Thomas et al. (1961) reported large quantities of turtle grass along theshoreline of Biscayne Bay as a result of Hurricane Donna (1960). However, there did not appear to besignificant damage to seagrass beds. In contrast, van Tussenbroek (1994) documented a decrease innumber of short shoots in some populations of turtle grass in Puerto Morelos, Mexico after passage ofHurricane Gilbert (1988). This was attributed to depositing or removal of sediments during stormpassage. Eleuterius (1987) made references to destruction of seagrass meadows in Mississippi Sounddue to scouring or burial caused by Hurricane Camille (1969) and along the Alabama coast as aconsequence of Hurricane Frederick (1979). Therefore, if a hurricane passes directly over seagrasshabitat, burial or removal is likely.
B.1.3. Fronts
B.1.3.1. Occurrence of fronts
From 15 to 30 Arctic or Pacific fronts pass through Texas between December and February each winter(Brown et al. 1976). Wind stress associated with north or northeasterly winds produces significantwater movement in shallow Texas bays. As wind pushes water toward southern areas of a bay, higherwater levels develop toward the bay-mouth accompanied by a depression of water level at the bay-head.As a result of the pressure gradient formed, water flows from bay-head to bay-mouth, and up to half ofthe estuary’s volume can be emptied within a 24 hour period, potentially affecting the salinity regime(see below; Ward, 1980). This phenomenon is called “setup” and is responsible for water-level changesassociated with frontal passage. Fronts also contribute to formation of wind-driven circulation patternsabout which limited information is available.
B.1.3.2. Effects of fronts
There is no data on effects of fronts on bay bottoms or seagrass habitats. However, due to extensiveroot and rhizome system of seagrasses, it is unlikely fronts cause significant damage such as uprootingof plants. However, fronts cause massive resuspension of sediments and high turbidity, which maydecrease light availability to seagrasses. Effects of reduced light on productivity are well known anddiscussed elsewhere.
Another possible effect of fronts is burial of seagrass beds by detritus. The effect is due mainly to wind,which moves seagrass detritus. Concentration of dead seagrass over a live meadow can bury the livingshoots and kill them. It is possible that bare patches in a seagrass bed is due to this phenomenon.

56
B.1.4. Floods
B.1.4.1. Flooding due to hurricane storm surge and onshore winds
Flooding due to storm surge and onshore winds caused by hurricanes can be extensive along coastlineswith wide, gently sloping shelves with concave geography, e.g., Texas, (Brown et al., 1974). As ahurricane approaches the coast, sea level may rise for 32 - 64 km (10 to 20 mi) to the right of thestorm’s track. In addition, gently sloping bottoms characteristic of Texas bays may lead to sea levelincreases > 3 m (10 ft). Furthermore, wind stress can also increase sea level within bays by as much as1 m (3 ft) upwind of the storm track; an increase of 1 - 1.2 m (3 - 4 ft) in the vicinity of the storm isreflected in high sea levels along several hundred miles of coast (Brown et al., 1974).
Pronounced effects of storm surges and hurricanes winds in the CCBNEP study area were observed in1961 when Hurricane Carla swept through Port O’Connor, Texas. Hurricane Carla generated wavesgreater than 1 m (3 ft) in Redfish Bay; and tides were 30 cm (1 ft) above mean sea level for four daysfollowing landfall (Oppenheimer, 1963). As a result, 526 km2 (203 mi2) in and around Corpus Christiwere inundated and tidal flooding extended 16 km (10 mi) up the Mission, Aransas and Nueces rivervalleys. Together, Hurricanes Beulah and Carla flooded 82 ha (3,164 mi2) with seawater; most of SanJose, Mustang and Padre Islands were flooded. According to Brown et al. (1974), if Carla had madelandfall in Port Aransas, an estimated 10-15 % more area in the vicinity of Corpus Christi would havebeen flooded by tides 4.5 - 6 m (15 - 20 ft) above mean sea level.
Unlike Hurricanes Carla and Beulah, the most dramatic effects of Celia (1970) were not due to floodingfrom rains or storm surge, but from extreme winds as it made landfall in Corpus Christi. Rainfallassociated with Hurricane Carla was confined to a 80 km (50-mi) radius around the storm’s center;many cities proximal to Corpus Christi received little or no rainfall. The highest storm surge recordedwas only 2.7 m (9 ft). However, winds gusting at 259 km h-1 (161 mph) were recorded in CorpusChristi an hour after the storm made landfall. Hurricane strength winds were seen as far inland as DelRio and gusts over 80 km h-1 (50 mph) occurred in Big Bend (Bomar, 1983).
B.1.4.2. Flooding due to hurricane and tropical storm precipitation
In addition to storm surge, hurricanes and tropical storms often produce heavy rainfall. Precipitationdue to a single hurricane in August or September may lead to greater rainfall within that month thanduring the entire spring season. Therefore, average monthly precipitation values tend to be biasedtoward months with greatest hurricane frequencies. For example, in September 1967, Hurricane Beulahdeposited 81 cm (32 in) of rain over three days on much of South Texas (Brown et al., 1974).
Rainfall associated with hurricanes and tropical storms lead to peak late summer or early autumnfreshwater inflows from rivers into estuaries. Following hurricanes Beulah (1967) and Fern (1971),inflows of 981 million m3 and 755 million m3 (796,000 and 612,000 acre-ft), respectively, wererecorded from the Mission and Aransas Rivers into the Mission-Aransas Estuary, compared to averagevalues of 150 million m3 (122,800 acre-ft) (Tunnell et al., 1996). Similarly, hurricane Carmen (1974)made landfall in Louisiana and influenced Texas weather for two weeks following

57
landfall. A total of 43 cm (17 in) of rain were recorded in Papalote Creek drainage, a tributary ofAransas River (Brown et al., 1974).
B.1.4.3. Non-hurricane related flooding
Flooding events not directly related to tropical cyclone activity also occur along the Texas coast. In1935, major flooding due to abnormally high rainfall decreased salinities of Texas bays, converting theminto “freshwater lakes”. This event reduced salinity of Gulf waters for several miles offshore. During1948-1956, a severe drought caused record-high salinities in bay waters of the CCBNEP study area; thedrought was ended by a major flood in 1957. As a result of the 1957 flood, influx of freshwaterdropped salinities in Mesquite and Aransas Bays from 40 ‰ to 2 - 4 ‰ (Parker, 1959). In addition,inundation of low lying areas such as tidal flats, south sides of bays and barrier islands occurs withpassage of fronts during winter and early spring (Brown et al., 1974).
B.2. Long-term events and natural processes
There are events that occur over relatively long time scales, comparable to the time scales of storms andfloods, which can nevertheless be considered disturbances. Long-term events occur at scales of yearsand decades. Among these events are: variations in freshwater inflow, turbidity, hypoxia, and browntide; all of which may have both natural and anthropogenic causes. Scientists at the University of TexasMarine Science Institute (UTMSI) have been monitoring soft-bottom benthic communities in vegetatedand unvegetated habitats in the CCBNEP study area for many different purposes since 1987. Studieshave been primarily focused on defining effects of freshwater inflow (Montagna and Kalke, 1992; 1995;Mannino and Montagna, 1995; Montagna and Li, 1996), but other studies have been performed oneffects of potential pollutants and channelization (Martin and Montagna, 1995), brown tide (Montagnaet al., 1993; Conley, 1996; Buskey et al., 1997), and hypoxia (Ritter and Montagna, unpublished).Together, these studies are combined and reviewed to assess status and trends of unvegetated baybottom habitats as indicated by changes in benthic macrofaunal community structure, biomass, andproduction. Many samples have been taken and analyzed in the Nueces and Laguna Madre-Baffin Bayestuaries, but unfortunately, very little information is available about the Mission-Aransas Estuary.
Measurement of long-term benthic community changes have been made since 1987 in the NuecesEstuary (Figure III.13) and since 1988 in Laguna Madre-Baffin Bay Estuary (Figure III.14). Biomass isgiven in terms of g dry weight m-2. Diversity is given as Hill’s N1 value, which is calculated as theexponentiated form ( H’) of Shannon-Weaver’s diversity index (H’). The N1 diversity index is useful,because it is interpreted as number of dominant species, and low values approach 1. There are bothsimilarities and differences in trends of data between the two estuaries. In general, highest biomass,abundance and diversity is found in Laguna Madre, lowest values are found in Baffin Bay, andintermediate values are found in Corpus Christi and Nueces Bays.
There is a great amount of year-to-year variability, but certain changes are correlated to specific long-term events or trends. For example, decreasing diversity in Laguna Madre from 1990 is associated withonset of brown tide. There was an increase of infaunal biomass, abundance and diversity in

58
Corpus Christi Bay during the 1992 - 1993 El Niño. The increase is due to lower salinities, whichfollow high precipitation due to El Niño. The effect of El Niño is less evident in Laguna Made andBaffin Bay. However, increased abundance and diversity was found in Laguna Madre in 1992 - 1993,and an increasing trend in diversity was found from 1992 - 1995 in Baffin Bay. In general, El Niño hadpositive long-lasting trends in both ecosystems.
The focus of Section III.B.1.2 has been on the effects of storms. It is obvious that storms can act as anatural disturbance. However, an interesting question is: “what effect does a lack of storms have?” Wehave found no studies that could be used to answer this question. However, based on disturbance andsuccession theory (Section I.C), it is likely that storms have a beneficial role in ecosystems akin toresetting a clock. A natural disturbance, like a storm, can reopen niche space, thus making habitatavailable to pioneering species. Although community structure would change, system productivitywould increase. In addition, it is likely that nutrient regeneration would be enhanced by creation ofadditional detritus. In contrast, stasis in a system might lead to stagnation. Is it possible that lack of amajor hurricane was part of the cause of the brown tide bloom?

59
Figure III.13. Macrofauna long-term trends for the Nueces Estuary. Units for diversity are Hill’sN1 value. Biomass is dry weight. Montagna, unpublished data.


61
B.2.1. Freshwater inflow and salinity
B.2.1.1 Status and trends
Within the CCBNEP study area, most significant changes in salinity are due to isolated freshwaterpulses rather than seasonal variations of freshwater inflow. Most freshwater pulses occur in early falland coincide with tropical cyclone activity; however, rainfall due to passage of frontal systems in latespring may also result in noticeable salinity changes (Orlando et al., 1991).
Average input of freshwater to the Mission-Aransas, Nueces and Upper Laguna Madre estuarinesystems is reported in Table III.8. Amount of gauged freshwater inflow for Mission-Aransas andLaguna Madre estuaries accounts for 15% and 17%, respectively, of total annual freshwater input; forthe Nueces Estuary gauged inflow comprises about 60% of total. Precipitation has a greater influencein Mission-Aransas and Laguna Madre systems than in Nueces Estuary (Orlando et al., 1991).
Table III.8. Sources of freshwater input into the three estuarine systems of the CCBNEP study area.Estimates of the relative contribution of gauged and ungauged inflow and direct precipitation arepresented (Orlando et al., 1991).Freshwater Inflow Source Percent Contribution of Source to Each Estuary (%)
Mission-Aransas Nueces Laguna Madre
Gauged 15 60 17
Ungauged 39 28 N/A
Direct Precipitation 46 8 65
Precipitation and evaporation rates vary among the three estuarine systems within the CCBNEP studyarea. On average, precipitation in the Mission-Aransas estuary is 89 cm y 1 (35 in y-1), while the Nuecesand Laguna Madre estuaries receive 74 cm yr 1 (29 in y-1). In addition, average annual evaporation ratesin Laguna Madre is slightly higher than in Mission-Aransas and Nueces estuaries, at 158 cm yr 1 (62 iny-1)(Table III.9).
Average yearly surface and bottom salinities are variable among estuaries, as well as having large yearto year variations (Figure III.15). On average, salinities in Mission-Aransas and Nueces estuaries arelower and display higher variability than in Laguna Madre (Table III.9). Mean surface salinity duringthis period was about 18 ‰ for Mission-Aransas Estuary, 28 ‰ for Nueces Estuary, and 34 ‰ forUpper Laguna Madre Estuary (Figure III.15). Higher salinities in Laguna Madre result from a largesurface area and shallow average depth, as well as a lack of major river discharge into the estuary andlimited access to exchange with Gulf waters (Montagna et al., 1996). Evaporation often exceeds inflowin Laguna Madre, so it is characterized by hypersalinity.
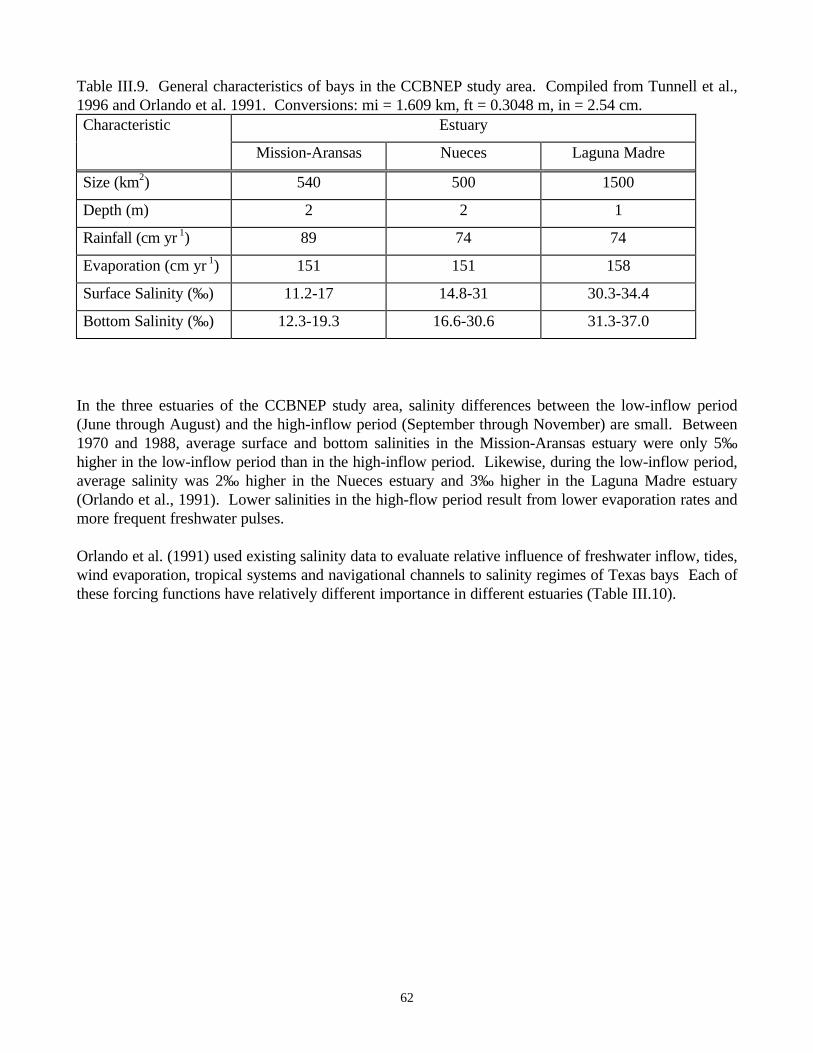
62
Table III.9. General characteristics of bays in the CCBNEP study area. Compiled from Tunnell et al.,1996 and Orlando et al. 1991. Conversions: mi = 1.609 km, ft = 0.3048 m, in = 2.54 cm.Characteristic Estuary
Mission-Aransas Nueces Laguna Madre
Size (km2) 540 500 1500
Depth (m) 2 2 1
Rainfall (cm yr 1) 89 74 74
Evaporation (cm yr 1) 151 151 158
Surface Salinity (‰) 11.2-17 14.8-31 30.3-34.4
Bottom Salinity (‰) 12.3-19.3 16.6-30.6 31.3-37.0
In the three estuaries of the CCBNEP study area, salinity differences between the low-inflow period(June through August) and the high-inflow period (September through November) are small. Between1970 and 1988, average surface and bottom salinities in the Mission-Aransas estuary were only 5‰higher in the low-inflow period than in the high-inflow period. Likewise, during the low-inflow period,average salinity was 2‰ higher in the Nueces estuary and 3‰ higher in the Laguna Madre estuary(Orlando et al., 1991). Lower salinities in the high-flow period result from lower evaporation rates andmore frequent freshwater pulses.
Orlando et al. (1991) used existing salinity data to evaluate relative influence of freshwater inflow, tides,wind evaporation, tropical systems and navigational channels to salinity regimes of Texas bays Each ofthese forcing functions have relatively different importance in different estuaries (Table III.10).


64
Table III.10. Response of salinity to forcing mechanisms. Abbreviations: D: Dominant factoraccounting for greatest range in salinity variability. S: Secondary factor having an influence on salinityvariability. M: Minor factor having a detectable influence on salinity variability. Adapted from Orlandoet al., 1991.Estuary Mechanism Days Weeks Months to
SeasonsYear to Year
MissionAransas
Inflow M(freshet)
S(long flushing)
D(wet/dry)
Tide
Wind M(frontalpassages)
M(pressuresystems)
Evaporation M
Nueces Inflow M(long flushing)
M D(wet/dry)
Tide
Wind S M(seasonal)
EvaporationChannelTropical Storm M M
D
MUpperLagunaMadre
Inflow M(wet/dry)
Tide M(seasonal)
Wind M S(pressuresystems)
D(seasonal)
EvaporationTropicalSystems
MSS

65
Due to morphology and hydrology of South Texas estuaries, sporadic events of abnormally high or lowfreshwater input may have a large effect on salinity regimes within an estuarine system. The following isa historical compilation of events which resulted in abnormally low or high salinities in the CCBNEPstudy area.
• Between 1950 and 1957, a severe drought caused minimal freshwater inflow and high evaporationrates in Aransas Bay, leading to hypersaline conditions. The drought was terminated in the spring of1957 when extensive floods caused salinities in Mesquite and Aransas Bays to drop from 40 ‰ to arange of 2 - 4 ‰ within three weeks (Parker, 1959).
• In 1974, a freshwater pulse estimated to occur every 10 to 20 years caused salinities in Mission-Aransas Estuary to decrease to 5 ‰ (Orlando et al., 1991).
• In August 1980, Hurricane Allen resulted in 50-year peak flows in San Fernando Creek. Inaddition, the storm lowered salinities to 3 ‰ in Cayo de Grullo (within Baffin Bay) during August,and salinities remained less than 20 ‰ in Baffin Bay through November (Orlando et al., 1991).
• In Baffin Bay salinities were commonly 60 - 80 ‰ before construction of the GIWW, and salinitiescould decrease to as low as 2 ‰ by local thunderstorms (Gunter, 1945)
B.2.2.2. Effects of inflows
Bursts of productivity in Nueces Bay during wet periods and declines in dry years show the importanceof freshwater inflow for maintaining benthic productivity (Figure III.13). The positive effect of inflowon secondary productivity has been demonstrated in past studies in Lavaca (Kalke and Montagna, 1991)and San Antonio Bays (Montagna and Yoon, 1991).
Nueces and Guadalupe Estuaries were contrasted to test the hypothesis that benthic standing crops areenhanced by freshwater inflow (Montagna and Kalke, 1992). Assuming predation pressure was similarin both estuaries, higher standing crops could be equated with higher secondary production. GuadalupeEstuary had 79 times more freshwater inflow than Nueces Estuary, and much lower salinity. GuadalupeEstuary had higher macrofaunal densities and biomass than Nueces Estuary. Density and biomassincreased with decreasing salinity within Guadalupe Estuary but increased with increasing salinity inNueces Estuary due to invasion by marine species. Macrofauna diversity increased with salinity, bothwithin and between estuaries. Macrofaunal responses indicated that increased freshwater inflowstimulated secondary production. Macrofaunal diversity decreased with lower salinity within andbetween estuaries, so enhanced productivity was due to increases by freshwater and estuarine speciesthat can tolerate low salinities. Meiofauna, however, responded differently than macrofauna.Meiofaunal densities were higher in low-inflow Nueces Estuary, and increased with increasing salinity inboth estuaries. Higher macrofaunal densities were associated with lower meiofaunal densities, whichcould be due to either increased macrofaunal competition with or predation on meiofauna, or a lack oflow-salinity tolerance by meiofauna.

66
Table III.11. The relationship between freshwater and marine-influenced zones in the high-inflowGuadalupe and low-inflow Nueces Estuaries. For each parameter the overall average of all samplingperiods between 1987 and 1988 are given for the freshwater influenced stations and the marine-influenced stations. Adapted from Montagna and Kalke (1992).Variable Estuary
Guadalupe (1987) Nueces (1987-8)
Fresh Marine Fresh Marine
Salinity (ppt) 1.4 6.9 32 33
MeiofaunaDensity (no. ×106 m-2)
0.25 1.12 1.18 3.80
MacrofaunaDensity (no. ×103 m-2)
30.1 8.35 7.48 19.88
Biomass (g dry wt m-2) 5.98 3.36 4.31 4.41
Diversity (no. species) 15 26 26 59
Seagrasses are tolerant of large fluctuations in salinity. Of the most common species within theCCBNEP study area, shoal grass is the most euryhaline, followed by manatee grass and turtle grass(McMillan and Moseley, 1967). Turtle grass can tolerate salinities as low as 3.5‰ and as high as 60‰;however, plant stress is manifested through defoliation (Zieman, 1975a). The optimum salinity rangefor turtle grass is 24-35‰. Zieman (1975b) reported decreased productivity in turtle grass below andabove 30‰. Although seagrass species are tolerant of fluctuations in salinity, there is some evidencethat salinity may play a role in seed germination, and there may be ecotypic variations within a speciesthat determine germination success (Koch and Dawes, 1991).
B.2.2. Suspended sediments loads
High suspended sediment loads can be generated by natural processes such as storms and floods as wellas human activities such as shrimp trawling and dredge spoil disposal. The following is a description ofturbidity and sedimentation related to natural events.
B.2.2.1. Turbidity
Wind is the primary mechanism driving turbidity characteristics and spatial structure in Corpus ChristiBay (Shideler, 1980). Under influence of prevailing southeasterly winds, characteristic of the studyarea, fluvial sediments delivered by Nueces River to Nueces Bay are trapped within the bay. However,during passage of winter fronts, sediments trapped within Nueces Bay are flushed to Corpus Christi Bayand thereafter dispersed southward by wind-driven waves and currents. Therefore, input of suspendedsediments into Corpus Christi Bay is determined by wind speed and

67
direction. Frequency of wind speed and direction in Corpus Christi Bay during the annual cycle ispresented in Table III.12.
Table III.12. Wind speed and direction in Corpus Christi. Adapted from Naval OceanographyCommand Detachment (1986) as cited in PCCA (1993). Conversion: kts = 1.852 km h-1.Month Percent Frequency of Wind Speed and Direction in Corpus Christi
N NE E SE S SW W NW Mean
% kts % kts % kts % kts % kts % kts % kts % kts kts
Jan 10 19 20 17 25 14 20 14 5 14 5 11 10 10 5 18 15
Feb 20 18 15 17 18 14 18 14 18 15 3 11 3 13 3 17 15
March 20 17 10 14 10 13 23 14 20 14 5 10 5 11 5 18 14
April 4 17 16 13 18 13 42 15 16 14 1 11 1 11 1 13 13
May 9 16 5 13 18 12 40 14 20 14 2 9 2 12 3 12 13
June 5 10 7 13 8 12 40 13 30 14 3 12 2 8 4 10 12
July 3 9 4 8 4 11 43 12 37 12 3 9 1 5 2 8 9
Aug 1 8 1 12 10 10 37 11 38 12 3 11 3 8 4 10 10
Sept 6 14 4 13 32 11 34 12 18 14 3 13 1 10 1 11 12
Oct 5 17 20 14 30 11 35 12 3 12 3 12 2 13 1 9 13
Nov 5 18 20 15 20 11 30 16 20 15 2 13 1 9 1 13 14
Dec 8 18 20 14 10 12 20 15 20 15 5 12 10 12 6 18 15
Avg. 8 15 12 14 17 12 32 14 20 14 3 11 3 10 3 13 13
Wind speed and direction also effect turbidity structure, i.e., water column transmissivity and suspendedsolids in Corpus Christi Bay. A detailed study of turbidity structure was performed along a salinitygradient from Nueces Bay to Aransas Pass (Shideler, 1984). Turbidity was measured as percenttransmissivity in 0.25 m (12 in) of water (% T 0.25 m), while suspended sediment concentrations (mg l-1
or ppm) were determined from water samples. Other data collected included current direction derivedfrom drifters, sediment grain size, temperature and salinity. Two scenarios were derived that illustratethe turbidity structure due to the two characteristic wind patterns: 1) passage of a winter front withnortherly winds and, 2) prevailing south/southeasterly winds characteristic of the spring and summer inthe CCBNEP study area.
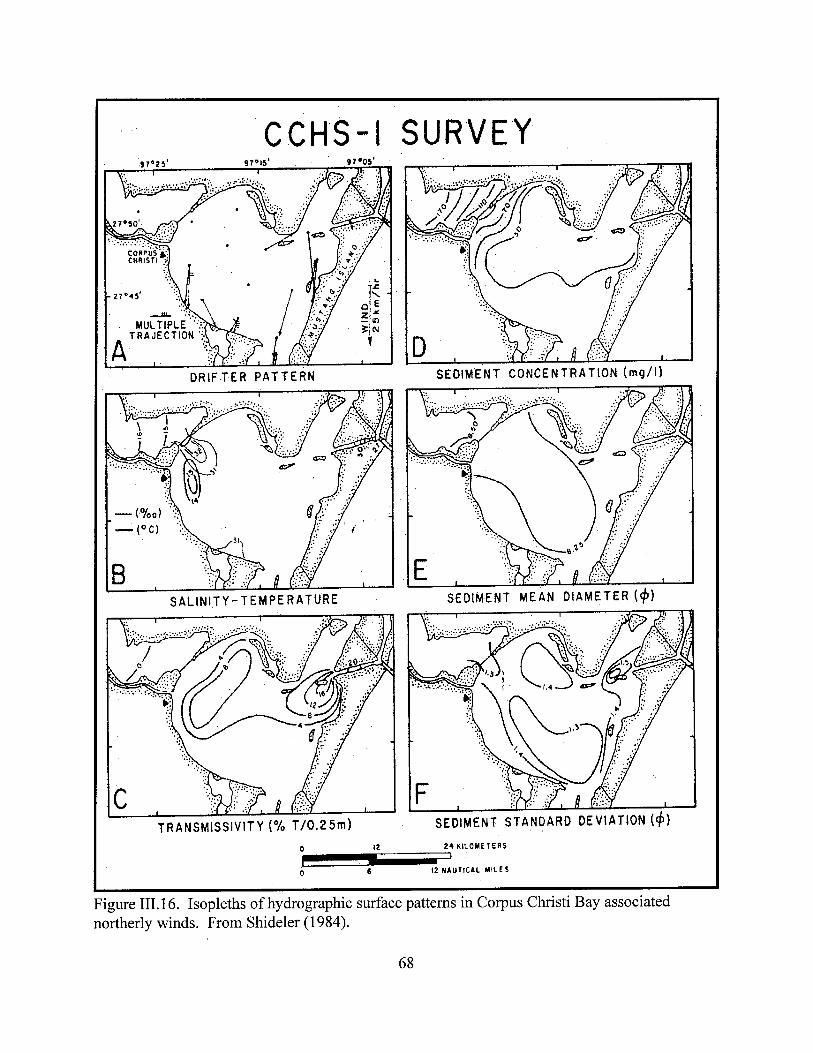


70
Case 1. Survey CCHS-1 was conducted during passage of a front with strong north wind (FigureIII.16). Transmissivity was lowest within Nueces Bay (0 %T 0.25 m), and highest toward Aransas Pass(20 % T 0.25 m). Patterns in transmissivity and suspended sediments were attributed to sediment inputfrom Nueces Bay into Corpus Christi Bay. There was also increased wave action, causing higherturbidity, along the southern margin of Corpus Christi Bay and dilution of turbid waters by Gulf ofMexico water entering Aransas Pass. These conditions occur only during periods of strong north andnortheasterly winds.
Case 2. Survey CCHS-2 was completed during conditions of prevailing southeasterly wind; at a speedof 80 km h-1 (11.4 mph) (Figure III.17). Highest suspended sediment concentrations, 111 mg l-1 (ppm)were found within Nueces Bay. Turbidity structure of Corpus Christi Bay under southeasterly windswas attributed to input of less turbid waters from Upper Laguna Madre to Corpus Christi Bay. Therewas also higher wave action at the bay-head, confinement of turbid water within Nueces Bay anddilution of turbidity by Gulf of Mexico water entering Aransas Pass.
Seagrasses play a critical role in determining depositional and sediment characteristics of estuarinesystems. Seagrasses interact with the physical environment, effectively altering local depositional andsubstrate characteristics of sediments. Leaves baffle wave and current action, leading to deposition offine-grained sediment within meadows (Ginsburg and Lowenstam, 1956; Scoffin, 1970; Fonseca et al.,1982). Therefore, seagrass meadows are important in preventing and mitigating coastal erosion. Inaddition, root and rhizome systems stabilize sediment within seagrass beds (Ginsburg and Lowenstam,1956). Loss of seagrass areal coverage can lead to higher overall estuarine turbidity.
B.2.2.2. Sedimentation
Sedimentation occurs when suspended material is deposited onto the bottom of an estuary.Sedimentation rates are related to many factors. Riverine input is a key sediment source in estuarineenvironments, and varies both seasonally and annually. This is reflected by suspended sedimentconcentrations in Corpus Christi Bay , which range from 11 to 52 mg l-1 (ppm) (Sideler and Stelting,1981). Generally, more freshwater input equates to greater sediment deposition; however, riversediment loads also vary. Diversion channels and dams restrict flow of water through its natural course,and often leads to deposition of sediment before it reaches the estuary. Before damming of the lowerNueces River in 1930, sedimentation rate in Corpus Christi Bay was 0.48 cm y-1 (1.56 ft 100 y-1). Thisrate was comparable to that of Aransas Bay, which was 0.43 cm y-1 (1.42 ft 100 y-1) (Shepard, 1953).Until that time, Nueces River was the primary source of sediment for Nueces and Corpus Christi Bays.Since damming, this sediment source is no longer thought to be important (Shepard, 1953).
Once sediment reaches the estuary, dispersal is wind driven (Sideler and Stelting, 1981). Resuspensionof sediment can also be caused by erosion of shoreline and channel margins. Such erosion may becaused by boat and ship wakes, heavy flooding, or from wind-generated waves (Onuf, 1994). Erosionis a source of net sediment accumulation in the estuary, but it (as well as riverine input) may be offset bysubsidence, which is discussed in section B.2.3. Factors responsible
71
for erosion are also responsible for resuspension of sediment. Sediment resuspension in shallow waterscan be initiated at current speeds as low as 10 cm s-1 (4 in s-1) (de Jonge and van den Bergs, 1987).Although resuspended sediment is omitted from calculation of sedimentation rates, it presents the sameproblem for benthic organisms in settlement of suspended material and increased turbidity. Turbidity asa disturbance is discussed in section B.2.2.1.
Little information exists regarding how estuarine organisms are affected by sediment load in the watercolumn (Sherk and Cronin, 1970). The primary means by which silt alters benthic habitat is byblanketing the sediment surface (Ellis, 1936). At high sedimentation rates, animals not able to avoidburial may be smothered. For example, silt layers between 1 - 25 mm (0.04 - 1 in) thick killed 90% offreshwater mussels on the bottom (Ellis, 1936). Influence of sediment is species specific, related to anorganism’s size and feeding type, and sedimentation rate. Some animals, such as eastern oyster,Crassostrea virginica, are remarkably silt tolerant provided they are not completely buried (Sherk andCronin, 1970).
Organism feeding mode is one key process affected by particulates in water. Many benthic species areknown to be facultative suspension feeders (Taghon et al., 1980). Facultative suspension feeders aredeposit feeders that switch to suspension feeder based on current speed or particulate loadings.However, some organisms cannot tolerate suspended particulates; this is known as trophic amensalim(Rhoads, 1974). For example, there is usually a very low density of infaunal suspension or filter feedersin environments with high rates of silt deposition. In contrast, depositing feeding organisms generallyhave high densities in depositional environments with high suspended sediment concentration (Brehmer,1965; Rhoads, 1973; 1974). Some species are better able to cope with higher rates of sedimentation,thus changes in sedimentation rate may shift the balance of competition. In contrast, wind-driventurbulence can resuspend microphytobenthos, fecal material, and detritus, which are then available forsuspension feeders and can induce high feeding rates (Taghon et al., 1980). However, it has been foundsediment resuspension does not alleviate limitations to mussel growth arising from seston depletion(Fréchette and Grant, 1991).
B.2.3. Subsidence
Land surface subsidence is lowering of sediment surface relative to, and accounting for, changes ineustatic sea level. Subsidence can be caused by a number of factors including: 1) natural processes suchas compaction and faulting, 2) withdrawal of shallow subsurface fluids, 3) shallow sulfur and saltmining, and 4) possibly extraction of deep oil and gas reserves (Lofgren, 1977, Paine, 1993).Withdrawal of groundwater, and associated compaction of water bearing sediments, is associated withhighest rates of subsidence (Paine, 1993). However, lower subsidence rates in regions with little groundwater withdrawal, may be related to extraction of oil and gas resources. Subsidence rates varytemporally and spatially, probably due to differential rates of subsurface fluid withdrawal and naturalcauses of subsidence (compaction and faulting) (Swanson and Thurlow, 1973). It may also be relatedto seasonal variation in barometric pressure, wind, and river discharges.
It could be argued that subsidence in Texas is not a natural phenomenon, but one caused by humanactivities associated with water use, and oil and gas extraction. Long term subsidence rates (on a

72
geologic scale of 105 years) in Copano Bay have been estimated at < 0.05 mm y-1 (0.002 in y-1). In1982, the Texas Department of Water Resources determined subsidence in Region 4 (Refugio, Aransas,San Patricio, Nueces, Kleberg, and Jim Wells Counties) was typically < 15 cm (0.6 in) for two different33 year periods (1918-1951 and 1942-1975). This translates to approximately 0.45 mm y-1 (0.02 in y-1)subsidence, almost 10 times greater than the more long term estimate derived from Copano Bay. Twoareas in Region 4, one of which is in Corpus Christi, were found to have subsidence rates > 15 cm (0.6in). However, more recent estimates of subsidence rates vary spatially, ranging from 1 - 22 mm y-1
(0.04 - 0.9 in y-1) along the entire Texas coast (Paine, 1993). The greatest amount of land surfacesubsidence in Corpus Christi, Texas was 1.61 m (5.3 ft) between 1942-1975 for a rate of 4.33 mm y-1
(0.17 in y-1). This subsidence occurred in the western part of the city where ground water extractionwas not large enough to be the primary cause (Ratzlaff, 1982). Because the subsided regioncorresponds with the Saxtet Oil and Gas Field; subsidence was caused by withdrawal of oil, gas, andrelated fluids (Ratzlaff, 1982). Conversely, subsidence in the region of Texas between Sinton andHarlingen has been relatively stable (Paine, 1993). In this region, rates of surface motion tend to be 2 -4 mm y-1 (0.08 - 0.16 in y-1) upward. However, between Sinton and Port Aransas, rates of surfacemovement varied between 5 mm y-1 (0.2 in y-1) downward to 10 mm y-1 (0.4 in y-1) upward.
There is no evidence of significant subsidence in estuarine areas of the CCBNEP study area. Naturalsubsidence occurs at rates < 0.05 mm y-1 (0.002 in y-1) and may be offset by influx of sediment withfreshwater inflow. However, with increased water diversion, less sediment is deposited in estuaries tocounter balance subsidence. Intertidal habitats are at risk because of subsidence. If elevation ofsediment surface changes with respect to sea level, zonation of intertidal benthic habitats will change.Areal extent of emergent marshes may increase or decrease, as well as areal extent of submergedseagrass meadows. Unfortunately, it is not possible to predict influence of subsidence and depositionprocesses that vary spatially and temporally by substantial amounts.
B.2.4. Hypoxia
Hypoxia (low oxygen conditions) is defined as dissolved oxygen (DO) levels < 2 mg l-1 (ppm). Hypoxiais considered a disturbance because few animals can withstand low oxygen levels for extended periods.Animals able to survive such harsh conditions tend to be opportunistic species such as the polychaeteStreblospio benedicti. However, even this species cannot survive for long in low oxygen environments.In laboratory experiments, it was found that S. benedicti can survive for more than two weeks atdissolved oxygen levels of 14.5 % and 7% of air saturation at 26 C (79 F) (Llansó, 1991). Underanoxic (zero DO) conditions S. benedicti died within 55 hours.
One surprising finding from studies described in section B.2. is that each summer, hypoxia events werenoted in bottom water at one site in a portion of Corpus Christi Bay near Shamrock Island (FigureIII.18). This site is Station D in Montagna and Kalke (1992). Except for 1993, when salinity levelswere relatively low and the water column well-mixed, hypoxia occurred every year at this station.Hypoxia occurs only in summer, when temperatures and salinities are high (Figure III.18). Severalprocesses are thought to be related to onset of hypoxia including water column stratification andorganic matter decomposition (Officer et al., 1984; Pokryfki and Randall, 1987). The

73
most likely explanation for hypoxia in Corpus Christi Bay is water column stratification. This issurprising because the estuary is shallow, windy, and thought to be well-mixed.
Figure III.18. Long-term hydrographic conditions in Corpus Christi Bay, Station D, nearShamrock Island. From Montagna, unpublished data.

74
Ritter and Montagna (1997) sampled the area in Corpus Christi Bay near Shamrock Island every threeweeks between 3 May and 26 August, 1994, to determine temporal extent of hypoxia. As in previousstudies, hypoxia was associated with water column stratification. Hypoxia was present between 14 Juneand 5 July. The hypoxic area extended south for about 2 miles, but not in any other direction.Sampling was also performed through the month of July, 1996, to determine spatial extent of thehypoxic area, hydrographic characteristics associated with hypoxia, and benthic effects. Ten stationswere sampled, five in the hypoxic area and five outside the hypoxic area (Table III.13).
Table III.13. Effects of benthic hypoxia in Corpus Christi Bay in July 1996. Average for five stations ineach area.Area Biomass
(g m-2)Density(n m-2)
Diversity(no. species)
Diversity(Hill’s N1)
D. O.(mg l-1)
Control 4.376 11,875 13 7.0 4.4
Hypoxia 0.343 2,553 1.5 4.2 2.1
There was twice as much oxygen in the control than in the hypoxic areas sampled (Table III.12). Thishad a major effect on productivity in those sediments, as indicated by a biomass standing stock that was14 times greater in the normoxic (> 3.0 mg l-1) (ppm) sediments. There was a concomitant five-folddecrease in density and species number in the hypoxic sediments.
Hypoxia was due to water column stratification and resulting large differences in surface and bottomwater salinity (Figure III.19). Temperature was constant throughout the water column at both stations,so differences in water masses were driven by influx of salty water of same temperature. The halocline(where salinity changes abruptly) was at 2 m below the surface at both stations (Figure III.19). Salinitywas similar at the surface and constant throughout surface water mass at both stations. In the lowerhalf of the water column, salinity decreased by about 2 ppt in the normoxic station, but increased byabout 5 ppt at the hypoxic station. Oxygen concentrations decreased continuously at the normoxicstation from 5.6 mg l-1 to 3.6 mg l-1. In contrast, at the hypoxic station, oxygen was constant at 5.3 mgl-1 above the halocline, but decreased to 1.9 mg l-1 below the halocline. Differences in water massstructure indicate a layer of hypersaline bottom water was causing stratification, and oxygen wasdepleted from bottom water mass, which was not mixing with the surface.
Areal extent of the hypoxic zone was relatively small. The area with hypoxia roughly formed a trianglewith three points connecting Oso Bay inlet to Corpus Christi Bay, Shamrock Island, and thesoutheastern-most point of Corpus Christi Bay. There was a gradient of increasing salinity from OsoBay to Corpus Christi Ship Channel and Port Aransas. The distribution of hypersaline bottom waterindicates it could be derived from hypersaline Laguna Madre from the ICWW or pumped into Oso Bayby the CPL Barney Davis power plant. Another possibility is simply the combination of evaporationand lack of water movement in the area, and sinking of dense saltier water to the bottom.

75
Figure III.19. Stratification at normoxic and hypoxic stations in Corpus Christi Bay. From Ritterand Montagna (submitted msc.).
76
The hypoxic area is also characterized by the lowest current flow vectors in all of Corpus Christi Bay(personal communication: Cheryl Brown, Texas A&M University; Junji Matsomoto, Texas WaterDevelopment Board). The hypoxia demonstrates the flaw in the dogma that open bays in the CCBNEPstudy area are well-mixed because of high winds and shallow depths. Hypoxic events in Corpus ChristiBay appeared to be due to altered circulation patterns in the bay and were limited to a short durationduring summers. Hypoxic events also have biological consequences because benthic biomass,abundance, and diversity is degraded (Table III.13).
B.2.5. Brown tide
The effect of brown tide is most obvious in Upper Laguna Madre and Baffin Bay. Prior to the browntide bloom in 1990, benthic biomass, abundance, and diversity were relatively high in Upper LagunaMadre, but have decreased since then (Figure III.14). This is especially true for biomass, which hasdeclined almost four-fold. This represents an enormous loss of secondary production in the ecosystemeven though primary production increase 10 fold. In Baffin Bay, biomass declined to near zero levelsfor the first two years following the brown tide bloom, but has had seasonal recovery since 1992.However, highest biomass values were recorded prior to brown tide.
Benthic infaunal abundance values in Baffin Bay have not recovered to pre-brown tide levels as of 1997.In contrast, abundance appeared to be incrementally recovering every year in Laguna Madre, but it hadnot fully recovered in 1995. Biodiversity is still low in Laguna Madre, but has recovered in Baffin Bay.Diversity in Baffin Bay is often near 1, because the system is dominated by one opportunist species, thepolychaete Streblospio benedicti. The bivalve, Mulinia lateralis, can apparently eat and assimilatebrown tide, but populations have been virtually absent since the brown tide bloom (Montagna et al.,1993).
B.2.6. Bioturbation
Bioturbation is alteration of substrate through burrowing and feeding activities of benthic organismssuch as fish, crabs, polychaetes, and molluscs (Lalli and Parsons, 1993). In many cases, animal activitycan continually rework sediment and disrupt progression of community succession by affecting presenceand recruitment of other species or trophic groups. Bioturbation affects benthic communities primarilyby altering sediment stability and influencing settlement and recruitment of organisms.
Bioturbated sediment is typically less stable and more easily resuspended than sediment that has notbeen altered by burrowing organisms (Rhoads, 1973; 1974). Presence of polychaete tubes can lead upto a 46% decrease of critical erosion velocity around tubes (Luckenbach, 1986). Other factors that maywork in conjunction with bioturbation to affect sediment stability include: topography, sediment size,composition of sediment, and sediment binding (Luckenbach, 1986). Bioturbation of the top fewcentimeters of sediment by deposit feeders creates a soft layer rich in fecal material that is easilyresuspended by low velocity currents (Rhoads and Young, 1970). Instability of the fecal layer createdby deposit feeders may influence presence of other trophic groups (Rhoads and Young, 1970). Forexample, resuspended fecal material and sediment may clog filtering appendages

77
of suspension feeders, bury juveniles and recently settled larvae, discourage settlement of suspensionfeeding larvae, and inhibit attachment of sessile epifauna (Rhoads and Young, 1970).
Sediments around burrows and polychaete tubes tend to have a greater density of animals (DePatra andLevin, 1989; Luckenbach, 1987). For example, Streblospio benedicti and Nereis succinea are commonaround Diopatra spp. tubes, but fewer in sediments lacking such tubes (Luckenbach, 1987). However,both species have been found to reduce survival rate of Mulinia lateralis, which is inhibited fromrecruiting around Diopatra spp. tubes due to high post-settlement mortality. Fiddler crab burrows mayinfluence hydrography such that meiofauna are more easily deposited or trapped in burrows (DePatraand Levin, 1989). In addition, some species (e.g., harpacticoid copepod Zausodes spp.), may beattracted to fecal mounds (e.g., those made by an Enteropneust) to avoid predation or to seek food or apreferred sediment type (Varon and Thistle, 1988).
Though very small, meiofauna are capable of significant sediment reworking. Macrofauna tracks, trails,and burrows disappeared after macrofauna (but not meiofauna) removal when left in an undisturbedaquarium (Cullen, 1973). After only two days, evidence of previous macrofauna activity began to blur.All macrofaunal evidence disappeared within two weeks and was attributed to meiofaunal activity.Several animals are thought to be responsible. Ostracods (about 0.5 mm long) burrow up to 4 mmdown and are capable of moving sediment several times their own size with jerky and vigorous motions.Copepods and malacostracans exhibited similar behavior but their ability to move sediment varied withsize and vigor. Nematodes create a fine network of burrows that are thought to be reinforced withmucous. These burrows may persist a few hours until disturbed by other biogenic activity. Meiofaunaactivity is also thought to play an important role in development of an oxidized layer in the upper 0.5 -1.5 cm (0.2 - 0.6 in) of sediment
Head-down deposit feeders, characteristic of highly bioturbated areas, are not commonly found in theCCBNEP study area (Montagna and Kalke, 1992). However, several other bioturbators occur in theregion. Examples include crabs, stomatopods, enteropneusts, skates, rays, and ophiuroids. Presence ofophiuroids in the estuary is unique to the CCBNEP area. Stone crabs (Menippe adina) are known toexcavate burrows in mud, and hide in crevices of oyster reefs and jetties (Britton and Morton, 1989).Juvenile stone crabs use crevices in mud banks as refuges (Britton and Morton, 1989). Stomatopoda(mantis shrimp) are specialized predators for benthic macrofauna (Ruppert and Barnes, 1994). Manystomatopods live in burrows excavated during feeding activities that may be as long as 4 metersvertically (Ruppert and Barnes, 1994). Ophiuroida (basket, serpent, and brittle stars) are the mostmobile of the echinoderms and may grow as large as 12 cm (4.7 in) in diameter (Ruppert and Barnes,1994). Ophiuroids of the family Amphiuridae dig channels through the sediment using undulatorymotion of arms and digging with tube feet. (Ruppert and Barnes, 1994). Numerous demersal fish areknown to create sediment disturbances via swimming, feeding and resting activities. Examples includestingrays (Dasyatidae) and skates (Rajidae) (Britton and Morton, 1989).
Bioturbation is a natural ecological process. Although it may affect distribution of some species, itshould not be considered a disturbance per se. However, when considering how human activities mayinfluence benthic communities, bioturbation should be taken into account.

78
C. Key Resource Management Concerns
Key resource management concerns of the CCBNEP-Scientific Technical Advisory Committee (STAC)were identified by interviewing members and ex-officio members of that committee. A total of 32members responded to questions while five declined to be interviewed. Questions asked during theinterview are included in Appendix A and correspond with the following subsections.
C.1. Resource issues
Figure III.20 provides a diagrammatic representation of the number of interviewees expressing concern,or lack of concern, about resource management issues. It is important to note that a single intervieweecould express concerns about a number of different issues. Thus, total number of responses exceeds thenumber of people interviewed.
The top four resource management issues based on this survey are: dredging, pollution, freshwaterinflow, and trawling. Eleven or more interviewees expressed concerns regarding these key issues.Although, dredging was ranked first in order of concern, only 40% of people interviewed expressedconcern about effects of dredging activities (e.g., excavation and deposition). One person expressed theopinion that dredging was not an issue in the CCBNEP study area.
About 38% of interviewees expressed concerns about pollution in the CCBNEP study area. Concernswere expressed regarding discharge of contaminants and domestic wastes into bays, non-point sourcepollution (e.g., fertilizers and insecticides), and brine discharges. One person expressed the concern thatthere is not enough water quality testing.
Figure III.20. Number of people interviewed who expressed concern, or lack of concern, abouta resource management issue.
79
Freshwater inflow and trawling each were expressed as resource concerns by 31% of peopleinterviewed. Concerns regarding freshwater inflow arise from effects of fluctuating salinity on benthicanimals which is also related to rainfall, evaporation, run-off, and mixing with ocean water. Trawlingconcerns arise from physical disturbance it creates as well as the removal of organisms thought to beimportant links in the food web.
About 14% of the people interviewed expressed concerns related to sediment (e.g., suspendedsediment, turbidity, and siltation). Other concerns include: lack of research or data (6%), effects ofrecreational boating on benthos (3%), public health (3%), and effects of natural freezes (3%). It isinteresting to note that three respondents (9%) said they had no concerns or their concerns had alreadybeen addressed.
C.2. Social and economic concerns
Responses to the question on social and economic concerns were not clear enough to yielddemonstrable results. Several interviewees said they did not know enough about social and economicissues to comment. Others replied with management recommendations or concerns about how humanactivities affect benthos. However, some responses were particularly enlightening with regard toeconomic conflicts that arise through competing uses of coastal resources. Rresources of the CCBNEPstudy area are economically valuable from a number of perspectives. Conflicts may arise due tocompeting pressures often placed on these resources. The following are examples of potential conflictsin the CCBNEP study area.
• Competing uses of freshwater include human consumption (including watering lawns), industrialuses, and recreational and commercial fishery productivity (which is affected by freshwater releasesto the bay).
• Maintenance of the GIWW often leads to disposal of dredge material in the open bay, which may bedetrimental to benthic resources (e.g., seagrasses, benthic animals) and affect commercial andrecreational fisheries. However, dredge material can be used to enhance the environment bycreation of new wetlands and rookery islands.
• Release of municipal and industrial effluent into bays creates conflict between needs of industriesand municipalities to dispose of unwanted effluent and needs of the tourism industry to have anaesthetically pleasing environment. Discharge of effluent may also conflict with needs ofrecreational and commercial fishing industries if effluent contaminates and degrades theenvironment.
• Shoreline modification may bring private property rights and human economic needs to developproperty to its highest and best use into conflict with needs of the fishing industry to have wetlandsand seagrass beds as nursery areas and critical habitats for commercially and recreationallyimportant finfish and shellfish resources.
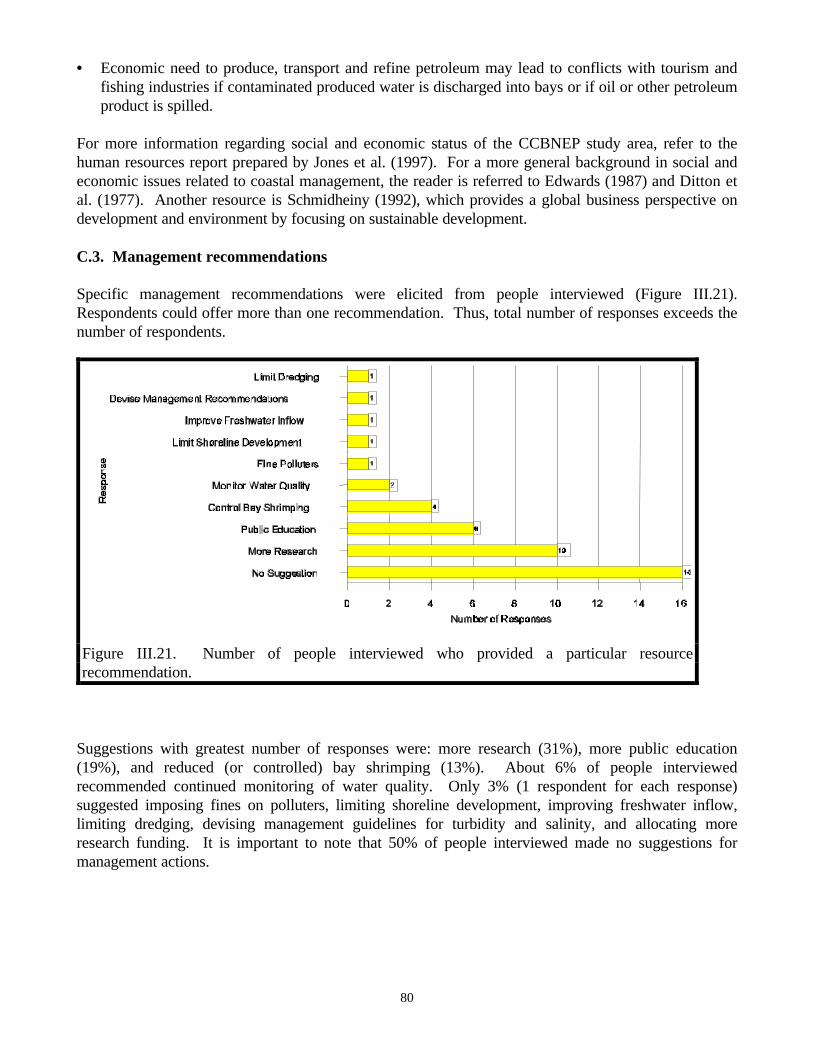
80
• Economic need to produce, transport and refine petroleum may lead to conflicts with tourism andfishing industries if contaminated produced water is discharged into bays or if oil or other petroleumproduct is spilled.
For more information regarding social and economic status of the CCBNEP study area, refer to thehuman resources report prepared by Jones et al. (1997). For a more general background in social andeconomic issues related to coastal management, the reader is referred to Edwards (1987) and Ditton etal. (1977). Another resource is Schmidheiny (1992), which provides a global business perspective ondevelopment and environment by focusing on sustainable development.
C.3. Management recommendations
Specific management recommendations were elicited from people interviewed (Figure III.21).Respondents could offer more than one recommendation. Thus, total number of responses exceeds thenumber of respondents.
Suggestions with greatest number of responses were: more research (31%), more public education(19%), and reduced (or controlled) bay shrimping (13%). About 6% of people interviewedrecommended continued monitoring of water quality. Only 3% (1 respondent for each response)suggested imposing fines on polluters, limiting shoreline development, improving freshwater inflow,limiting dredging, devising management guidelines for turbidity and salinity, and allocating moreresearch funding. It is important to note that 50% of people interviewed made no suggestions formanagement actions.
Figure III.21. Number of people interviewed who provided a particular resourcerecommendation.

81
Numerous research recommendations were made. In general, these suggestions included greaterfunding for long-term studies, collection of consistent data, and faster, more efficient, collection ofinformation. Other suggestions include gauging freshwater inflow into Baffin Bay, determining effectsof trawling, assessing societal costs of environmental degradation, and investigating indirect economiceffects of resource management activities.
Most respondents expressed a need for more research (Fig. III.19). The following questions representthe highest priority research issues with respect to management of resources in the CCBNEP study area.
• How does removal of organisms due to trawling affect food webs?• What factors are responsible for maintaining brown tide?• How much freshwater is required to maintain sustainable yields of natural resources?• What are quantitative benthic effects of the input of ground water from septic tanks?• How does brown tide influence community dynamics?

82
IV. DISCUSSION One of the most challenging undertakings in applied ecology is to detect effects of anthropogenicdisturbances. It is difficult because natural variation is usually high in almost all variables. Many timesmean values are not as interesting as variance of variables (Green and Montagna, 1996). This isbecause the nature of disturbance is to change the range of responses, therefore increasing variance of aresponse. When statistically analyzing disturbances, there are two potential problems: failing to detectdifferences that exist, and overlooking differences that occur. Failure to detect a difference that exist,called the Type II error, is often due to a lack of power in a study design. When this occurs, naturalvariability is so large that means for a disturbed site and an undisturbed site are not statisticallysignificantly different. Failure to detect real differences occurs only when means, and not variances, arecompared. The goal of the following discussion is to synthesize information on relative contributions ofdifferent disturbances, to compare disturbance effects in different habitats, and to examine effects ofanthropogenic disturbances on vegetated and unvegetated habitats of estuaries of the CCBNEP studyarea.
A. Relative Contribution of Anthropogenic and Natural Disturbances Natural disturbances identified and reported include: storms, floods, droughts, sediment resuspension,sediment deposition, and bioturbation. Anthropogenic disturbances identified and reported on include:shrimp trawling, dredging, commercial marine operations, marine construction, and the chemicalindustry. Some disturbances do not fit easily into the two categories, but have characteristics of bothnatural and anthropogenic disturbances. Three disturbances that affect benthos are difficult to classify as either natural or anthropogenicdisturbances: reduced freshwater inflows, altered circulation patterns, and brown tide bloom. For eachof these disturbances, there is a strong natural component, but it is highly likely human activitiesexacerbate the degree of disturbance. The CCBNEP study area is in a semi-arid climate zone, but manhas further reduced natural inflow rates. The region has a natural microtidal range with high residencetimes, yet channelization has further restricted, or redirected, current flow. Algal blooms often resultfrom eutrophication due to man’s activities, but it is unknown if this is the case for brown or red tides.Even when it is clear which disturbances are natural and which are due to anthropogenic influence, it isnot easy to determine relative contribution of each. Freshwater inflows are subject to extreme year-to-year natural variability in the CCBNEP study area.The southern part of the CCBNEP study area is typically water deficient and often hypersaline due toclimatology. During droughts, hypersalinity is common throughout the area. These observations leadto speculation that bays in the area contain organisms and communities adapted to high and variablesalinity. A consequence of this hypothesis is the suggestion that inflow reduction is unimportant,because organisms are already adapted to drought disturbance, which is natural. However, we havebeen unable to uncover any studies that support this hypothesis. Furthermore, ecological theory(Section I.C.) and our own research (Section III.B.2) do not support the hypothesis

83
that there is a “desert estuarine” community. Instead, theory and data indicates communities respond todisturbance on any scale one event at a time. Because theory (Figure I.3) and empirical data (TableIII.11; Figures III.11-12) indicate reduced freshwater inflow leads to community change and reducedproductivity, long-term reduced inflows due to reservoir construction are most likely an anthropogenicdisturbance. Because estuaries of the CCBNEP study area are already stressed by naturally low rates ofinflow, the estuaries should be considered especially sensitive to anthropogenic reductions of inflowrates. The correct analogy to deserts is: arid environments are fragile and can take long time periods torecover from disturbance. A secondary inflow issue is the dam itself. Dams reduce sediment loadings to bays that are undergoingsubsidence due to water and hydrocarbon extraction. This results in vegetated habitat loss due tosediment starvation and deepening of bay bottoms. Dams also alter freshwater habitats critical to somespecies. Hypoxia in Corpus Christi Bay results from water column stratification, which leads to oxygen depletionin bottom water (Figure III.18). Oxygen depletion is a natural result of high temperatures, productivity,and hence high respiration rates of benthos. However, it is not certain stratification is natural or causedby anthropogenically altered circulation patterns. Hypoxia is confined to a portion (perhaps 25% orless) of the southeast part of the bay. Hypersaline bottom water appears to come from Oso Bay, andappears to be well-mixed in northern and western parts of Corpus Christi Bay. Isolation of hypoxicwater indicates altered circulation probably plays an important role in both introduction of hypersalinewater and confinement of water to that part of the bay. Because of the uncertainty, this is aninformation gap that must be be filled with physical hydrographic studies. Ironically, hypoxia may berelated to low inflows as well, because hypoxia may not appear during years with heavy rainfall and lowsalinity (Figure III.18). Because of interaction between altered inflows and altered circulation, hypoxiais also probably exacerbated by anthropogenic disturbance. Both reduced inflow and hypoxia lead to reductions of benthic productivity, so they are clearly seriousdisturbances. Low inflow rates are exacerbated by reduced releases and hypoxia is exacerbated by bothlow inflow and altered circulation. Therefore, a preliminary conclusion is both reduced inflow andhypoxia are mainly anthropogenic disturbances. In this regard, these two disturbances are similar toshrimp trawling, dredging and marine operations and construction. In many places around the world, nuisance and harmful phytoplankton blooms are traceable to increasedanthropogenic inputs of various compounds into coastal waters (Smayda and Shimizu, 1993). In somecases biocides cause a breakdown of grazer control allowing phytoplankton biomass to increase. Inother cases, inputs of limiting nutrients cause increased phytoplankton growth, a process callednutrification, or eutrophication. However, there is no data to suggest appearance of brown tidecorrelates with increased nutrient inputs of terrestrial origin. Studies to determine relative importanceof new (terrestrial) nutrients and old (recycled from bay sediments) nutrients in maintaining thepersistence of the brown tide are currently underway. The brown tide bloom began with simultaneousoccurrence of three events: grazer control disruption (probably due to hypersalinity), a nutrient pulse(due to a freeze-induced fish kill), and an unstable ecosystem (also probably due to hypersalinity) thatwas conducive to a “weed species” bloom (Buskey et al., 1997).

84
Although it appears that brown tide is a natural event, it is interesting to note low inflow rates and highsalinity may have played a role in at least two of the three possible causes of the bloom. Once again, wesee that rather than being separate, natural and anthropogenic influences are synergistic. Shrimp trawling leads to three issues: physical disturbance of sea floor, higher turbidity, and bycatch. Itappears about 80% (of weight) of shrimp trawl harvest in the CCBNEP study area is bycatch (SectionIII.A.1.1.7). Although direct loss of benthic species is minimal, there may be ecological effects due toalteration of predator densities, and alteration of the nitrogen balance in the ecosystem (Figure III.6).Predator or prey removal is a very serious scientific issue. Although we do not fully understand effectsof the trophic cascade caused by predator or prey removal, it is clear that community structure in thebay is being altered. Bycatch affects nutrient recycling as well, because organisms removed no longercontribute to processing of material and flow of energy in the ecosystem. It has been suggested a 50%reduction of bycatch in the Gulf of Mexico would lead to substantial increases in shrimp populations(Browder, 1991). Finally, the only issue for which impacts have not been clearly defined is effect ofsediment disturbance by trawling, even though the issue was first recognized as early as 1376 (Graham,1955). However, based on studies outside the CCBNEP study area, we can expect this disturbance willlead to communities with fewer molluscs (Messieh et al., 1991), and reduced benthic biodiversity ingeneral (Dayton et al., 1995). Dredging and dredge-spoil disposal is another large-scale anthropogenic disturbance. Main effects onbenthos are removal, smothering, and turbidity related (Section III.A.3). Apparently, benthos canrecolonize dredge spoil rapidly (Rhoades et al., 1978). Turbidity has negative effects on suspension andfilter-feeding benthos (Section III.A.5), but main effects appear to be on vegetated habitats (TableIII.1). Seagrasses may be buried and die and increased turbidity decreases light, and thus decreasesphotosynthesis. Seagrass habitats up to 1.2 km away from dredging can be affected (Onuf, 1994).Elevation change of the sediment surface is also a more serious disturbance for vegetated than non-vegetated habitats. Commercial and recreational boat traffic have different impacts, depending on vessel draft. Commercialtraffic may increase turbidity and erosion, and decrease biodiversity of infaunal species along shoals nearshipping lanes (Flint and Younk, 1983). Propeller scars from recreational boating over seagrass bedsappear to be a problem where depths average < 1 m (3 ft). Long-term damage can occur due topropeller scarring (Phillips, 1960; Zieman, 1976; Durako et al., 1992). Extent of propeller damage inthe CCBNEP study area appears to be greater than originally anticipated (Volume II). Losses ofseagrass bed habitat will have concomitant effects on benthos, fish and wildlife that utilize the habitat. In general, soft-bottom benthic communities in the CCBNEP study area appear to be in a state ofconstant disturbance. Evidence for this conclusion is: 1) communities are dominated by polychaetes andmolluscs are rare, 2) dominant species with life history characteristics typical of pioneering, not climaxspecies, and 3) diversity is generally low. Two natural processes are most likely responsible for thiscondition: low freshwater inflow and high turbidity. Low freshwater inflow rates combine with highevaporation rates to yield relatively high salinities, even hypersalinity. High turbidities are found in thearea because of extensive fetch across large, shallow bays, which allows high

85
average wind speeds to produce high rates of sediment resuspension. High turbidity limits seagrassdistribution and negatively affects molluscs. Natural high turbidity is exacerbated by anthropogenicactivities (e.g., dredging, trawling, and ship traffic). Anthropogenic disturbances of reduced inflows,dredging, and shrimp trawling exacerbate all natural stresses to the ecosystem. Effects of anthropogenicdisturbances are multiplicative and synergistic with naturally occurring disturbances. Multiple stressors affect the ecosystem. It is not possible, with the current state of knowledge, topartition the percent contribution of each individual stressor to the total stress on the environment. Oneproblem is that most of the disturbances occur in different benthic habitats, and affect differentecological processes. In some cases, disturbances affect energy flow, and in others, it affectscommunity structure. Therefore, trying to compare disturbances is like comparing apples and oranges.It is possible to contrast multiple stressors, but it must be done within the context of a single study andwith a single currency. One possible approach is to create an ecosystem model. A good example of thisapproach is the study of shrimp bycatch effects (Browder, 1991). It is not possible to distinguish howmuch diversity loss or productivity decline is due to any individual stress alone. Instead, all studiesreport on cumulative effects of both natural and anthropogenic disturbances, whether or not this isexplicitly stated by the authors.
B. Comparison of Anthropogenic and Natural Disturbances in Different Areas In some instances, information exists that allows direct comparison of anthropogenic and naturaldisturbances. In these cases, the same ecological processes are affected and responses are measured inthe same units. However, even in these cases, effects of various anthropogenic disturbances arerestricted to areas where human activities occur. For any disturbance, the main cause and effect is sitespecific. Dredging removes substrate, increases turbidity, and reduces light that seagrasses need for growth.Although benthic organisms are removed by dredging and smothered by dredge spoil, soft-bottombenthic communities recover within a year. Therefore, it appears dredging disturbs seagrasses morethan soft-bottom benthos. Based on habitat distribution, dredging is potentially more of a problem inUpper Laguna Madre than in Corpus Christi Bay or other bays in the CCBNEP study area. Shrimp trawling creates a constant mechanical disturbance to the bottom. Removal of non-targetspecies from the ecosystem can alter food web structure and function. Shrimping is more or lessrestricted to open bays. Therefore, shrimp trawling affects soft bottom benthos more than vegetatedhabitats, so it is an issue in open bays where most shrimping occurs (e.g., Aransas Bay and CorpusChristi Bay). Freshwater inflow reduces salinity and transports nutrients and organic matter to the estuary. Filter-feeding and suspension-feeding organisms are dependent on inflows. Therefore, reduced freshwaterinflows primarily disturb secondary bays, where estuarine or brackish communities should bedominating (e.g., Nueces Bay or Copano Bay). Oyster harvest in South Texas is a fraction of harvest inmore northern bays, because of naturally low inflow rates. However, as inflow rates are reduced,

86
existing populations are further stressed. Tertiary bays of Baffin Bay are also negatively affected byreduced inflow, but this is natural. Hypersalinity exists in Baffin Bay and Upper Laguna Madre most ofthe time. It also exists in Nueces, Corpus Christi, Copano and Aransas Bays during droughts.Hypersalinity is a severe disturbance that affects the entire CCBNEP study area and results in reducedbenthic biodiversity and productivity. Only Upper Laguna Madre appears to be resilient to hypersalinityresulting in the highest finfish landings for all bays in Texas. The relatively high benthic biodiversity andproductivity there is due to the presence of extensive seagrass habitat. Low freshwater inflow rates arenatural in the study area, but man’s activities has further reduced these inflows, and restrictedcirculation. The net effect is hypersalinity, even in marginally dry years. Brown tide has altered food web structure and reduced light to the bottom. However, brown tide isfound mostly in Baffin Bay and Upper Laguna Madre. Therefore, it is mainly a problem in UpperLaguna Madre because of seagrasses. Decline in areal extent of seagrass habitat in Upper LagunaMadre has already been detected. If this continues, conversion of seagrass to unvegetated bare bottomis likely and Upper Laguna Madre will resemble Baffin Bay. Baffin Bay has the lowest benthicbiodiversity and productivity of any bay in the CCBNEP study area, primarily due to low freshwaterinflow. Hypoxia appears to be restricted to the southeastern portion of Corpus Christi Bay in summer (mid Juneto early August). Hypoxia affects benthos more than nekton, and seagrasses are not found in this area.Therefore, hypoxia is mainly a problem to benthos of the identified area. Hydrocarbon exploration and production occurs almost everywhere in the CCBNEP study area.However, produced water discharges are concentrated in Nueces Bay. This is especially unfortunatebecause Nueces Bay is a valuable nursery habitat for many important species, which is already stressedwith low freshwater inflow. Pipeline construction across marshes and seagrass beds are another specialconcern because these are valuable habitats. These effects appear to be constrained to Nueces Bay andUpper Laguna Madre. The Corpus Christi Ship Channel is a site of special concern because of thepotential for transportation accidents. It is well recognized that spills in coastal estuarine habitats havehigh potential for ecological damage and long-term effects. Fortunately major accidents are rare andmost incidences occur in the Corpus Christi Ship Channel, which is a man-made enclosed area wherespills can be spotted and controlled rapidly. The high incidence of spills and kills in Corpus Christi Bayillustrate this potential. Overall, it appears that estuaries in the CCBNEP study area are in a naturally stressful environment dueto the semi-arid climate and low microtidal range. These two natural stressors insure that any of man’sactivities that add to stress in the ecosystem have severe impacts. Stressors are also synergistic. Thenet effect of low freshwater inflow rates and restricted circulation is greater than the sum of its parts.

87
V. DATA AND INFORMATION GAPS Understanding environmental issues requires technical information. Environmental issues are complexbecause of the variety of information needed, natural variability, and interactions among multiplestressors. To understand complex environmental problems one needs information on the environment,species in question, and how to separate and independently assess each stressor. This is almostimpossible to do with just field studies or monitoring alone. Experimental studies are also required. Ingeneral, there is a need for explicit, quantitative understanding of the effects of most disturbances. Population levels of desirable species fluctuate. To assess the importance of disturbance in causingfluctuations, it is not possible to rely on just the number of organisms censussed. The populationdensity indicates the net number of organisms. Individuals are gained and lost from a population due tomany different processes. Information about population dynamics, e.g., age specific birth rates, age-specific survival rates (which includes natural death, predation, and losses due to other environmentalissues), immigration and emigration rates, and population size are also needed. Experimental exposuresto disturbances are also needed to prove that results from field monitoring studies are more thancorrelative. Finally, homogeneity does not exist in any population in spatially heterogeneousenvironments. In the CCBNEP study area we typically lack detailed data on life history, food webstructure and function, and benthic-pelagic coupling for many important species. This kind of data goesbeyond the scope of routine monitoring studies. The above example demonstrates that environmental problems are enormously complex, don’t lendthemselves to simple reductionist experimentation, and exist within the context of natural backgroundvariability in space and time. Anthropogenic disturbances occur concurrently with other anthropogenicand natural disturbances. We have virtually no information from elsewhere, as well as from within theCCBNEP study area, on the mechanisms, interactions, or synergistic responses among multiplestressors. Studies are often performed on a single issue and assume other effects can be ignored. Thereis a need for environmental studies at the multidisciplinary systems level. Notwithstanding the need for systems level research and information on interactions among multiplestressors, there are two kinds of specific data gaps: issues data gaps and site data gaps. First,conclusions on many of the issues reviewed in the present study were based on data from outside theCCBNEP area. Specific studies in the CCBNEP study area are needed on the following:
• Effects of freshwater inflow on productivity.• By-catch and mechanical disturbance effects of shrimp trawling on bay benthos and food webs.• Estuarine physical circulation patterns to understand causes and maintenance of hypoxia. In
particular, all current physical models in use in the CCBNEP study area are two-dimensional or 1.5-dimensional and assume a well mixed water column, so they cannot predict stratification andhypoxia that occurs.

88
Second, data in the CCBNEP study comes from just a few restricted sites. We have some data fromUpper Laguna Madre and Baffin, Corpus Christi and Nueces Bays.
• Almost no data exists on benthos and benthic habitats north of Aransas Pass. This includes Copano,Aransas, and St. Charles Bays. This data gap is especially important because the area has differentinflow conditions than bays south of Aransas Pass and different uses in the watersheds.
• We also lack data on Redfish Bay, which is the lagoonal linkage between Corpus Christi andAransas Bays. The role of lagoonal bays, which connect primary bays, in maintaining productivityin the CCBNEP study area is unknown.
89
VI. CONCLUSION
Benthic habitats of the CCBNEP study area, including both vegetated and unvegetated bottoms, arediverse. Vegetated bottoms provide critical habitat for numerous fish and wildlife with commercial andrecreational value. Primary stresses to vegetated habitats are from both natural disturbances (e.g.,brown tide) and anthropogenic disturbances (e.g., dredging and propeller scarring). However, thesestresses are also synergistic. For instance, reduced light due to man’s activities is especially acuteduring current low light conditions created by brown tide. Unvegetated habitats include bay bottomsand oyster reefs. Oyster reefs are relatively small and cover small areas of the CCBNEP study arearelative to the northern estuaries of Texas. Bay bottoms are mostly soft-bottom benthic habitatconsisting of mud, sand, and mud-sand sediments. Bay bottoms are the most important fishery habitat,providing a bounty of shrimp each year, and providing the food chain that supports fish speciesimportant to commercial and recreational anglers. Primary stresses to bay bottoms are from naturallylow inflow/evaporation ratios and concomitant high salinities, and from anthropogenic disturbances(e.g., spills, hypoxia, freshwater diversion, and shrimp trawling). Synergistic interactions between threenatural features of the CCBNEP study area (low inflow rates, low tidal energies, and high turbidity) andthree anthropogenic disturbances (reduced inflows, altered circulation, and shrimp trawling) appear tobe responsible for generally low productivity and low biodiversity found in open bays. This manifestsitself in an environment characterized by hypersalinity, seasonal hypoxia, high sediment turnover rates,and high turbidity levels. The biotic result is a benthic community dominated by polychaetes,depauperate in molluscs and large benthos that live in deeper sediments, and monospecific nuisancealgal blooms. It is highly likely that there are synergistic relationships among the multiple stressors.Sufficient information does not exist to determine the quantitative benefit if any, or all, anthropogenicdisturbances could be reduced or eliminated. It is also possible that reduction in any one of them wouldyield a disproportionate benefit to the ecosystem. Although data is insufficient to be certain whichdisturbance that might be, results of this literature review indicate inflow diversion is the largestproblem, because it has synergistic effects on almost all other natural and anthropogenic disturbances.However,widespread catastrophic impacts are likely to occur during a major oil transportationaccident.
90
VII. REFERENCES
Alongi , D. M. and P. Christoffersen. 1992. Benthic infauna and organism-sediment relations in ashallow, tropical coastal area: influence of out-welled mangrove detritus and physicaldisturbance. Marine Ecology Progress Series 81:229-245.
Anderson, D .J. 1986. Ecological succession. in: Community ecology: pattern and process. Kikkawa,B. J. and D. J. Anderson (eds.). Boston: Blackwell Scientific Publications. pp. 269-285.
Amos, A. F., S. C. Rabalais, and R. S. Scalan. 1983. Oil-filled Callianassa burrows on a Texas barrier-island beach. Journal of Sedimentary Petrology 53:411-416.
Armstrong, H. W., K. Fucik, J. W. Anderson and J. M. Neff. 1979. Effects of oilfield brine effluent onsediments and benthic organisms in Trinity Bay, Texas. Marine Environmental Reseach 2:55-69.
Andrew, N. L. and J. G. Peppernell. 1992. The bycatch of shrimp trawl fisheries. Oceanography andMarine Biology Annual Review 30:527-565.
Anonymous. 1995. Shrimp fishery bycatch reduction. Gulf and South Atlantic Fisheries DevelopmentFoundation. Final Report to NOAA pursuant to award NA47FM0131.
Atkinson, D. B. 1984. Discarding of small redfish in the shrimp fishery Port au Choix, Newfoundland,1976-80. Journal Northwest Atlantic Fisheries. Society 5:99-102.
Baird, C., J. Marshall, D. Ockerman, and T. Dybala. 1996. Characterization of nonpoint sources andloadings to the Corpus Christi Bay National Estuary Program study area. Technical Report No.5 of the Corpus Christi Bay National Estuary Program. Texas Natural Resources ConservationCommission, Austin, Texas. 226 p.
Boesch, D. F. and N. N. Rabalais (eds.). 1987. Long-term environmental effects of offshore oil andgas development. Elsevier Applied Science, London. 696 pp.
Bomar, G. W. 1983. Texas weather. University of Texas Press, Austin. 265 pp.
Boyd, N. M., B. Fuls and L. W. McEachron. 1994. Trends in relative abundance and size of selectedfinfishes and shellfishes along the Texas coast: November, 1975 - December, 1992.Management Data Series, No. 112.
Brehmer, M. L. 1965. Turbidity and siltation as forms of pollution. Journal of Soil and WaterConservation 20:132-133.
Brenchley, G. A. 1981. Disturbance and community structure: an experimental study of bioturbation inmarine soft-bottom environments. Journal of Marine Research 39:767-790.

91
Britton, J. C. and B. Morton. 1989. Shore ecology of the Gulf of Mexico. University of Texas Press,Austin, TX. 387 pp.
Broks, K. M. 1996. Evaluating the environmental risks associated with the use of chromated copperarsenate-treated wood products in aquatic environments. Estuaries 19:296-305.
Browder, J. 1991. Panel 1. Effects of shrimp trawl bycatch on finish populations and ecosystems. in:Proceedings of the Shrimp Trawl Workshop. Center for Marine Conservation, Washington D.C.pp. 5-7.
Brown, L. F., Jr., R. A. Morton, J. H. McGowen, C. W. Kreitler and W. L. Fisher. 1974. Naturalhazards of the Texas coastal zone. University of Texas Bureau of Economic Geology. Austin,Tx. 13 pp.
Brown, L. F., Jr. 1977. Environmental geologic atlas of the Texas coastal zone: Brownsville-Harlingen area. University of Texas Bureau of Economic Geology. Austin, Texas. 131 pp.
Buskey, E. J., Montagna, P. A., Amos, A. F., and Whitledge, T. E. 1997. Disruption of grazerpopulations as a contributing factor to the initiation of the Texas brown tide algal bloom.Limnology and Oceanography 42:1215-1222.
Caddy, J. F. 1973. Underwater observations on tracks of dredges and trawls and some effects ofdredging on a scallop ground. Journal of the Fisheries Research Board of Canada 30:173-180.
Campbell, P. 1996. Personal Communication.
Campbell, R. P. and P. C. Choucair. 1995. Characterization of finfish bycatch of private-boatrecreational anglers in Texas marine waters. Final report to NOAA National Marine FisheriesService, Saltonstall-Kennedy Grant Program.
Carr, R. S., D. C. Chapman, C. L. Howard and j. M. Biedenbach. 1996. Sediment quality triadassessment survey of the Galveston, Bay, Texas system. Ecotoxicology 5:341-364.
Caudle, C. S. 1995. An impact assessment of produced water discharges to Nueces Bay - August1993. Texas Natural Resource Conservation Commission, Austin. 30 pp.
Churchill, J. H. 1989. The effect of commercial trawling on sediment resuspension and transport overthe Middle Atlantic Bight continental shelf. Continental Shelf Research 9:841-864.
Clark, D. and T. Miller-Way. 1992. An environmental assessment of the effects of open-water disposalof maintenance dredged material on benthic resources in Mobile Bay, Alabama. Report number:Miscellaneous Paper D-92-1, US Army Engineer Waterways Experiment Station, Vicksburg,MS.

92
Clements, F. E. 1916. Plant Succession: an analysis of the development of vegetation. CarnagieInstitute of Washington: Washington. 512 pp.
Clements, F. E. 1936. Nature and structure of the climax. Journal of Ecology 28:254-422.
Cody, T., P. C. Hammerschmidt, G. C. Matlock, C. E. Bryan, J. E. Clark, and R. P. Campbell. 1989.Texas Shrimp Fishery Management Plan. Fishery Management Plan Series, No. 2. Texas Parksand Wildlife Department, Coastal Fisheries Branch. Austin, Texas. 57 p.
Commito, J. A. 1982. Importance of predation by infaunal polychaetes in controlling the structure of asoft-bottom community in Maine, USA. Marine Biology 68:77-81.
Conley, M. F. 1996. Effect of a persistent brown tide on macroinfaunal communities in Baffin Bay andLaguna Madre, Texas. Masters Thesis, University of Texas at Austin, Department of MarineScience.
Conley, M. F., P. A. Montagna, R. D. Kalke, D. A. Stockwell. Relationship between macroinfaunaldiversity and community stability, and a disturbance caused by a persistent brown tide bloom. Inpreparation.
Connell, J. H. and R. O. Slatyer. 1977. Mechanisms of succession in natural communities and their rolein community stability and organization. The American Naturalist 111:1119-1144.
Cowles, H. C. 1899. The ecological relations of the vegetation on the sand dunes of Lake Michigan.Botanical Gazette 27:95-117, 167-202, 281-308, 361-391.
Cowles, H. C. 1901. The physiographic ecology of Chicago and vicinity; a study of the origin,development, and classification of plant societies. Botanical Gazette 31(2):73-182.
Crowe, A. L. and C. E. Bryan. 1986. A description of the Texas shrimp fleet, 1979 - 1983.Management Data Series, No. 101. Texas Parks and Wildlife Department, Coastal FisheriesDivision. Austin, Texas. 11 p.
Crowe, A. L. and C. E. Bryan. 1987. Trends in composition of the Texas commercial shrimp fleet.Management Data Series, No. 121. Texas Parks and Wildlife Department, Coastal FisheriesDivision. Austin, Texas. 11 p.
Cullen, D. J. 1973. Bioturbation of superficial marine sediments by interstitial meiobenthos. Nature242:323-324.
Cyrus, D. P. and S. J. M. Blaber. 1992. Turbidity and salinity in a tropical northern Australian estuaryand their influence on fish distribution. Estuarine, Coastal and Shelf Science 35: 545-563.

93
Dankers, N. and D. R. Zuidema. 1995. The role of the mussel (Mytilus edulis L.) and mussel culture inthe Dutch Waden Sea. Estuaries 18:71-80.
Dauer, D. M. 1993. Biological criteria, environmental health and estuarine macrobenthic communitystructure. Marine Pollution Bulletin 26:249-257.
Dayton, P. K., S. F. Thrush, M. T. Agardy, and R. J. Hofman. 1995. Environmental effects of marinefishing. Aquatic Conservation: Marine and Freshwater Ecosystems. 5:205-232.
De Jonge, V. N. and J. Van den Bergs. 1987. Experiments on the resuspension of estuarine sedimentscontaining benthic diatoms. Estuarine, Coastal, and Shelf Science 24:725-740.
Department of the Army, Corps of Engineers. 1995. Waterborne commerce of the United States. Part2 - Waterways and harbors Gulf Coast, Mississippi River System and Antilles, for calendar year1994. Water Resources Support Center WRSC-WCUS-94-2.
DePatra, K. D. and L. A. Levin. 1989. Evidence of the passive deposition of meiofauna into fiddlercrab burrows. Journal of Experimental Marine Biology and Ecology 125:173-192.
Ditton, R. B. 1977. Coastal Resources Management. Lexington, MA:Lexington Books. 196 pp.
D’Unger, C., D. Chapman and R. S. Carr. 1996. Discharge of oilfield-produced water in Nueces Bay,Texas: case study. Environmental Management 20:143-150.
Dunton, K.H. 1994. Seasonal growth and biomass of the subtropical seagrass Halodule wrightii inrelation to continuous measurements of underwater irradiance. Marine Biology 120:479-489.
Durako, M. J., M. O. Hall, F. Sargent, and S. Peck. 1992. Propeller scars in seagrass beds: anassessment and experimental study of recolonization in Weedon Island State Preserve, Florida.In: Proceedings of the 19th Annual Conference of Wetland Restoration and Creation, Weeb, F.(ed.), Hillsborough Community College, Tampa, Fl. pp. 42-53
Edwards, S. F. 1987. An introduction to coastal zone economics: concepts, methods, and case studies.New York, NY:Taylor and Francis. 134 pp.
Eleuterius, L.N. 1987. Seagrass ecology along the coasts of Alabama, Louisiana, and Mississippi. In:Proceedings of the symposium on subtropical-tropical seagrasses of the Southeastern UnitedStates, Durako, M. J., Phillips, R. C., and Lewis, R. R., III, (eds.), Florida Department ofNatural Resources. St. Petersburg, Florida, pp. 11-24.
Ellis, M. J. 1986. The Hurricane Almanac. Caribbean Blue, Inc. Portland, Texas. 168 pp.
Ellis, M. M. 1936. Erosion silt as a factor in aquatic environments. Ecology 17:29-42.

94
Engler, R. M. 1990. Managing dredged materials. Oceanus 33:63-69.
Fegley, S. R. 1988. A comparison of meiofaunal settlement onto the sediment surface andrecolonization of defaunated sandy sediment. Journal of Experimental Biology and Ecology123:97-113.
Fesenmaier, D. R., S. Um, W. S. Roehl, A. S. Mills, T. Ozuna, Jr., L. L. Jones and R. Guajarado Q.1987. Regional and statewide economic impacts of sportfishing, other recreational activities,and commercial fishing associated with bays and estuaries of the Texas Gulf Coast. TAES,Texas A&M Univ. College Station, Texas, 55 pp.
Fisher, W. L. 1973. Environmental carrying capacity: a geologic basis for management in the Texascoastal zone. Abstracts with Programs:621.
Flint, R. W. and R. D. Kalke. 1986. Biological enhancement of estuarine benthic community structure.Marine Ecology Progress Series 31:23-33.
Flint, R. W. and J. A. Younk. 1983. Estuarine benthos: long-term community structure variations,Corpus Christi Bay, Texas. Estuaries 6:126-141.
Floderus, S., and L. Pihl. 1990. Resuspension in the Kattegat: Impact of variation in wind climate andfishery. Estuarine, Coastal and Shelf Science 31: 487-498.
Fonseca, M. S., Fisher, J. S., Zieman, J. C. and Thayer, G. W. 1982. Influence of the seagrass, Zosteramarina L., on current flow. Estuarine, Coastal and Shelf Science 15:351-364.
Food and Agriculture Organization. 1994. A global assessment of fisheries bycatch and discards. U.N.FAO Fish. Tech. Paper No. 339.
Forbes, T. L., V. E. Forbes, and M. H. Depledge. 1994. Individual physiological responses toenvironmental hypoxia and organic enrichment: implications for early soft-bottom communitysuccession. Journal of Marine Research 52:1081-1100.
Fuls, B. 1995. Assessment of composition and magnitude of bycatch associated with the commercialshrimp trawling industry in the central lower Texas coastal bays during the spring and fall Texascommercial bay-shrimp open seasons. Final report for the Saltonstall-Kennedy Grant Program.Texas Parks and Wildlife Department, Rockport, Texas.
Gallagher, E. D., P. A. Jumars, and D. D. Trueblood. 1983. Facilitation of soft-bottom benthicsuccession by tube builders. Ecology 64:1200-1216.
Ginsburg, R. N. and Lowenstam, H. A. 1956. The influence of marine bottom communities on thedepositional environment of sediments. Journal of Geology. 66. 310-318.

95
Graham, M. 1955. Effect of trawling on animals of the sea bed. Deep-Sea Research (Papers in MarineBiology and Oceanography) Suppl. to Vol. 3: 1-6.
Grassle, J. F. and L. S. Morse-Porteous. 1987. Macrofaunal colonization of disturbed deep-seaenvironments and the structure of deep-sea benthic communities. Deep Sea Research 34:1911-1950.
Green, R. H. and P. Montagna. 1996. Implications for monitoring: study designs and interpretation ofresults. Canadian Journal of Fisheries and Aquatic Sciences 53:2629-2636.
Gunter, G. 1945. Studies on marine fishes of Texas. Publications of the Institute of Marine Science1:1-190.
Hall, S. J., D. Raffaelli, and S. F. Thrush. 1994. Patchiness and disturbance in shallow water benthicassemblages. In: Aquatic ecology: scale, pattern, and process, Hildrew, A. G., R. D. Raffaelliand P.S. Giller (eds.), Blackwell Scientific Publications, Oxford, pp. 333-375.
Hayes, J. W., and M. J. Rutledge. 1991. Relationship between turbidity and fish diets in Lakes Waahiand Whangape, New Zealand. New Zealand Journal of Marine and Freshwater Research 25:297-304.
Henry, W. K., D. M. Driscoll and J. P. McCormack. 1975. Hurricanes of the Texas Coast. Center forApplied Geosciences, Texas A&M Univ. College Station, Texas. 48 pp.
Hoar, P., J. Hoey, J. Nance and C. Nelson. 1992. A research plan addressing finfish bycatch in theGulf of Mexico and South Atlantic shrimp fisheries. Gulf and South Atlantic FisheryDevelopment Foundation, Tampa, Florida.
Holmes, C. W., C. J. McLerran, and E. A. Slade. 1973. Biological activity and channelization asfactors in the distribution and sedimentation of heavy metals in two marine estuarine systems.Abstracts with Programs - Geological Society of America 5:673.
Horn, H. S. 1974. The ecology of secondary succession. Annual Review of Ecology and Systematics5:25-37.
Hudson, A. V. and R. W. Furness. 1988. Utilization of discarded fish by scavenging seabirds behindwhitefish trawlers in Shetland. Journal of Zoology 215:151-166.
Iversen, E. S., D. M. Allen, and J. B. Higman. 1993. Shrimp capture and culture fisheries of the UnitedStates. Halsted Press. New York. 247 p.
James, W. P., S. Giesler, R. DeOtte and M. Inoue. 1977. Environmental considerations relating tooperation and maintenance of the Texas Gulf Intercoastal Waterway. Texas A&M UniversitySea Grant Publ., TAMU-SG-78-204, College Station, Texas.
96
Jokiel, P. L. 1989. Effects of marine mining dredge spoils on eggs and larvae of a commerciallyimportant species of fish, the Mahimahi (Coryphaena hippurus). Marine Mining 8: 303-315.
Jones, J. B. 1992. Environmental impact of trawling on the seabed: a review. New Zealand Journal ofMarine and Freshwater Research 26: 59-67.
Jones, L. L. 1997. Economic impacts on regional and State economies of human uses of the coastalresources of the Corpus Christi Bay National Estuary Program Study Area. Technical ReportNo. 16 of the Corpus Christi Bay National Estuary Program. Texas Natural ResourcesConservation Commission, Austin, Texas. 62 p.
Kaiser, M. J., and B. E. Spencer. 1994. Fish scavenging behaviour in recently trawled areas. MarineEcology Progress Series 112: 41-49.
Kaiser, M. J., and B. E. Spencer. 1996. The effects of beam-trawl disturbance on infaunal communitiesin different habitats. Journal of Animal Ecology 65: 348-358.
Kalke, R. and P. A. Montagna. 1991. The effect of freshwater inflow on macrobenthos in the LavacaRiver delta and upper Lavaca Bay, Texas. Contributions in Marine Science 32:49-77.
Kelly, J. R., T. W. Duke, M. A. Harwell and C. C. Harwell. 1987. An ecosystem perspective onpotential impacts of drilling fluid discharges on seagrasses. Environmental Management 11:537-562.
Kennelly, S. J. 1992. The effect of shrimp trawling bycatch other commercial and recreational fisheries- an Australian perspective. In: International Conference on Shrimp Bycatch. SoutheasternFisheries Association, Tallahassee, Florida, pp. 97-114.
Kennelly, S. J. 1995. The issue of bycatch in Australia’s demersal trawl fishery. Reviews in FishBiology and Fisheries. 5:213-234.
Kennicutt, M. C., III, Boothe, P. N., Wade, T. L., Sweet, S. T., Rezak, R., Kelly, F. J., Brooks, J. M.,Presley, B. J. and Wiesenburg, D. A. 1996. Geochemical patterns in sediments near offshoreproduction platforms. Canadian Journal of Fisheries and Aquatic Sciences 53:2554-2566.
Knott, D. M., E. L. Wenner and P. H. Wendt. 1997. Effects of pipeline construction on th evegetationand macrofauna of two South Carolina, USA salt marshes. Wetlands 17:65-81.
Krost, P., M. Bernhard, F. Werner, and W. Hukriede. 1990. Otter trawl tracks in Kiel Bay (WesternBaltic) mapped by side-scan sonar. Meeresforsch 32: 344-353.
Koch, E. W. and C. J. Dawes. 1991. Influence of salinity and temperature on the germination ofRuppia maritima L. From the North Atlantic and Gulf of Mexico. Aq. Bot. 40:387-391.
97
Lalli, C. M. and T. R. Parsons. 1993. Biological Oceanography: an introduction. ButterworthHeinemann, Oxford, 199pp.
Llansó, R. J. 1991. Tolerance of low dissolved oxygen and hydrogen sulfide by the polychaeteStreblospio benedicti (Webster). Journal of Experimental Marine biology and Ecology 153:165-178.
Leslie, J. K., and C. A. Timmins. 1992. Distribution and abundance of larval fish in Hamilton Harbour,a severely degraded embayment of Lake Ontario. Journal of Great Lakes Research 18: 700-708.
Levin, L. A. and C. R. Smith. 1984. Response of background fauna to disturbance and enrichment inthe deep sea: a sediment tray experiment. Deep Sea Research 31:1277-1285.
Levings, S. C. and S. D. Garrity. 1994. Effects of oil spills on fringing red mangroves (Rhizophoramangle): losses of mobile species associated with submerged prop roots. Bulletin of MarineScience 54:782-794.
Lewis, F. G. and A. W. Stoner. 1983. Distribution of macrofauna within seagrass beds: an explanationfor patterns of abundance. Bulletin of Marine Science 33:296-304.
Lofgren, B. E. 1977. Background studies for appraising subsidence in the Texas Gulf coast region.U.S.G.S. Open-file Report 77-412. U.S. Department of Interior, Geological Survey.
Longley, W. L., ed. 1994. Freshwater inflows to Texas bays and estuaries: ecological relationshipsand methods for determination of needs. Texas Water Development Board and Texas Parks andWildlife Department, Austin, Texas.
Lubchenco, J. and B. A. Menge. 1978. Community development and persistence in a low rockyintertidal zone. Ecological Monographs 59:67-94.
Luckenbach, M. W. 1986. Sediment stability around animal tubes: the roles of hydrodynamicprocesses and biotic activity. Limnology and Oceanography 31:779-787.
Luckenbach, M. 1987. Effects of adult infauna on new recruits: implications for the role of biogenicrefuges. Journal of Experimental Marine Biology and Ecology 105:197-206.
Main, J. and G. I. Sangster. 1981. A study of sand clouds produced by trawl boards and their possibleeffects on fish capture. Scottish Fisheries Research Report No. 20. Dept of Agriculture andFisheries for Scotland. Aberdeen, Scotland. 19 pp.
Mannino, A. and P. A. Montagna. 1996. Fine-scale spatial variation of sediment composition andsalinity in Nueces Bay of South Texas. Texas Journal of Science 48:35-47.

98
Mannino, A. and P. A. Montagna. 1997. Small-scale spatial variation of macrobenthic communitystructure. Estuaries 20:159-173.
Martin, C. M., Montagna, P. A. 1995. Environmental assessment of La Quinta Channel, Corpus ChristiBay, Texas. Texas Journal of Science 47:203-222.
Maurer, D., R. T. Keck, J. C. Tinsman, W. A. Leathem, C. Wethe, C. Lord, and T. M. Church. 1986.Vertical migration and mortality of marine benthos in dredged material: a synthesis.International revue gestam Hydrobiologia 71:49-63.
Matlock, G. C. 1982. Bycatch of southern flounder and gulf flounder by commercial shrimp trawlers inTexas bays. Texas Parks and Wildlife Department, Coastal Fisheries Branch, Management DataSeries, No. 31,
McMillan, C. and Moseley, F. N. 1967. Salinity tolerances of five aquatic spermatophytes of RedfishBay, Texas. Ecology. 48:503-506.
Messieh, S. N., T. W. Rowell, D. L. Peer and P. J. Cranford. 1991. The effects of trawling, dredgingand ocean dumping on the eastern Canadian continental shelf seabed. Continental Shelf Research11: 1237-1263.
Mills, E. L. 1969. The community concept in marine zoology, with comments on continua andinstability in some marine communities: a review. Journal Fisheries Research Board of Canada26(6):1415-1428.
Moffett, A. W. 1970. The shrimp fishery in Texas. Texas Parks and Wildlife Department. Austin,Texas. 38 p.
Montagna, P. A. 1993. Comparison of ecosystem structure and function of created and naturalseagrass habitats in Laguna Madre, Texas. Annual Report to U.S. Environmental ProtectionAgency, Region 6. Marine Science Institute, The University of Texas, Port Aransas, TX, 8 pp.
Montagna, P. A. and D. E. Harper, Jr. 1996. Benthic infaunal long-term response to offshoreproduction platforms. Canadian Journal of Fisheries and Aquatic Sciences 53:2567-2588.
Montagna, P. A. and R. D. Kalke. 1992. The effect of freshwater inflow on meiofaunal andmacrofaunal populations in the Guadalupe and Nueces estuaries, Texas. Estuaries 15:307-326.
Montagna, P. A. and R. D. Kalke. 1995. Ecology of infaunal Mollusca in south Texas estuaries.American Malacological Bulletin 11:163-175.

99
Montagna, P. A., and Li, J. 1996. Modeling and monitoring long-term change in macrobenthos inTexas estuaries. Final Report to the Texas Water Development Board. University of Texas atAustin, Marine Science Institute, Technical Report No. TR/96-001, Port Aransas, Texas, 149pp.
Montagna, P.A., J. Li and G. T. Street. 1996. A conceptual model of the Corpus Christi Bay NationalEstuary Program study area. Technical Report No. 8 of the Corpus Christi Bay NationalEstuary Program. Texas Natural Resources Conservation Commission, Austin, Texas.
Montagna, P. A., D. A. Stockwell and R. D. Kalke. 1993. Dwarf surfclam Mulinia lateralis (Say,1822) populations and feeding during the Texas brown tide event. Journal of Shellfish Research12:433-442.
Montagna, P. A. and W. B. Yoon. 1991. The effect of freshwater inflow on meiofaunal consumption ofsediment bacteria and microphytobenthos in San Antonio Bay, Texas, U.S.A. Estuarine andCoastal Shelf Science 33:529-547.
Moran, P. J. and T. R. Grant. 1989a. The effects of industrial pollution on the development andsuccession of marine fouling communities. I. Analysis of species richness and frequency data.Marine Ecology 10:231-246.
Moran, P. J. and T. R. Grant. 1989b. The effects of industrial pollution on the development andsuccession of marine fouling communities. II. Multivariate analysis of succession. MarineEcology 10:247-261.
Nance, J. M. 1991. Effects of oil/gas field produced water on the macrobenthic community in a smallgradient estuary. Hydrobiologia 220:189-204.
National Marine Fisheries Service. 1990. Evaluation of bycatch reduction devices (BRDs). NMFSPascagoula/Galveston Labs.
NMFS. 1995. Cooperative research program addressing finfish bycatch in the Gulf of Mexico andSouth Atlantic shrimp fisheries: A report to congress. National Marine Fisheries Service.Southeast Regional Office, St. Petersberg, Florida, 55 pp.
Nessmith, C. 1980. Natural and induced revegetation processes in an artificially disturbed seagrassmeadow in Texas. Master’s Thesis. The University of Texas at Austin.
Nichols, S. 1991. Panel 1. Effects of shrimp trawl bycatch on finish populations and ecosystems. In:Proceedings of the Shrimp Trawl Workshop, Center for Marine Conservation, Washington,D.C., pp. 5-7.

100
Nichols, S., A. Shah, G. Pellegrin, Jr. and K. Mullin. 1990. Updated estimates of annual shrimp fleetbycatch in the offshore waters of the Gulf of Mexico. NMFS, Southeast Fisheries Center,Pascagoula Lab.
Odum, E. P. 1969. The strategy of ecosystem development. Science 164:262-270.
Odum, H. T. 1963. Productivity measurements in Texas turtle grass and the effects of dredging anintercoastal channel. Publications of the Institute of Marine Science 9:48-58.
Officer, C. B., R. B. Biggs, J. L. Taft, L. E. Cronin, M. A. Tyler and W. R. Boynton. 1984.Chesapeake Bay Anoxia: origin, development, and significance. Science 223:22-27.
Onuf, C. P. 1994. Seagrasses, dredging and light in Laguna Madre, Texas, U.S.A. Estuarine, Coastal,and Shelf Science 39:75-91.
Oppenheimer, C.H. 1963. Effects of hurricane Carla on the ecology of Redfish Bay, Texas. Bulletin ofMarine Science of the Gulf and Caribbean 13: 59-72.
Orlando, S.P. et al. 1991. Analysis of Salinity Structure and Stability for Texas Estuaries. StrategicAssessment Branch, NOS/NOAA. Rockville, M. 97 pp.
Orth, R. J. 1971. The effect of turtle grass, Thalassia testudinum, on the benthic infauna communitystructure in Bermuda. Bermuda Biological Station Special Report No. 9: 18-37.
Orth, R. J. 1977. The importance of sediment stability in seagrass communities. In: Ecology of marinebenthos, B.C. Coull (ed.), Univ. of South Carolina Press, Columbia, pp. 281-300.
Palmer, M. A., P. A. Montagna, R. B. Spies and D. Hardin. 1988. Meiofauna dispersal near naturalpetroleum seeps in the Santa Barbara Channel: a recolonization experiment. Oil & ChemicalPollution 4:179-189.
Paine, J. G. 1993. Subsidence of the Texas coast: inferences from historical and late Pleistocene sealevels. Tectonophysics 222:445-458.
Parker, R. H. 1959. Macro-invertebrate assemblages of central Texas coastal bays and Laguna Madre.Bulletin of the American Association of Petroleum Geologists 43:2100-2166.
PCCA 1993. Phase II: Safeharbor environmental impact statement. Port of Corpus Christi Authority.p. 2.4-19.
Pearson, T. H. and R. Rosenberg. 1978. Macrobenthic succession in relation to organic enrichmentand pollution of the marine environment. Oceanography and Marine Biology Annual Review16: 229-311.

101
Phillips, R. C. 1960. Observations of the ecology and distribution of Florida seagrasses. ProfessionalPapers Serial for the Florida Board of conservation 2:1-72.
Pinto, B., D. Pelligrini, M. Gabellini, and A. Ausili. 1995. Harbor and coastal sediment chemistry andtoxicity: a preliminary assessment of dredging activities. Journal of Aquatic Ecosystem Health4:249-255.
Pokryfki, L. and R. E. Randall. 1987. Nearshore hypoxia in the bottom water of the NorthwesternGulf of Mexico from 1981 to 1984. Marine Environmental Research 22:75-90.
Pomeroy, L. R. and W. J. Wiebe. 1988. Energetics of microbial food webs. Hydrobiologia 159:7-18.
Ponwith, B. and Q. R. Dokken. 1996. Fisheries resources. In: Tunnell, J. W., Jr., Q. R. Dokken, E. H.Smith and K. Withers, Current Status and Historical Trends of the Estuarine Living Resourceswithin the Corpus Christi Bay National Estuary Program Study Area, Vol. 1. Technical ReportNo. 6A of the Corpus Christi Bay National Estuary Program. Texas Natural ResourcesConservation Commission, Austin, Texas. Pp. 484-582.
Poore, G. C. B. 1982. Benthic communities of the Gippsland Lakes, Victoria. Australian Journal ofMarine and Freshwater Research 33:901-915.
Quammen, M. L. and C. P. Onuf. 1993. Laguna Madre: seagrass changes continue decades aftersalinity reduction. Estuaries 16: 302-310.
Ratzlaff, K. 1982. Land-surface subsidence in the Texas coastal region. Report 272. TexasDepartment of Water Resources, Austin, Texas.
Rayburn, R. 1992. Shrimp bycatch from the perspective of the state's role as fishery trustee.International Conference on Shrimp ByCatch. National Oceanic and Atmospheric/NationalMarine Fisheries Service, MARFIN Grant NA-90AA-H-MF745. 364 p.
Reise, K. 1978. Experiments on epibenthic predation in the Wadden Sea. Helgolander Wiss.Meeresunters. 31:55-101.
Rhoads, D. C. 1973. The influence of deposit-feeding benthos on water turbidity and nutrientrecycling. American Journal of Science 272:1-22.
Rhoads, D. C. 1974. Organism-sediment relations on the muddy sea floor. Oceanography and MarineBiology Annual Review 12:263-300.
Rhoads, D. C., P. L. McCall and J. Y. Yingst. 1978. Disturbance and production on the estuarineseafloor. American Scientist 66: 577-586.

102
Rhoads, D. C. and D. K. Young. 1970. The influence of deposit-feeding organisms on sedimentstability and community trophic structure. Journal of Marine Research 28:150-178.
Ritter, M. C. and P. A. Montagna. 1997. Seasonal hypoxia and benthic response in a Texas bay.Estuaries (submitted msc.).
Robinson, L., P. Campbell and L. Butler. 1994. Trends in Texas Commercial Fishery Landings, 1972-1993. Management Data Series, No. 111.
Robinson, L., P. Campbell and L. Butler. 1995. Trends in Texas commercial fishery landings, 1972-1994. Management Data Series, No. 117. Texas Parks and Wildlife Department, CoastalFisheries Division, Austin, Texas. 133 p.
Rothlisberg, P. 1992. The fate of material discarded from shrimp trawlers. in: International Conferenceon Shrimp Bycatch, Southeastern Fisheries Association, Tallahassee, Florida, pp 115-124.
Rykiel, E. J., Jr. 1985. Towards a definition of ecological disturbance. Australian Journal of Ecology10:361-365.
Santos, S. L. and J. L. Simon. 1974. Distribution and abundance of the polychaetous annelids in asouth Florida estuary. Bulletin of Marine Science 24: 669-689.
Santos, S. L. and J. L. Simon. 1980. Response of soft-bottom benthos to annual catastrophicdisturbance in a south Florida estuary. Marine Ecology Progress Series 3:347-355.
Sargent, F. J., T. J. Leary, D. W. Crewz, and C. R. Kruer. 1995. Scarring of Florida’s seagrasses:assessment and management options. FMRI Tech. Rep. TR-. Florida Marine Research Institute,St. Petersburg, Florida. 37 pp. plus appendices.
Savino, J. F., M. A. Blouin, B. M. Davis, P. L. Hudson, T. N. Todd and G. W. Fleischer. 1994. Effectsof pulsed turbidity and vessel traffic on lake herring eggs and larvae. Journal of Great LakesResearch 20: 366-376.
Schmidheiny, S. 1992. Changing course. Cambridge MA:The MIT Press. 374 pp.
Schubel, J. R., H. H. Clarke, R. E. Wilson, W. M. Wise, M. G. Heaton and M. G. Gross. 1978. Fieldinvestigations of nature, degree and extent of turbidity generated by open-water pipelinedisposal operations. Technical Report D-78-30, U. S. Army Engineer Waterways ExperimentStation, CE, Vicksburg, Mississippi, 245 pp. plus appendices.
Schwartz, F. J., G. Safrit, J. Purifoy and R. Butterfield. 1993. A 10-month survey of fishes andinvertebrates inhabiting a 30-yr old barrier island dredged canal system at Pine Knoll Shores,North Carolina. The Journal of the Elisha Mitchell Scientific Society 109:99-114.
103
Schwinghamer, P., J. Y. Guigné and W. C. Siu. 1996. Quantifying the impact of trawling on benthichabitat structure using high resolution acoustics and chaos theory. Canadian Journal of Fish andAquaculture Science 53:288-296.
Scoffin, T. P. 1970. The trapping and binding of subtidal carbonate sediments by marine vegetation inBimini Lagoon, Bahamas. J. Sed. Pet. 40(1-2). 241-273.
Shepard, F. P. 1953. Sedimentation rates in Texas estuaries and lagoons. Bulletin of the AmericanAssociation of Petroleum Geologists 37:1919-1934.
Sherk, J. A., Jr. and L. E. Cronin. 1970. The effects of suspended and deposited sediments onestuarine organisms, an annotated bibliography of selected references. University of Maryland,N.R.I. Ref. No. 70-19, 561pp.
Sherman, K. M. and B. C. Coull. 1980. The response of meiofauna to sediment disturbance. Journalof Experimental Biology and Ecology 46:59-71.
Sheridan P. F., J. A. Browder and J. E. Powers. 1984. Ecological interactions between penaeid shrimpand bottomfish assemblages. In: Penaeid Shrimps - their Biology and Management, Gulland, J.A. and B. J. Rothschild, Fishing News Books, Farnham, England pp 235-253.
Shideler, G. L 1980. Reconnaissance observations of some factors influencing the turbidity structure ofa restricted estuary: Corpus Christi Bay, Texas. Texas Journal of Science 32:60-71.
Shideler, G. L. 1984. Suspended sediment responses in a wind-dominated estuary of the Texas Gulfcoast. Journal of Sedimentary Petrology 54: 731-745.
Sideler, G. L. and C. E. Stelting. 1981. Sedimentary processes in restricted Gulf coast estuarinesystem: Corpus Christi Bay, Texas. AAPG Bulletin 65:992.
Simboura, N., A. Zenetos, P. Panayotidis and A. Makra. 1995. Changes in benthic communitystructure along an environmental pollution gradient. Marine Pollution Bulletin 30: 470-474.
Smayda, T J. and Y. Shimuzu (eds.). 1993. Toxic phytoplankton blooms in the sea. Esevier Press,Amsterdam, 952 p.
Smith, V. J., R. J. Swindlehurst, P. A. Johnston and A. D. Vethaak. 1995. Disturbance of host defensecapability in the common shrimp, Crangon crangon, by exposure to harbor dredge spoils.Aquatic Toxicology 32:43-58.
Soule, D. F. 1988. Marine organisms as indicators: reality or wishful thinking? In: Marine Organismsas Indicators, Soule, D. F. and G. S. Kleppel (eds.),Springer-Verlag, New York, pp. 1-11.

104
Sousa, W. P. and J. H. Connell. 1992. Grazing and succession in marine algae. In: Plant animalinteractions in the marine benthos, D. M. John, S. J. Hawkins, and J. H. Price (eds.),Systematics Association Special Volume No. 46, Clarendon Press, Oxford. pp. 447-491.
Stephens, P. M. 1987. Response of excised gill tissue from the New Zealand scallop, Pectinnovaezelandiae, to suspend silt. New Zealand Journal of Marine and Freshwater Research21:605-614.
Stoner, A. W. 1980. Abundance, reproductive seasonality and habitat preferences of amphipodcrustaceans in seagrass meadows of Apalachee Bay, Florida. Contributions in Marine Science23:63-77.
Summerson, H. C. and C. H. Peterson. 1984. Role of predation in organizing benthic communities of atemperate-zone seagrass bed. Marine Ecology Progress Series 15:63-77.
Sutherland, J. P. and R. H. Karlson. 1977. Development and stability of the fouling community atBeaufort, North Carolina. Ecological Monographs 47:425-446.
Swanson, R. L. and C. I. Thurlow. 1973. Recent subsidence rates along the Texas and Louisianacoasts as determined from tide measurements. Journal of Geophysical Research 78:2665-2671.
Taghon, G. L., Nowell, A. R. M. and P. A. Jumars. 1980. Induction of suspension feeding in spionidpolychaetes by high particulate fluxes. Science 210:562-564.
Texas Department of Water Resources. 1982. The influence of freshwater inflows upon the major baysand estuaries of the Texas Gulf coast. Vol. 8. Executive Summary (Second Ed.) TexasDepartment of Water Resources, Austin, Texas.
TGFOC 1923. Annual report of the State of Texas Game, F TGFOC 1923. Annual report of the Stateof Texas Game, fish and Oyster Commission ish and Oyster Commission for the fiscal year1922-1923. Austin, Texas.
Texas Maritime Museum. Public display. Rockport, Texas.
Texas Parks Wildlife Department. 1995a. Texas Commercial Fishing Guide 1995-1996. Texas Parksand Wildlife Department, Austin, Texas. 23 p.
Texas Parks Wildlife Department. 1995b. The Texas Shrimp Fishery. A report to the Governor and the74th Legislature. Texas Parks and Wildlife Department, Austin, Texas. 22 p.
Thayer, G. W., S. M. Adams, and M. W. La Croix. 1975. Structural and functional aspects of arecently established Zostera marina community. Estuarine Research 1:518-540.
105
Thomas, L. P., Moore, D. R., and Work, R. C. 1961. Effects of Hurricane Donna on the turtle grassbeds of Biscayne Bay, Florida. Bulletin of Marine Science of the Gulf and Caribbean 11. 191-197.
Thrush, S. F., J. E. Hewitt, V. J. Cummings and P. K. Dayton. 1995. The impact of habitat disturbanceby scallop dredging on marine benthic communities: what can be predicted from the results ofexperiments? Marine Ecology Progress Series 129: 141-150.
Tunnell, J. W., Jr., Q. R. Dokken, E. H. Smith and K. Withers. 1996. Current Status and HistoricalTrends of the Estuarine Living Resources within the Corpus Christi Bay National EstuaryProgram Study Area, Vol. 1 of 4. Technical Report No. 6A of the Corpus Christi Bay NationalEstuary Program. Texas Natural Resources Conservation Commission, Austin, Texas. 543 p.
Turner, S. J., S. F. Thrush, V. J. Cummings, J. E. Hewitt, M. R. Wilkinson, R. B. Williamson and D. J.Lee. 1997. Changes in epifaunal assemblages in response to marina operations and boatingactivities. Marine Environmental Research 43:181-199.
U.S. Army Corps of Engineers. 1968. Report on Hurricane “Beulah”, 8-21 September, 1967. U. S.Army Corps of Engineers, Galveston Dist. 26 pp.
U.S. Army Corps of Engineers. 1971. Report on Hurricane “Celia”, 30 July-5 August, 1970. U. S.Army Corps of Engineers, Galveston Dist. 13 pp.
U. S. Army Corps of Engineers. 1972. Report on Hurricane “Fern”, September 7-13, 1971. U. S.Army Corps of Engineers, Galveston Dist. 11 pp. April 25, 1997
U.S. Army Corps of Engineers. 1979. Waterborne Commerce of the United States: Part 2 -Waterways and Harbors, Gulf Coast, Mississippi River System and Antilles. Department ofArmy, Corps of Engineers, Water Resources Support Center. WRSC-WCUS-79-2.
U.S. Army Corps of Engineers. 1981. Report on Hurricane “Allen”, 3-10 August, 1980. U. S. ArmyCorps of Engineers, Galveston Dist. 28 pp.
U.S. Army Corps of Engineers. 1994. Waterborne Commerce of the United States: Part 2 -Waterways and Harbors, Gulf Coast, Mississippi River System and Antilles. Department ofArmy, Corps of Engineers, Water Resources Support Center. WRSC-WCUS-94-2.
Van Dolah, R. F., P. H. Wendt and M. V. Levisen. 1991. A study of the effects of shrimp trawling onbenthic communities in two South Carolina sounds. Fisheries Research 12: 139-156.
Van Dolah, R. F., P. H. Wendt and N. Nicholson. 1987. Effects of a research trawl on a hard-bottomassemblage of sponges and corals. Fisheries Research 5: 39-54.

106
van Tussenbroek, B. 1994. The impact of Hurricane Gilbert on the vegetation development ofThalassia testudinum in Puerto Morelos Coral Reef Lagoon, Mexico: a retrospective study.Botanica Marina 37:421-428.
Varon, R. and D. Thistle. 1988. Response of a harpacticoid copepod to a small-scale naturaldisturbance. Journal of Experimental Marine Biology and Ecology 118:245-256.
Virnstein, R. W., P. S. Mikkelson, K. D. Cairns, and M. A. Capone. 1983. Seagrass beds vs. Sandbottoms: the trophic importance of their associated benthic invertebrates. Florida Science46:363-381.
Walker, K. R. and L. P. Alberstadt. 1975. Ecological succession as an aspect of structure in fossilcommunities. Paleobiology 1: 238-257.
Ward, G. H. 1980. Hydrography and circulation processes of Gulf estuaries. In: Estuarine and WetlandProcesses with emphasis on modeling, Hamilton, P. and Macdonals, K. B. (eds.), Plenum Press,New York, pp. 183-215.
Ward, G.H. 1997. Processes and trends of circulation within the Corpus Christi Bay National EstuaryProgram Study Area. Technical Report No. 21 of the Corpus Christi Bay National EstuaryProgram. Texas Natural Resources Conservation Commission, Austin, Texas. 286 p. plusappendices.
Warren, T. A., L. M. Green and K. W. Spiller. 1994. Trends in finfish landings of sport-boat anglers inTexas Marine Waters, May, 1974-May 1992. Management Data Series, No. 109.
Warwick, R. M. and K. R. Clarke. 1994. Relearning the ABC: taxonomic changes andabundance/biomass relationships in disturbed benthic communities. Marine Biology 118: 739-774.
Weber, D. E., D. A. Flemer and C. M. Bundrick. 1992. Comparison of the effects of drilling fluid onmacrobenthic invertebrates associated with the seagrass, _Thalassia testudinum, in thelaboratory and field. Estuarine Coastal and Shelf Science 35:315-330.
Weis, J. S. and P. Weis. 1996. The effects of using wood treated with chromated copper arsenate inshallow water environments: a review. Estuaries19:306-310.
Wilson, M. A. 1987. Ecological dynamics on pebbles, cobbles, and boulders. Palaios 2: 594-599.
Windom, H. L. 1972. Environmental aspects of dredging in estuaries. Journal of Waterways, Harborsand Coastal Engineering Division, ASCE 98(WW4):475-487.
107
Windom, H. L. 1975. Water-quality aspects of dredging and dredge-spoil disposal in estuarineenvironments. Pages 559-571 in L. E. Cronin, ed. Estuarine Research. Vol. II. NewYork:Academic Press.
Wirth, E. F., G. I. Scott, M. H. Fulton, R. F. VanDolah, P. P. Maier, N. Hadley, J. W. Daugomah, andP. B. Key. 1996. In situ monitoring of dredged material spoil sites using the oyster Crassostreavirginica. Archives of Environmental Contamination and Toxicology 30:340-348.
Wood, T. M., R. L. Lehman and J. Bonner. 1997. Ecological impacts of bioremediation field studyexperiments. Pages 119-124 in: In situ and on-site bioremediation: Volume 4. Battelle Press,Columbus.
Young, D. K. and M. W. Young. 1982. Macrobenthic invertebrates in bare sand and seagrass(Thalassia testudinum) at Carrie Bow Cay, Belize. In: The Atlantic Barrier Reef Ecosystem atCarrie Bow Cay, Belize, 1. Structure and communities, pp. 115-126.
Zajac, R. N. and R. B. Whitlatch. 1982a. Responses of estuarine infauna to disturbance. I. Spatial andtemporal variation of initial recolonization. Marine Ecology Progress Series 10: 1-14.
Zajac, R. N. and R. B. Whitlatch. 1982b. Responses of estuarine infauna to disturbance. II. Spatialand temporal variation of succession. Marine Ecology Progress Series 10: 15-27.
Zieman, J. C. 1975a. Tropical seagrass ecosystems and pollution. In: Tropical marine pollution, E.J.Ferguson Wood and R. E. Johannes (eds.), Elsevier Sci. Publ. Co., Amsterdam, pp. 63-74.
Zieman, J. C. 1975b. Quantitative and dynamic aspects of the ecology of turtle grass, Thalassiatestudinum. In: Estuarine Research, V. 1 Chemistry, biology, and the estuarine system, L.Eugene Cronin (ed.), Academic Press, Inc. New York, pp. 541-562.
Zieman, J. C. 1976. The ecological effects of physical damage from motor boats on turtle grass beds insouthern Florida. Aquatic Botany. 2:127-139.

108
VIII. APPENDIX A
Questions for Telephone Interviews
Characterization of Anthropogenic and Natural Disturbance on Bay Bottom Habitats in the CCBNEPStudy Area
STAC/Exofficio Member: Phone:Person Interviewed: Phone:
Organization:
Does your organization maintain any public databases that would catalogue these resources?
What do you see as the key resource management concerns regarding benthic resources of theCCBNEP (Corpus Christi Bay National Estuary Program) study area?
What social and economic concerns are related to the management of these resources?
What management recommendations would you suggest to address these concerns?