Volume I: Evaluation of the Rural Innovation Fund · Evaluation of the Rural Innovation Fund ....
82
Volume I Evaluation of the Rural Innovation Fund U.S. Department of Housing and Urban Development | Office of Policy Development and Research
Transcript of Volume I: Evaluation of the Rural Innovation Fund · Evaluation of the Rural Innovation Fund ....

Volume I
Evaluation of the Rural Innovation Fund
U.S. Department of Housing and Urban Development | Office of Policy Development and Research

Volume I
Evaluation of the Rural Innovation Fund
Prepared for
U.S. Department of Housing and Urban Development
Office of Policy Development and Research
Prepared by
James Hedrick
Lee Higgins
Richard Hilton
Doray Sitko
Econometrica, Inc.
January 2017

Acknowledgments The authors of this report gratefully acknowledge the many important contributions that others made to this study.
We thank the Rural Innovation Fund grantees who responded to the survey, participated in the telephone interviews, and graciously allowed us to learn about their projects. We also thank the U.S. Department of Housing and Urban Development, Office of Community Planning and Development and Office of Native American Programs field office staff, who consented to interviews early in the project and provided excellent suggestions that significantly enhanced the evaluation.
We also thank Jackie Williams, of the Office of Rural Housing and Economic Development, for her assistance and Ndeye Jackson, Government Technical Representative from the Office of Policy Development and Research, for the guidance, feedback, and assistance she provided throughout the study.
We also appreciate the assistance we received from Beth Honadle, Holly Kelly, Judy Mize, Mark Shroder, and numerous others in the Office of Community Planning and Development and the Office of Policy Development and Research.
Disclaimer The contents of this publication are the views of the authors and do not necessarily reflect the views or policies of the U.S. Department of Housing and Urban Development or the U.S. government.
iii
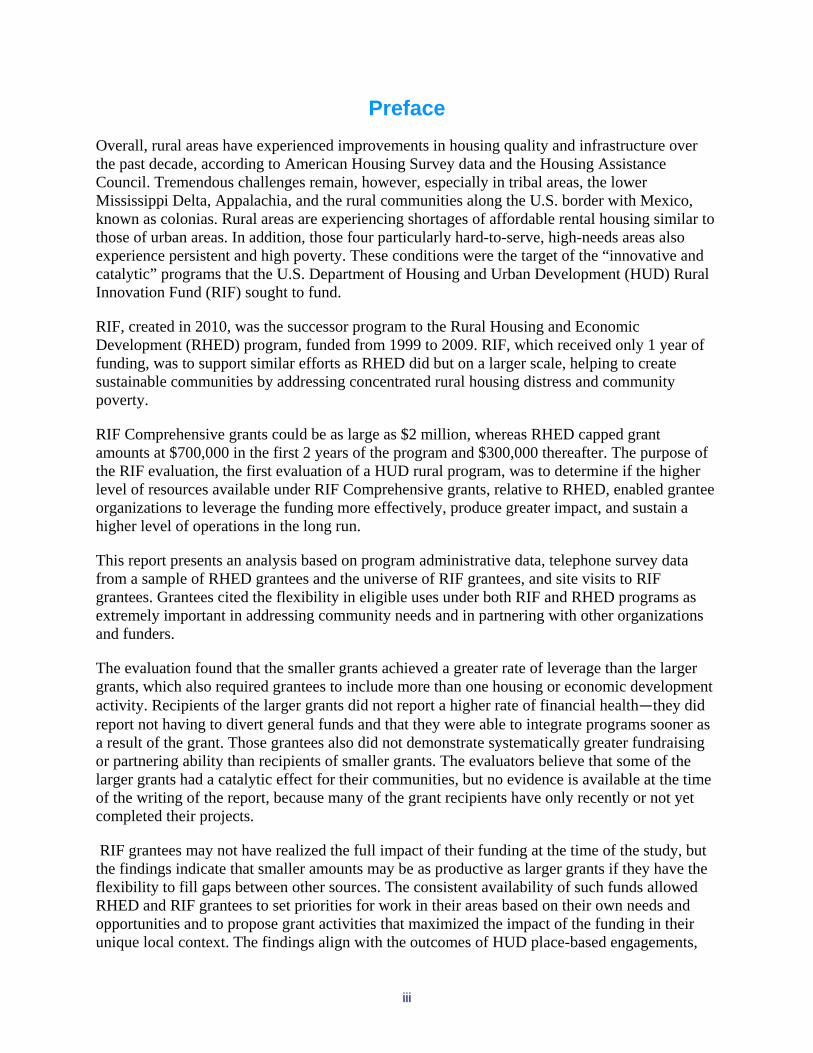
Preface Overall, rural areas have experienced improvements in housing quality and infrastructure over the past decade, according to American Housing Survey data and the Housing Assistance Council. Tremendous challenges remain, however, especially in tribal areas, the lower Mississippi Delta, Appalachia, and the rural communities along the U.S. border with Mexico, known as colonias. Rural areas are experiencing shortages of affordable rental housing similar to those of urban areas. In addition, those four particularly hard-to-serve, high-needs areas also experience persistent and high poverty. These conditions were the target of the “innovative and catalytic” programs that the U.S. Department of Housing and Urban Development (HUD) Rural Innovation Fund (RIF) sought to fund.
RIF, created in 2010, was the successor program to the Rural Housing and Economic Development (RHED) program, funded from 1999 to 2009. RIF, which received only 1 year of funding, was to support similar efforts as RHED did but on a larger scale, helping to create sustainable communities by addressing concentrated rural housing distress and community poverty.
RIF Comprehensive grants could be as large as $2 million, whereas RHED capped grant amounts at $700,000 in the first 2 years of the program and $300,000 thereafter. The purpose of the RIF evaluation, the first evaluation of a HUD rural program, was to determine if the higher level of resources available under RIF Comprehensive grants, relative to RHED, enabled grantee organizations to leverage the funding more effectively, produce greater impact, and sustain a higher level of operations in the long run.
This report presents an analysis based on program administrative data, telephone survey data from a sample of RHED grantees and the universe of RIF grantees, and site visits to RIF grantees. Grantees cited the flexibility in eligible uses under both RIF and RHED programs as extremely important in addressing community needs and in partnering with other organizations and funders.
The evaluation found that the smaller grants achieved a greater rate of leverage than the larger grants, which also required grantees to include more than one housing or economic development activity. Recipients of the larger grants did not report a higher rate of financial health—they did report not having to divert general funds and that they were able to integrate programs sooner as a result of the grant. Those grantees also did not demonstrate systematically greater fundraising or partnering ability than recipients of smaller grants. The evaluators believe that some of the larger grants had a catalytic effect for their communities, but no evidence is available at the time of the writing of the report, because many of the grant recipients have only recently or not yet completed their projects.
RIF grantees may not have realized the full impact of their funding at the time of the study, but the findings indicate that smaller amounts may be as productive as larger grants if they have the flexibility to fill gaps between other sources. The consistent availability of such funds allowed RHED and RIF grantees to set priorities for work in their areas based on their own needs and opportunities and to propose grant activities that maximized the impact of the funding in their unique local context. The findings align with the outcomes of HUD place-based engagements,

iv
particularly Sustainable Communities Regional Planning grants made to rural and tribal areas. Recipients of those grants developed strategies that enabled them to use a wide variety of public and private resources more effectively. The RIF evaluation provides further evidence that relatively modest, but flexible, resources for planning and program implementation enable local leaders to make progress according to the priorities and sequencing that are right for their communities.
v
Contents EXECUTIVE SUMMARY ................................................................................................................... X
1. INTRODUCTION ............................................................................................................................1
PROGRAM OVERVIEW ...................................................................................................................1
PURPOSE AND SCOPE OF THE EVALUATION ..................................................................................4
LIMITATIONS OF THE EVALUATION ..............................................................................................4
RESEARCH OBJECTIVES ................................................................................................................5
2. DATA SOURCES AND COLLECTION .............................................................................................8
DATA SOURCE: PRELIMINARY DATA COLLECTION ......................................................................8
DATA SOURCE: ADMINISTRATIVE PROGRAM FILES ....................................................................10
DATA SOURCE: STRUCTURED TELEPHONE INTERVIEWS .............................................................12
DATA SOURCE: SITE VISITS........................................................................................................14
PROJECT TIMELINE .....................................................................................................................18
3. SUMMARY OF OVERALL FINDINGS ...........................................................................................19
4. DESCRIPTIVE FINDINGS .............................................................................................................22
PROJECT TYPE ............................................................................................................................22
ORGANIZATION TYPE .................................................................................................................28
GRANT LOCATION ......................................................................................................................30
5. LEVERAGING FINDINGS .............................................................................................................34
RIF LEVERAGE BY PROGRAM .....................................................................................................34
RIF LEVERAGE BY SIZE AND ORGANIZATION TYPE ...................................................................35
RIF GRANTS’ LEVERAGE SOURCES ............................................................................................36
RHED LEVERAGE ......................................................................................................................37
RIF GRANTEES’ USE OF OTHER FEDERAL PROGRAMS ...............................................................39
OUTPUTS, TOTAL DEVELOPMENT COSTS, AND LEVERAGE .........................................................42
6. GRANT IMPACT FINDINGS .........................................................................................................43
QUANTITATIVE COMPARISONS OF LARGE AND SMALL RIF GRANTS..........................................43
QUALITATIVE COMPARISONS OF LARGE AND SMALL GRANTS ...................................................44
7. ADDITIONAL FINDINGS ..............................................................................................................51
vi
8. CASE STUDIES ............................................................................................................................53
SAN FELIPE PUEBLO HOUSING AUTHORITY ...............................................................................53
SOUTHERN BANCORP COMMUNITY PARTNERS ...........................................................................58
9. CONCLUSION ..............................................................................................................................65
IMPLICATIONS ............................................................................................................................65
NEED FOR FURTHER RESEARCH .................................................................................................66
vii
List of Exhibits EXHIBIT ES 1: HUD RIF AND RHED AWARD DISTRIBUTION ......................................................... X
EXHIBIT ES 2: RIF TOTAL GRANT FUNDING AND LEVERAGE RATES, BY GRANT AWARD TYPE ... XII
EXHIBIT 1: RIF/RHED PROGRAM SNAPSHOT ...................................................................................2
EXHIBIT 2: RHED PROGRAM PERFORMANCE MEASURES .................................................................3
EXHIBIT 3: RIF/RHED ACTIVITY TYPES ..........................................................................................4
EXHIBIT 4: STAKEHOLDER MEETINGS ...............................................................................................8
EXHIBIT 5: PRELIMINARY SITE VISITS ..............................................................................................9
EXHIBIT 6: RHED PROGRAM FILE SELECTION ...............................................................................11
EXHIBIT 7: SITE VISIT TEAM ...........................................................................................................14
EXHIBIT 8: SITE VISIT LOCATIONS ..................................................................................................16
EXHIBIT 9: LEVERAGE RATES BY GRANT TYPE ..............................................................................20
EXHIBIT 10: PROJECT TYPE, BY ACTIVITY CATEGORY ...................................................................24
EXHIBIT 11: PROJECT TYPE, BY ORGANIZATION SIZE .....................................................................28
EXHIBIT 12: RIF GRANT TYPES, BY ORGANIZATION TYPE .............................................................29
EXHIBIT 13: RIF AND SAMPLED RHED GRANTS ............................................................................29
EXHIBIT 14: ORGANIZATION TYPE, BY BUDGET SIZE, RIF GRANTEES ...........................................30
EXHIBIT 15: RIF GRANTEES, BY STATE ..........................................................................................31
EXHIBIT 16: MEAN UNEMPLOYMENT AND POVERTY RATES AMONG RIF GRANTEE AREAS ..........32
EXHIBIT 17: COMPARATIVE LEVERAGE ACROSS RIF GRANT TYPES ..............................................34
EXHIBIT 18: LEVERAGE, BY RIF GRANTEE ORGANIZATIONAL SIZE ...............................................35
EXHIBIT 19: LEVERAGE BY RIF GRANTEE TYPE .............................................................................35
EXHIBIT 20: MEDIAN LEVERAGE RATES, BY GRANT TYPE AND GRANTEE TYPE ............................36
EXHIBIT 21: LEVERAGE BY SOURCE AND RIF GRANTEE TYPE .......................................................36

viii
EXHIBIT 22: TRIBAL VERSUS NONTRIBAL LEVERAGING FROM GRANTEE AND PRIVATE ORGANIZATION SOURCES ..........................................................................................37
EXHIBIT 23: RHED AVERAGE GRANT AMOUNTS ...........................................................................38
EXHIBIT 24: RHED LEVERAGE TOTALS .........................................................................................39
EXHIBIT 25: QUANTITATIVE COMPARISONS OF RIF GRANT PROGRAMS .........................................44
ix
List of Figures FIGURE 1: KARUK COMMUNITY DEVELOPMENT CORPORATION (HAPPY CAMP, CALIFORNIA) .......10
FIGURE 2: TAOS PUEBLO, NATIVE BUSINESS (TAOS, NEW MEXICO) ..............................................15
FIGURE 3: SENOR CAFÉ—PATHSTONE, INC., RIF GRANT (CASTAÑER REGION, PUERTO RICO) .....33
FIGURE 4: KEWEENAW BAY INDIAN COMMUNITY TRAVEL STOP (MARQUETTE TOWNSHIP, MICHIGAN) ................................................................................................................42
FIGURE 5: HIGH-EFFICIENCY AIR-CONDITIONING UNIT AS AN EXAMPLE OF ENERGY EFFICIENCY IMPLEMENTATION .....................................................................................................51
FIGURE 6: ORGANIZED VILLAGE OF KAKE—OYSTER HARVEST (ROCKY PASS, ALASKA) ..............52
FIGURE 7: BLACK MESA VIEW SUBDIVISION (SAN FELIPE PUEBLO, NEW MEXICO) .......................54
FIGURE 8: SFPHA RIF HOME .........................................................................................................56
FIGURE 9: SFPHA RIF HOME .........................................................................................................57
FIGURE 10: DOWNTOWN HELENA, ARKANSAS (CHERRY STREET) ..................................................59
FIGURE 11: NORAC ADDITIVES—A HELENA JOBS INCENTIVE RECIPIENT ......................................60
FIGURE 12: BATTLE OF HELENA CIVIL WAR SITE SIGN, MAINTAINED BY SBCP ...........................61
FIGURE 13: SAFE AT SBCP OFFICES ...............................................................................................62
FIGURE 14: THRIVE—A HELENA-BASED BUSINESS .......................................................................64

x
Executive Summary This report examines how rural housing and economic development organizations have used the Rural Innovation Fund (RIF) to benefit their communities. The RIF is a competitive grant program funded by the U.S. Department of Housing and Urban Development (HUD) with the intent of improving the quality of housing and promoting economic development in rural communities with high rates of unemployment and poverty. HUD’s Office of Policy Development and Research funded this research project. Econometrica, Inc., conducted the study between October 2013 and December 2015 on a contractual basis. The study team performed an evaluation of the RIF program that incorporated a wide variety of data collection efforts, including stakeholder meetings, semistructured interviews with grantees, 15 site visits to RIF programs, administrative file review, and focus groups with rural development professionals. Three main questions guided the study: What types of projects did the RIF fund, how successful were grantees at leveraging additional funding, and what were the impacts of the larger RIF grants? Sometimes those questions were difficult to answer because of a number of issues, including that many of the RIF projects are not yet complete, and identifying any long-term impact was difficult. The study team believes, however, that this evaluation provides reasonable answers and significant insights into the effects of the RIF program. This study compared the RIF awards with a similar grant, the Rural Housing and Economic Development (RHED) program, which preceded the RIF program (exhibit ES 1).
Exhibit ES 1: HUD RIF and RHED Award Distribution
RHED = Rural Housing and Economic Development. RIF = Rural Innovation Fund.
Some of the major findings follow. More details are available in corresponding sections of the full report.
xi
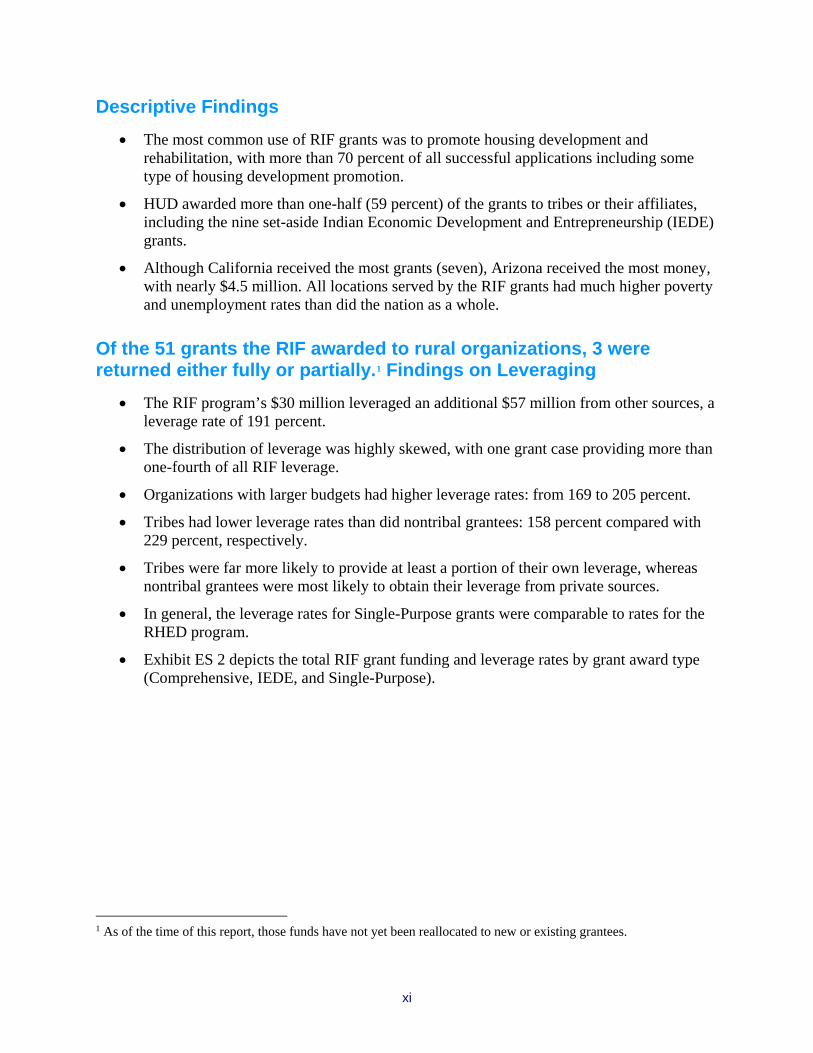
Descriptive Findings • The most common use of RIF grants was to promote housing development and
rehabilitation, with more than 70 percent of all successful applications including some type of housing development promotion.
• HUD awarded more than one-half (59 percent) of the grants to tribes or their affiliates, including the nine set-aside Indian Economic Development and Entrepreneurship (IEDE) grants.
• Although California received the most grants (seven), Arizona received the most money, with nearly $4.5 million. All locations served by the RIF grants had much higher poverty and unemployment rates than did the nation as a whole.
Of the 51 grants the RIF awarded to rural organizations, 3 were returned either fully or partially.1 Findings on Leveraging
• The RIF program’s $30 million leveraged an additional $57 million from other sources, a leverage rate of 191 percent.
• The distribution of leverage was highly skewed, with one grant case providing more than one-fourth of all RIF leverage.
• Organizations with larger budgets had higher leverage rates: from 169 to 205 percent.
• Tribes had lower leverage rates than did nontribal grantees: 158 percent compared with 229 percent, respectively.
• Tribes were far more likely to provide at least a portion of their own leverage, whereas nontribal grantees were most likely to obtain their leverage from private sources.
• In general, the leverage rates for Single-Purpose grants were comparable to rates for the RHED program.
• Exhibit ES 2 depicts the total RIF grant funding and leverage rates by grant award type (Comprehensive, IEDE, and Single-Purpose).
1 As of the time of this report, those funds have not yet been reallocated to new or existing grantees.

xii
Exhibit ES 2: RIF Total Grant Funding and Leverage Rates, by Grant Award Type
IEDE = Indian Economic Development and Entrepreneurship. RIF = Rural Innovation Fund.
Grant Impact Findings Although significant methodological difficulties arise when comparing the impacts of grants of very different sizes, no evidence suggests that the larger grants had a proportionally greater impact than did the smaller grants. In addition, the outcomes from large, comprehensive projects may take many more years to be fully evident.
• Quantitative comparisons of the large and small grants show that Single-Purpose grants achieved a greater rate of leverage (358 percent) than did the Comprehensive Grants (127 percent) or the IEDE grants (69 percent). Even using median leverage per grant to ameliorate the effect of the skew, analysis shows a higher leverage rate for Single-Purpose grants (68 percent) than for Comprehensive grants (58 percent).
• Comprehensive grantees did not report a higher rate of financial health improvement than did other grantees. They did not get into new areas of activity at a higher rate; one-fourth (two of eight) reported no increase in technical capacity as a result of their RIF grant.
• No definitive evidence shows that Comprehensive grantees improved their fundraising and partnering capability substantially more than did Single-Purpose grantees.
Other findings include the importance of the RIF program’s flexibility to the grantees; the high percentage of organizations (61 percent) that included energy efficiency as part of their RIF project; the very low rate of mixed-financing options, such as tax credits;2 and the presence of housing counseling in more than 40 percent of the projects.
2 The application data and related telephone interviews revealed only two instances in which grant applicants used or attempted to use tax credits in the RIF grants. One applicant was successful, and the other was not.

xiii
Implications From the Research The research provides several lessons that can serve to inform program designers should HUD execute a future grant program of this nature. Of note are the following recommendations.
• The notice of funding availability should specify the type of leveraging HUD wishes to promote and reward within the applicant cohort.
• Obtaining information on the financial stability of the applicant organization should receive greater emphasis.
• The relative flexibility of the RIF program design should be retained.
• If HUD decides to continue to offer grants of varying sizes, it should recognize the challenges rural organizations may have in leveraging larger grants.
1
1. Introduction
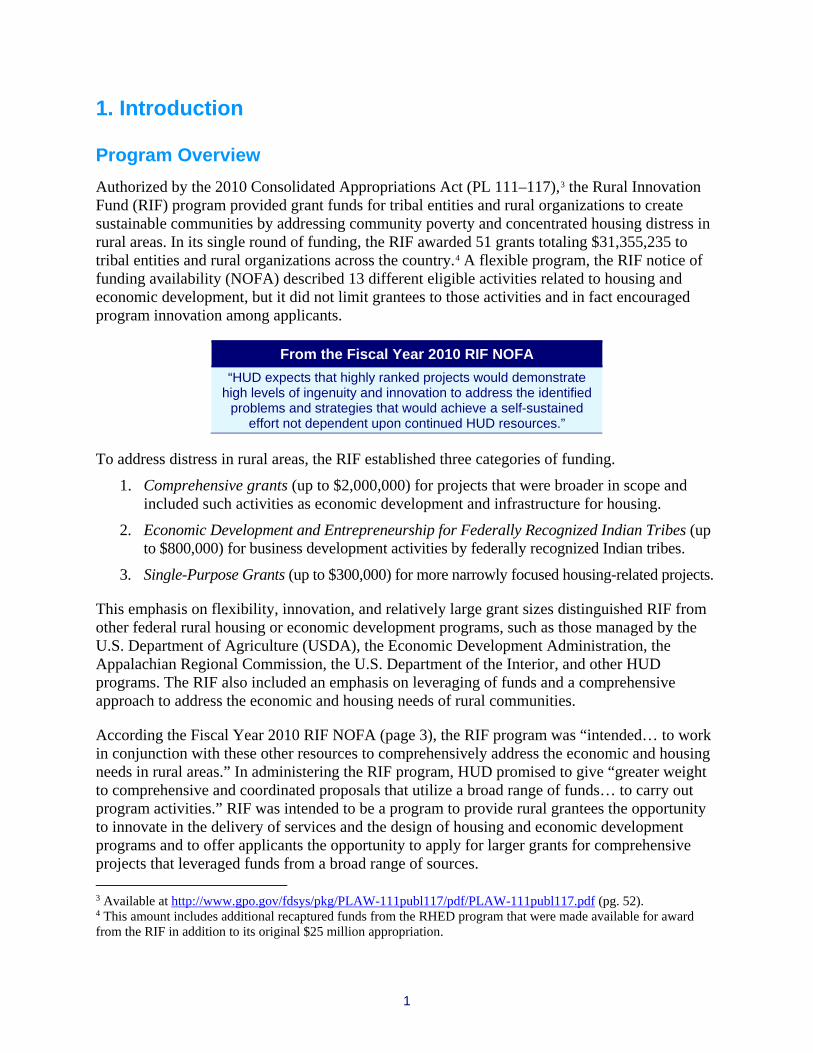
Program Overview Authorized by the 2010 Consolidated Appropriations Act (PL 111–117),3 the Rural Innovation Fund (RIF) program provided grant funds for tribal entities and rural organizations to create sustainable communities by addressing community poverty and concentrated housing distress in rural areas. In its single round of funding, the RIF awarded 51 grants totaling $31,355,235 to tribal entities and rural organizations across the country.4 A flexible program, the RIF notice of funding availability (NOFA) described 13 different eligible activities related to housing and economic development, but it did not limit grantees to those activities and in fact encouraged program innovation among applicants.
From the Fiscal Year 2010 RIF NOFA “HUD expects that highly ranked projects would demonstrate
high levels of ingenuity and innovation to address the identified problems and strategies that would achieve a self-sustained
effort not dependent upon continued HUD resources.”
To address distress in rural areas, the RIF established three categories of funding. 1. Comprehensive grants (up to $2,000,000) for projects that were broader in scope and
included such activities as economic development and infrastructure for housing. 2. Economic Development and Entrepreneurship for Federally Recognized Indian Tribes (up
to $800,000) for business development activities by federally recognized Indian tribes. 3. Single-Purpose Grants (up to $300,000) for more narrowly focused housing-related projects.
This emphasis on flexibility, innovation, and relatively large grant sizes distinguished RIF from other federal rural housing or economic development programs, such as those managed by the U.S. Department of Agriculture (USDA), the Economic Development Administration, the Appalachian Regional Commission, the U.S. Department of the Interior, and other HUD programs. The RIF also included an emphasis on leveraging of funds and a comprehensive approach to address the economic and housing needs of rural communities.
According the Fiscal Year 2010 RIF NOFA (page 3), the RIF program was “intended… to work in conjunction with these other resources to comprehensively address the economic and housing needs in rural areas.” In administering the RIF program, HUD promised to give “greater weight to comprehensive and coordinated proposals that utilize a broad range of funds… to carry out program activities.” RIF was intended to be a program to provide rural grantees the opportunity to innovate in the delivery of services and the design of housing and economic development programs and to offer applicants the opportunity to apply for larger grants for comprehensive projects that leveraged funds from a broad range of sources. 3 Available at http://www.gpo.gov/fdsys/pkg/PLAW-111publ117/pdf/PLAW-111publ117.pdf (pg. 52). 4 This amount includes additional recaptured funds from the RHED program that were made available for award from the RIF in addition to its original $25 million appropriation.

2
Created by Congress in 1998, under Public Law 105–276 (October 21, 1998) and eventually superseded by the RIF, the Rural Housing and Economic Development (RHED) program—like the RIF—aimed at supporting local innovation in rural housing and economic development by building capacity at the state and local levels. Since the program’s inception, grantees have competed for approximately $25 million in RHED funds annually from 1999 through 2009, and 948 grants totaling approximately $248 million have been awarded.5 The RHED program was the original basis for the RIF, and its influence can be seen throughout the program, particularly in the Single-Purpose grants. Exhibit 1 shows a comparison of the RIF and RHED programs.
Exhibit 1: RIF/RHED Program Snapshot
Program NOFA Years
Number of
Grants
Amount Granted
($)
Average Amount per Year
($)
Average Amount
per Grant ($)
Grant Range
($)a
RHED 1999–2009 948 221,036,838 20,094,258 233,161 300,000–700,000
RIF 2010 51 31,355,235 31,355,235 614,808 300,000–2 million
NOFA = notice of funding availability. RHED = Rural Housing and Economic Development. RIF = Rural Innovation Fund. a The range of grants awarded was greatest in the first 2 years of the program (1999–2000). Later years saw much more consistency in grant awards, with the maximum award typically being limited to $300,000, similar to the RIF Single-Purpose grants.
Exhibit 2, provided by the HUD RHED program staff and not independently verified by the study team, indicates the reported RHED performance measures (outputs).
Finally, for both the RIF and the RHED programs, eligible grantees included local rural nonprofit organizations, community development corporations, federally recognized Indian tribes, state housing finance agencies, and state community or economic development agencies. In addition, both the RIF and the RHED programs have focused on rural and underserved areas of America. Both programs have paid particular attention to the following five hard-to-serve, high-needs areas.
1. Native American communities. 2. The lower Mississippi Delta.6 3. Appalachian Regional Commission distressed counties.7
5 This amount includes recaptured funds. 6 As defined in the charter of the Delta Regional Authority, the Delta region is made up of 250 counties and parishes bordering on or near the Mississippi River in eight states: Alabama, Arkansas, Illinois, Kentucky, Louisiana, Mississippi, Missouri, and Tennessee. 7 As laid out in the federal legislation that created the Appalachian Regional Commission, Appalachia is defined as a 250,000-square-mile area that follows the spine of the Appalachian Mountains from southern New York to Mississippi. It includes all of West Virginia and parts of 12 other states: Alabama, Georgia, Kentucky, Maryland, Mississippi, New York, North Carolina, Ohio, Pennsylvania, South Carolina, Tennessee, and Virginia.

3
Exhibit 2: RHED Program Performance Measures Data Collection
Period Jobs
Created People Trained
New Businesses
Created
Existing Businesses
Assisted
Housing Units
Constructed
Housing Units
Rehabilitated 10/01/2000–09/30/2001 1,908 3,156 NA NA 540 507 10/01/2001–09/30/2002 2,035 5,097 367 1,409 1,703 2,225 10/01/2002–09/30/2003 1,475 6,980 275 897 3,070 2,995 10/01/2003–07/30/2005 3,737 7,891 602 1,348 1,203 1,292 10/01/2006–09/30/2007 854 2,601 198 364 370 414 10/01/2007–09/30/2008 1,720 3,898 218 632 554 656 10/01/2008–09/30/2009 915 7,512 349 698 796 993 10/01/2009–09/30/2010 361 1,212 49 209 359 185 10/01/2010–09/30/2011 507 2,393 62 365 208 284 10/01/2011–09/30/2012 350 1,580 168 176 292 177 10/01/2012–9/30/2013 123 1,754 48 214 159 135 10/01/2013–9/30/2014 19 184 4 59 39 3
Total 14,004 44,258 2,340 6,371 9,293 9,866 NA = No data available. RHED = Rural Housing and Economic Development.
4. The colonias.8 5. Seasonal farmworkers.9,10
As part of the evaluation, the study team paid special attention to those rural and underserved areas when collecting data and presenting analyses.
8 Section 916 of the National Affordable Housing Act of 1990 defines a colonia (in part) as a community in the state of Arizona, California, New Mexico, or Texas; within 150 miles of the United States-Mexico border; and determined to be a colonia on the basis of objective criteria, including lack of a potable water supply, lack of adequate sewage systems, and lack of decent, safe, and sanitary housing. The RHED program used a similar definition in its NOFA. 9 As defined in the NOFA, a seasonal farmworker is “A farm employee of an owner, tenant, labor contractor, or other operator raising or harvesting agricultural or aquacultural commodities, or a worker who, in the employment of a farm operator, engages in handling, planting, drying, packing, grading, storing, delivering to storage or market, or carrying to market agricultural or aquacultural commodities produced by the operator. Seasonal farmworkers are those farm employees who typically do not have a constant year-round salary.” 10 The RHED program included farmworker organizations as a separate category for a number of years. Farmworker organizations were also technically eligible organizations under the RIF NOFA, but the study team was unable to identify any farmworker organizations among the RIF grant recipients.
4
Purpose and Scope of the Evaluation Overall, the purpose of this evaluation is to explore how the larger grant amounts available through the RIF affected program activities, effects, and outputs compared with the smaller amounts of the RHED. Of particular interest is the amount of resources leveraged from the RIF relative to the resources leveraged by the RHED, the source of those leveraged funds, and the effect of the enhanced resources on the capacity of grantees to affect their community.11
To address those questions, exhibit 3 outlines the six primary activity types described in the statement of work that HUD requested that this evaluation use. Grantees have used funds from both programs for a wide variety of housing, economic development, and infrastructure improvement activities, including acquisition, planning, construction, housing counseling, revolving loan funds, enterprise startups, and infrastructure construction. The study team used the activities outlined in the table to guide the research in the hope that they could draw reasonably comparable conclusions about the impact of higher levels of funding and leveraging on rural housing and economic development.
Exhibit 3: RIF/RHED Activity Types Project Type Housing Business Development Infrastructure
Direct production
Housing development and rehabilitation
1. Specific business enterprise startup
2. Commercial real estate or infrastructure development to facilitate business activity
Direct development of infrastructure improvements
Lending and investing
Loans to homeowners or multifamily rental projects Loans to business owners NA
NA = not applicable. RHED = Rural Housing and Economic Development. RIF = Rural Innovation Fund.
Limitations of the Evaluation The study team finalized data collection protocols after lengthy discussions between HUD staff, members of the study team, and representatives of the Office of Management and Budget (OMB) during the formal OMB review and approval process. One notable discussion point focused on the issue of potential recall bias. With respect to that matter, both HUD and the study team concurred that it could be a problem when conducting telephone interviews and site visit discussions; thus, they put several procedures in place to address their concern. They put in place “filter” procedures to limit telephone respondents to only individuals who had worked directly on a grant, whether a RIF or a RHED project. In addition, the purposive sample for the RHED interviews was limited to 2005 through 2009. In practice, that was not a significant issue; many RIF grantees were still completing their projects at the time of the data collection. In addition, many of the available RHED respondents were selected from the last few years of
11 Because the RIF was authorized in 2010 and many grantees have not completed their projects, only a limited time series is available to evaluate the effect of those program changes on the few grantees that received larger grants.
5
the program, minimizing the impact of recall bias. A review of the completed telephone interviews shows only a small proportion of responses such as “I don’t know” or “I am not sure.”
Limitations existed in the type and extent of evaluative data that the study team could obtain. The primary factors affecting data collection were—
• At the time of the study team’s data collection, the amount and availability of data that the team could draw from the administrative files of the RHED grantees were limited.
• A high attrition rate among the RHED grantee cohort made drawing a random sample from that cohort impossible. Attempts to locate former RHED grantees indicated that as many as 40 percent of those grantees were not available or willing to participate in telephone interviews.
• The relatively short time from the RIF grant awards and actual activity start dates to the time of the evaluation resulted in an inability to estimate impacts. Another consequence was a lack of complete quarterly performance reports available for review. At the time of this evaluation, many of the grant projects were just at completion or were still not completed. Also, the timeframe did not allow for a valid assessment of some initiatives—for example, whether the economic development projects would become self-sustaining.
The project team believes that the finalized project design was largely validated by the data collection phase of the project. The design of the data collection protocols enabled the team to obtain significant amounts of qualitative data from the grantees. That data has enabled the team to effectively evaluate a program that attempted to promote flexibility, innovation, and diversity in project designs.
Research Objectives This section summarizes the core research questions that the study team addressed in this project. The team based those objectives on the original contract and arrived at them through numerous discussions with HUD staff. The research questions were refined through communication with RHED/RIF program office staff, internal and external stakeholders, Office of Policy Development and Research staff, and multiple documents submitted during the evaluation by the study team.
Focus of the Evaluation: Research Questions Following are the three core research questions for this evaluation, as stipulated by HUD in its original request for proposals, along with the approach to operationalizing these questions based on the study team’s knowledge of the subject and preliminary research.
1. What types of projects do the RIF and the RHED program fund, and who uses these programs? In describing the RIF and RIF-funded activities, the study team developed a framework for comparison between the programs based on the six activity types taken from the statement of work and listed in exhibit 3. Other information, such as organization status and size (when available) and participation in multiple programs, was included as well.
6
2. How effective are leveraging requirements, and how successful are grantees at leveraging additional funding? Because of the paucity of resources available, rural housing and economic development organizations rely on the leveraging of funding and other resources to achieve their goals.12 The Comprehensive grants available under the RIF program differ from the ones under the RHED program in the maximum grant size, and those larger grants could have affected grantee leveraging and outputs in a number of ways. For example, the larger grant amounts could affect leveraging effectiveness by allowing grantees to undertake projects with significantly less leveraged funding or by stimulating additional leveraging for larger overall projects.
3. What is the impact of larger grants through the RIF relative to project activities and outcomes, compared with the RHED program? The larger maximum grant amount in the RIF could have many effects, such as providing economies of scale, thereby allowing more efficient production of housing and economic development outputs. Other impacts could include attracting new partners, prompting new project cash flow approaches, changing grantees’ approaches to leveraging funds, and expanding the range and size of project activities and outcomes. Most of those impacts are related to grantee capacity and the way grant awards can enhance that capacity.13
Overview of Study Design To successfully address the research questions, the evaluation focused on all 51 funded RIF projects and 2 separate samples of RHED projects. The project team engaged in the following project activities.
• Conducted a series of meetings with rural housing and economic development stakeholders—including one focus group—and gathered information on potential data collection and rural development issues.14
• Reviewed existing RIF and RHED program files, including RHED administrative files, to identify and describe program activities. That file review was supplemented by conversations with the RHED/RIF program staff and information available from other reports.
• Built a comprehensive database of RIF and RHED program data with the information extracted from the program files and other documentation provided by the program offices.
12 For simplicity, this evaluation defines leveraging as any project funds acquired in addition to the base grant award that are accompanied by a signed letter of commitment from the partnering organization. Although that simple definition raises a number of issues (see section 5 for a broader discussion), discussions with various rural housing and economic development stakeholders led the study team to believe that it is the best definition for facilitating reliable data collection and comparability across grantees. 13 Although capacity is a complex concept, the evaluation largely approached it by focusing on two aspects: administrative capacity and technical capacity. 14 Those stakeholders include representatives of other federal programs with missions similar to those of the RIF and RHED, local and regional economic development entities, and nonprofit advocacy groups with a history of working effectively in rural communities. A list is included in exhibit 4.
7
• Conducted an environmental scan of other rural housing programs and rural economic development programs that grantees can use to meet housing and development objectives similar to the RIF.15
• Gathered information from RIF and RHED award recipient project managers—and other appropriate local officials—through semistructured telephone interviews with all RIF grantees and a purposive sample of RHED grantees. The goal was to compare the experiences of the grantees, particularly in the areas of leveraging, capacity building, and community impact. Interview topics included program effectiveness, program challenges, approaches to leveraging or blending funds, alternate sources of funding, whether RIF/RHED filled any unique project financing gaps, and outcomes and benefits.
• Conducted 15 site visits to a purposive sample of RIF and RHED grantee projects across the six activity types listed in exhibit 3. The purpose of those visits was to examine first-hand the outputs that the projects provided for their communities and to identify any outcomes or effects from RIF projects that are observable on site but not necessarily captured by HUD’s administrative data or reporting.
15 The results of that scan are included in the Data Documentation Report.

8
2. Data Sources and Collection This section describes the data sources and collection methods the study team used during this evaluation. It is arranged by the data collection activity. Volume II of this report includes several appendixes with copies of data collection instruments and documents, such as discussion guides, interview questions, and site visit reports. The study team provided more information on those instruments and the data collection in the accompanying Data Documentation Report.
Data Source: Preliminary Data Collection During the initial orientation meeting and subsequent discussions with HUD staff, the study team and HUD agreed that including a preliminary data collection task in the Rural Innovation Fund Evaluation would be beneficial. Based on subsequent discussions, the study team proposed a preliminary data collection effort with two facets: stakeholder interviews and preliminary site visits. The primary objective of that effort was to obtain informed input on the proposed activities from rural housing and economic development stakeholders and project officers with direct knowledge of the RIF and Rural Housing and Economic Development programs. The study team was particularly interested in learning more about the leveraging and capacity-building activities of rural development organizations.
Exhibit 4 shows what stakeholder organizations the team, the date each was contacted, and the method of communication. The team selected those stakeholders purposively as a result of discussions with HUD staff and suggestions from the stakeholders. The purpose of the meetings was to understand rural development research more fully and to discuss best practices in measurement and data collection. Documentation of those meetings, including discussion guides and notes, can be found in volume II, the appendixes of this report.
Exhibit 4: Stakeholder Meetings Organization Date Method
Housing Assistance Council January 17, 2014 In-person meeting Treasury/community development financial institutions January 29, 2014 Conference call USDA—Rural Development January 29, 2014 In-person meeting NeighborWorks® Rural Initiative February 4, 2014 Conference call USDA—Economic Research Service February 6, 2014 Conference call Housing Assistance Council Annual Conference December 21, 2014 Focus groups
USDA = U.S. Department of Agriculture.
The second aspect of the preliminary data collection included organizing four preliminary site visits. Exhibit 5 shows the final sites the study team selected in collaboration with HUD staff and the RIF and RHED program office staff. Following, in order of importance, are the criteria that the team used to select those grantees. The team limited evaluation to only those grantees who had received a RIF grant. The team then focused on selecting organizations that had participated in both programs and that represented the five primary underserved areas that RIF

9
and RHED has served over the years.16 Finally, the study team attempted to select grantees who had received multiple awards, which likely gave them the most experience with both programs.
The preliminary site visits were selected according to the following criteria.
1. RIF grantee. 2. Participated in both RIF and RHED programs. 3. Included all three types of RIF grantees (Comprehensive, Indian Economic Development
and Entrepreneurship [IEDE], and Single-Purpose). 4. Included grantees from all four underserved communities identified (see section 1). 5. Received multiple awards.
Exhibit 5: Preliminary Site Visits
Grantee State Award ($)
Underserved Area
RIF Grant Type
Number of
RHED Grants
Date of Visit
Housing Development Alliance
KY 300,000 Appalachia Single-Purpose 4 March 17–19, 2014
Nogales Community Development Corporation
AZ 1,999,177 Colonias Comprehensive 3 April 7–10, 2014
Macon Ridge Community Development Corporation
LA 300,000 Mississippi Delta Single-Purpose 4 March 24–27,
2014
Karuk Tribe of California CA 392,266 Tribal
Indian Economic Development and Entrepreneurship
4 March 31–April 2, 2014
RHED = Rural Housing and Economic Development. RIF = Rural Innovation Fund.
Again, the main purpose of the preliminary data collection was to better understand how rural development organizations approached leveraging and capacity building and to pretest and refine the data collection instruments during the early stages of the project. The preliminary site visits also assisted the evaluation team in identifying appropriate and realistic data collection options for the different types of RIF/RHED grants based on the previous stakeholder discussions. As such, the data requirements were different from those for the main selection of site visits, and the primary data collection tools were the discussion guides and the notes based on the free-ranging discussions during onsite meetings with stakeholders and grantees. The study team integrated all
16 As previously noted, farmworker organizations were originally included in the analysis, but no applications from such organizations were identified in the RIF grant awards.
10
data collected during this stage of the evaluation into the larger database compiled for the project and included it in the general analysis where appropriate. Reports of the preliminary site visits and summaries of the stakeholder meetings are included in Appendix B: Stakeholder Meeting Summaries and in Appendix D: Preliminary Site Visit Reports, both of which were submitted to HUD previously in the evaluation.
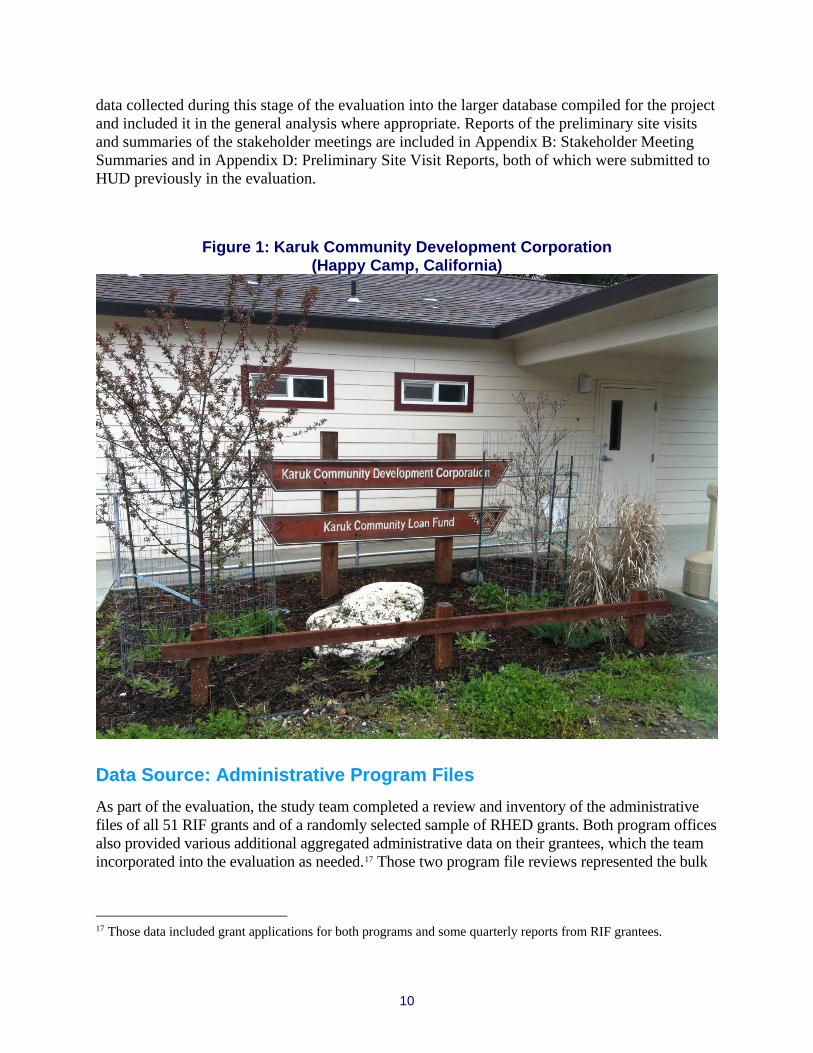
Figure 1: Karuk Community Development Corporation (Happy Camp, California)
Data Source: Administrative Program Files As part of the evaluation, the study team completed a review and inventory of the administrative files of all 51 RIF grants and of a randomly selected sample of RHED grants. Both program offices also provided various additional aggregated administrative data on their grantees, which the team incorporated into the evaluation as needed.17 Those two program file reviews represented the bulk
17 Those data included grant applications for both programs and some quarterly reports from RIF grantees.
11
of the information the team used to create a database for the descriptive and leveraging analyses presented later in the report. The program file review was distinct for each program.
The file review for RIF grantees was more indepth than for RHED grantees for several reasons, most of which came from what the team learned during the initial program file examination. First, because the RIF program is the focus of this evaluation, the team naturally gathered more information on those grantees. Second, for the RIF program, the study team was able to examine the files for all 51 grant recipients from a single grant competition and did not need to make allowances for variance across notice of funding availability formats. Finally, the program office was able to make digital copies of the program files available for all three categories of grantees: Comprehensive, IEDE, and Single-Purpose. Having digital copies ensured that most of the material was in a similar format, which eased the collection and recording of data. The RIF program office also was able to provide some quarterly performance reports and other post-application documents from the RIF grantees, which allowed the study team to confirm some application numbers and gather more data on the grantees. From those files, the team was able to review the grantees’ original applications and collect the data that was used in descriptive and comparative analyses.
The RHED program file review consisted almost exclusively of application files submitted by the grantees. The initial reconnaissance showed that many program files contain additional reports, amendments, and other information but that the information is not consistent across grantees or over time. The grant applications were the only documents consistently available during the 1999-through-2009 timeframe and reliably provided by all grantees. In the team’s opinion, the application files originally submitted by the RHED grantees represent the only consistent and reliable data sources from those files.
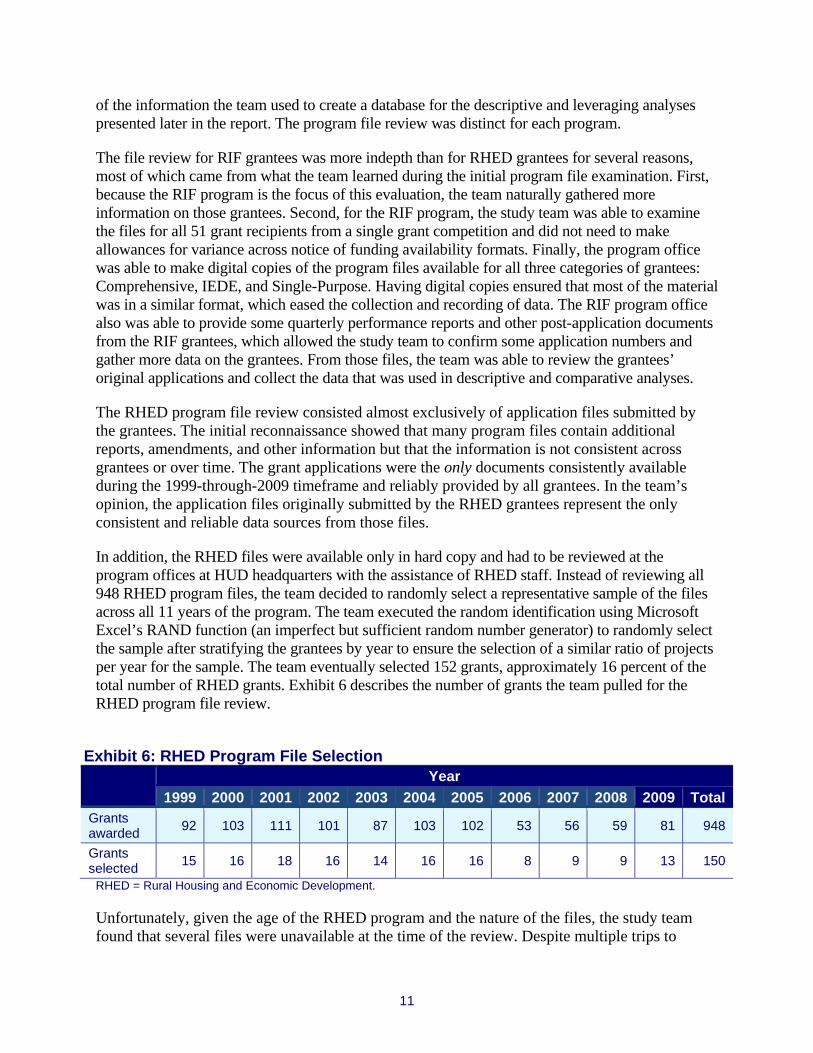
In addition, the RHED files were available only in hard copy and had to be reviewed at the program offices at HUD headquarters with the assistance of RHED staff. Instead of reviewing all 948 RHED program files, the team decided to randomly select a representative sample of the files across all 11 years of the program. The team executed the random identification using Microsoft Excel’s RAND function (an imperfect but sufficient random number generator) to randomly select the sample after stratifying the grantees by year to ensure the selection of a similar ratio of projects per year for the sample. The team eventually selected 152 grants, approximately 16 percent of the total number of RHED grants. Exhibit 6 describes the number of grants the team pulled for the RHED program file review.
Exhibit 6: RHED Program File Selection
Year
1999 2000 2001 2002 2003 2004 2005 2006 2007 2008 2009 Total Grants awarded 92 103 111 101 87 103 102 53 56 59 81 948
Grants selected 15 16 18 16 14 16 16 8 9 9 13 150
RHED = Rural Housing and Economic Development.
Unfortunately, given the age of the RHED program and the nature of the files, the study team found that several files were unavailable at the time of the review. Despite multiple trips to

12
HUD, the team was unable on those occasions to locate 11 RHED files of the 152 the team randomly identified, 7.2 percent of the total.18 The team decided not to replace those files and executed the review using 141 RHED projects. The accompanying Data Documentation Report includes the number of projects selected and missing. The Data Documentation Report also includes clean copies of those files. The completed spreadsheets will be made available via HUDUSER.gov.
Data Source: Structured Telephone Interviews Another major source of data for this project was the structured telephone interviews that the study team conducted with local RIF and RHED project managers. Each interview lasted approximately 30 to 45 minutes, and a trained staff member or consultant conducted each one, following a structured interview document that contained closed- and open-ended questions. The interview documents for both the RIF and RHED interviews are included in volume II, appendix E.
These interviews were intended to be conducted with all 51 RIF grant administrators and a purposive sample of RHED grant administrators. The team was able to eventually conduct 41 interviews, representing 44 of the RIF grantees (one representative spoke on behalf of four grantees). Of those individuals the study team was unable to interview, 4 grantees did not respond to requests for an interview, and 3 had either returned the grant funds or had gone out of business. The team was unable to contact the following four agencies.
• Keweenaw Bay Ojibwa Housing and Community Development Corporation. • Organized Village of Kake.19 • Southeastern Kentucky Economic Development Corporation. • Pilgrim Rest Community Development Agency.
In addition, several RIF organizations returned their grant, including these three:
• Midwest Minnesota Community Development Corporation. • Confederated Tribes of the Colville Reservation. • Purchase Area Development District, Inc. (Housing Corporation).20
Finally, the RIF grantee Young Adult Development in Action, Inc., went out of business after receiving their grant. The Data Documentation Report includes a document showing the dates of the interviews, the interviewer, and copies of the interview documents.
The RHED interviews were much more difficult to conduct. Two primary data collection issues had to be addressed with the RHED telephone interviews. First, the study team required a 18 The study team reviewed RHED HUD Headquarters files; however, HUD Headquarters staff indicated that additional information is also available in the Office of Community Planning and Development’s 48 field offices, where the field office directors have oversight and monitoring authorization and the records are more complete. The study team did not have the ability to travel to those offices to complete file reviews. 19 The Organized Village of Kake did not respond to requests for a telephone interview, although they participated fully in the site visit portion of the evaluation. 20 Purchase Area Development District, Inc., returned a portion of their grant; the other two organizations returned their full grant. The analyses in sections 4, 5, and 6 account for that information.
13
sampling procedure to select the organizations to interview. Second, given that RHED has been operating since 1999, many staff members and even entire organizations were not available to interview. The team was particularly concerned about the likelihood of collecting useful information through telephone interviews from older RHED grantees and feared that a purely random sample would produce too many grantees that were no longer in existence or had not participated in the program for several years. Missing and nonresponsive grantees were a problem even in the group of much more recent RIF grantees. Too many unavailable grantees or grantees whose projects were too far in the past would have significantly increased the cost of data collection efforts. In addition, having to replace many missing randomly selected grantees in the sample would have eliminated the effectiveness of a random sample.
For those reasons, the study team believed that the more efficient method was to start with a purposive sample of RHED grant administrators to interview by telephone. The team therefore developed a series of criteria for selecting a purposive sample of RHED grantees who the team believed would provide the best opportunity to contact administrators with useful insight. Those selection criteria emphasized recent grantee organizations with multiple RHED awards that covered all four disadvantaged areas that RHED serves. The selection criteria are similar to those for the preliminary site visits. Following those criteria, 35 total grantees were interviewed.
• Received an RHED grant after 2005 (310 grantees). • Received multiple RHED awards (141 unique repeat RHED grantees). • Did not receive a RIF grant (118 unique repeat grantees). • Includes similar numbers as the four disadvantaged communities.
In addition, for the RHED telephone interviews, the study team was required to collect contact information and staffing information from public sources. Given the age of the projects, the RHED program office was not able to provide contact information for the selected grantees. The study team attempted to locate that information using other sources, including Internet searches and other program files. Eventually, the team retrieved contact information for 95 of the 118 RHED grantees the team identified using the purposive sample criteria listed previously. Of those 95 grantees, the team completed interviews with 35 grantees, for a 36.8 percent response rate.21 That small sample makes directly comparing the data from the RHED interviews and the RIF interviews impossible; however, the open-ended questions and other data collected were valuable nonetheless.
Finally, the team used a consistent contact procedure across both sets of structured interviews. After an initial e-mail to all grantees from HUD program offices to introduce the study team, interviewers scheduled and conducted the interviews directly with the grantees and indicated their responses using our RIF and RHED telephone survey instruments. Those documents are included in volume II, appendix E.
21 This total is fewer RHED interviews than originally hoped, but final numbers depended on staff availability and organizational permanence. Many organizations were unavailable or had no staff with knowledge of the previous RHED grants.

14
Data Source: Site Visits To examine some of the more detailed and nuanced issues that the telephone interviews covered, the study team also conducted 11 primary site visits to grantees. Those visits were in addition to the four preliminary site visits. The intent was for the grantees to describe some of the more qualitative outcomes that the projects have had in their communities and to identify any outcomes or impacts from RIF projects that are observable on site but not currently captured by HUD’s administrative data or reporting.
The study team conducted each site visit using a standard protocol. Two senior members of the evaluation team—Rich Hilton and James Hedrick—oversaw the data collection and reporting for all site visits. Those individuals were responsible for documenting and reviewing all discussions and interviews, coordinating onsite visits, and ensuring that data were collected consistently. In addition, because making all 15 site visits (including the preliminary site visits) and completing them on time was impossible for Hilton and Hedrick, the Co-Principal Investigators, the team had to identify and train a site visit team. The study team also determined that, given travel budgetary constraints, sending employees and consultants who were near some of the selected sites would be most cost effective. All site visitors were familiar with the data collection protocols, were experienced in conducting those types of visits, and attended the training session held on November 14, 2014. The site visit training guide is included in the Data Documentation Report and exhibit 7 lists the site visit team.
Exhibit 7: Site Visit Team Personnel Position Location
Richard Hilton Co-Principal Investigator Bethesda, MD James Hedrick Co-Principal Investigator Bethesda, MD Chuck Hanson Project Director Bethesda, MD Lindley Higgins Senior analyst Bethesda, MD Wayne Mundy Senior analyst Kenai, AK Alex Thackeray Senior analyst Denver, CO Shireen Riazi-Kermani Senior analyst Bethesda, MD Doray Sitko Senior analyst Austin, TX Mark Stewart Senior analyst Bethesda, MD
Information-gathering activities on each site visit included the following.
• Discussions with grantees to obtain background data on funding options that may have been available to the applying entity.
• Physical observation (when appropriate) of the structure funded through the RIF grant, which was used to place the funded projects in a community context.
• Discussions with representatives of other programs or entities whose programs were associated or partnered with the RIF/RHED project. Discussions focused on how the partnership originated and how effective the representatives view the program integration.

15
• Discussions with local-entity staff on the availability of quantifiable output and outcome data, the sources for these data, and an assessment of the reliability and consistency of the data.
• Discussions with individuals associated with the original application regarding the applicability of RIF/RHED to current local conditions.
Two members of the site visit team conducted each 2- to 3-day visit. To document each site visit, the team used a standard site visit report template that was approved by HUD as part of the Data Collection and Analysis Plan and the Office of Management and Budget clearance process. The study team produced an internal site visit report for each primary site visit and included them in volume II, appendix F. The Taos Pueblo Preservation Project (TPPP) of the Taos Pueblo Housing Authority was one site visited. Figure 2 is of some of TPPP’s multi-use buildings.
Figure 2: Taos Pueblo, Native Business (Taos, New Mexico)
The study team selected sites purposively within the framework of the six RIF activity types identified in exhibit 3 using a set of selection criteria approved by HUD and OMB. The positive criteria focus on selecting grantees who received larger grants and ensuring that at least one-half of

16
the sites selected were tribal grantees.22 In addition, the team was constrained by the contract’s travel budget. As stated previously, two people conducted each site visit, and sending them to remote locations increased costs. When possible, the team attempted to avoid selecting particularly remote locations. For example, the Village of Atmautluak in Alaska was a RIF IEDE recipient; however, it is approximately 4 hours west of Anchorage, Alaska, by plane and inaccessible by car. Selecting the Village of Atmautluak as a site visit location would have been exceptionally expensive, even though it satisfied the other selection criteria. The selection criteria and constraints are listed below. Exhibit 8 combines the preliminary site visits with a list of the evaluation’s primary site visit locations.
Exhibit 8: Site Visit Locations Grantee State Award ($) Underserved
Area RIF Grant
Type RHED Grants
Date of Visit
Site Visit Team
Preliminary site visits Housing Development Alliance (Hazard—Perry County)
KY 300,000 Appalachia Single-Purpose 4 March 17–19, 2014
James Hedrick and Rich Hilton
Nogales Community Development Corp.
AZ 1,999,177 Colonias Comprehensive 3 April 7–10, 2014
James Hedrick and Rich Hilton
Macon Ridge Community Development Corp.
LA 300,000 Mississippi Delta Single-Purpose 4 March 24–27,
2014
James Hedrick and Lindley Higgins
Karuk Tribe of California CA 392,266 Tribal
Indian Economic Development and Entrepreneurship
1 March 31,
2014–April 2, 2014
James Hedrick and Chuck Hanson
Primary site visits Chippewa Cree Tribe MT 2,000,000 Tribal Comprehensive — February 3–4,
2015 Rich Hilton and Wayne Mundy
Oglala Sioux Housing Authority SD 2,000,000 Tribal Comprehensive 6 March 9–10,
2015
James Hedrick and Lindley Higgins
San Felipe Pueblo Housing Authority NM 1,660,000 Tribal Comprehensive — January 16–
17, 2015
Rich Hilton and Shireen Riazi-Kermani
Keweenaw Bay Indian Community MI 800,000 Tribal
Indian Economic Development and Entrepreneurship
3 December 3–5, 2014
James Hedrick and Lindley Higgins
Choctaw Nation of Oklahoma OK 776,294 Tribal
Indian Economic Development and Entrepreneurship
3 November 24–25, 2014
Rich Hilton and Doray Sitko
22 The contract required one-half of the sites visited to be tribal grantees.

17
Grantee State Award ($) Underserved Area
RIF Grant Type
RHED Grants
Date of Visit
Site Visit Team
Organized Village of Kake AK 567,908 Tribal
Indian Economic Development and Entrepreneurship
— December 2–3, 2014
Rich Hilton and Wayne Mundy
Taos Pueblo NM 799,997 Tribal Indian Economic Development and Entrepreneurship
— March 30–31, 2015
James Hedrick and Alex Thackeray
Community Students Learning Center
MS 1,974,462 Mississippi Delta Comprehensive — December 11–
12, 2014
James Hedrick and Lindley Higgins
PathStone Corp. PR 2,000,000 Rural community Comprehensive — November 18–
21, 2014 James Hedrick and Mark Stewart
Portable Practical Educational Preparation
AZ 1,557,840 Rural community Comprehensive 4 November 18–
21, 2014
Alex Thackeray and Lindley Higgins
Southern Bancorp Community Partners
AR 1,998,621 Rural community Comprehensive — December
8–9, 2014
James Hedrick and Lindley Higgins
RHED = Rural Housing and Economic Development. RIF = Rural Innovation Fund. Following are the site visits selection criteria.
• Eight of the site visits were required to be tribal grantees.
• Recipients of larger grants were preferred, specifically IEDE and Comprehensive grants.
• When possible, the team avoided extremely remote sites that would strain the travel budget.
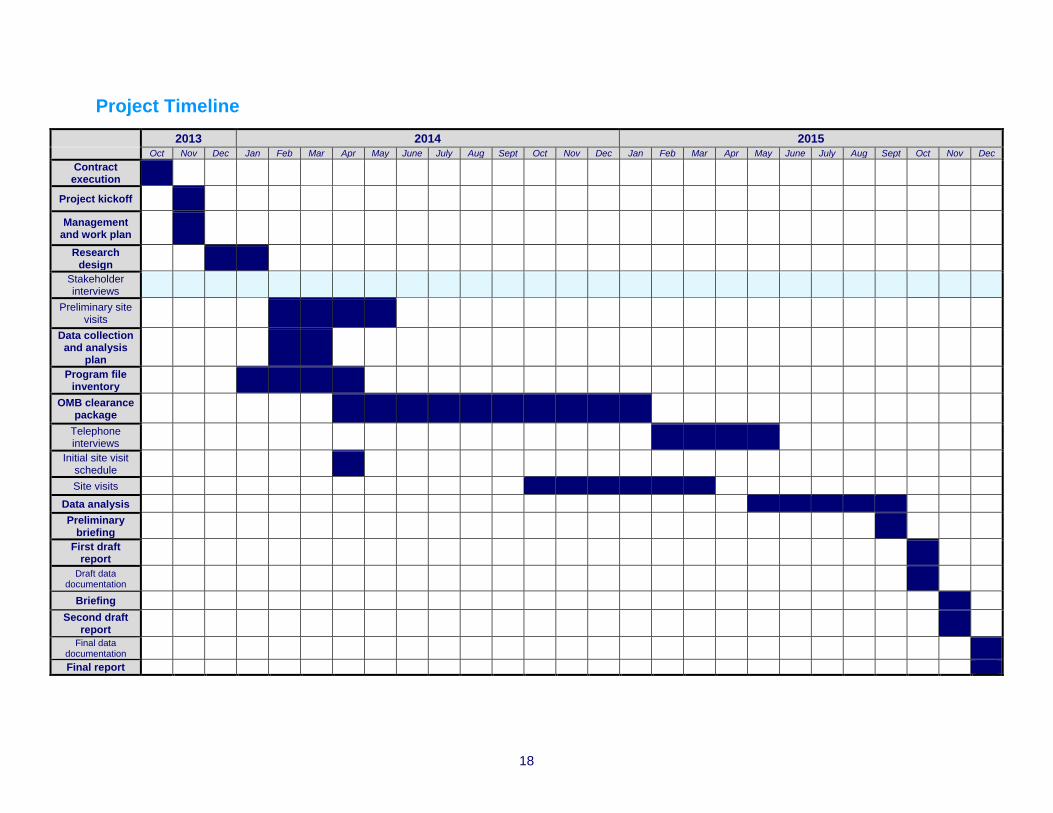
Finally, to clarify the description of data collection efforts and provide a sense of the scope of the RIF evaluation, a project timeline follows. This timeline includes information for all tasks the study team has undertaken as part of this evaluation.
18
Project Timeline 2013 2014 2015 Oct Nov Dec Jan Feb Mar Apr May June July Aug Sept Oct Nov Dec Jan Feb Mar Apr May June July Aug Sept Oct Nov Dec
Contract execution
Project kickoff Management
and work plan
Research design
Stakeholder interviews
Preliminary site visits
Data collection and analysis
plan
Program file
inventory OMB clearance
package Telephone interviews
Initial site visit schedule Site visits
Data analysis Preliminary
briefing First draft
report Draft data
documentation Briefing
Second draft report
Final data documentation Final report
19
3. Summary of Overall Findings The following sections describe the research findings based on the data collection activities described in Section 2. Section 3 presents a detailed summary of the evaluation findings. Sections 4, 5, and 6 describe the findings in more detail based on the three main research objectives laid out in Section 1.
The Rural Innovation Fund initially provided 51 grants to rural organizations.23 The grantees used those funds to support a wide variety of projects across the nation. The most common use of the grant funds across the three categories was to promote housing development and rehabilitation. More than 70 percent of all successful applications included some type of housing development activity. By comparison, only 38 percent included an economic development component to facilitate business development.
In addition, most RIF grants went to tribal organizations. Thirty of the 51 grants went to tribes or their affiliates, including the nine set-aside Indian Economic Development and Entrepreneurship grants. In addition, more than one-half (18 of 34) of the Single-Purpose grants were awarded to tribes, and three of the eight Comprehensive grants went to tribes as well. The number of grants going to tribes was more than double for RIF (59 percent) what it was for the Rural Housing and Economic Development program (26 percent). In short, the RIF program heavily favored tribal applicants, even apart from the Category 2: Economic Development and Entrepreneurship for Federally Recognized Indian Tribes set-aside laid out in the RIF notice of funding availability.
Geographically, although California received the most grants—seven—Arizona received the most money, with nearly $4.5 million. In addition, the grantee service areas had a much higher poverty rate and unemployment rate than did the nation as a whole when the RIF grants were awarded in 2010. Other frequent indicators of distress cited by the applicants included dilapidated and foreclosed housing, crime, and population loss.
The RIF program’s $30 million leveraged an additional $57 million from other sources, a rate of 191 percent. The distribution of leverage was highly skewed, with one Single-Purpose grant alone providing more than one-fourth of all leverage. Organizations with larger budgets had, on average, higher leverage rates. Tribes had, on average, lower leverage rates than did nontribal grantees. More than 90 percent of tribes provided their own leverage, whereas nontribal grantees were most likely to obtain their leverage from private sources. Tribal leverage distribution was even more skewed, with two grantees providing 60 percent of all tribally generated leverage. In general, the leverage rates were lower for RIF than they were for the RHED program, although Single-Purpose grant leverage rates were comparable to RHED rates, with a higher mean rate but generally a lower median rate.
Comparing the larger RIF grants to the smaller RIF and RHED grants is inherently problematic. No standard exists by which to measure how much more impact a $2 million grant should be expected to
23 The Colville Confederated Tribes of Washington and Midwest Minnesota Community Development Corporation returned their grants because the organizations could not complete their projects. In addition, Purchase Area Development District, Inc., returned a portion of its grant.

20
have than one—or even several—$300,000 grants. The comparison is further complicated by the small sample size of large grants, the variety of projects grantees funded, and the fact that many RIF grantees have not yet completed their projects at the time of the evaluation.24 The very different character of the grants made to tribal versus nontribal organizations, particularly the lower leverage and partnering rates, also complicates the comparison between the large and small grants.
Methodological difficulties aside, there is no evidence to suggest that the larger Comprehensive grants had a consistently greater impact than the smaller Single-Purpose grants. Quantitative comparisons of the large and small grants show that leverage was achieved at a greater rate for the Single-Purpose grants (358 percent) than for the Comprehensive (127 percent) or IEDE grants (69 percent). Exhibit 9 shows those rates as leverage totals compared with total funds.
Exhibit 9: Leverage Rates by Grant Type
IEDE = Indian Economic Development and Entrepreneurship.
Even using median leverage per grant to ameliorate the effect of the significant skew, analysis shows a slightly higher leverage rate for Single-Purpose grants (68 percent) than for Comprehensive grants (67 percent), with IEDE grants leveraging at the lowest rate (58 percent). The funded projects, based on total development costs reported in the application, were proportionally larger for Single-Purpose grants for Comprehensive grants.
Qualitative comparisons failed to show proportionate effects for the Comprehensive grants, as well. Comprehensive grantees did not report improved financial health at a higher rate than did other grantees. They also did not report expanding into new areas of activity at a higher rate than did Single-Purpose grantees, and two Comprehensive grantees (of eight) reported no increase in technical capacity at all. Comprehensive grantees did seem to
24 Many grantees we interviewed indicated that HUD had taken approximately 1 year after awarding the grants to provide any project funding, and that may have contributed to the delay many grantees experienced in completing their projects on schedule.

21
enhance leveraging and partnering capability at a greater rate than did Single-Purpose grantees, although the small sample size makes generalizing about that tendency impossible.
During the evaluation, the team also noted several other findings not directly related to the three primary research questions, but they are included here to provide a complete picture. Other findings include—
• The majority of RIF and RHED grantees completed their projects well past their original scheduled completion dates.
• Grantees frequently cited the RIF program’s flexibility in the use of funding as the best aspect of the program.
• A high proportion of organizations (61 percent) included energy efficiency or housing counseling (40 percent) as part of their program, but very few used mixed-finance strategies (only one had secured tax credits), which are popular in more urban areas.

22
4. Descriptive Findings The Rural Innovation Fund provided 51 grants totaling $31,355,235 to rural organizations. Its predecessor, the Rural Housing and Economic Development grant program, provided 948 grants totaling approximately $248 million to 488 organizations during an 11-year period. In this section of the evaluation, the RIF and RHED programs are compared across a number of categories.
• Project type. • Organization type. • Geographic distribution. • Local economic conditions.
In some cases the team used only RIF Single-Purpose grants compared with the sample of RHED grants, as those grant types are more similar in size. Additional information about project types can be gleaned from output data; however, because of the relationship between outputs, total development costs, and leverage, this information will be examined in section 5, which focuses on the issue of leverage.
Project Type This evaluation compares RIF and RHED project types using a breakdown of project activities provided by HUD that divides the projects into the following six categories.
1. Housing development and rehabilitation. 2. Specific business enterprise startup. 3. Commercial real estate or infrastructure development to facilitate business activity. 4. Direct development of infrastructure improvements. 5. Loans to homeowners or multifamily rental. 6. Loans to business owners.
RIF Single-Purpose and RHED Sampled Grants For the RIF program, the team used only the Single-Purpose grants for comparisons with the sample of 141 RHED grants. RIF set the grant size for Single-Purpose grants at $300,000, and in later years the RHED program did the same, making those grants more similar in size than the Comprehensive and Indian Economic Development and Entrepreneurship grants. In addition to similar grant sizes, those projects often were similarly scoped in overall size, as defined by “total development costs.”
By contrast, RIF Comprehensive grants typically involved multiple activities, making simple categorization according to exhibit 3 problematic. IEDE grants primarily fit into the categories under “Business Development,” as the language of the notice of funding availability required. That activity concentration was predetermined by the RIF NOFA, as it defined Category 2: Economic Development and Entrepreneurship for Federally Recognized Indian Tribes as grants to “promote economic development and entrepreneurship through activities including the capitalization of revolving loan programs and business planning and development” (page 10). The study team analyzed project types for the Comprehensive and IEDE grants separately from the RHED and Single-Purpose grants.

23
The study team determined project types for the RIF-funded projects using rating factor 3, Soundness of Approach, from the application document. Soundness of Approach describes the work to be done in response to factor 2, Need and Extent of the Problem. Those narratives describe the activities the organizations planned to fund with the RIF grant, including how the plan addressed an identified need, a management plan for the project, and a project budget describing how the grantee would spend RIF funds. In addition, the file reviews for those grants included a list of projected outputs.
For the RHED grants, the database of 141 randomly selected grants included a column entitled Project Summary. The team derived the project descriptions from the grant applications, which were very similar in structure to the RIF applications. The summaries in the RHED database usually were very brief, however—often only one sentence in length. The team coded them according to the predominant activity in the description.
For both programs, determining how to categorize the project type of a particular grant was somewhat subjective, as many of those descriptions did not easily fit into any of the six categories, or they fit into more than one category. For example, the grant may have been used to pay or train financial fitness counselors, an activity that does not conform to the categories laid out in exhibit 3. Other early RHED grants often were used solely to fund organizational capacity building, including activities such as paying a new staff member’s salary. To address the project descriptions that did not fit into any of the six HUD-defined categories, the study team used an additional category, Other.
Other project descriptions may have included more than one activity, causing certain projects to be put into more than one category. For the 34 Single-Purpose RIF grants, the study team identified and coded 58 activities. For the 141 RHED grants, the team identified 191 specific activities. The study team believed that identifying and categorizing each activity was more important than attempting to determine the primary activity being pursued. Some analyses, therefore, may contain more identified activities than the number of grantees in the category.
Exhibit 10 compares the number and portion of project activities described for Single-Purpose RIF grantees and selected RHED grantees, using the total number of activities as the basis for the analysis.

24
Exhibit 10: Project Type, by Activity Category
RHED = Rural Housing and Economic Development. RIF = Rural Innovation Fund. Note: Uses RIF Single-Purpose grants and the RHED sample for the analysis.
For both programs, housing-related grants were the most common, accounting for more than 40 percent of all Single-Purpose RIF grant activities and more than one-half of RHED activities. Commercial real estate or other efforts to support business activity were the next most common, with that activity representing about 22 percent of activities for both programs. Lending for housing and business accounted for about 17 percent of all RIF activities and 14 percent of RHED activities. In the Other category, housing counseling was the most common activity for the RIF program, whereas a number of RHED grants supported organizational capacity-building activities.
The RHED program seems to have been more amenable than RIF to supporting capacity building. Determining which projects constituted capacity building and which did not was a subjective exercise; projects that mentioned hiring staff or purchasing equipment were considered capacity building, whereas those that described creating new programs were not. One important consideration used in the coding determination was whether the primary beneficiary was the organization, rather than the community it served. In addition, the study team identified projects that were primarily focused on building capacity, in most cases not describing the specific activities for which the funds would be used.
In examining the 141 RHED project descriptions for indications that the grant would be used to strengthen the organizations themselves, the study team identified 44 projects (29 percent) as being primarily about building capacity. Most of those projects were general capacity-building efforts, and most of the project summaries proposed to use the RHED grant funds to strengthen the organization without identifying any specific projects or activities that the organization would undertake with the additional funds. Those brief project descriptions did not reference housing, economic development, lending, or infrastructure. For example, a number of the summaries described using the grant to hire staff, perform a market study, or improve financial or technical systems, none of which fit into the categories in exhibit 10.

25
For the RHED program, the most common activity combined with housing was category 3, economic development activities that did not support a specific business. In 34 of the 45 grants examined that referenced more than one category, the grantees planned to combine housing and economic development activities in their projects. Lending was mentioned 27 times in the project summaries, 16 in relation to housing (category 5) and 11 to businesses (category 6). Often the descriptions of category 5 and 6 projects involved the creation or support of a community development financial institution (CDFI) that would handle the lending function. In nine cases, the project summary identified a specific business that was to be either started or improved (category 2). Category 4 projects (involving improvements to infrastructure) were the least common, with only three grants.
More than 70 percent of RIF Single-Purpose grants had a housing component to them, slightly higher than the RHED sample. The second-most common activity for both programs was commercial real estate development or other infrastructure to support business, with nearly 40 percent of RIF Single-Purpose grants including some support for business (Category 3). The RIF program also included much more lending directly to businesses than did the RHED program, with more than twice the proportion of projects citing direct business lending.
The frequency of projects in the Other category also was much higher for the RIF Single-Purpose grants, most likely because of the more detailed project descriptions available for RIF grants. Those more expansive project descriptions allowed the study team to identify many project activities undertaken by the RIF grantees that were not included in the list of six activity categories. For example, the types of activities that were identified in the Other category included developing a community center, job training, and housing counseling. Overall, the types of projects the RIF Single-Purpose grantees and the RHED grantees undertook with the funds did not seem to be significantly different.
Comprehensive Grants The eight RIF Comprehensive grants ranged in size from $1.6 million to $2.0 million and totaled $15.2 million. HUD expected that projects funded under this type of grant would “demonstrate high levels of ingenuity and innovation… that would achieve a self-sustained effort not dependent on continued HUD resources” (2010 RIF NOFA page5). Eligible activities included housing, economic development, and infrastructure investment but were not strictly limited by the NOFA.
Six of the eight Comprehensive grants were for projects that included both a housing or community facility and an economic development component, one provided only housing, and another supported infrastructure development. A brief description of each of the Comprehensive grant projects follows; the first two projects—San Felipe Pueblo Housing Authority (SFPHA) and Southern Bancorp Community Partners (SBCP)—are examined in more detail in brief case studies in section 8. More detail on all eight Comprehensive grants can be found in field reports from the site visits in volume II, appendix F.
SFPHA built homes, created jobs, assisted businesses, and counseled potential homebuyers. The project also saw the creation of a force account crew to undertake housing authority and tribal construction projects.

26
SBCP designed a project that targeted the revitalization of downtown Helena, Arkansas, that included business development and housing. In addition, the program incentivized job creation and homeownership, helping potential homebuyers with individual development accounts and downpayment assistance.
PathStone Corporation proposed a project that included entrepreneurship and job training, housing counseling and education, the development of homes for sale and for rent, and the creation of a micro-enterprise loan fund. The project also helped develop an agritourism trail through the rural coffee-growing areas in the center of the island.
Nogales Innovation Consortium Partnership developed a neighborhood resource center as part of a project that created jobs, provided training, and rehabilitated homes, partnering with several organizations in the area.
Portable Practical Education Preparation expanded its YouthBuild program, providing additional room for students and increasing its repair, rehabilitation, and construction outputs.
Community Students Learning Center (CSLC) significantly expanded its program areas by incubating new businesses, building new homes in a small subdivision, and providing job training and housing counseling.
The Chippewa Cree tribe built a water main and storage tank as part of a regional water conversation and supply plan.
The Oglala Sioux Housing Authority built energy-efficient homes at preexisting villages across the reservation.
As can be seen from these descriptions, the Comprehensive grant program funded a wide variety of projects, with only three grantees—CSLC, SBCP, and PathStone—taking on projects that were both varied in their outputs and geographically targeted.
IEDE Grants The IEDE program provided nine grants ranging from $240,970 to $800,000, with the total dollar amount slightly less than $6 million. Only federally recognized tribes were eligible for those grants, and the NOFA (page 10) states that applicants must pursue “economic development and entrepreneurship” activities, specifically citing capitalizing revolving loan funds and business planning and development as eligible activities.
The Atmautluak Traditional Council formed a for-profit business, the Pikat Housing Development Company, dedicated to constructing green, energy-efficient, culturally informed healthy homes for the Village of Atmautluak, creating approximately 50 permanent positions.
The Organized Village of Kake used its grant to provide small business development assistance to startup oyster and geoduck farmers.
The Keweenaw Bay Indian Community’s Aanikoosing, Inc., project established a tribal corporation that will develop businesses. A filling station with a convenience store was the first business developed.
27
The Taos Pueblo Preservation Project aimed to rehabilitate traditional multiuse spaces in the Old Village to be used as housing, space for potential microenterprises or retail activities, and traditional cultural activities. They further planned to provide education and training and facilitate branding and marketing planning for pueblo products.
The Kalispel Tribe of Indians planned to develop a field tree nursery that uses native plant stock to restore lost habitat across the reservation. They also planned to create forestry career apprenticeship opportunities for tribal members.
The Lac Courte Oreilles Tribe planned to rehabilitate a school to serve as a visitor center, the core of an effort to increase tourism in the area.
The Karuk People of Northern California sought to increase employment in their target area by supporting job creation for low-income and unemployed tribal members, including small business ownership, entrepreneurship, job training and career development, and credit and fiscal counseling for first-time homeowners.
The IEDE grants all had important capacity-building components, increasing the ability of the tribe to promote economic activity on their reservations.
Project Type and Organization Size: All RIF Grantees For this section of the descriptive analysis, the study team divided RIF grantees into organizations with budgets of $1 million or more and those with less than $1 million to see if the types of projects proposed differed between the two groups. Data on the organizations’ budgets were available for only the 40 RIF grantees that completed the faith-based Ensuring Equal Opportunity for Applicants Survey (SF 424-SUPP) in their application. One of the organizations that did not complete the survey worked in a colonia; the rest were tribes. Of the 40 organizations that completed the survey, 15 had budgets of less than $1 million and 25 had budgets of $1 million or more.
As shown in exhibit 11, the project activities undertaken were largely the same for larger and smaller organizations across the first four categories. Differences appeared in the final two categories, which correspond to lending. Smaller organizations were nearly four times more likely to provide housing loans, whereas larger organizations were nearly four times more likely to provide business loans. That finding suggests that because business lending is more risky and complex, larger organizations were more likely to take on that type of lending than were smaller ones.

28
Exhibit 11: Project Type, by Organization Size Project Category < $1
Million (%) ≥ $1 Million
(%) Housing development and rehabilitation 34.4 36.6 Specific business enterprise startup 3.1 4.9 Commercial real estate/facilitate business activity 25.0 26.8 Direct development of infrastructure improvements 3.1 4.9 Loans to homeowners or multifamily rental projects 9.4 2.4 Loans to business owners 3.1 12.2 Other 21.9 12.2
Note: Analysis uses RIF grantees that completed the Faith-Based Ensuring Equal Opportunity for Applicants Survey (SF424 SUPP).
Organization Type The RIF and RHED programs sorted the types of organizations eligible for grants into categories based on either geography or the population served. RIF used five categories—
• Appalachia’s distressed counties, as defined by the Appalachian Regional Commission.
• Colonias, defined as communities near the border with Mexico.
• Federally recognized Indian tribes.
• Lower Mississippi Delta region.
• Rural communities that do not fit in any of the previous categories.
The RHED program included farmworker organizations as a separate category for a number of years. Farmworker organizations also were eligible organizations under the RIF NOFA, but the team was unable to identify any farmworker organizations among the RIF grant recipients.
As can be seen in exhibits 12 and 13, most of the RIF grants went to Native American Indian tribes, which accounted for 30 of the 51 grants (59 percent of all grants) and 18 of 34 Single-Purpose grants (53 percent of that category). Rural communities not fitting into the other four categories were the next most common category, followed by the Mississippi Delta, colonias, and Appalachia, respectively. The proportions of those types of organizations can be seen in exhibit 14, which includes a comparison with RHED grant distribution across organization type.

29
Exhibit 12: RIF Grant Types, by Organization Type
RIF = Rural Innovation Fund.
Exhibit 13: RIF and Sampled RHED Grants
RHED = Rural Housing and Economic Development. RIF = Rural Innovation Fund.
When compared with RHED, the difference in grant distribution by organization type is very different for the RIF program. Whereas the Rural communities organization type received the highest portion of RHED grants, that type received about one-half that proportion in RIF, and the proportion of tribal grantees was more than double. The proportions of RIF grants going to Appalachia and colonias were also about one-half their RHED proportion.
The study team also examined organization type by size, comparing grantees with budgets of $1 million or more and grantees with budgets of less than $1 million. Of the 20 tribes that responded to the faith-based survey, 15 were larger organizations, accounting for 60 percent of grantees with $1 million or greater budgets; that figure likely underreports the total of tribes in this category, as most of the nonrespondents to the survey were Indian tribes. None of the three

30
organizations working in Appalachian communities had budgets of less than $1 million, whereas organizations working in colonias and the Mississippi Delta were much more likely to have smaller budgets.
Exhibit 14: Organization Type, by Budget Size, RIF Grantees
Grantee Type < $1 Million (%)
≥ $1 Million (%)
Tribal 33.3 59.0 Appalachia 0.0 12.0 Mississippi Delta 26.7 4.0 Colonias 20.0 20.0 Rural communities 20.0 24.0 Total 100.0 100.0
RIF = Rural Innovation Fund.
Grant Location Comparative geographic diversity posed a challenge to evaluate between the two programs. RHED operated for 11 years and provided grants to 488 different organizations, whereas RIF had existed for only 1 year and provided 51 grants. RHED provided awards to grantees in 48 states, Puerto Rico, and American Samoa during the 11 years the program ran. For the 1 year of the program, RIF provided grants for organizations in 20 states and Puerto Rico. The geographic distribution of RIF grants, the types of target areas, and the economic conditions in those target areas are described in the following text.
Grant Distribution by State The projects funded by RIF grants were in rural areas from Puerto Rico to Alaska. California led the way with seven grantees, followed by Arizona with five and Kentucky, Montana, New Mexico, and South Dakota with four each. Twenty states and one territory (Puerto Rico) are represented in the RIF grant program (exhibit 15). Of the 307 grant applications the program received, California produced the most applicants (33), followed by Alaska (22), New Mexico (19), South Dakota (13), and Montana (12).
In total grant dollars, Arizona received the highest amount, with two successful Comprehensive grant proposals and three Single-Purpose grants totaling nearly $4.5 million. New Mexico was second with slightly more than $3 million, followed by Montana and South Dakota, with $2.9 million each.

31
Exhibit 15: RIF Grantees, by State
State Total Single-Purpose IEDE Comprehensive Total Value of
Grants Awarded ($) Alaska 2 0 2 0 1,366,796 Arizona 5 3 0 2 4,457,017 Arkansas 1 0 0 1 1,998,621 California 7 6 1 0 2,192,266 Illinois 1 1 0 0 300,000 Kentucky 4 4 0 0 1,200,000 Louisiana 2 2 0 0 600,000 Michigan 2 1 1 0 1,100,000 Minnesota 1 1 0 0 300,000 Mississippi 1 1 0 0 1,974,462 Montana 4 3 0 1 2,900,000 New Mexico 4 2 1 1 3,059,997 North Carolina 1 1 0 0 300,000 Oklahoma 3 2 1 0 600,000 Oregon 1 1 0 0 300,000 Puerto Rico 2 1 0 1 2,300,000 South Dakota 4 3 0 1 2,900,000 Texas 1 1 0 0 300,000 Virginia 1 1 0 0 300,000 Washington 2 0 2 0 1,040,720 Wisconsin 2 1 1 0 1,089,063
IEDE = Indian Economic Development and Entrepreneurship. RIF = Rural Innovation Fund.
Local Conditions As part of the application, RIF grantees often included information about the places to be served and data on economic conditions there. The study team analyzed data from the applications concerning size of populations to be served, geographies served, and target area poverty and unemployment rates.
Although not all applications included population, the study team gleaned population estimates from 39 of the 51 successful applications. The populations found in the applications ranged from 72 to more than 190,000. A few grantees served large areas, but 23 of 39 (59 percent) served areas of fewer than 5,000 inhabitants, of which 9 (23 percent of total) served populations of less than 1,000. The mean population that grantees sought to serve was 16,644, with a median figure of 4,606.

32
Most of the target areas were reservations or parts of reservations, which is not surprising given the large portion of tribal grantees. Other target areas ranged from part of a single census tract to a county, with a specific city, town, or village often cited.25
As part of the application, most grantees included the poverty and unemployment rates26 in the places they sought to serve—the two indicators of distress identified most prominently in the NOFA. The average poverty rate in places to be served was twice the national rate at the time: 31.3 percent in the service areas versus a 15.1 percent national rate for 2010 (exhibit 16). Poverty rates ranged from 3.7 percent to 65.4 percent, with only two grantees serving places with poverty rates below the national average. Unemployment rates in the areas to be served averaged 15.9 percent, more than one-and-one-half times the national rate for December 2010: 9.3 percent. Unemployment rates ranged from an economically healthy (for the time) 5.2 percent to a notably high rate of 67.9 percent.
Exhibit 16: Mean Unemployment and Poverty Rates Among RIF Grantee Areas
Target Area (%)
National Rate (%)a Range (%)
Unemployment 15.9 9.3 3.7–65.4 Poverty 31.3 15.1 5.2–67.9
RIF = Rural Innovation Fund. a The highest unemployment rate was on a reservation, Chippewa Cree, with Northern Cheyenne a close second. Neither unemployment nor poverty was higher for tribal organizations, however, with averages for tribal versus. nontribal grantees about the same. The two highest poverty rates were reported from grantees in Puerto Rico.
Grantees cited a variety of other local needs in the Need and Extent of the Problem section of the application. The most common indicator of distress they mentioned was dilapidated or abandoned housing, which was cited by 27 grantees (more than one-half). Foreclosure was the next most common local problem and was cited by 10 grantees. Other problems cited included crowded housing, crime, job loss, and population loss.
The RIF grantee PathStone, Inc., developed a comprehensive project to address the needs of the rural Castañer area of western Puerto Rico. The target area for the PathStone project included Puerto Rico’s historical coffee-growing region (figure 3).
25 Service area, as defined by the grantees in their applications, may refer to geographies such as a small town, a particular parish, or a small tribal village. 26 National poverty and unemployment figures are as of December 2010. See Bureau of Labor statistics: http://data.bls.gov/timeseries/LNS14000000 and the U.S. Census Bureau: https://www.census.gov/newsroom/releases/archives/income_wealth/cb11-157.html.

33
Figure 3: Senor Café—PathStone, Inc., RIF Grant (Castañer Region, Puerto Rico)
RIF = Rural Innovation Fund.

34
5. Leveraging Findings Grantees’ RIF applications listed $60,043,640 in leverage, a rate of slightly less than 200 percent (leverage calculated as a percent of the grant award). Grantees cited wide ranges of leverage obtained for their projects, from $143,720 to $17,933,134. Because the distribution of leverage amounts has a strong positive skew, the mean amount of leverage for the grants was much higher, at $1,246,234, than the median leverage amount, $382,440. The mean rate of leverage per grant was 265 percent, with a per-grant median of 68 percent (see exhibit 17).
Exhibit 17: Comparative Leverage Across RIF Grant Types All Grants Comprehensive IEDE Single-
Purpose Total funds ($) 29,955,485 15,190,099 5,165,386 9,600,000 Proportion of funds (%) — 51 17 32 Total leverage ($) 57,123,060 19,234,720 3,545,583 34,342,757 Portion of leverage (%) — 34 6 60 Leverage rate (%) 191 127 69 337 Mean leverage/grant ($) 1,190,064 2,404,340 443,198 1,073,211 Mean leverage. rate/grant (%) 272 134 65 358 Median leverage/grant ($) 329,077 1,292,192 449,179 204,940 Median leverage rate/grant (%) 68 65 58 68
IEDE = Indian Economic Development and Entrepreneurship. RIF = Rural Innovation Fund.
RIF Leverage by Program Across the three types of grants, total leverage and the leverage rate were both the greatest for the Single-Purpose grants. The $9,600,000 in Single-Purpose grants generated $34,342,757 in leverage, a rate of 358 percent—by far the highest rate of the three programs. The Comprehensive grant program provided $15,190,099 in grants, which generated $19,234,720 in leverage, a 127 percent rate. The Indian Economic Development and Entrepreneurship grants totaled $5,165,386 and generated $3,545,583 in leverage, for a rate of 69 percent. Thus, although accounting for less than one-third of all grant funds, the Single-Purpose grants accounted for 60 percent of total leverage. Comparatively, the Comprehensive grants were nearly one-half of all grant funds distributed but generated only 34 percent of the leverage, whereas IEDE grants constituted 17 percent of total grant funds and only 6 percent of leverage.
The high proportion of leverage in the Single-Purpose grant program—the higher leverage rate and the higher mean leverage rate per grant—is due to a few very large amounts of leverage in that program. Three Single-Purpose grants account for nearly three-quarters of all leverage for the Single-Purpose program. Those three grants totaled more than $28 million in leverage. One grant alone accounted for slightly less than $18 million in leverage. That grant provided more than one-quarter of all leverage generated by RIF. Examining the median leverage rate per grantee project shows that the amount of funds leveraged across the three programs was relatively close, on a dollar basis, varying only from a median of 68 percent for the Single-Purpose program to 58 percent for the IEDE program.
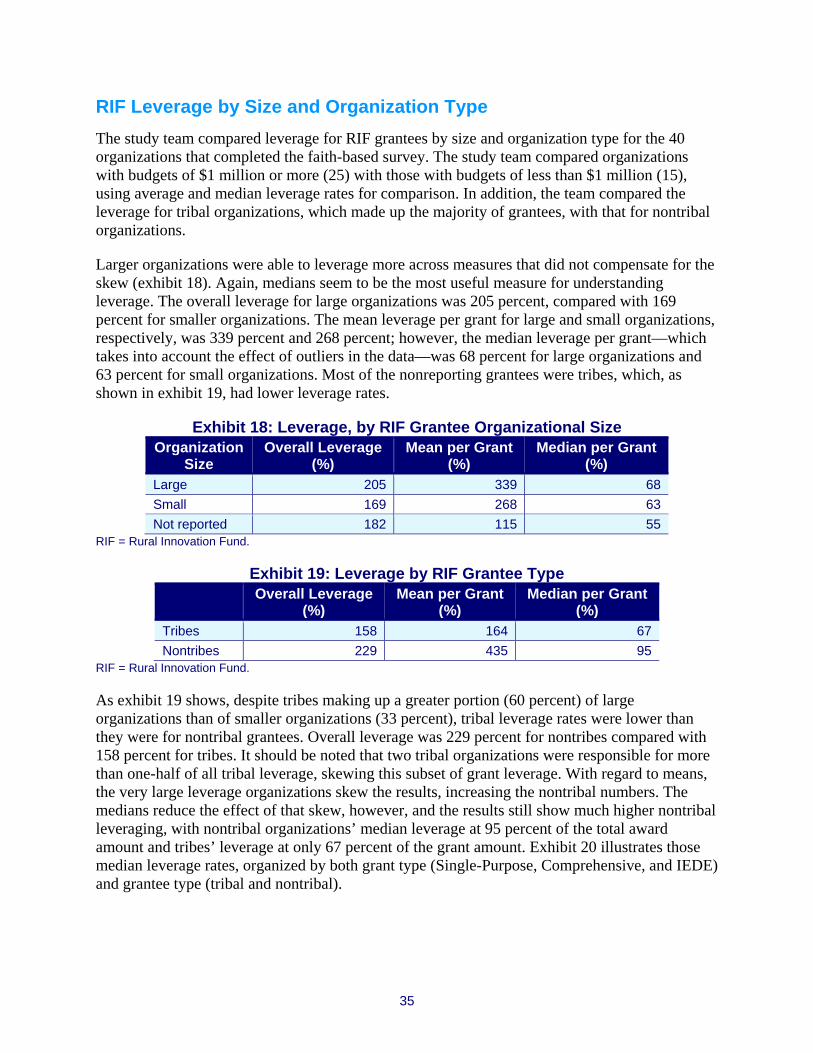
35
RIF Leverage by Size and Organization Type The study team compared leverage for RIF grantees by size and organization type for the 40 organizations that completed the faith-based survey. The study team compared organizations with budgets of $1 million or more (25) with those with budgets of less than $1 million (15), using average and median leverage rates for comparison. In addition, the team compared the leverage for tribal organizations, which made up the majority of grantees, with that for nontribal organizations.
Larger organizations were able to leverage more across measures that did not compensate for the skew (exhibit 18). Again, medians seem to be the most useful measure for understanding leverage. The overall leverage for large organizations was 205 percent, compared with 169 percent for smaller organizations. The mean leverage per grant for large and small organizations, respectively, was 339 percent and 268 percent; however, the median leverage per grant—which takes into account the effect of outliers in the data—was 68 percent for large organizations and 63 percent for small organizations. Most of the nonreporting grantees were tribes, which, as shown in exhibit 19, had lower leverage rates.
Exhibit 18: Leverage, by RIF Grantee Organizational Size Organization
Size Overall Leverage
(%) Mean per Grant
(%) Median per Grant
(%) Large 205 339 68 Small 169 268 63 Not reported 182 115 55
RIF = Rural Innovation Fund.
Exhibit 19: Leverage by RIF Grantee Type Overall Leverage
(%) Mean per Grant
(%) Median per Grant
(%) Tribes 158 164 67 Nontribes 229 435 95
RIF = Rural Innovation Fund.
As exhibit 19 shows, despite tribes making up a greater portion (60 percent) of large organizations than of smaller organizations (33 percent), tribal leverage rates were lower than they were for nontribal grantees. Overall leverage was 229 percent for nontribes compared with 158 percent for tribes. It should be noted that two tribal organizations were responsible for more than one-half of all tribal leverage, skewing this subset of grant leverage. With regard to means, the very large leverage organizations skew the results, increasing the nontribal numbers. The medians reduce the effect of that skew, however, and the results still show much higher nontribal leveraging, with nontribal organizations’ median leverage at 95 percent of the total award amount and tribes’ leverage at only 67 percent of the grant amount. Exhibit 20 illustrates those median leverage rates, organized by both grant type (Single-Purpose, Comprehensive, and IEDE) and grantee type (tribal and nontribal).

36
Exhibit 20: Median Leverage Rates, by Grant Type and Grantee Type
IEDE = Indian Economic Development and Entrepreneurship.
RIF Grants’ Leverage Sources Grantees listed leverage in their applications from a variety of sources. This analysis breaks out those sources by—
• Federal. • Other governmental. • Other public. • Private sources. • The grantees.
Overall, the most common source of leverage was the grantee’s own organization or close affiliate, such as tribes providing leverage to its housing authorities (exhibit 21). More than 60 percent of grantees contributed some of their own funds to their RIF-funded projects. Nearly one-half of the grantees had commitments from private sources in their leverage, and 4 in 10 used federal funds, mostly from either HUD or the U.S. Department of Agriculture.
Exhibit 21: Leverage by Source and RIF Grantee Type Grantee
Type Federal
(%) Other
Government (%)
Other Public
(%) Private
(%) Own
Organization (%)
All grantees 39 22 29 49 61 Tribal 13 7 17 37 93 Nontribal 38 29 29 52 57
RIF = Rural Innovation Fund.
Leverage was achieved very differently for tribal organizations than it was for nontribal ones. More than 90 percent of tribal grantees obtained leverage funds from their own organization or an affiliate organization (for example, the tribal housing authority receiving program contributions from the tribal governor’s office), compared with only 57 percent for nontribal organizations. In fact, for 17 tribal grantees (55 percent), affiliated organizations were their only
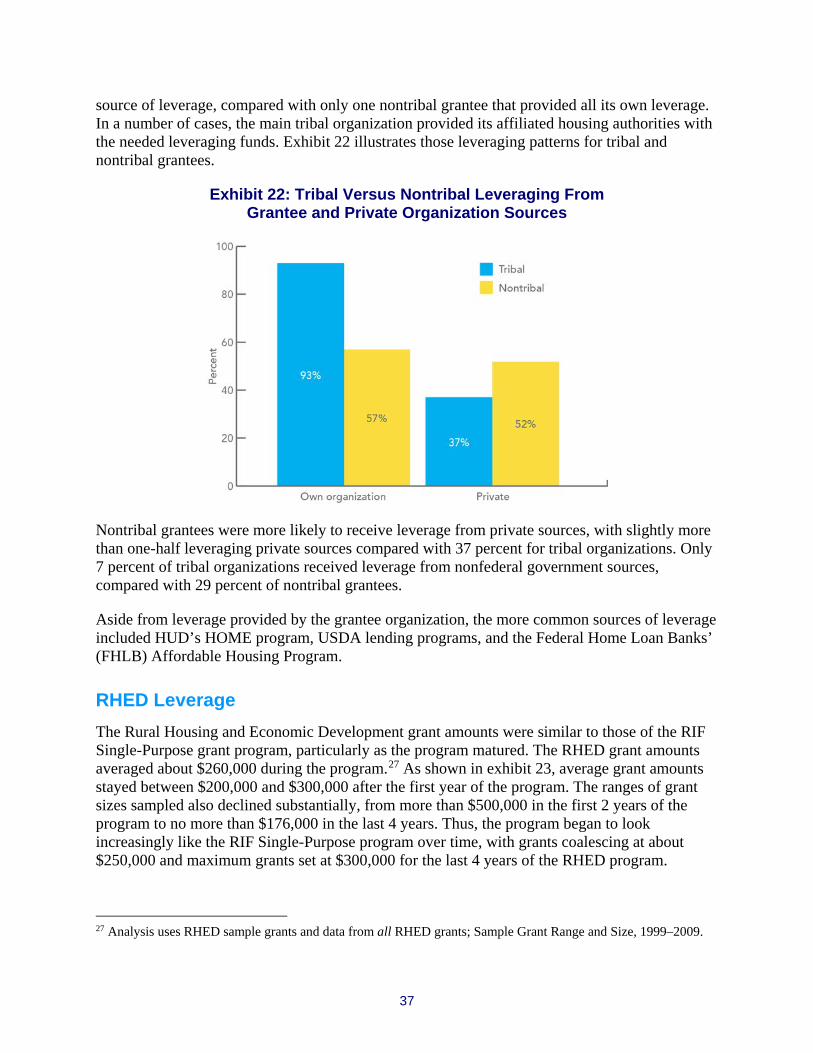
37
source of leverage, compared with only one nontribal grantee that provided all its own leverage. In a number of cases, the main tribal organization provided its affiliated housing authorities with the needed leveraging funds. Exhibit 22 illustrates those leveraging patterns for tribal and nontribal grantees.
Exhibit 22: Tribal Versus Nontribal Leveraging From Grantee and Private Organization Sources
Nontribal grantees were more likely to receive leverage from private sources, with slightly more than one-half leveraging private sources compared with 37 percent for tribal organizations. Only 7 percent of tribal organizations received leverage from nonfederal government sources, compared with 29 percent of nontribal grantees.
Aside from leverage provided by the grantee organization, the more common sources of leverage included HUD’s HOME program, USDA lending programs, and the Federal Home Loan Banks’ (FHLB) Affordable Housing Program.
RHED Leverage The Rural Housing and Economic Development grant amounts were similar to those of the RIF Single-Purpose grant program, particularly as the program matured. The RHED grant amounts averaged about $260,000 during the program.27 As shown in exhibit 23, average grant amounts stayed between $200,000 and $300,000 after the first year of the program. The ranges of grant sizes sampled also declined substantially, from more than $500,000 in the first 2 years of the program to no more than $176,000 in the last 4 years. Thus, the program began to look increasingly like the RIF Single-Purpose program over time, with grants coalescing at about $250,000 and maximum grants set at $300,000 for the last 4 years of the RHED program.
27 Analysis uses RHED sample grants and data from all RHED grants; Sample Grant Range and Size, 1999–2009.

38
Exhibit 23: RHED Average Grant Amounts
Year Sample
Avg. Grant Amount ($)
All Grants Avg. Grant Amount ($)
Sample Grant Amount
Range ($)
Sample Grant Amount Range Size ($)
1999 307,957 310,083 47,300–600,000 552,700 2000 218,022 237,236 50,000–579,285 529,285 2001 199,296 208,901 50,000–400,000 350,000 2002 198,309 288,240 100,000–400,000 300,000 2003 278,433 274,491 108,625–400,000 291,375 2004 273,769 227,650 150,000–400,000 250,000 2005 225,019 230,667 105,000–400,000 295,000 2006 300,000 298,236 300,000–300,000 0 2007 257,281 282,089 185,851–300,000 114,149 2008 212,000 234,263 124,000–300,000 176,000 2009 282,042 292,955 238,349–300,000 61,651
All years 248,743 259,129 47,300–600,000 552,700
RHED = Rural Housing and Economic Development.
The RIF leverage rates are generally lower then the rates generated by the RHED program, particularly in RHED’s later years. Because of differences in the size of the grants at the beginning of the program, examining how that factor changed over the life of the program is instructive (exhibit 24).28
One or two large leverage amounts can skew the leverage rates significantly; although leverage amounts from RHED grants in 1999 are questionable, they demonstrate the effect of skewing.29 For RIF, one project accounted for one-quarter of all leverage, whereas with RHED, extremely large projects in 1999—one project showed $30 million in leverage—put leverage rates for the grants sampled that year at more than 1,800 percent. A $5 million project in 2008 skewed that year’s leverage rate to nearly 500 percent. The use of medians helps ameliorate the impact of the strong positive skew, even in 1999; however, even using medians to describe the data’s central tendency still shows a wide variation in leverage, ranging from a low of 62 percent in 2003 to a high of 173 percent in 2001.
28 Analysis uses RHED sample grants and data from all RHED grants; average and annual arte for sampled RHED Files, including number of missing files, 1999–2009. 29 The amount of leverage, beginning at least in 2006, had to be demonstrated with a commitment letter; in previous years, including 1999, no such commitment letter was required, thus the leverage amount was obtained from a proposed value in the grant application and may not reflect the actual amount leveraged.

39
Exhibit 24: RHED Leverage Totals
Year Total Leverage
Available From Files ($)
Avg. Leverage Available Grants
($) Annual Leverage
Rate Available (%) Median
Leverage (%)
1999 62,366,411* 5,197,201* 1823* 78 2000 4,915,923 446,902 141 67 2001 3,095,318 343,924 188 173 2002 5,607,310 373,821 185 141 2003 7,415,664 617,972 239 62 2004 5,848,924 365,558 134 77 2005 3,273,088 297,553 124 98 2006 4,921,878 820,313 273 116 2007 6,879,236 764,360 282 140 2008 9,529,346 1,058,816 495 139 2009 6,415,790 1,134,055 244 73
2000–09 57,902,477 1,002,241 243 — RHED = Rural Housing and Economic Development. * Some leverage amounts are questionable in selected 1999 grants. Grants for 1999 are not included in totals for first three columns of data.
RIF Grantees’ Use of Other Federal Programs As with many aspects of the RIF program, making sweeping generalizations about the use of other federal programs by the RIF grantees is difficult. Based largely on the telephone interviews with the RIF grantees and the site visits and discussions with stakeholders, the team can report some observations. Federal funding for rural housing and economic development is spread over a broad range of departments and programs. The most well-known housing and economic development programs targeted to rural areas may be the USDA’s Section 500 programs—including Section 533 Self-Help Housing, Section 514/516 Farm Labor Housing Loans and Grants, Section 502 Single Family Housing Direct Home Loans, Section 504 Home Repair Program, and Section 515 Rural Rental Housing Loans, among others.30 Other rural housing and economic development funds come from a broad range of federal sources, including state HOME funds provided by HUD. In addition, tribal-affiliated organizations can access a variety of programs operated by HUD through the Office of Native American Programs (ONAP) and the Department of the Interior’s Bureau of Indian Affairs (BIA). Several other rural development opportunities exist throughout the government, including the Economic Development Administration in the Department of Commerce and programs within the National Park Service in the Department of the Interior. This complex tapestry of programs makes succinctly summarizing the use of other federal programs by RIF grantees difficult.
The study team was able to identify some commonalities through the evaluation, however. First, tribal and nontribal grantees exhibit a significant difference in their pattern of federal program usage. Although all the RIF grantees serve rural areas, the tribal grantees have access to a set of
30 The study team documented the use of all the listed USDA programs by RIF grantees.

40
programs—such as the Indian Community Development Block Grant program (ICDBG), the Native American Housing Assistance and Self Determination Act of 1996 (NAHASDA) Indian Housing Block Grant (IHBG) funding, the BIA’s Housing Improvement Program, and others—that are unavailable to other rural nonprofits. Those programs can be competitive (for instance, ICDBG) or formula-based (for instance, NAHASDA/IHBG), but they represent an exclusive regular funding source for tribal governments. Tribal grantees were much more likely to cite those tribal-specific federal programs when discussing leveraging on their RIF grants and also their non-RIF housing and economic development activities. Specifically, the grantees most frequently cited NAHASDA/IHBG and ICDBG as additional federal funding sources.
In addition, tribal grantees represent units of sovereign governments, meaning that they usually have access to tax and other revenue that other grantees would not. In fact, for more than one-half the tribal grantees, affiliated tribal organizations—such as the tribal health service or the overall tribal government—were their only other source of leverage. For example, the Taos Pueblo Housing Authority partnered with the Taos Pueblo War Chief’s office—who managed access to natural resources in the pueblo—for substantial in-kind contributions of building materials such as adobe and latillas. The rate of internal leverage is much higher than for nontribal grantees and essentially means that very little nontribal funds were used in the majority of RIF projects administered by the tribes. Although this money from other tribal organizations is not directly federal, the affiliated organizations often were funded, at least partially, by federal sources such as BIA. Much of the leveraged funds for tribal grantees therefore ultimately came from federal sources, passed through affiliated tribal organizations. This is a funding stream that nontribal grantees would not have access to.
For nontribal RIF grantees, the use of federal funds was dominated by federal housing programs. This is unsurprising because—despite the flexibility of the RIF program to fund both housing and economic development activities—70 percent of the RIF projects included housing activities, but only 38 percent included an economic development component. According to the analysis, approximately 40 percent of the grantees used or proposed to use other federal funds in their RIF programs (this does not take into account federal funds used for non-RIF programs), and the vast majority of that leveraged or proposed leveraged federal funding came from the USDA’s Section 500 programs and HUD’s HOME program through the formula grants to the states. This state HOME funding was particularly important to organizations such as the Housing Development Alliance of Hazard, Kentucky, which cited HOME as its primary source of funding, whereas RIF and RHED allowed “experimentation and innovation.” The study team found very little use of economic development programs, such as the Economic Development Administration, with the RIF grantee population, although a few grantees mentioned certain programs affiliated with the Small Business Administration, such as Southern Bancorp Community Partners.
The grantees also cited other federal programs, although none as frequently as HOME or the USDA. Three grantees—Community Students Learning Center, the Oglala Sioux Housing Authority, and St. Joseph’s Shelter—used Affordable Housing funds from their regional FHLBs.31 Several RIF grantees serving the colonias reported using farmworker-specific
31 One other grantee reported applying for but not receiving FHLB funds.

41
programs, including Motivation Education & Training, Inc., who used the Department of Labor’s National Farmworker Jobs Program. A small number of other grantees reported using specialty housing programs such as HUD’s Section 202 and Section 811 in non-RIF-related projects. Those grantees frequently were designated as Community Housing Development Organizations—for example, Macon Ridge Community Development Corporation, which operated several multifamily projects that had been funded using Section 202, Section 811, and USDA multifamily funds.
Finally, the Department of Treasury’s Community Development Financial Institutions Fund played an important role in the operations of many RIF grantees. Grantees were CDFIs or partnered with local CDFIs as part of the RIF projects and their standard operations. Interestingly, of the nine Comprehensive grantees, four were CDFIs: PathStone, Nogales Community Development (NCD) Corporation, Portable Practical Education Partners (PPEP), and SBCP. Two other Comprehensive grantees, CSLC and the Oglala Sioux Housing Authority, also partnered with local CDFIs as part of their RIF projects and in their non-RIF-related activities. Three of the nine IEDE grantees—the Karuk tribe, the Choctaw Nation, and the Keweenaw Bay Indian Community—had affiliated CDFIs as well, and several organizations that received Single-Purpose grants (for example, Mazaska Owecase Otipi Financial, Inc.) also were certified CDFIs. During the evaluation, several other grantees expressed interest in becoming CDFIs, and at least one had begun the application process.
Apart from the direct grant and loan programs, the Treasury Department’s CDFI Fund may be the source of federal funding most frequently used by the RIF grantees, both for their RIF projects and for non-RIF housing and economic development activities. Although the study team did not find that tax credits were a particularly widespread financial tool for RIF grantees (see section 7), CDFIs do seem to be a financial instrument that all types of grantees, tribal and nontribal, are using to address the lack of capital and credit in rural areas.
In addition, 7 of the 17 the largest RIF grantees had the technical capacity to achieve CDFI certification and develop an affiliated CDFI. Although that topic is discussed in more detail in the SBCP case study in section 8, this may indicate that the larger maximum awards available through RIF (the Comprehensive and IEDE grants) attracted a different type of organization than those that pursued the Single-Purpose or RHED grants. Although CDFIs and CDFI applicants were among the Single-Purpose grantees, those grantees were not nearly as likely to be affiliated with a CDFI as were the organizations that received larger grants. SBCP, PathStone, the Choctaw Nation, and other grantees may have a broader capacity and more sophisticated staff than does the typical RIF grantee.
To conclude, making sweeping claims about the use of federal funds by the RIF grantees is difficult, but the study team identified some tendencies. First, use of federal funding by tribal grantees is fundamentally different from that of nontribal grantees. Tribes tend to use tribal-specific programs through ONAP or BIA, whereas nontribal entities are more likely to use housing programs, such as HOME or USDA Section 500 funding. Very few federal economic development programs were utilized by the RIF grantees. A smattering of other federal housing programs were identified by multiple RIF grantees, including HUD specialty housing programs such as Section 811 and 202. Most surprisingly, the CDFI Fund was another frequently cited federal program, particularly among the RIF grantees that applied for and received larger awards.

42
Outputs, Total Development Costs, and Leverage Information about projected outputs was included in the Soundness of Approach section of the application. Successful applicants described a variety of outputs, primarily housing units either built or rehabilitated but also job training and housing counseling graduates, business loans made, and community and business facilities developed. Some applicants described limited outputs—two homes developed—whereas others, including Single-Purpose grantees, proposed more diverse, sometimes multiple outputs. Comprehensive grant proposals did not necessarily provide more than one output: One successful applicant’s infrastructure project consisted of a water storage facility and necessary piping.
Total development costs are closely related to leverage amounts, with the difference between the two figures often being only the grant amount. The correlation between the total development costs of the RIF grants and leverage is extremely high, but not unexpected, with R=0.91. The relationship between total development costs and outputs varies significantly, however. A number of grantees proposed using a Single-Purpose grant plus leverage to build two homes, at a cost of more than $225,000 per home. In another case, one grantee proposed rehabbing 21 homes, another only 3, with the latter grantee’s development costs two-thirds of the former’s. The costs proposed by RIF applicants displayed very little consistency or uniformity.
In most cases, grantees proposed creating multiple outputs, such as rehabbing a number of homes and also providing counseling and jobs, making straight-up comparisons difficult. Given the on-the-ground differences in building and land costs and the variety of outputs, making comparisons between costs, leverage, and outputs is very difficult. Figure 4 shows the Keweenaw Bay Indian Community (KBIC) gas station/community store while under construction.
Figure 4: Keweenaw Bay Indian Community Travel Stop (Marquette Township, Michigan)

43
6. Grant Impact Findings Comparing the impacts of the larger Rural Innovation Fund grants with the smaller grants of the RIF and Rural Housing and Economic Development programs is problematic. No standard has been established by which to measure how much more impact a $2 million grant should be expected to have than one—or even several—$300,000 grants. The comparison is further complicated by the small sample size of large grants and the variety of projects they funded; although three of the projects included multiple components, the others were housing only, the development of a community center, the expansion of a YouthBuild program, housing plus job training, and infrastructure development. In addition to the diverse set of projects funded, two very different sets of organizations used the program: tribes and nontribal grantees. Tribal grantees tended to have lower leveraging and partnership rates than did nontribal grantees—independent of grant size—making a comparison of large and small grants in any methodologically robust manner impossible.
Although no method exists by which to determine the relative impacts of large and small grants, a descriptive analysis can provide some insights into the impacts of each type of grant. Information gathered during the phone interviews and site visits provides a qualitative picture of how the grants affected the organizations and the communities they serve. Grantees’ responses to interview questions will be used to better understand the impacts of large grants and small grants (and multiple small grants, as several organizations received more than one RHED grant during the life of the program).
The study team found no evidence that the larger, Comprehensive grants led to substantially different outcomes than did the smaller, Single-Purpose grants or the older RHED grants. The Comprehensive grants did not lead to higher rates of leveraging, capacity increases, or any other outputs that the study team could identify; in other words, no apparent economy of scale was present. The site visits and other qualitative evaluation indicated that the larger grants opened up different possibilities for grantees (Southern Bancorp Community Partners is a good example), but no systematic difference was evident between large and small grants. In addition, the outcomes from large, comprehensive projects may take many years to be fully seen, and many of the RIF projects are not yet complete, creating a limitation to the subject evaluation.
Quantitative Comparisons of Large and Small RIF Grants As described, the Comprehensive RIF grants leveraged more dollars, but their leverage rate was not higher. As shown in exhibit 25, the Comprehensive grants leveraged a mean of $2.4 million, compared with $204,000 for the Single-Purpose grants and $443,198 for the Indian Economic Development and Entrepreneurship grants.32
32 Analysis includes mean leverage dollars per grant, overall leverage rate, median leverage per grant and mean development costs.
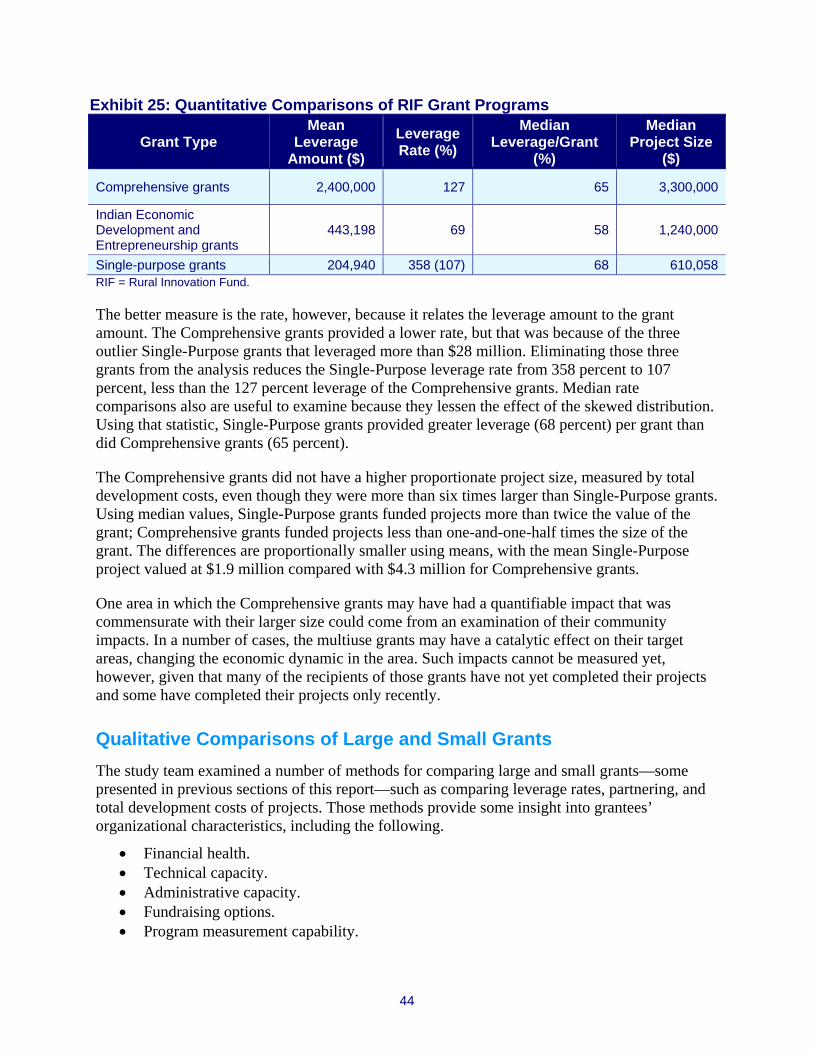
44
Exhibit 25: Quantitative Comparisons of RIF Grant Programs
Grant Type Mean
Leverage Amount ($)
Leverage Rate (%)
Median Leverage/Grant
(%)
Median Project Size
($)
Comprehensive grants 2,400,000 127 65 3,300,000
Indian Economic Development and Entrepreneurship grants
443,198 69 58 1,240,000
Single-purpose grants 204,940 358 (107) 68 610,058 RIF = Rural Innovation Fund.
The better measure is the rate, however, because it relates the leverage amount to the grant amount. The Comprehensive grants provided a lower rate, but that was because of the three outlier Single-Purpose grants that leveraged more than $28 million. Eliminating those three grants from the analysis reduces the Single-Purpose leverage rate from 358 percent to 107 percent, less than the 127 percent leverage of the Comprehensive grants. Median rate comparisons also are useful to examine because they lessen the effect of the skewed distribution. Using that statistic, Single-Purpose grants provided greater leverage (68 percent) per grant than did Comprehensive grants (65 percent).
The Comprehensive grants did not have a higher proportionate project size, measured by total development costs, even though they were more than six times larger than Single-Purpose grants. Using median values, Single-Purpose grants funded projects more than twice the value of the grant; Comprehensive grants funded projects less than one-and-one-half times the size of the grant. The differences are proportionally smaller using means, with the mean Single-Purpose project valued at $1.9 million compared with $4.3 million for Comprehensive grants.
One area in which the Comprehensive grants may have had a quantifiable impact that was commensurate with their larger size could come from an examination of their community impacts. In a number of cases, the multiuse grants may have a catalytic effect on their target areas, changing the economic dynamic in the area. Such impacts cannot be measured yet, however, given that many of the recipients of those grants have not yet completed their projects and some have completed their projects only recently.
Qualitative Comparisons of Large and Small Grants The study team examined a number of methods for comparing large and small grants—some presented in previous sections of this report—such as comparing leverage rates, partnering, and total development costs of projects. Those methods provide some insight into grantees’ organizational characteristics, including the following.
• Financial health. • Technical capacity. • Administrative capacity. • Fundraising options. • Program measurement capability.
45
In addition, the interviews and site visits provided some insights into community impacts. Although the information provided through interviews and site visits does not demonstrate a causal relationship between the grant and organizational or community change, it provides some indication of how the grants affected grantees’ work.
Financial Health The survey asked RIF and RHED grantees how the grants affected their financial health, comparing their organizations’ current financial strength with the situation before they received the grant. The majority (66.7 percent) of all RIF grantees who responded to that question—25 of 38—reported that their financial strength was better; slightly less than 30 percent said that it was worse. When broken out by grant program, however, only 5 of 8 (62.5 percent) Comprehensive grant recipients stated that their financial strength was better, whereas 20 of 30 (66.7 percent) of the non-Comprehensive grantees stated that their financial situation was stronger.
Respondents cited the importance of the grants to their organizations and the communities they serve, but no categorical differences existed between Comprehensive and other grantees. For example, one Comprehensive grantee said that the grant merely allowed them to complete the planned project “without having to divert general funds.” Another grantee stated that the grant allowed them to integrate programs sooner. Single-Purpose grantees cited significant changes to their organizations from the smaller grants.
Grantee Testimonial “It allowed us to establish long-term resources and assets. The grant was very important to us during the time of an
economic recession.”
The RIF grants were provided at a difficult time for many nonprofit organizations, with the recession still keeping many areas of the country from prospering. A number of organizations that stated their finances were about the same or worse cited the economic situation and how the grants helped them through difficult financial times. Given the economic situation at the time, it few grantees likely had the opportunity to do more than maintain their operations, even with a RIF grant.
RHED grant interviewees were more positive about the impact of the grants on their organizations’ financial strength. A large majority (71 percent) of respondents stated that their organization was stronger financially than it was before receiving the grant. Respondents generally said that the grant “significantly helped” their organization’s financial strength.
Grantee Testimonials “It was anchor funding that allowed us to go to other sources, helping us
compete for local sources that are difficult to get.”
“RHED was used to leverage other grants to create a huge, $3 million plus project that allowed us to rehabilitate the Pueblo core area, build 20
new homes that helped move people back to our sacred area, and helped us get other grants.”
Only three organizations were in worse financial condition, and at least one attributed that circumstance to the recession.
46
Technical Capacity Grantees were asked whether the grant helped them to expand the type of activities they undertook into new areas and if their technical capacity had been enhanced, increasing their ability to implement certain types of projects. In response to the first question, 62 percent of all RIF respondents stated that they had moved into new areas, about the same for both Comprehensive and non-Comprehensive grantees. Although a number of Comprehensive grantees moved into more than one new area—given the aim of the Comprehensive grants to be applied across a broad array of services—interesting to note is that three of the eight did not do anything different than they had already been doing. Not surprisingly, those three grantees did not use their grants in any comprehensive manner, focusing on no more than two outputs each.
By contrast, all the IEDE grantees responding and many of the Single-Purpose grantees reported that they had expanded into new areas. Those new areas of activity varied, with many grantees citing more technically difficult areas, such as business lending or historical renovation. Other grantees increased diversity in their housing programs—for example, expanding to mixed-use development or serving clients with special needs. In addition, more than one-half of all RHED interviewees stated that the grant helped them expand into new areas.
With regard to increased technical capacity, two of the eight Comprehensive grantees reported that they gained little or no technical expertise from the grant. By contrast, the IEDE grantees seemed to have gained significant technical expertise, citing strong organizational improvements. Although a few Single-Purpose grantees believed that they already had strong technical capacity, the majority reported significant strengthening of their capabilities.
The grants were important technical capacity builders for the RHED grantees, with most citing substantial increases in their technical and administrative capabilities. The grants increased nearly all (85 percent) of the grantees’ technical capacity for doing their work.
Grantee Testimonials
“The grant increased our technical capacity in energy efficiency and housing development; we have gone from 3 homes per year to 17 homes per year production. It also
enhanced our training of construction crews in energy efficiency.”
“It not only improved our capacity but had a ripple effect on the organizations we collaborate with, helping our partners.”
A number of the RHED grantees were recipients of multiple grants (as many as seven) during the 11 years of the program.
Administrative Capacity Most of the RIF grantees had some experience with the RHED program, which likely helped them develop the administrative systems necessary to administer the RIF grants. Sixteen RIF grantees had been multiple RHED grantees, and an additional four were affiliated with RHED

47
grantees. The faith-based survey33 showed that 95 percent of the RIF grantees who responded to the survey had received federal grants or contracts before they received the RIF grant. The RIF program did not seem to attract rural organizations new to federal grant funding.
Six of the eight Comprehensive grantees reported increases in their administrative capacity, and the respondents representing the other two grantees expressed the view that their administrative capacity was strong before the RIF grant award. The IEDE and Single-Purpose grantees were relatively evenly split, although many cited learning to overcome the difficulties of HUD’s reporting systems. Thus, the Comprehensive grantees may have seen increases in their technical capacity at a higher rate than did Single-Purpose grantees.
With regard to RHED, about one-half the respondents cited a significant increase in their administrative capacity, but about one-third stated that the grant had little or no effect. Those organizations generally felt that they had the administrative expertise already, although the grant increased their experience in dealing with federal grants. For those for whom the grant did increase administrative capacity—about two-thirds of the organizations—some cited substantial accomplishments.
Grantee Testimonial
“It significantly increased our financial skills, allowing us to qualify for New Markets and Low-Income Housing
Tax Credits.”
Respondents generally described the increases in administrative capacity as enhancing systems that the grantees already had in place rather than creating new areas of administrative capacity. For example, rather than developing substantial new capabilities (for instance, internal audit capability or sophisticated financial controls), the improvements to administrative capacity enhanced or improved existing systems, which allowed for marginally improved compliance and financial management but rarely fundamentally changing or improving operations.
Grantee Testimonial
“We developed significant capacity: Single audit, accounting, compliance, all tightened the organization’s
financial management.”
Fundraising Sources and Partnerships The development of partnerships was an important consideration in the creation of the RIF program. RIF grants were meant to help foster local systems that support housing and economic development efforts. The notice of funding availability suggested the importance of developing local partnerships to the grant program, “Highly ranked projects would also be expected to coordinate and leverage their efforts with regional entities that are actively
33 Refers to the faith-based Survey on Ensuring Equal Opportunity for Applicants (SF 424-SUPP), mentioned previously in section 4.

48
engaged in or promote a region’s unique competitive strengths and find ways to nurture networks for business financing, business-to-business sales, education, and workforce development.”
Nearly all the organizations were able to secure the leverage for which they had commitment letters; only six grantees reported that they were unable to get promised funding. Further, nearly two-thirds were able to obtain additional leverage after they submitted their grant application. Of those grantees, 72 percent reported that they were able to expand or enhance their project qualitatively because of the additional funding. Comprehensive grantees received additional post-award funding at a somewhat higher rate, with six of the eight able to obtain additional funding, whereas IEDE grantees were less successful at obtaining additional leverage, with only two reporting additional post-award funding.
RIF grantees also reported increased fundraising capacity. Two-thirds of those interviewed—including seven of the eight Comprehensive grantees and eight of the nine IEDE grantees—expressed the view that getting the grant helped them access funds they would not have otherwise been able to get. Nearly 90 percent of RIF grantees stated that obtaining the grant increased their range of funding opportunities, with nearly one-half all grantees interviewed describing that increase as “significant.”
By comparison, a little more than one-half of RHED grantees were able to obtain additional leverage after the grant award.34 In addition to the immediate benefit of additional leverage, nearly two-thirds of respondents stated that they felt the RHED grant had helped them attain additional funding, opening up new funding sources to them. With regard to future fundraising, 39 percent of the grantees indicated the belief that the RHED grant significantly increased their range of funding options, and another 47 percent reported that it somewhat increased their range of funding options. Only 14 percent did not state that the RHED grant increased their funding options.
Most of the Comprehensive grantees were able to significantly increase their local partnerships, with one-half using the term dozens to describe the number of new partnerships; two grantees listed one or no new partnerships. Three-quarters of all grantees reported at least one new partnership. Seven of eight Comprehensive grantees and 63 percent of all grantees described the RIF grant as either necessary or very important to establishing those new partnerships. Nearly three-quarters were already involved in further collaboration with those partners or were planning collaborative efforts.
Regarding RHED, nearly 7 in 10 grantees established new partnerships, with most citing the establishment of multiple partnerships. Eighty percent of the respondents stated that either they could not have had the relationship without the grant or that the grant was very important in establishing those relationships. Nearly all the organizations that established new relationships were already involved in further collaborations, with the remaining organizations planning collaborations.
34 Data from the RHED telephone interviews.

49
RIF grantees described a variety of partnerships created as a result of their grant.
Grantee Testimonials “We developed partnerships with multiple DoD [Department of Defense] entities and a new tribe that can exist beyond changes in personnel that so often occur in both
types of organizations.”
“We significantly expanded partnerships, wanting to improve our ability to provide loans, capital to expanding businesses, grow the businesses that we’ve started. We
utilized partnership with REI to get loans for small businesses to expand.”
“We were able to begin an active partnership with Wells Fargo and also started active partnerships with South Dakota Native Coalition.”
“The RIF came at a really important time for us. One thing it did was get us a lot of media attention we had not had before.”
Respondents viewed the grant as providing a sort of status for their respective organizations, making them a more desirable partner than they had been before the award. For example, grantees described how the grant helped establish their reputations:
Grantee Testimonials “The housing development showed the economic and housing potential of the
tribal land; the tribe developed policies necessary to work with a bank. Government support for the project gave gravitas to the project and the
organization.”
“The organization became well known [and started] working with county and other local organizations; the county created a new sewer district because of
[the] grant.”
Grantees often cited local governments as one or the only partner, a result of the grantees’ geographic isolation.
Program Measurement Capabilities HUD requires that all grantees measure their progress toward achieving the goals set in their applications. Grantees often use certain indicators to provide information to HUD that meets federal requirements.
Although only seven of 37 RIF grantees (19 percent) stated that they did not use indicators to measure progress toward their program goals, one respondent is a Comprehensive grantee and three are IEDE grantees; all are tribes. Further, nearly all the indicators mentioned by interviewees were output related rather than outcome related. Grantees listed indicators such as the number of housing units completed, people counseled, or people with jobs. Most indicators cited did not measure impacts on the communities to be served; the RIF NOFA requires grantees to provide both output and outcome indicators.
Despite the lack of outcome indicator descriptions, most grantees believed that they had strong capacity to “collect and analyze data for planning and management purposes.” Nearly 90 percent of grantees interviewed described their capacity as either “high” or “adequate.” Only 4 of 37

50
organizations described their capacity as marginal, one a Comprehensive grantee and one an IEDE grantee. Of those describing their capacity as high or adequate, more than one-third that the RIF grant was “extremely important” to their having such capacity, and an additional 42 percent believed that RIF was “somewhat important” to their data collection and analysis capacity.
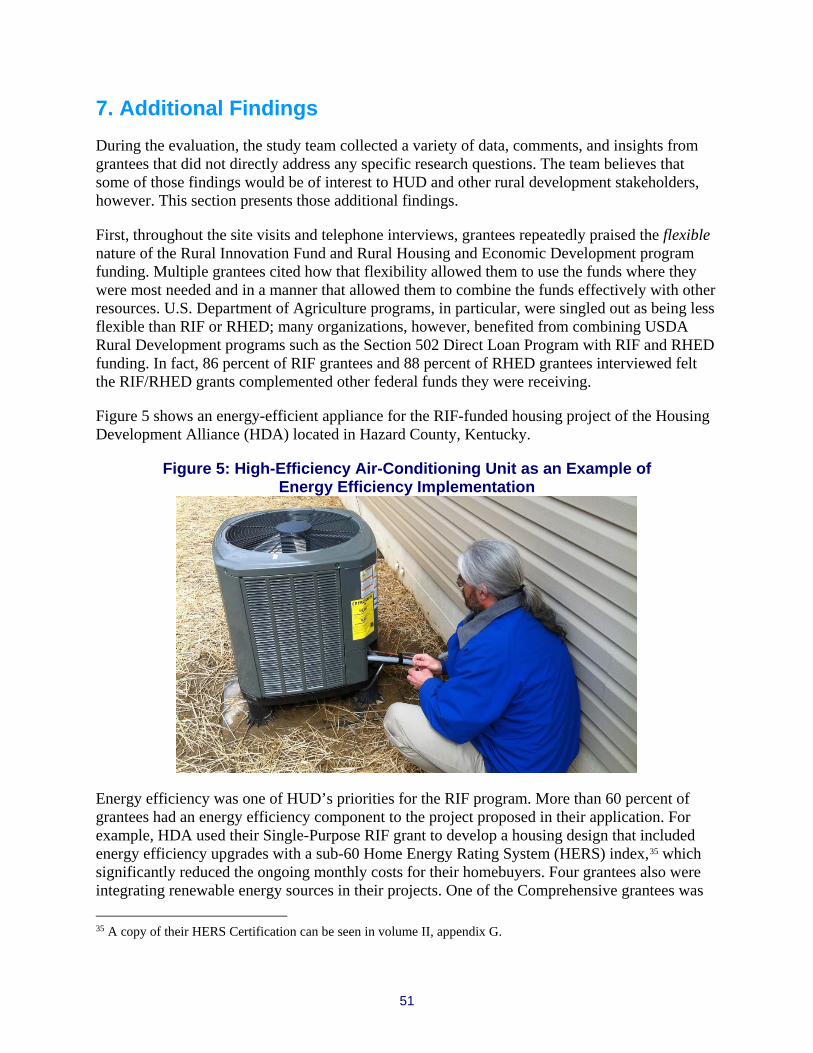
51
7. Additional Findings During the evaluation, the study team collected a variety of data, comments, and insights from grantees that did not directly address any specific research questions. The team believes that some of those findings would be of interest to HUD and other rural development stakeholders, however. This section presents those additional findings.
First, throughout the site visits and telephone interviews, grantees repeatedly praised the flexible nature of the Rural Innovation Fund and Rural Housing and Economic Development program funding. Multiple grantees cited how that flexibility allowed them to use the funds where they were most needed and in a manner that allowed them to combine the funds effectively with other resources. U.S. Department of Agriculture programs, in particular, were singled out as being less flexible than RIF or RHED; many organizations, however, benefited from combining USDA Rural Development programs such as the Section 502 Direct Loan Program with RIF and RHED funding. In fact, 86 percent of RIF grantees and 88 percent of RHED grantees interviewed felt the RIF/RHED grants complemented other federal funds they were receiving.
Figure 5 shows an energy-efficient appliance for the RIF-funded housing project of the Housing Development Alliance (HDA) located in Hazard County, Kentucky.
Figure 5: High-Efficiency Air-Conditioning Unit as an Example of Energy Efficiency Implementation
Energy efficiency was one of HUD’s priorities for the RIF program. More than 60 percent of grantees had an energy efficiency component to the project proposed in their application. For example, HDA used their Single-Purpose RIF grant to develop a housing design that included energy efficiency upgrades with a sub-60 Home Energy Rating System (HERS) index,35 which significantly reduced the ongoing monthly costs for their homebuyers. Four grantees also were integrating renewable energy sources in their projects. One of the Comprehensive grantees was 35 A copy of their HERS Certification can be seen in volume II, appendix G.
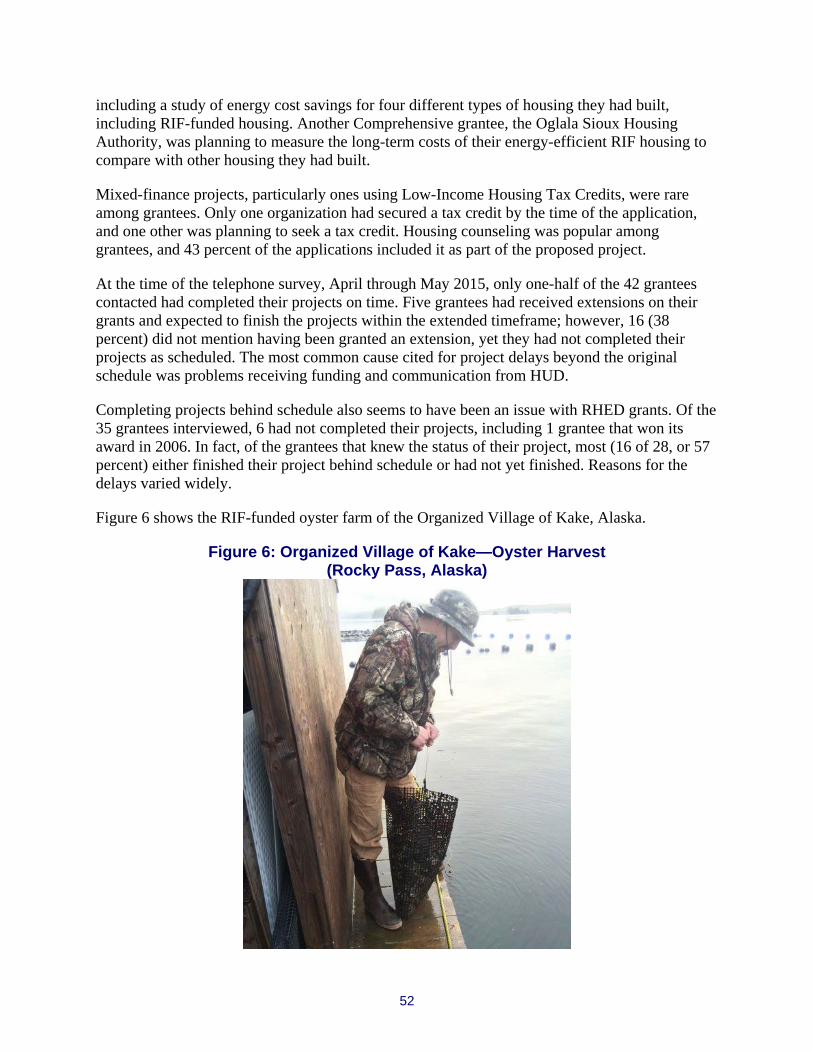
52
including a study of energy cost savings for four different types of housing they had built, including RIF-funded housing. Another Comprehensive grantee, the Oglala Sioux Housing Authority, was planning to measure the long-term costs of their energy-efficient RIF housing to compare with other housing they had built.
Mixed-finance projects, particularly ones using Low-Income Housing Tax Credits, were rare among grantees. Only one organization had secured a tax credit by the time of the application, and one other was planning to seek a tax credit. Housing counseling was popular among grantees, and 43 percent of the applications included it as part of the proposed project.
At the time of the telephone survey, April through May 2015, only one-half of the 42 grantees contacted had completed their projects on time. Five grantees had received extensions on their grants and expected to finish the projects within the extended timeframe; however, 16 (38 percent) did not mention having been granted an extension, yet they had not completed their projects as scheduled. The most common cause cited for project delays beyond the original schedule was problems receiving funding and communication from HUD.
Completing projects behind schedule also seems to have been an issue with RHED grants. Of the 35 grantees interviewed, 6 had not completed their projects, including 1 grantee that won its award in 2006. In fact, of the grantees that knew the status of their project, most (16 of 28, or 57 percent) either finished their project behind schedule or had not yet finished. Reasons for the delays varied widely.
Figure 6 shows the RIF-funded oyster farm of the Organized Village of Kake, Alaska.
Figure 6: Organized Village of Kake—Oyster Harvest (Rocky Pass, Alaska)
53
8. Case Studies Given the difficulty acquiring any hard, quantitative data on overall grant impact—particularly because many of the projects are not yet completed—the study team decided to include small case studies that highlight the overall impact of a select set of larger projects. The team chose the following projects to highlight two particular cases, one tribal and one nontribal, that illustrated the potential of the RIF to create, “innovative and catalytic economic development and housing programs” (2010 RIF NOFA, page 3).
The study team does not believe that any definitive evidence shows that the Category 1: Comprehensive grants or the Category 2: Indian Economic Development and Entrepreneurship grants were more effective than were smaller grants at creating collateral positive impacts, such as additional investment, revitalization, increased capacity, or additional partnerships. The team believes that some evidence indicates that specific larger (or repeated) grants may have had a catalytic impact, however. How recipients choose to use their funding and design their projects may affect how much additional activity those grants produce.
This is a situation in which two funding priorities often are at odds: flexibility and comprehensiveness. The flexibility of the RIF and Rural Housing and Economic Development programs is a major benefit often cited by recipients, and it allows grantees to tailor the programs to fit their community’s needs and plans. That often results in narrowly tailored programs that focus on a single issue, however, such as housing, infrastructure, or job training. Only a few of the Category 1 grants could truly be called comprehensive; many were simply scaled-up versions of projects similar to the Single-Purpose grants.
This section describes two of the more comprehensive projects that the study team observed to have broader impacts on their community and exemplified the comprehensive, universal approach the team believes that HUD sought to encourage with the RIF grants.
San Felipe Pueblo Housing Authority The total amount of SFPHA’s Comprehensive grant ($1,660,000) was devoted to construction of new single-family housing on trust land of the San Felipe Pueblo in New Mexico. At the time of the evaluation team’s site visit in mid-January 2015, the RIF funds had been used to construct 14 homes, which were completed and occupied at the time of the site visit. This was two more homes than had been included in the original application.
Thirteen of the homes were constructed within the Black Mesa View rental subdivision, where the SFPHA and other home builders have been building single-family homes since 2011. All the homes constructed with RIF funds are next to each other on a residential street within the subdivision. One RIF-supported home was constructed apart from the subdivision on land that had been traditionally allotted to an enrolled Pueblo family.
The RIF funds supported all aspects of the house construction, primarily materials and labor. Much of the construction and landscaping was performed by staff of the SFPHA, a Tribally

54
Designated Housing Entity. Homes financed by the RIF grant range from two- to five-bedroom structures and are of two predominant styles: the typical suburban ranch style and the flat-roofed adobe structure common in much of the Southwest. Although the styles are generic, the completed structures are not identical; each home has individual features that distinguish it from its immediate neighbors.
In addition, SFPHA has instituted an innovative (and now standard) procedure to customize homes for the new homeowners. Brennan Valencia, the assistant project manager, has an Associate of Architecture degree and is able to use CAD software to customize the homes based on the homeowner’s individual needs and preferences. SFPHA saves time and money by using inhouse staff to customize the homes.
Figure 7 shows three of the San Felipe Pueblo Housing Authority homeowner units constructed with RIF funds.
Figure 7: Black Mesa View Subdivision (San Felipe Pueblo, New Mexico)
According to the key contacts at SFPHA, the timing and size of the RIF grant provided two great benefits. First, it was the first opportunity that the construction crews of SFPHA had to complete construction of new homes clustered in a single subdivision, including all infrastructure and landscaping. The enhancement of staff skills continues to benefit SFPHA as it continues construction in the subdivision.
Second, use of the RIF funds also benefited the long-term financing and ownership objectives of SFPHA. The housing authority has chosen to make available the newly constructed homes only to households that would qualify for mortgages under parameters such as those set by HUD’s Office of Native American Programs Section 184 program. The homes in the new subdivision are and will continue to be owner-occupied homes, not subsidized low-income rental units. SFPHA operates a financial education and assessment service that assists households in meeting the necessary standards for homeownership. The housing authority established a benchmark of
55
15 to 17 percent of monthly income to be devoted to servicing a mortgage.36 The advantage of using the RIF funds for construction of some housing units is that SFPHA is the original owner of those units free and clear, thus the mortgage payments from the households represent ongoing programmatic income for the housing authority that it can use to provide more housing and services to tribal members.
As the preceding summary indicates, use of the RIF vehicle by SFPHA must be understood in the context of the overall development strategy. SFPHA has existed as a separate entity only since 2000. At that time, the All-Pueblo Housing Council operated housing programs for all the New Mexico pueblos. In 2000, separate housing authorities were established at individual pueblos to take advantage of the provisions of the Native American Housing Assistance and Self-Determination Act. The financial manager and the executive director at SFPHA have been in their positions since 2001 and 2002, respectively, and have been able to provide continuity for an overall housing development strategy. Staff continuity was highlighted in stakeholder discussions throughout the evaluation as a key factor in organizational success.
In the 1990s, the community elders established a strategic vision that set long-term objectives for the newly established entity. The core objective was the construction of 150 to 200 single-family homes largely to replace previously built HUD homes constructed in the late 1960s and early 1970s. Much of that older housing was in poor condition and would require substantial investments to rehabilitate. No specific implementation strategy was associated with this strategy.
The first few years of the independent housing authority were largely devoted to rehabilitation efforts using NAHASDA grant funds and funding from several grants through the Indian Community Development Block Grant (ICDBG) program. More than 200 units were rehabilitated from 2004 through 2009. Resources to implement the long-term strategic vision of constructing new single-family housing in a unified subdivision began to become available in 2009. One such resource was funds from the federal stimulus legislation of the winter of 2009. Another was the participation of SFPHA as a partner on a RHED grant that was awarded to a local nonprofit organization.
The stimulus funds enabled the housing authority to complete an environmental review and also to install water and utility connections for the 100-acre parcel that has become the new residential subdivision. At the same time, SFPHA obtained a master lease from the Bureau of Indian Affairs to devote that portion of the pueblo trust land to housing and a limited amount of retail construction. The stimulus funds thus enabled SFPHA to install all necessary water and utility infrastructure for their mixed-use subdivision.
The RHED grant on which the housing authority was a partner was designed to purchase and then to locate modular housing units. Those modular units were the first houses to be installed on the newly serviced subdivision acreage in 2011. The RIF-constructed modular units were the second tier of housing units on that land. These RIF units were the first ones for which staff of SFPHA had full responsibility for preparation of the individual sites and construction of the residential structures—they did not hire an outside contractor. 36 This relatively low benchmark was established by SFPHA to enable households to meet the significant religious and social commitments associated with tribal membership at the pueblo. Similar tribal requirements were noted at the Taos Pueblo as well, a related tribal group north of San Felipe in New Mexico.
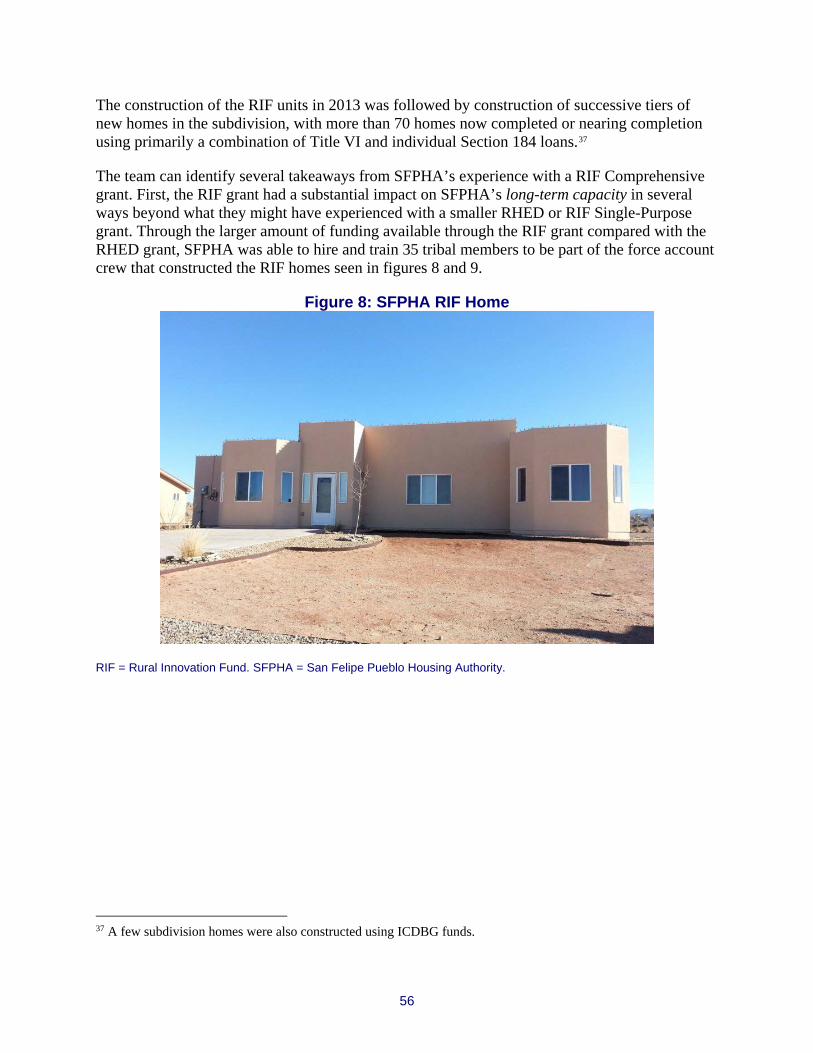
56
The construction of the RIF units in 2013 was followed by construction of successive tiers of new homes in the subdivision, with more than 70 homes now completed or nearing completion using primarily a combination of Title VI and individual Section 184 loans.37
The team can identify several takeaways from SFPHA’s experience with a RIF Comprehensive grant. First, the RIF grant had a substantial impact on SFPHA’s long-term capacity in several ways beyond what they might have experienced with a smaller RHED or RIF Single-Purpose grant. Through the larger amount of funding available through the RIF grant compared with the RHED grant, SFPHA was able to hire and train 35 tribal members to be part of the force account crew that constructed the RIF homes seen in figures 8 and 9.
Figure 8: SFPHA RIF Home
RIF = Rural Innovation Fund. SFPHA = San Felipe Pueblo Housing Authority.
37 A few subdivision homes were also constructed using ICDBG funds.

57
Figure 9: SFPHA RIF Home
RIF = Rural Innovation Fund. SFPHA = San Felipe Pueblo Housing Authority.
This enhancement of the construction and construction management skills of the SFPHA operations staff allowed the housing authority to continue construction on homes in the subdivision using program income from loans on the homes they constructed. In addition, the skill level of those staff members is at such a high level that the tribal government now uses them for its own construction projects, such as the recently completed tribal administration building. Having a trained, certified construction crew enables SFPHA to serve as a construction resource for the tribal community, ensuring that more construction and grant funds go to tribal members and tribal organizations, keeping more funds in house.
In short, the RIF grant provided a substantial direct economic benefit derived from wages distributed for construction of the RIF-funded housing units. Within the context of a tribal community, the use of tribal labor and management was an important factor, as opposed to many cases in which project funds are actually distributed to nontribal entities. The skill enhancement (both technical and managerial) associated with the RIF project seems to be an enhanced ability of the pueblo community to implement projects inhouse and thus retain a much higher proportion of funds from grants and other sources.
Perhaps equally important is the impact of the RIF grant on the ongoing enhancement of SFPHA as a major financial entity for the pueblo population. A significant proportion of the pueblo population is not fluent in English and has limited contact with external financial and commercial entities, such as banks or credit unions. The ability of SFPHA to become a middleman between the pueblo
58
population and external financial entities represents a major resource enhancement for the pueblo by giving them access to credit, and the RIF grant seems to have been catalytic to that development.
To summarize, the Comprehensive RIF grant allowed SFPHA to not only fund the construction of housing for tribal members but also train and develop a force account crew that could handle further construction projects, allowing the housing authority to forgo hiring outside contractors and enhance the impact of other grant funding and program income for tribal members. In addition, other tribal organizations used that construction crew to complete their construction projects, so it allowed them to employ a tribal entity rather than an outside source. Finally, the RIF grant allowed the SFPHA to enhance its lending programs to bring financial resources and credit access to tribal members.
Obviously, that particular Comprehensive grant had the type of broader community impact that HUD might have hoped would spring from awarding larger, comprehensive awards. Initially, simply building 14 new homes might not seem particularly innovative, but SFPHA married the greater amount of grant funding with a long-term strategic plan to develop a subdivision and also to train a force account crew that could serve as a broader construction resource to the tribe, keeping more grant funding on tribal lands and paid to tribal organizations. Although the time constraints of this evaluation do not allow us to look at the long-term financial impact of this plan, the team expects that the long-term impact of the project will be substantial, through providing affordable housing, training tribal members, and developing financial and program capacity for use by tribal organizations.
Although those community impacts are impressive, however, a few caveats to the SFPHA story are necessary. First, the SFPHA example highlights the importance of staff continuity. Isaac Perez, the executive director, has been at SFPHA since 2002, and Ms. Brenda Rico, the financial director, has been in her position since 2001. In the team’s experience with rural development across the country, that is a very long time to have continuity among senior housing leadership. Multiple RIF grantees, including multiple Comprehensive grant recipients, experienced staff turnover during their program. That staff consistency at the senior level has been able to provide continuity for SFPHA’s overall housing development strategy. Experience and continuity were key in developing and implementing a long-term, comprehensive housing strategy.
Second, the RIF program seemed to be more a gentle stimulant than a vigorous catalyst. The large RIF grant allowed SFPHA to move more quickly in developing its inhouse capacity and subsequently create a trained construction crew, but it was part of a long-term, overall plan. Although it does not diminish the impact of the RIF grant on the community or its contribution to SFPHA’s success, it does indicate that the larger funding available through the Comprehensive grant was used to enhance and accelerate an existing plan, shortening an existing timeline rather than spurring a specific innovation.
Southern Bancorp Community Partners SBCP’s Category 1: Comprehensive grant of $1,998,621 was largely dedicated to the revitalization and redevelopment of downtown Helena-West Helena, Arkansas, a small town of approximately 6,300 residents on the Mississippi River experiencing significant poverty and a major issue with vacant properties. During the project, SBCP significantly expanded its

59
operations in the area and increased its capacity after receiving the RIF grant. SBCP created one of the most comprehensive RIF projects the study team observed during the evaluation, with programs that focused on a place-based revitalization of downtown Helena, incorporating unique aspects of geography (the Mississippi River) and history (blues music and the Civil War) in the wide-ranging project.
Figure 10 shows the revitalized downtown Helena, Arkansas, which received a RIF Comprehensive grant.
Figure 10: Downtown Helena, Arkansas (Cherry Street)
SBCP’s project had five major components. 1. The Helena Start-Up Challenge is an 8-week business startup class. Starting a business is
especially challenging in this area, and the goal was to move businesses toward startup or growth more quickly. Participants received $15,000 or $25,000 grants. The 2013 winner, Shelwes, created a new industrial product that allows sanders to work more effectively on a curved surface—a project that includes both intellectual property and manufacturing—and won multiple awards at the Specialty Equipment Marketing Association awards in 2013 (https://www.sema.org/sema-enews/2013/45/2013-sema-show-new-product-award-winners). Bella, a women’s boutique on Cherry Street in downtown Helena, also was awarded funds through the Helena Start-Up Challenge in 2013. Six awards were made and businesses started through the RIF grant.
2. The Helena Jobs Incentive targeted existing local businesses, providing incentives of $2,500 to $7,500 per job created. The money provides capital for business expansion that includes hiring. The jobs had to be of a certain quality, and a community stakeholder panel—including a local banker, an attorney, and a local academic—evaluated applications. Three businesses were provided $194,500 for the creation of 36 new full-time jobs, 22 of which were filled as of the study team’s site visit. An additional $48,000 was just approved to create 10 more jobs, which began in early 2015. This included Norac Additives, a business seen in figure 11.

60
Figure 11: Norac Additives—A Helena Jobs Incentive Recipient
3. The Riverside Renewal Program provides matching funds up to $100,000 for the development of commercial and residential property in downtown Helena. Many buildings are available in downtown Helena, but they need a significant amount of work. The program received 11 applications, of which 9 received grants. Five properties are under construction, with an additional four in environmental review. The grants totaled $722,000 for projects with investments of $2 million. Eight commercial and seven residential spaces were planned to be developed under this grant, with the residential units above the commercial properties.
4. The Community Champion Home Buyer Program emphasized lending for people with poor credit, much of it commercial lending, and has provided 11 loans valued at $1.1 million. The availability of these loans is not advertised; rather, people who apply but do not qualify for a loan are directed to the program and receive credit counseling to make them more loan ready. Much of Southern Bancorp and SBCP lending is funded by U.S. Department of Agriculture, leveraging other funds. The bank uses Rural Business Enterprise Grant and Rural Business Opportunity Grant funds to leverage RIF funds.
5. The Individual Development Accounts (IDA) and Home Buyer Credit Counseling match has created 196 new IDAs and 123 IDA-related purchases, with a total savings of $139,100. The RIF grant allowed the bank to remove many of the restrictions from the previous IDA program, which used Temporary Assistance for Needy Families money that had a requirement for dependents to be in the home. The RIF-funded IDAs can also pay for home repairs that the Temporary Assistance for Needy Families-funded programs could not, including the roof, window, and flooring repairs that are commonly needed in local homes. The repair contractors feel confidence in program participants, and the program staff members have contractors they feel they can recommend. Figure 12 shows one Civil War tourist attraction maintained by RIF-funded Southern Bancorp Community Partners of Helena, Arkansas.

61
Figure 12: Battle of Helena Civil War Site Sign, Maintained by SBCP
SBPC = Southern Bancorp Community Partners.
SBCP also identified tourism—particularly Civil War, Delta blues, and recreational tourism—as holding the most promise for economic revival, and SBCP became involved in updating, maintaining, and promoting several local Civil War battlefield sites to bring more potential customers into the revitalized downtown. The Helena-West Helena area also holds multiple festivals per year, including the King Biscuit Blues Festival, which offer a moderate—if infrequent—source of economic stimulus to the downtown revitalization area each year. Riverboats also occasionally dock at Helena for tourists and riders, offering another source of potential customers for local businesses.
SBCP instituted a wide-ranging, comprehensive program that targeted several major issues within the community, including retail leakage, jobs, credit access, economic development, and housing. SBCP also developed partnerships with a diverse set of organizations, including a local community garden, a chemical corporation, local community colleges, and Teach for America. This broad base of activities and partners allowed them to provide their clients with a wide range of references and resources.
Although the SBCP program was one of the broadest and most comprehensive the study team witnessed, however—embracing the concepts of place-based development, multiple partnerships, and layering of services—aspects of the program distinguish it from other rural organizations and may indicate that the project is atypical and possibly difficult to replicate elsewhere.
Figure 13 shows the SBCP’s vault in its offices.
62
Figure 13: Safe at SBCP Offices
SBPC = Southern Bancorp Community Partners.
First, SBCP is the nonprofit partner of Southern Bancorp, one of the nation’s largest rural development banks. Although SBCP is a community development financial institution in its own right, its application rested heavily on investment, support, and leverage received from Southern Bancorp, its corporate sibling. In fact, many of the interviews during the site visit to Helena took place in Southern Bancorp’s location in downtown Helena.
This partnership has had obvious benefits for the Helena area. In addition to the SBCP RIF project, Southern Bancorp also purchased and cleared many properties in Helena, and the presence of the bank has had a major impact on the availability of capital and the access to financial services in Helena-West Helena and the surrounding areas. The partnership of a major financial institution dedicated to improving access to credit and lending in a rural area and a nonprofit CDFI capable of applying for government housing and economic development grants—not to mention having the staff with the background and experience necessary to compete—is almost unique to the Helena area, however. Such a broad-ranging program requires a skilled staff, a sophisticated organizational structure, and access to extensive financial resources beyond even the $2 million available under a Category 1: Comprehensive grant. Those components may not be universally available in much of rural America.

63
In addition, the case of SBCP illustrates a trend that the team noticed among the nontribal Comprehensive grantees. The larger Comprehensive grant amounts might have attracted a different type of organization than pursued the RHED or Single-Purpose grants. Although generalizing from so few grants is impossible, of the five nontribal Comprehensive grants, three were new to the RIF and RHED programs, including SBCP. SBCP, PathStone, and Community Students Learning Center had never previously received a RHED grant and may have been attracted to the larger grant amounts available under RIF compared with RHED. Those organizations are larger and more regionally focused, with larger budgets and broader areas of interest than many of the local rural nonprofits that received RIF Single-Purpose and RHED grants. Many of the tribes that received Comprehensive or larger IEDE grants were newcomers as well.
The idea that the Comprehensive grants attracted a qualitatively different type of rural development organization is supported by comments made by other organizations that received Single-Purpose RIF grants that were part of the evaluation. One informant indicated that they felt that applying for one of the Comprehensive grants would have required them to expand into other program areas and that the organization felt “uncomfortable outside of [our] comfort zone.” They deemed the Comprehensive grants too risky to pursue given their organization’s capacity and expertise—even with the additional funds—and wanted to focus on a particular, narrow mission. That sentiment was expressed by other high-capacity organizations with Single-Purpose grants as well.
Further, two of the nontribal Comprehensive grantees—Nogales Community Development and Portable Practical Education Partners—had each received multiple RHED grants through the years. Whereas PPEP is a large-scale organization operating throughout Arizona, NCD is the type of locally based, concentrated grantee that was typical in the RHED program. The team believes that the larger grant amounts may have attracted different types of organizations like PathStone and SBCP, but that belief cannot be declared with any certainty given the data.
Finally, success for a truly comprehensive program such as SBCP is hard to measure, and the benefits to the community as a whole are years away from full realization. SBCP had not even completed its project when the team visited, and most of the RIF grantees had not completed their projects. That circumstance makes judging the broader community impact difficult. Although the revitalization of the historic downtown area passed the eye test, it was difficult to determine whether the new businesses and improvements would be sustainable in the long run. In addition, the impact of encouraging business startups, providing job training, establishing hiring incentives, and supporting other forms of economic development is a long-term prospect. Not enough time has passed for the layering of different projects established by SBCP—and other similar grantees such as PathStone and CSLC—to have the impact that the grantees envision. Figure 14 shows one Helena, Arkansas business that received a grant from the RIF funds to SBCP.

64
Figure 14: Thrive—A Helena-Based Business
65
9. Conclusion The Rural Innovation Fund and the Rural Housing and Economic Development program have sought to address the persistent, concentrated poverty that exists in many rural areas. RIF’s Single-Purpose grants, like the RHED grants that preceded them, seem to have been an effective method for generating housing and economic development in the places they served. Many of the organizations cited how the 3-year grant period and the flexibility in the uses of the funds allowed them to use the grants in conjunction with other, less flexible funding and made their projects feasible, acting as mortar between bricks.
The Single-Purpose and RHED grants also demonstrate that rural organizations are able to provide significant leverage for grants of this size and duration. Leverage rates for the Single-Purpose RIF grants, at more than 350 percent, were comparable to those for the RHED grants. Single-Purpose grants to tribes were also well leveraged, with an overall leverage rate of nearly 200 percent. This study provides evidence that the larger grant recipients had difficulty assembling leverage commitments at the rate possible for the smaller grants.
The RIF program offered several key benefits to grantees.
• RIF grants helped communities by leveraging nearly twice as much in additional funds for distressed rural areas.
• Flexibility was among the most important characteristics of the program; two examples of new enterprises as a result of the grants include a commercial oyster farm and a commercial greenhouse operation.
• Most (65 percent) of grantees stated that they were in better financial condition after the grant, with most citing the positive impact of RIF on finances.
• A high proportion of grantees devoted grant funds toward housing energy efficiency and green technology.
• The study’s telephone survey data indicated that, on the whole, the RIF grant process was successful in improving grantees’ staff capabilities and their ability to partner with other organizations.
• Partnership linkages included not only leveraging opportunities but also arrangements to conduct activities in a larger community context.
Implications Certain implications arise as potential considerations for future funding that is similar to or the same as the RIF and RHED programs. Following are several of those considerations—in no particular order.
• As part of the grant application review, greater emphasis should be placed on obtaining information about the financial stability of the applicant organization, including such requirements as the submission of a recent financial audit.
66
• In the application and vetting process, the notice of funding availability should specify the type of leveraging that HUD wishes to promote and reward within the applicant cohort. Those preferences should be explicitly stated in the program documentation, including the desire for other federal funds, other HUD funds, and external funds. HUD may consider assigning varying point schemes based on the proposed leverage structures.
• Regional offices should be more involved in the vetting and the oversight of any such program.
• Any future program design should retain the relative flexibility of the RIF program design. Although the majority of the RIF grantees used their funds for fairly standard programmatic activities, a sizable minority of the grantees used their grants to strike out into new activity areas. If HUD continues to offer grants of varying sizes, it should recognize the challenges that rural organizations may have in leveraging larger grants.
• Planned evaluations of grant outcomes and impacts should be included, providing sufficient time (at least 5 years) for projects to be completed and their impacts to be measureable. HUD should encourage applicants to include formative and independently conducted summary evaluations in their grant plans.
• A mentor/protégé model could be used, such as encouraging new applicants to seek out previous awardees for mentorship and guidance during all phases of the project. HUD may also consider offering technical assistance to new awardees, including using previously successful awardees and HUD personnel as technical assistance providers. Related to that idea, HUD should ensure that grantees have adequate resources to access for using required HUD systems (for instance, the Disaster Recovery Grant Reporting System) and processes, including a designated point of contact for questions and concerns.
Need for Further Research An important consideration in the design of this study was to gain an understanding of the impact of RIF and RHED grants on organizations’ technical and administrative capacity. Nonprofit organizational capacity is difficult to quantify, with few methods available that provide objective measures of capacity. This evaluation relied on self-reported, subjective assessments of how grants from the RIF and RHED program affected capacity—an unreliable measure but the best available. Understanding the impact of the grants and the relative values of larger and smaller grants is incomplete without addressing the effect of the grants on an organization’s financial systems, technical knowledge, and management. Assessment of the impacts of grants on housing and community development efforts should include effects on capacity building, leverage rates, and measures of outputs, outcomes, and impacts.
Certain measures may be effective proxies for capacity, such as ratios that can be derived from audit statements. A number of funders, particularly foundations, have sought to develop measures of organizational capacity to better target their resources to nonprofit organizations. Some of those measures include audit-derived financial ratios, such as the current ratio that measures liquidity. HUD may want to consider requiring financial audits as part of grant applications to provide a baseline by which to evaluate improvements in capacity. Although

67
the financial strength of a grantee does not speak to all aspects of capacity, it can provide a basis for evaluation and a greater assurance that grant funds will be properly handled.
As mentioned in the report, the key question as to the potential for economies of scale in grant award sizes remains inconclusive. The projects funded by the larger RIF grants need more time to develop before one can determine whether those grants have been effective in fostering comprehensive and sustainable community development efforts in rural areas. Further, even provided sufficient time, only three of the eight Comprehensive grant projects were truly comprehensive in design—too few to draw any definitive conclusions. Although the projects funded by the Indian Economic Development and Entrepreneurship grants may provide useful information about using grants to stimulate sustainable economic development in Indian country, those efforts also require a longer timeframe to properly evaluate.
Addressing concentrated and persistent poverty requires strong local organizations that can effectively and efficiently channel federal and other funds to the communities they serve. During RHED and RIF, a number of the grantees (particularly repeat grantees) built an organizational capacity that has allowed them to access various types of public and private funds; meet funders’ compliance requirements; establish local, regional, and national partnerships; and increase their technical capabilities. Many of the grantees interviewed cited increases in their organization’s technical capacity over time, learning new and energy-efficient building methods, establishing revolving loan funds, and learning ways to address the more complex needs of their communities. The capacity-building aspect of these grants is a key component of their ability to address their communities’ persistent poverty, but capacity building is a difficult aspect to evaluate.
The need to identify effective methods for ameliorating the condition of concentrated poverty in rural areas is a key policy issue, and HUD has recognized the need for those efforts to be both comprehensive and sustainable. Although the subject evaluation has certainly added to the knowledge of how grants such as RIF and RHED may target and potentially address concentrated rural poverty, clearly further research, including long-term outcome studies, will provide a more comprehensive and accurate set of findings.

U.S. Department of Housing and Urban Development
Office of Policy Development and Research
Washington, DC 20410-6000
January 2017