Volume 4, Issue 1—January 2012 Pasture Aeration Trial
8
Pasture Aeration Trial Larry Forero, UCCE Shasta, Farm Advisor Dan Marcum, UCCE Shasta-Lassen, Farm Advisor Pasture aeration is a practice done on some ranches in an effort to improve water penetration and improve production. Proponents of the technique claims this prac- tice will increase the quantity of forage produced from pasture improve production. In the 2009 field season, a trial was initiated to determine the benefits of aeration on pastures in Hat Creek as well as the Palo Cedro area. The Hat Creek Trial results are described below. The treatments and controls were applied in the spring of the year. Figures 1 and 2 depict the equipment and the results of the treatment. The soil was a sandy cobbly loam. Both control and treatment plots were protected from grazing and harvested on a 30 day interval. Results Figure 3 outlines the monthly forage production as well as the total production at the site. The overlapping confidence intervals indicate the treatment and control cannot be separated statistically. Palo Cedro Trial A pasture aeration trial was conducted on loamy soil in the Palo Cedro area. Alternating borders were treated in June after haying. Replicated control and treatment plots were protected from grazing and harvested at the end of the growing season. No statistical difference in production could be found. Conclusion Most of the research done on the value of aerators for pasture and hay is not encouraging. This does not mean that aeration will always be ineffective. It is possible that there are sites where severe compaction problems exist from cattle trampling or heavy equipment traffic on certain soils where aerator equipment may improve water infiltration and increase forage yields. Careful evaluation of potential aeration sites should be done before using a soil aerator. From research results so far, it is unlikely that most areas will give much economic benefit from this practice. Soil disturbance by an aerator could also result in weed problems in a pasture. Research in Canada and New Zealand showed similar results. In both cases the authors were unable to document lasting benefits due to aeration. Malhi, S., K. Heir, and K. Nielsen. 2000. Efficacy of pasture rejuvenation through mechanical aeration of N fertilization. Canadian Journal of Plant Science 80:4 813-815. Courname, F., R. McDowell, and R. Littlejohn. 2011. Is mechanical soil aeration a strategy to alleviate soil compaction and decrease phosophorus and suspended sediment losses from irrigated and rain-fed cattle-grazed pastures? Soil Use and Management 27:3 376-384. Figure 1. Pasture Aeration Implement Figure 2. Field after treatment (Hat Creek) Figure 3-Hat Creek Plots-2009 Field Season 0 1000 2000 3000 4000 5000 6000 7000 8000 9000 May June July August Sept. Oct. Season Total Lbs/Acre Control lbs/acre) Test (lbs/acre) Volume 4, Issue 1—January 2012
Transcript of Volume 4, Issue 1—January 2012 Pasture Aeration Trial
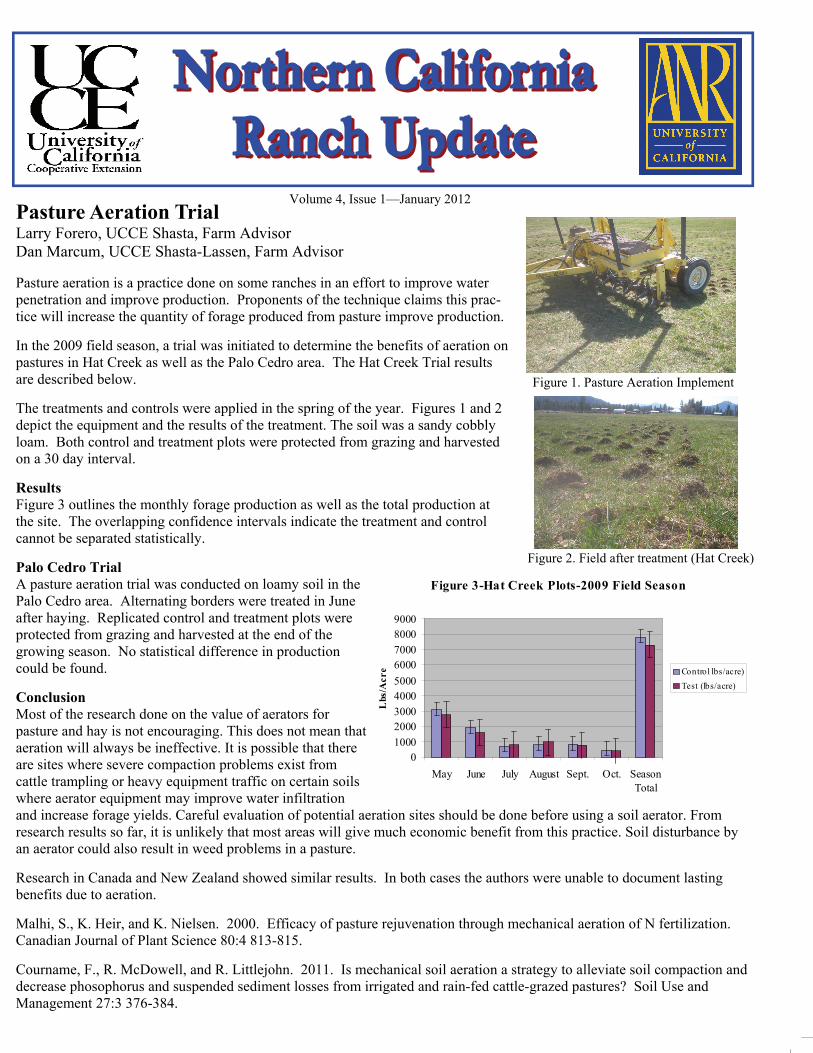
Pasture Aeration Trial Larry Forero, UCCE Shasta, Farm Advisor Dan Marcum, UCCE Shasta-Lassen, Farm Advisor Pasture aeration is a practice done on some ranches in an effort to improve water penetration and improve production. Proponents of the technique claims this prac- tice will increase the quantity of forage produced from pasture improve production. In the 2009 field season, a trial was initiated to determine the benefits of aeration on pastures in Hat Creek as well as the Palo Cedro area. The Hat Creek Trial results are described below. The treatments and controls were applied in the spring of the year. Figures 1 and 2 depict the equipment and the results of the treatment. The soil was a sandy cobbly loam. Both control and treatment plots were protected from grazing and harvested on a 30 day interval. Results Figure 3 outlines the monthly forage production as well as the total production at the site. The overlapping confidence intervals indicate the treatment and control cannot be separated statistically. Palo Cedro Trial A pasture aeration trial was conducted on loamy soil in the Palo Cedro area. Alternating borders were treated in June after haying. Replicated control and treatment plots were protected from grazing and harvested at the end of the growing season. No statistical difference in production could be found. Conclusion Most of the research done on the value of aerators for pasture and hay is not encouraging. This does not mean that aeration will always be ineffective. It is possible that there are sites where severe compaction problems exist from cattle trampling or heavy equipment traffic on certain soils where aerator equipment may improve water infiltration and increase forage yields. Careful evaluation of potential aeration sites should be done before using a soil aerator. From research results so far, it is unlikely that most areas will give much economic benefit from this practice. Soil disturbance by an aerator could also result in weed problems in a pasture. Research in Canada and New Zealand showed similar results. In both cases the authors were unable to document lasting benefits due to aeration. Malhi, S., K. Heir, and K. Nielsen. 2000. Efficacy of pasture rejuvenation through mechanical aeration of N fertilization. Canadian Journal of Plant Science 80:4 813-815. Courname, F., R. McDowell, and R. Littlejohn. 2011. Is mechanical soil aeration a strategy to alleviate soil compaction and decrease phosophorus and suspended sediment losses from irrigated and rain-fed cattle-grazed pastures? Soil Use and Management 27:3 376-384.
Figure 1. Pasture Aeration Implement
Figure 2. Field after treatment (Hat Creek)
Figure 3-Hat Creek Plots-2009 Field Season
0100020003000400050006000700080009000
May June July August Sept. Oct. SeasonTotal
Lbs
/Acr
e Control lbs/acre)Test (lbs/acre)
Volume 4, Issue 1—January 2012
Research Update on Using a Rotary Wiper
Josh Davy – UCCE Farm Advisor, Betsy Karle – UCCE Dairy Rep Guy Kyser – UC Weed Specialist, Glenn Nader – UCCE Farm Advisor
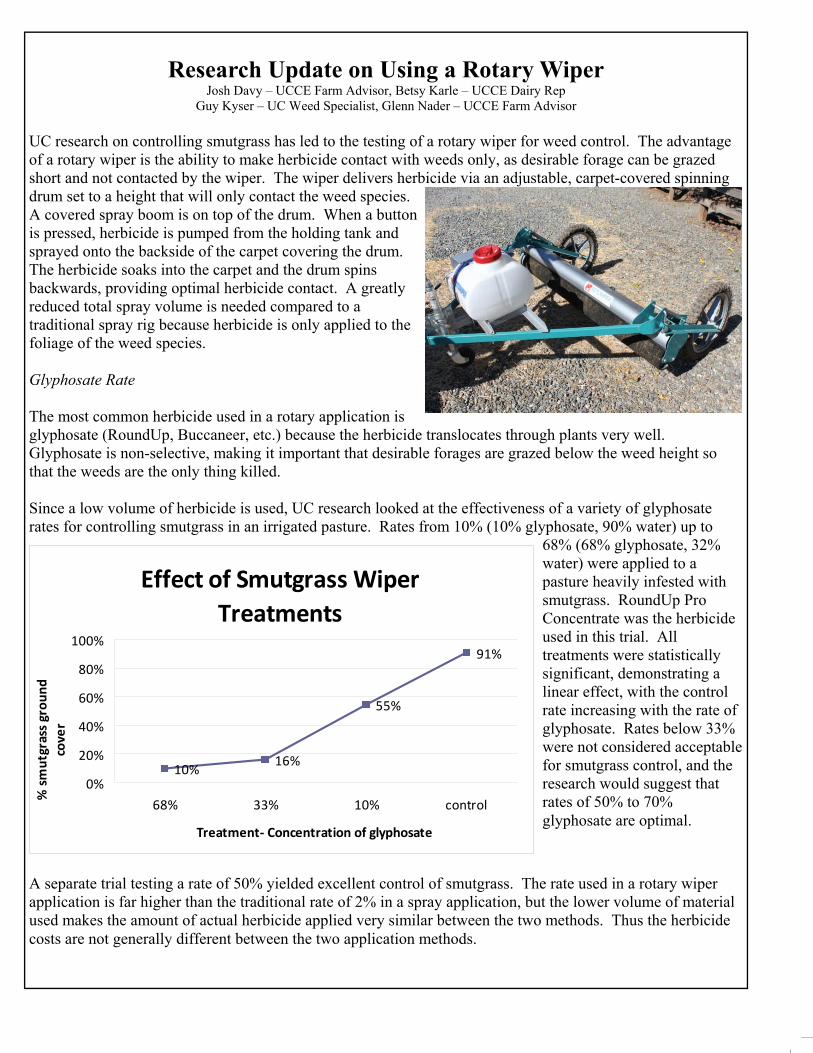
UC research on controlling smutgrass has led to the testing of a rotary wiper for weed control. The advantage of a rotary wiper is the ability to make herbicide contact with weeds only, as desirable forage can be grazed short and not contacted by the wiper. The wiper delivers herbicide via an adjustable, carpet-covered spinning drum set to a height that will only contact the weed species. A covered spray boom is on top of the drum. When a button is pressed, herbicide is pumped from the holding tank and sprayed onto the backside of the carpet covering the drum. The herbicide soaks into the carpet and the drum spins backwards, providing optimal herbicide contact. A greatly reduced total spray volume is needed compared to a traditional spray rig because herbicide is only applied to the foliage of the weed species. Glyphosate Rate The most common herbicide used in a rotary application is glyphosate (RoundUp, Buccaneer, etc.) because the herbicide translocates through plants very well. Glyphosate is non-selective, making it important that desirable forages are grazed below the weed height so that the weeds are the only thing killed.
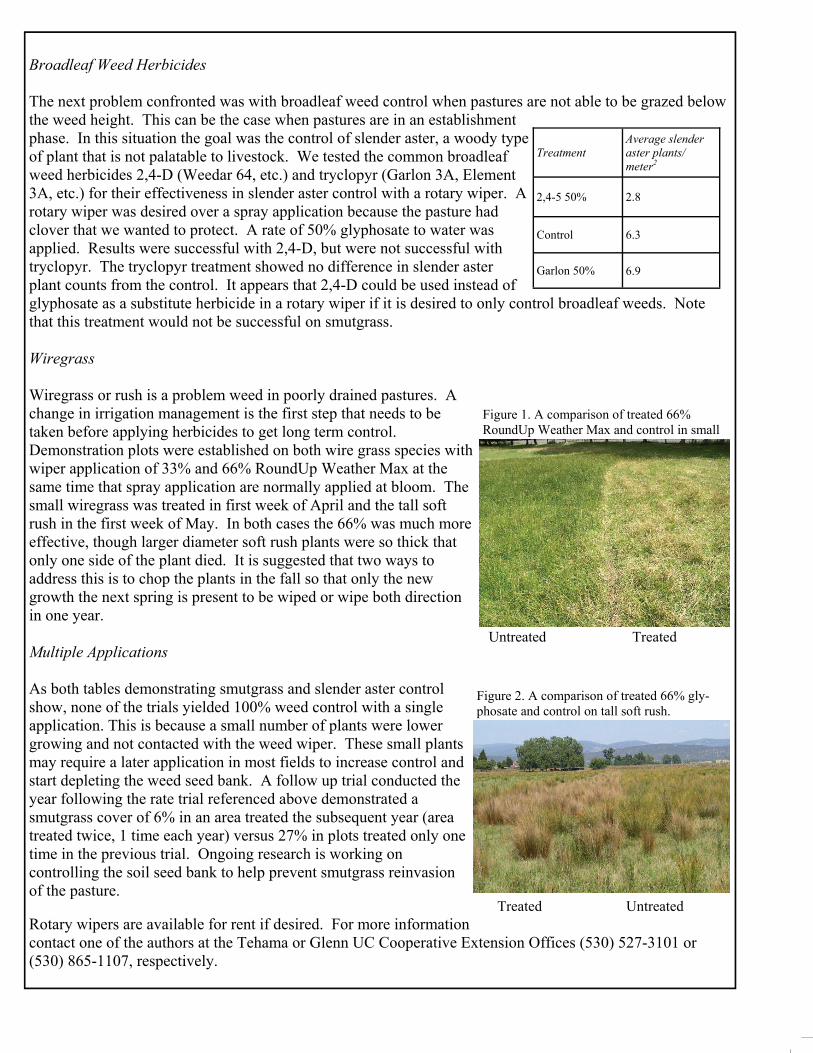
Since a low volume of herbicide is used, UC research looked at the effectiveness of a variety of glyphosate rates for controlling smutgrass in an irrigated pasture. Rates from 10% (10% glyphosate, 90% water) up to
68% (68% glyphosate, 32% water) were applied to a pasture heavily infested with smutgrass. RoundUp Pro Concentrate was the herbicide used in this trial. All treatments were statistically significant, demonstrating a linear effect, with the control rate increasing with the rate of glyphosate. Rates below 33% were not considered acceptable for smutgrass control, and the research would suggest that rates of 50% to 70% glyphosate are optimal.
A separate trial testing a rate of 50% yielded excellent control of smutgrass. The rate used in a rotary wiper application is far higher than the traditional rate of 2% in a spray application, but the lower volume of material used makes the amount of actual herbicide applied very similar between the two methods. Thus the herbicide costs are not generally different between the two application methods.
Effect of Smutgrass Wiper Treatments
10% 16%
55%
91%
0%
20%
40%
60%
80%
100%
68% 33% 10% control
Treatment‐ Concentration of glyphosate
% sm
utgrass g
roun
d cover
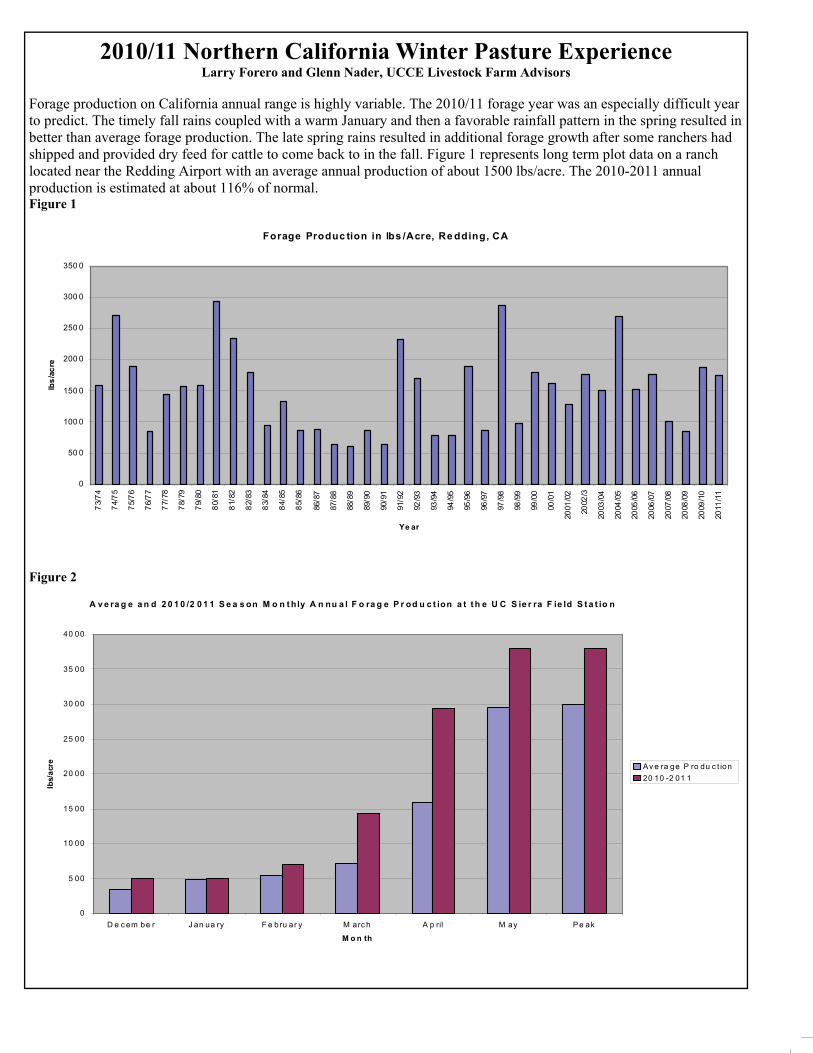
Broadleaf Weed Herbicides The next problem confronted was with broadleaf weed control when pastures are not able to be grazed below the weed height. This can be the case when pastures are in an establishment phase. In this situation the goal was the control of slender aster, a woody type of plant that is not palatable to livestock. We tested the common broadleaf weed herbicides 2,4-D (Weedar 64, etc.) and tryclopyr (Garlon 3A, Element 3A, etc.) for their effectiveness in slender aster control with a rotary wiper. A rotary wiper was desired over a spray application because the pasture had clover that we wanted to protect. A rate of 50% glyphosate to water was applied. Results were successful with 2,4-D, but were not successful with tryclopyr. The tryclopyr treatment showed no difference in slender aster plant counts from the control. It appears that 2,4-D could be used instead of glyphosate as a substitute herbicide in a rotary wiper if it is desired to only control broadleaf weeds. Note that this treatment would not be successful on smutgrass. Wiregrass Wiregrass or rush is a problem weed in poorly drained pastures. A change in irrigation management is the first step that needs to be taken before applying herbicides to get long term control. Demonstration plots were established on both wire grass species with wiper application of 33% and 66% RoundUp Weather Max at the same time that spray application are normally applied at bloom. The small wiregrass was treated in first week of April and the tall soft rush in the first week of May. In both cases the 66% was much more effective, though larger diameter soft rush plants were so thick that only one side of the plant died. It is suggested that two ways to address this is to chop the plants in the fall so that only the new growth the next spring is present to be wiped or wipe both direction in one year. Multiple Applications As both tables demonstrating smutgrass and slender aster control show, none of the trials yielded 100% weed control with a single application. This is because a small number of plants were lower growing and not contacted with the weed wiper. These small plants may require a later application in most fields to increase control and start depleting the weed seed bank. A follow up trial conducted the year following the rate trial referenced above demonstrated a smutgrass cover of 6% in an area treated the subsequent year (area treated twice, 1 time each year) versus 27% in plots treated only one time in the previous trial. Ongoing research is working on controlling the soil seed bank to help prevent smutgrass reinvasion of the pasture. Rotary wipers are available for rent if desired. For more information contact one of the authors at the Tehama or Glenn UC Cooperative Extension Offices (530) 527-3101 or (530) 865-1107, respectively.
Treatment Average slender aster plants/meter2
2,4-5 50% 2.8
Control 6.3
Garlon 50% 6.9
Figure 1. A comparison of treated 66% RoundUp Weather Max and control in small
Untreated Treated
Figure 2. A comparison of treated 66% gly-phosate and control on tall soft rush.
Treated Untreated
2010/11 Northern California Winter Pasture Experience Larry Forero and Glenn Nader, UCCE Livestock Farm Advisors
Forage production on California annual range is highly variable. The 2010/11 forage year was an especially difficult year to predict. The timely fall rains coupled with a warm January and then a favorable rainfall pattern in the spring resulted in better than average forage production. The late spring rains resulted in additional forage growth after some ranchers had shipped and provided dry feed for cattle to come back to in the fall. Figure 1 represents long term plot data on a ranch located near the Redding Airport with an average annual production of about 1500 lbs/acre. The 2010-2011 annual production is estimated at about 116% of normal. Figure 1
Figure 2
Forage Produc tion in lbs /Acre, Re dding, CA
0
50 0
100 0
150 0
200 0
250 0
300 0
350 0
73/7
4
74/7
5
75/7
6
76/7
7
77/7
8
78/7
9
79/8
0
80/8
1
81/8
2
82/8
3
83/8
4
84/8
5
85/8
6
86/8
7
87/8
8
88/8
9
89/9
0
90/9
1
91/9
2
92/9
3
93/9
4
94/9
5
95/9
6
96/9
7
97/9
8
98/9
9
99/0
0
00/0
1
2001
/02
2002
/3
2003
/04
2004
/05
2005
/06
2006
/07
2007
/08
2008
/09
2009
/10
2011
/11
Ye ar
lbs/
acre
A v e ra g e a n d 2 0 1 0 /2 0 1 1 S e a s on M o n t hly A n nu a l F o ra g e P r od u c t ion a t t h e U C S ie r ra F ie ld S t a t io n
0
5 00
10 00
15 00
20 00
25 00
30 00
35 00
40 00
D e c em be r J an ua ry F e bru ar y M arc h A p ril M ay Pe ak
M o n th
lbs/
acre Av e ra ge P ro du c t ion
20 10 -2 01 1
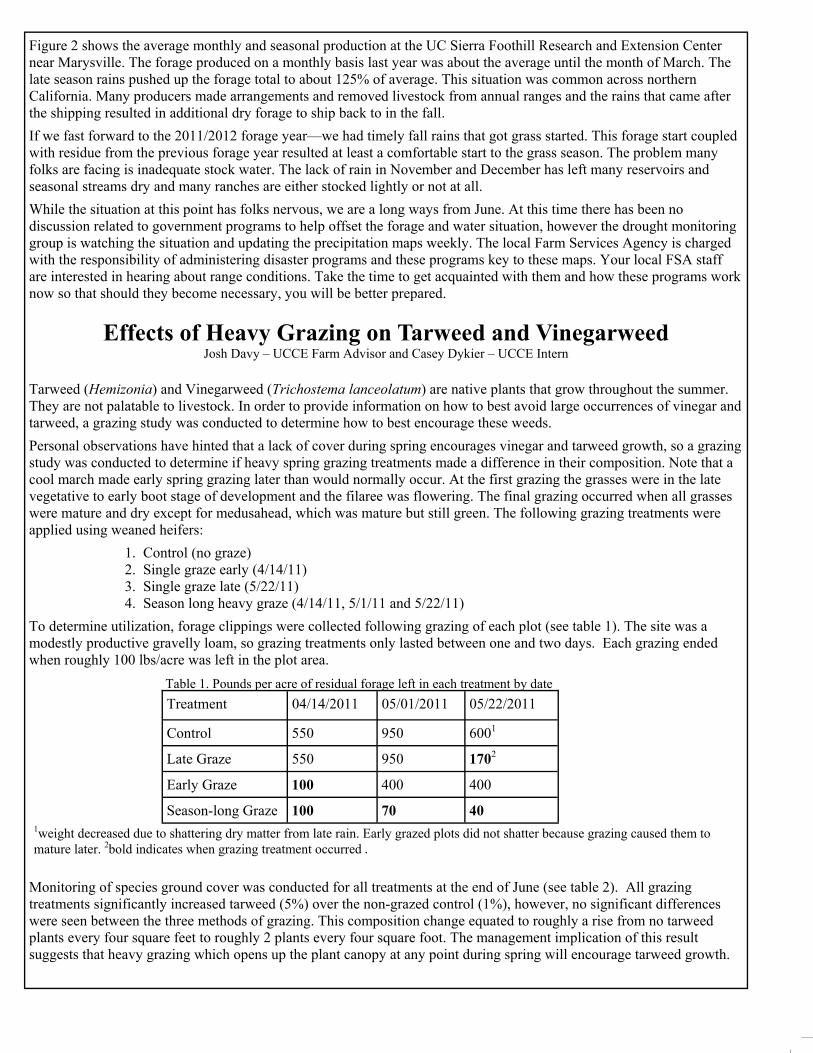
Figure 2 shows the average monthly and seasonal production at the UC Sierra Foothill Research and Extension Center near Marysville. The forage produced on a monthly basis last year was about the average until the month of March. The late season rains pushed up the forage total to about 125% of average. This situation was common across northern California. Many producers made arrangements and removed livestock from annual ranges and the rains that came after the shipping resulted in additional dry forage to ship back to in the fall.
If we fast forward to the 2011/2012 forage year—we had timely fall rains that got grass started. This forage start coupled with residue from the previous forage year resulted at least a comfortable start to the grass season. The problem many folks are facing is inadequate stock water. The lack of rain in November and December has left many reservoirs and seasonal streams dry and many ranches are either stocked lightly or not at all.
While the situation at this point has folks nervous, we are a long ways from June. At this time there has been no discussion related to government programs to help offset the forage and water situation, however the drought monitoring group is watching the situation and updating the precipitation maps weekly. The local Farm Services Agency is charged with the responsibility of administering disaster programs and these programs key to these maps. Your local FSA staff are interested in hearing about range conditions. Take the time to get acquainted with them and how these programs work now so that should they become necessary, you will be better prepared.
Effects of Heavy Grazing on Tarweed and Vinegarweed Josh Davy – UCCE Farm Advisor and Casey Dykier – UCCE Intern
Tarweed (Hemizonia) and Vinegarweed (Trichostema lanceolatum) are native plants that grow throughout the summer. They are not palatable to livestock. In order to provide information on how to best avoid large occurrences of vinegar and tarweed, a grazing study was conducted to determine how to best encourage these weeds.
Personal observations have hinted that a lack of cover during spring encourages vinegar and tarweed growth, so a grazing study was conducted to determine if heavy spring grazing treatments made a difference in their composition. Note that a cool march made early spring grazing later than would normally occur. At the first grazing the grasses were in the late vegetative to early boot stage of development and the filaree was flowering. The final grazing occurred when all grasses were mature and dry except for medusahead, which was mature but still green. The following grazing treatments were applied using weaned heifers:
1. Control (no graze) 2. Single graze early (4/14/11) 3. Single graze late (5/22/11) 4. Season long heavy graze (4/14/11, 5/1/11 and 5/22/11)
To determine utilization, forage clippings were collected following grazing of each plot (see table 1). The site was a modestly productive gravelly loam, so grazing treatments only lasted between one and two days. Each grazing ended when roughly 100 lbs/acre was left in the plot area.
Monitoring of species ground cover was conducted for all treatments at the end of June (see table 2). All grazing treatments significantly increased tarweed (5%) over the non-grazed control (1%), however, no significant differences were seen between the three methods of grazing. This composition change equated to roughly a rise from no tarweed plants every four square feet to roughly 2 plants every four square foot. The management implication of this result suggests that heavy grazing which opens up the plant canopy at any point during spring will encourage tarweed growth.
Treatment 04/14/2011 05/01/2011 05/22/2011
Control 550 950 6001
Late Graze 550 950 1702
Early Graze 100 400 400
Season-long Graze 100 70 40
Table 1. Pounds per acre of residual forage left in each treatment by date
1weight decreased due to shattering dry matter from late rain. Early grazed plots did not shatter because grazing caused them to mature later. 2bold indicates when grazing treatment occurred .
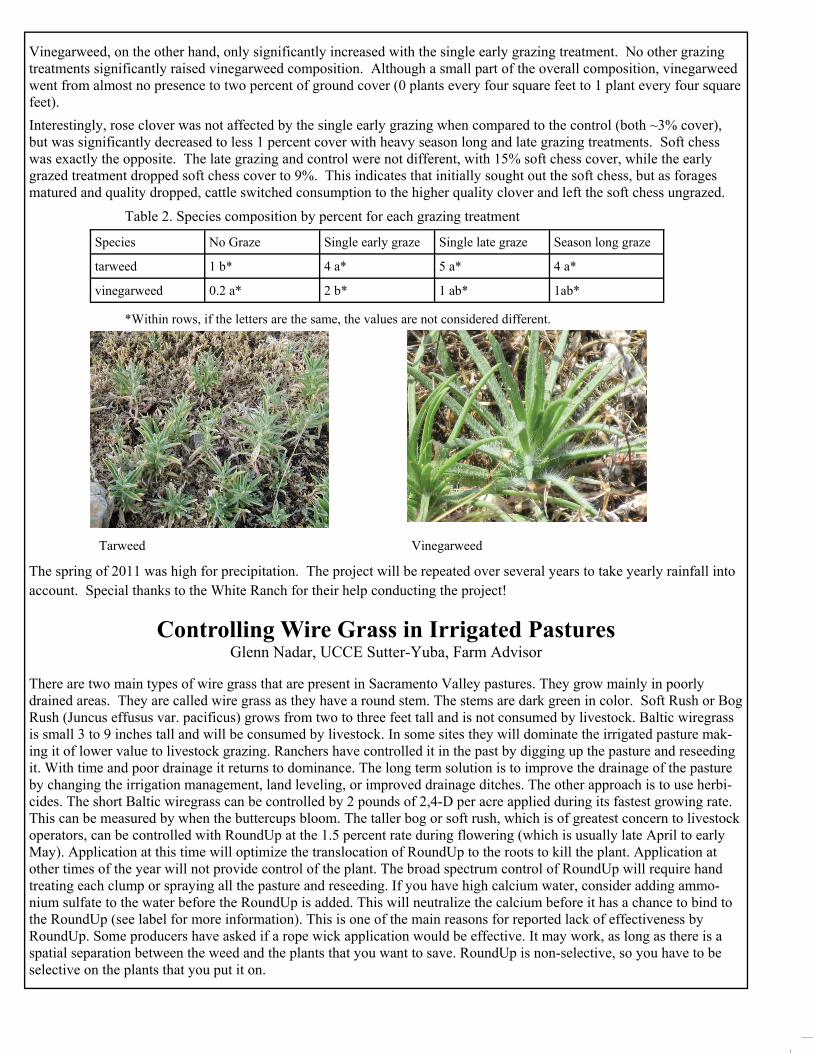
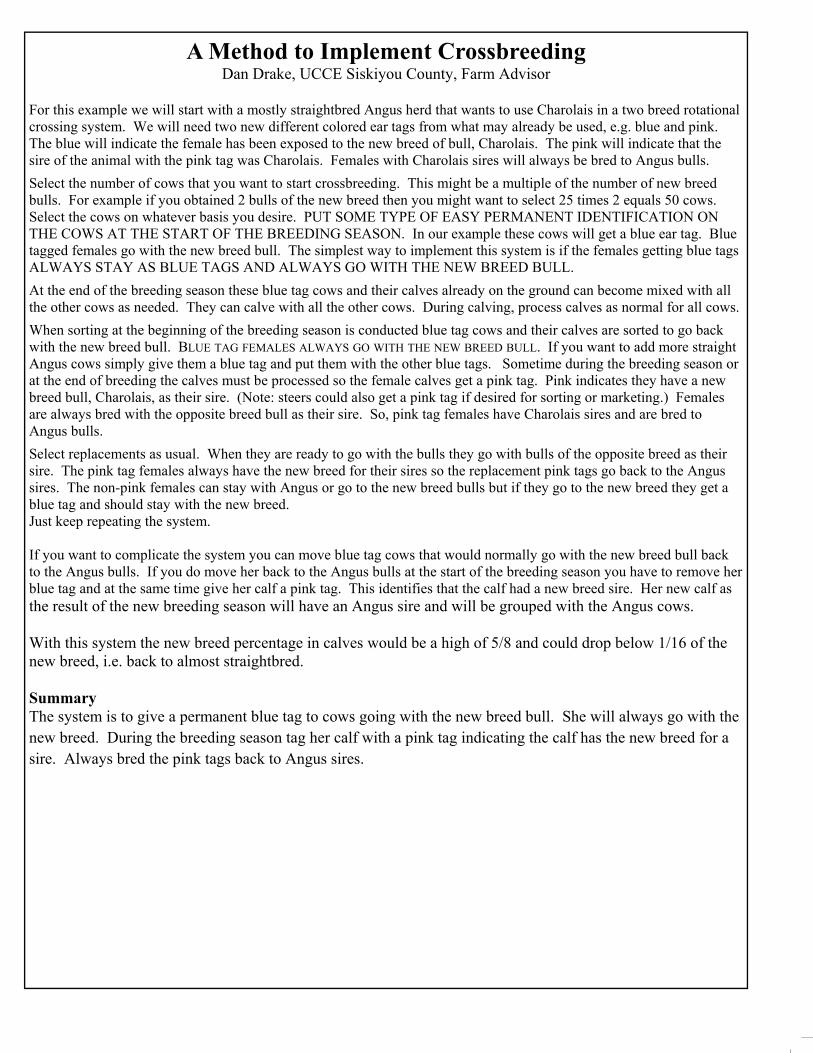
Vinegarweed, on the other hand, only significantly increased with the single early grazing treatment. No other grazing treatments significantly raised vinegarweed composition. Although a small part of the overall composition, vinegarweed went from almost no presence to two percent of ground cover (0 plants every four square feet to 1 plant every four square feet).
Interestingly, rose clover was not affected by the single early grazing when compared to the control (both ~3% cover), but was significantly decreased to less 1 percent cover with heavy season long and late grazing treatments. Soft chess was exactly the opposite. The late grazing and control were not different, with 15% soft chess cover, while the early grazed treatment dropped soft chess cover to 9%. This indicates that initially sought out the soft chess, but as forages matured and quality dropped, cattle switched consumption to the higher quality clover and left the soft chess ungrazed.
Table 2. Species composition by percent for each grazing treatment *Within rows, if the letters are the same, the values are not considered different. Tarweed Vinegarweed
The spring of 2011 was high for precipitation. The project will be repeated over several years to take yearly rainfall into account. Special thanks to the White Ranch for their help conducting the project!
Controlling Wire Grass in Irrigated Pastures Glenn Nadar, UCCE Sutter-Yuba, Farm Advisor
There are two main types of wire grass that are present in Sacramento Valley pastures. They grow mainly in poorly drained areas. They are called wire grass as they have a round stem. The stems are dark green in color. Soft Rush or Bog Rush (Juncus effusus var. pacificus) grows from two to three feet tall and is not consumed by livestock. Baltic wiregrass is small 3 to 9 inches tall and will be consumed by livestock. In some sites they will dominate the irrigated pasture mak-ing it of lower value to livestock grazing. Ranchers have controlled it in the past by digging up the pasture and reseeding it. With time and poor drainage it returns to dominance. The long term solution is to improve the drainage of the pasture by changing the irrigation management, land leveling, or improved drainage ditches. The other approach is to use herbi-cides. The short Baltic wiregrass can be controlled by 2 pounds of 2,4-D per acre applied during its fastest growing rate. This can be measured by when the buttercups bloom. The taller bog or soft rush, which is of greatest concern to livestock operators, can be controlled with RoundUp at the 1.5 percent rate during flowering (which is usually late April to early May). Application at this time will optimize the translocation of RoundUp to the roots to kill the plant. Application at other times of the year will not provide control of the plant. The broad spectrum control of RoundUp will require hand treating each clump or spraying all the pasture and reseeding. If you have high calcium water, consider adding ammo-nium sulfate to the water before the RoundUp is added. This will neutralize the calcium before it has a chance to bind to the RoundUp (see label for more information). This is one of the main reasons for reported lack of effectiveness by RoundUp. Some producers have asked if a rope wick application would be effective. It may work, as long as there is a spatial separation between the weed and the plants that you want to save. RoundUp is non-selective, so you have to be selective on the plants that you put it on.
Species No Graze Single early graze Single late graze Season long graze
tarweed 1 b* 4 a* 5 a* 4 a*
vinegarweed 0.2 a* 2 b* 1 ab* 1ab*
A Method to Implement Crossbreeding Dan Drake, UCCE Siskiyou County, Farm Advisor
For this example we will start with a mostly straightbred Angus herd that wants to use Charolais in a two breed rotational crossing system. We will need two new different colored ear tags from what may already be used, e.g. blue and pink. The blue will indicate the female has been exposed to the new breed of bull, Charolais. The pink will indicate that the sire of the animal with the pink tag was Charolais. Females with Charolais sires will always be bred to Angus bulls.
Select the number of cows that you want to start crossbreeding. This might be a multiple of the number of new breed bulls. For example if you obtained 2 bulls of the new breed then you might want to select 25 times 2 equals 50 cows. Select the cows on whatever basis you desire. PUT SOME TYPE OF EASY PERMANENT IDENTIFICATION ON THE COWS AT THE START OF THE BREEDING SEASON. In our example these cows will get a blue ear tag. Blue tagged females go with the new breed bull. The simplest way to implement this system is if the females getting blue tags ALWAYS STAY AS BLUE TAGS AND ALWAYS GO WITH THE NEW BREED BULL.
At the end of the breeding season these blue tag cows and their calves already on the ground can become mixed with all the other cows as needed. They can calve with all the other cows. During calving, process calves as normal for all cows.
When sorting at the beginning of the breeding season is conducted blue tag cows and their calves are sorted to go back with the new breed bull. BLUE TAG FEMALES ALWAYS GO WITH THE NEW BREED BULL. If you want to add more straight Angus cows simply give them a blue tag and put them with the other blue tags. Sometime during the breeding season or at the end of breeding the calves must be processed so the female calves get a pink tag. Pink indicates they have a new breed bull, Charolais, as their sire. (Note: steers could also get a pink tag if desired for sorting or marketing.) Females are always bred with the opposite breed bull as their sire. So, pink tag females have Charolais sires and are bred to Angus bulls.
Select replacements as usual. When they are ready to go with the bulls they go with bulls of the opposite breed as their sire. The pink tag females always have the new breed for their sires so the replacement pink tags go back to the Angus sires. The non-pink females can stay with Angus or go to the new breed bulls but if they go to the new breed they get a blue tag and should stay with the new breed. Just keep repeating the system. If you want to complicate the system you can move blue tag cows that would normally go with the new breed bull back to the Angus bulls. If you do move her back to the Angus bulls at the start of the breeding season you have to remove her blue tag and at the same time give her calf a pink tag. This identifies that the calf had a new breed sire. Her new calf as the result of the new breeding season will have an Angus sire and will be grouped with the Angus cows. With this system the new breed percentage in calves would be a high of 5/8 and could drop below 1/16 of the new breed, i.e. back to almost straightbred. Summary The system is to give a permanent blue tag to cows going with the new breed bull. She will always go with the new breed. During the breeding season tag her calf with a pink tag indicating the calf has the new breed for a sire. Always bred the pink tags back to Angus sires.

5:01 pm Integrated Program for Reducing Bovine Respiratory Disease in Beef Allison Van Eenennaam, UCCE Biotechnology Specialist 5:45pm Biotechnology use in feedlots Dr. Ben Holland – Assistant Professor/Feedlot Specialist North Dakota State University 6:30 pm Treating and Managing Pneumonia John Maas, DVM, UC Davis School of Veterinary Medicine Bill Gray, DVM, Cottonwood Veterinary Clinic 7:15 pm Dinner from Vic’s Branding Iron courtesy of : Hawes Farm & Ranch Supply and Shasta Farm and Equipment, and Northern California Farm Credit 7:45 pm Artificial Insemination for Beef Cattle-Costs and Benefits Dan Drake, Siskiyou Co. Cooperative Extension 8:15 pm Mineral Supplementation Check-up Larry Forero, Josh Davy, and Dr. John Maas UCCE
Winter Ag Meeting
The University of California in accordance with applicable State and Federal law and University policy, does not discriminate on the basis of race, color, national origin, religion, sex, disability, age, medical condition (cancer-related), ancestry, marital status, citizenship, sexual orientation, or status as a Vietnam-era veteran or special disabled veteran. The University also prohibits sexual harassment. Inquiries regarding the University’s nondiscrimination policies may be directed to the Affirmative Action Director, University of California, Agriculture and Natural Resources, 300 Lakeside Drive, 6th Floor, Oakland, CA 94612-3560. (510) 987-0096.
Please RSVP to Larry Forero or Josh Davy for Dinner by February 23, 2011
For more information, call Larry Forero at (530) 224-4900 or Josh Davy at (530) 527-3101
Brought to you by : Hawes Farm and Ranch, Northern CA Farm Credit, Pfizer Animal Health, Cottonwood Veterinary Clinic, Shasta Farm and Equipment, Shasta Livestock, Shasta And Tehama County Cattlemen’s Associations & UC Cooperative Extension
Friday February 24, 2012
5:00 p.m. - 8:30 p.m.
Shasta Livestock Auction Yard, Cottonwood