Volume 18 Issue 9 September 2014 End of the Brucellosis ... Health Inspection Service (APHIS) since...
4
R eview D airy California Sources: CDFA Dairy Marketing and Milk Pooling Branches The Size of California’s Dairy Farms, May 2014 = Farms producing at least one tanker load of milk per day, based on 1.5+ million pounds/month. • The 536 dairy farms producing over 2.4 million pounds per month (37% of the state’s dairies) produce 73% of the state’s milk marketings. • In May 2014, 811 dairies produced more than one tanker load of milk per day. California Farms by Size, A Comparison... • The 346 dairy farms (24% of the state’s dairies) producing less than 750,000 pounds per month produce less than 4% of the state’s milk marketings. • Nearly 42% of the total milk marketings were from dairies who produce over 5 million pounds of milk per month. • In May 2014, there were 203 dairies producing more than 5 million pounds of milk per month (up from 201 dairies in 2013). Range of Milk Marketings Number of Grade A & B Farms Percent of Total Grade A & B Farms Percent of Total Grade A & B Milk Marketings > 5.0 Million Lbs. 203 13.85% 41.80% 2.4 to 4.9 Million Lbs. 333 22.71% 31.24% 1.5 to 2.3 Million Lbs. 275 18.76% 14.20% 1 to 1.4 Million Lbs. 188 12.82% 6.25% 750,000 to 999,999 Lbs. 121 8.25% 2.85% 500,000 to 749,999 Lbs. 108 7.37% 1.82% 250,000 to 499,999 Lbs. 143 9.75% 1.47% < 249,999 Lbs. 95 6.48% 0.37% Volume 18 Issue 9 September 2014 The California Department of Food and Agriculture (CDFA) has cooperated with the livestock industry and the U.S. Department of Agriculture's (USDA) Animal and Plant Health Inspection Service (APHIS) since 1934 to eradicate brucellosis. California obtained brucellosis-free status in 1997. By 2007, the national eradication program had achieved an all-time low national herd prevalence of less than 0.0001 percent and since July 2009 the USDA has designated all fifty states as Class Free for bovine brucellosis. Despite recent detections of infection in livestock in the Greater Yellowstone Area (GYA) states of Idaho, Montana and Wyoming, where the disease is endemic in wild elk and bison, all three states remain Class Free. The national surveillance plan changed in 2009 to direct resources to the challenges from brucellosis in wildlife and eliminated funding for the brucellosis milk ring test (BRT) program and for brucellosis testing at saleyards and reduced slaughter surveillance. End of the Brucellosis Milk Surveillance Program in California From Dr. Annette Jones, D.V.M., State Veterinarian and Director California maintained a BRT program through July 2014, testing milk samples from all commercial dairies twice a year. It has been over 22 years since the last dairy herd was detected with brucellosis in California using the BRT. Ensuring the collection of fresh milk samples representing every milking cow from every dairy has become difficult and costly due to California’s large dairies and complex marketing strategies, and it has been determined that CDFA’s resources could be better utilized in other activities. As of August 1, 2014 we are ceasing the brucellosis milk surveillance program and will rely on slaughter surveillance, private tests, and the examination of aborted fetuses and samples from aborting cattle submitted to the laboratory to detect infection and meet the national surveillance goals to maintain brucellosis- free status.
Transcript of Volume 18 Issue 9 September 2014 End of the Brucellosis ... Health Inspection Service (APHIS) since...
ReviewDairyCalifornia
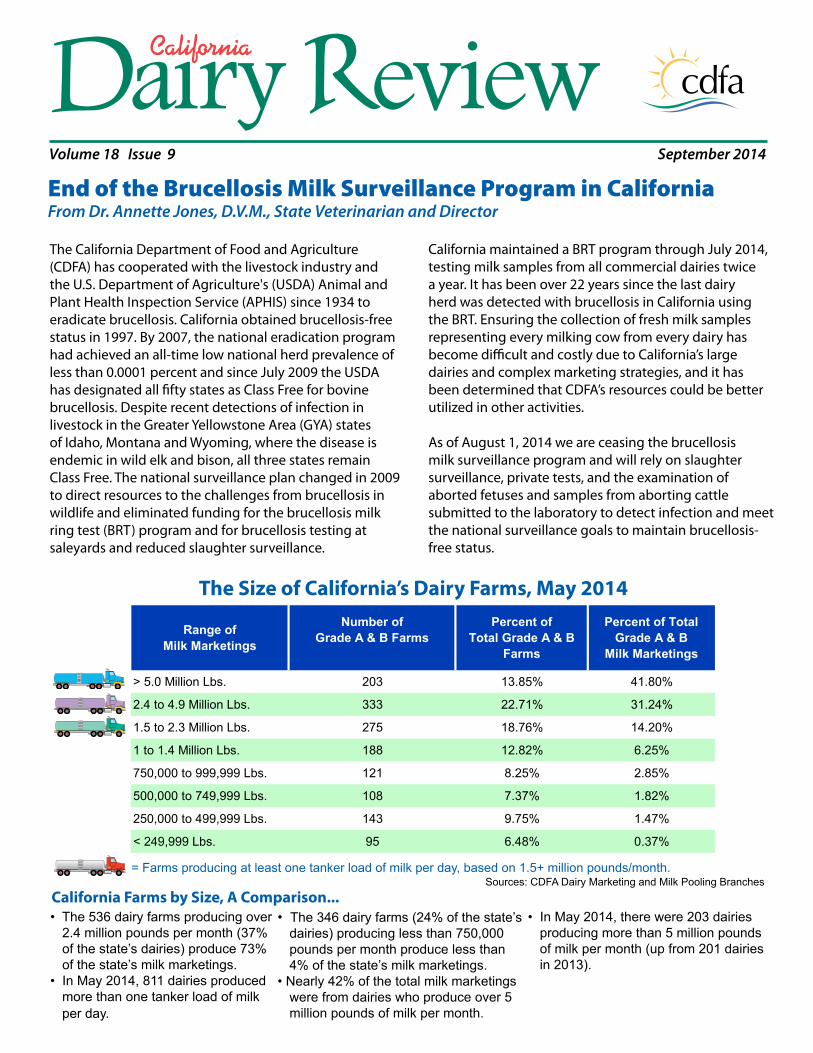
Sources: CDFA Dairy Marketing and Milk Pooling Branches
The Size of California’s Dairy Farms, May 2014
= Farms producing at least one tanker load of milk per day, based on 1.5+ million pounds/month.
• The 536 dairy farms producing over 2.4 million pounds per month (37% of the state’s dairies) produce 73% of the state’s milk marketings.
• In May 2014, 811 dairies produced more than one tanker load of milk per day.
California Farms by Size, A Comparison...• The 346 dairy farms (24% of the state’s
dairies) producing less than 750,000 pounds per month produce less than 4% of the state’s milk marketings.
• Nearly 42% of the total milk marketings were from dairies who produce over 5 million pounds of milk per month.
• In May 2014, there were 203 dairies producing more than 5 million pounds of milk per month (up from 201 dairies in 2013).
Range ofMilk Marketings
Number ofGrade A & B Farms
Percent of Total Grade A & B
Farms
Percent of Total Grade A & B
Milk Marketings
> 5.0 Million Lbs. 203 13.85% 41.80%
2.4 to 4.9 Million Lbs. 333 22.71% 31.24%
1.5 to 2.3 Million Lbs. 275 18.76% 14.20%
1 to 1.4 Million Lbs. 188 12.82% 6.25%
750,000 to 999,999 Lbs. 121 8.25% 2.85%
500,000 to 749,999 Lbs. 108 7.37% 1.82%
250,000 to 499,999 Lbs. 143 9.75% 1.47%
< 249,999 Lbs. 95 6.48% 0.37%
Volume 18 Issue 9 September 2014
The California Department of Food and Agriculture (CDFA) has cooperated with the livestock industry and the U.S. Department of Agriculture's (USDA) Animal and Plant Health Inspection Service (APHIS) since 1934 to eradicate brucellosis. California obtained brucellosis-free status in 1997. By 2007, the national eradication program had achieved an all-time low national herd prevalence of less than 0.0001 percent and since July 2009 the USDA has designated all fifty states as Class Free for bovine brucellosis. Despite recent detections of infection in livestock in the Greater Yellowstone Area (GYA) states of Idaho, Montana and Wyoming, where the disease is endemic in wild elk and bison, all three states remain Class Free. The national surveillance plan changed in 2009 to direct resources to the challenges from brucellosis in wildlife and eliminated funding for the brucellosis milk ring test (BRT) program and for brucellosis testing at saleyards and reduced slaughter surveillance.
End of the Brucellosis Milk Surveillance Program in CaliforniaFrom Dr. Annette Jones, D.V.M., State Veterinarian and Director
California maintained a BRT program through July 2014, testing milk samples from all commercial dairies twice a year. It has been over 22 years since the last dairy herd was detected with brucellosis in California using the BRT. Ensuring the collection of fresh milk samples representing every milking cow from every dairy has become difficult and costly due to California’s large dairies and complex marketing strategies, and it has been determined that CDFA’s resources could be better utilized in other activities.
As of August 1, 2014 we are ceasing the brucellosis milk surveillance program and will rely on slaughter surveillance, private tests, and the examination of aborted fetuses and samples from aborting cattle submitted to the laboratory to detect infection and meet the national surveillance goals to maintain brucellosis-free status.

2 California Dairy ReviewSource: The Hoyt Report, Inc.
California Alfalfa Hay Monthly Weighted Average Prices − Delivered
Hundredweight Prices Class July Aug. Sept. 1 No. Calif. $25.13 $25.28 $25.39 So. Calif $25.40 $25.55 $25.66 2 No. Calif. $23.22 $23.74 $23.74 So. Calif. $23.45 $23.97 $23.97 3 $23.22 $23.69 $23.69 4a $23.58 N/A N/A 4b $18.69 N/A N/A
Pool Price May June JulyQuota $22.77 $22.75 $22.53Overbase $21.07 $21.05 $20.83
Quota Transfers June July Aug.
Number of Sellers 1 3 2Pounds of SNF Quota Transferred 1,974 11,061 275Average Price Per Pound of SNF Quota $525 $519 $538
California Minimum Class Prices California Pool Prices
Quota Transfer Summary
California Milk ProductionAverage Daily Basis: 2012, 2013, 2014
California Milk Production Cost Comparison, by Region, 2013-2014
Week Ending Aug. 1, 2014 Aug. 8, 2014 Aug. 15, 2014 Aug. 22, 2014
Delivered Tons Price Range Tons Price Range Tons Price Range Tons Price Range
Tulare, Hanford Areas
Supreme 2,575 $350-$365 350 $350-$355 600 $350-$360 200 $350
Premium 2,485 $338-$350 150 $330-$345 1,300 $330-$355 1,760 $310-$340
Good 7,570 $290-$320 350 $280-$315 7,350 $280-$320 2,863 $275-$300
Fair 6,525 $250-$280 7,825 $235-$260 5,175 $235-$255 8,225 $235-$250
Escalon, Modesto, Turlock Areas
Supreme 1,040 $350-$365 1,100 $350-$372 1,305 $350-$355 1,000 $345-$355
Premium 540 $330-$350 185 $335-$350 400 $325-$330 1,750 $305-$335
Good 500 $280-$300 250 $265 0 No Sales 1,300 $255-$280
Fair 3,750 $240-$270 2,700 $230-$260 1,750 $230-$250 3,400 $225-$240
*Includes an allowance for management and a return on investment.
100
105
110
115
120
125
1 2 3 4 5 6 7 8 9 10 11 12
In M
illio
n Po
unds
CALIFORNIA MILK PRODUCTION Average Daily Basis 2012, 2013, 2014
2012 2013 2014February 2012 Milk Production included 29 days.
2013 2014 2013 2014 2013 2014 2013 2014 2013 2014
1st Quarter Total Costs $24.44 $24.89 $17.64 $16.73 $17.57 $16.19 $16.96 $16.11 $17.69 $16.56 Total Costs & Allowances* $26.14 $26.92 $19.08 $18.38 $19.06 $17.84 $18.38 $17.76 $19.16 $18.22
Quarter
North North South Southern StatewideCoast Valley Valley California Weighted Average
Dollars per Hundredweight

Milk Production
Monthly: USDA estimates overall milk production across the U.S. increased 3.9% in July 2014, compared to July 2013. USDA reports that California milk production increased 4.4% compared to July 2013 (on 2,000 less cows and 85 more pounds of milk per cow). Among other western states, compared to July 2013, Arizona was up 8.9%; New Mexico was down 0.1%; and Washington was up 2.9%. Two of the top 10 milk producing states reported a production decrease. The largest increase was reported by Arizona at 8.9% growth in milk production (on 5,000 more cows and 115 more pounds of milk per cow).
Quarterly: For the second quarter of 2014 compared to the first quarter of 2014, U.S. milk cow numbers increased to 9.253 million head, milk production per cow increased to 5,708 pounds; the net effect was milk production increased to 52.8 billion pounds. USDA projects that for the third quarter of 2014 compared to the second quarter of 2014, milk cow numbers will increase to 9.275 million head, production per cow will decrease to 5,495 pounds, the net effect would be a decrease in milk production to 51.0 billion pounds. Milk PricesComparing the second quarter of 2014 to the first quarter of 2014, U.S. average all-milk prices decreased to $24.23/cwt. USDA projects that for the third quarter of 2014, U.S. average all-milk prices will be $23.60-23.90/cwt.; Class III prices will be $21.00-21.30/cwt.; and Class IV prices will be $22.95-$23.35/cwt.
Utility Cow PricesComparing the second quarter of 2014 to the first quarter of 2014, average U.S. utility cow prices were up $9.45/cwt. to a national average of $98.57/cwt. USDA projects that utility cow prices will average $101-$105/cwt. in the third quarter of 2014.
Top Ten Milk Production States - July 2014(Percent Change from Same Month/Previous Year)
1. California +4.4% 6. Texas +5.5%
2. Wisconsin +3.4% 7. Michigan +8.2%
3. Idaho +4.0% 8. Minnesota -0.1%
4. New York +4.8% 9. New Mexico -0.1%
5. Pennsylvania +3.0% 10. Washington +2.9%
California Dairy Review 3
Source: USDA, Farm Services Agency, NASS Cold Storage and Dairy Products. (As published in the Dairy Market News)
1 Region 9 includes AZ, CA, HI and NV2 West region includes AZ, NV, UT, CA, ID, OR and WA
Source: USDA Market News: Report LM_CT168 and SJ_LS714
Hundredweight PricesClass I July Aug. Sept.Phoenix, Arizona $25.37 $26.22 $25.98Portland, Oregon $24.76 $24.92 $25.53Boston (Northeast) $26.11 $26.27 $26.88
Class III $21.60 N/A N/A
USDA reports that the milk-feed price ratio for July 2014 was 2.44 (up from 2.20 in June 2014). The current ratio of 2.44 means that a dairy producer can buy 2.44 pounds of feed for every pound of milk sold. The prices used to calculate the July 2014 milk-feed price ratio were: corn $3.80/bushel; soybeans $12.70/bushel; baled alfalfa hay $216/ton; all-milk price $23.40/cwt. (increased from $23.20 in June 2014).
Prices used to calculate the milk-feed price ratio are based on U.S. prices and don’t necessarily reflect California prices.
Federal Order Minimum Class Prices
USDA Milk-Feed Price Ratio
USDA Dairy Cow Culling Activity
National Dairy Situation & OutlookUSDA Estimates
USDA Commercial Cold Storage Report
Information from the USDA-NASS publication “Milk Production” and the USDA-ERS publication: “Livestock, Dairy, and Poultry Outlook.”
Month
Butter American Cheese Nonfat Dry Milk
2013 2014 2013 2014 2013 2014
In Million Pounds
January 207 138 644 631 249 149
February 240 164 667 628 225 182
March 255 180 680 639 218 214
April 310 174 699 648 208 239
May 321 193 714 656 227 221
June 319 186 711 655 230 229
July 296 170 705 660 207 -
August 269 670 194
September 233 661 147
October 182 626 111
November 121 616 114
December 112 618 133
WeekEnding
Region 9 1
Dairy CowsU.S. Dairy
CowsWest Region 2
Price Range
Head Head $/cwt.
07/18/14 12,300 53,100 $96-$115
07/25/14 12,600 52,600 $87-$119
08/01/14 12,500 50,200 $93-$109
08/08/14 13,300 53,300 $94-$120

California Department of Food and AgricultureKaren Ross, Secretary
Dairy Marketing Branch1220 N Street
Sacramento, CA 95814
The California Department of Food and Agriculture Dairy Marketing Branch
publishes the California Dairy Review monthly. Please direct any comments or subscription requests to Karen Dapper or
Lu Tang at (916) 900-5014, or send an email to [email protected]
Milk Pricing Information:800-503-3490 or 916-442-MILK
Dairy Marketing Branch:Phone (916) 900-5014; Fax (916) 900-5341
Website: www.cdfa.ca.gov/dairyEmail: [email protected]
If you would like to receive an email notification when this publication is posted to the website, please go to: www.cdfa.ca.gov/dairy and click on to subscribe to the Dairy Marketing Branch Email Notifications.
Milk Mailbox Prices in Dollars per Hundredweight - 2014
California mailbox price calculated by CDFA Dairy Marketing BranchAll federal milk market order weighted average, as calculated by USDA.
Reporting Areas Jan Feb March April May June July Aug Sept Oct Nov Dec
California $22.04 $22.67 $23.36 $23.13 $21.72New England States $24.68 $25.94 $26.30 $26.41 $25.91New York $23.64 $25.06 $25.58 $25.66 $25.16Eastern Pennsylvania $23.75 $25.10 $25.48 $25.58 $25.12Appalachian States $24.59 $25.41 $25.96 $25.78 $25.77Southeast States $24.62 $25.69 $26.10 $25.83 $26.12Southern Missouri $23.69 $24.57 $24.92 $24.64 $24.63Florida $25.33 $26.77 $27.27 $27.13 $27.41Western Pennsylvania $23.69 $25.20 $25.61 $25.77 $24.87Ohio $23.68 $24.92 $25.24 $25.38 $24.45Indiana $23.03 $24.22 $24.46 $24.51 $23.87Michigan $22.94 $24.28 $24.62 $24.66 $23.90Wisconsin $23.51 $25.31 $25.34 $25.91 $24.38Minnesota $23.48 $25.48 $25.43 $26.06 $24.47Iowa $23.84 $25.44 $25.75 $25.97 $24.83Illinois $23.75 $25.50 $25.61 $25.81 $24.80Corn Belt States $22.77 $24.24 $24.39 $24.51 $23.32Western Texas $22.73 $24.31 $24.32 $24.42 $22.96New Mexico $21.53 $22.90 $22.96 $22.94 $21.77Northwest States $23.73 $24.63 $25.36 $24.97 $23.85All Federal Order Areas $23.47 $24.91 $25.18 $25.33 $24.37
*Mailbox milk prices for selected Milk Marketing Orders by month, 2014
2014 Mailbox Milk Prices
Dollars Per Hundredweight