Voltage-sensitive dye imaging of population neuronal activity in
15
Journal of Neuroscience Methods 115 (2002) 13 – 27 Voltage-sensitive dye imaging of population neuronal activity in cortical tissue Wenjun Jin a,b , Ren-Ji Zhang b , Jian-young Wu a, * a Department of Physiology and Biophysics, Georgetown Uniersity Medical Center, The Research Building, WP-26, 3900 Reseroir Road NW, Washington, DC 20007, USA b Department of Physiology and Biophysics, Life Science College, Peking Uniersity, Beijing 100871, People’s Republic of China Received 16 August 2001; received in revised form 16 November 2001; accepted 16 November 2001 Abstract Voltage-sensitive dyes (VSDs) and optical imaging are useful for studying spatiotemporal patterns of population neuronal activity in cortical tissue. Using a photodiode array and absorption dyes we were able to detect neuronal activity in single trials before it could be detected by local field potential (LFP) recordings. Simultaneous electrical and optical recordings from the same tissue also showed that VSD and LFP signals have different waveforms during different activities, suggesting that they are sensitive to different aspects of the synchronization across the population. Noise, dye bleaching, phototoxicity and optical filter selection are important to the quality of the VSD signal and are discussed in this report. With optimized signal-to-noise ratio (S/N) and total recording time, we can optically monitor approximately 500 locations in an area of 1 mm 2 of cortical tissue with a sensitivity comparable to that of LFP electrodes. The total recording time and S/N of fluorescence and absorption dyes are also compared. At S/N of 8–10, absorption dye NK3630 allows a total recording time of 15–30 min, which can be divided into hundreds of 4–8 s recording trials over several hours, long enough for many kinds of experiments. In conclusion, the VSD method provides a reliable way for examining neuronal activity and pharmacological properties of synapses in brain slices. © 2002 Elsevier Science B.V. All rights reserved. Keywords: Optical recordings; Brain slice; Rat; Somatosensory cortex; Auditory cortex; Amygdaloid; Diode array; CCD camera www.elsevier.com/locate/jneumeth 1. Introduction Voltage-sensitive dye (VSD) imaging, an optical method of measuring transmembrane potential, has been undergoing development since the pioneering work published about 30 years ago (Cohen et al., 1968; Tasaki et al., 1968). With better dyes and specialized apparatus, the method has gradually evolved from tech- nological demonstrations into a practical tool for imag- ing the activity of excitable tissues. After screening thousands of compounds (Gupta et al., 1981; Grinvald et al., 1982a; Loew et al., 1992; Shoham et al., 1999), a dozen were found useful, and a number of them became commercially available. These dyes have very fast response times ( 1 us) and excel- lent linearity ( 300 mV, Ross et al., 1977), but all have small fractional changes in absorption or fluores- cence. In biological tissues the fractional changes are only about 10 −2 –10 −5 of the resting light intensity (RLI) per 100 mV of membrane potential change. In the past 10 years or so, new dyes based on fluorescence resonance energy transfer (FRET) have been developed which have the potential to yield much larger signals ( 10 0 –10 1 ) (Cacciatore et al., 1999). However, these dyes are still too slow to follow action potentials (Taylor et al., 2000) and the methods for loading dyes into biological tissue need to be improved before they can be used for most of the applications. Before the new FRET dyes become available, all VSD measurements are forced to use the old dyes with small fractional changes. However, a small fractional change does not always imply a poor signal-to-noise ratio. In this report we show that in brain slice prepara- tions it is possible to reduce noise and achieve a decent signal-to-noise ratio (5 – 30) in single recording trials. * Corresponding author. Tel.: +1-202-687-1617; fax: +1-202-687- 0617. E-mail address: [email protected] (J.-y. Wu). 0165-0270/02/$ - see front matter © 2002 Elsevier Science B.V. All rights reserved. PII:S0165-0270(01)00511-8
Transcript of Voltage-sensitive dye imaging of population neuronal activity in
Journal of Neuroscience Methods 115 (2002) 13–27
Voltage-sensitive dye imaging of population neuronal activity incortical tissue
Wenjun Jin a,b, Ren-Ji Zhang b, Jian-young Wu a,*a Department of Physiology and Biophysics, Georgetown Uni�ersity Medical Center, The Research Building, WP-26, 3900 Reser�oir Road NW,
Washington, DC 20007, USAb Department of Physiology and Biophysics, Life Science College, Peking Uni�ersity, Beijing 100871, People’s Republic of China
Received 16 August 2001; received in revised form 16 November 2001; accepted 16 November 2001
Abstract
Voltage-sensitive dyes (VSDs) and optical imaging are useful for studying spatiotemporal patterns of population neuronalactivity in cortical tissue. Using a photodiode array and absorption dyes we were able to detect neuronal activity in single trialsbefore it could be detected by local field potential (LFP) recordings. Simultaneous electrical and optical recordings from the sametissue also showed that VSD and LFP signals have different waveforms during different activities, suggesting that they aresensitive to different aspects of the synchronization across the population. Noise, dye bleaching, phototoxicity and optical filterselection are important to the quality of the VSD signal and are discussed in this report. With optimized signal-to-noise ratio(S/N) and total recording time, we can optically monitor approximately 500 locations in an area of 1 mm2 of cortical tissue witha sensitivity comparable to that of LFP electrodes. The total recording time and S/N of fluorescence and absorption dyes are alsocompared. At S/N of 8–10, absorption dye NK3630 allows a total recording time of 15–30 min, which can be divided intohundreds of 4–8 s recording trials over several hours, long enough for many kinds of experiments. In conclusion, the VSD methodprovides a reliable way for examining neuronal activity and pharmacological properties of synapses in brain slices. © 2002Elsevier Science B.V. All rights reserved.
Keywords: Optical recordings; Brain slice; Rat; Somatosensory cortex; Auditory cortex; Amygdaloid; Diode array; CCD camera
www.elsevier.com/locate/jneumeth
1. Introduction
Voltage-sensitive dye (VSD) imaging, an opticalmethod of measuring transmembrane potential, hasbeen undergoing development since the pioneeringwork published about 30 years ago (Cohen et al., 1968;Tasaki et al., 1968). With better dyes and specializedapparatus, the method has gradually evolved from tech-nological demonstrations into a practical tool for imag-ing the activity of excitable tissues.
After screening thousands of compounds (Gupta etal., 1981; Grinvald et al., 1982a; Loew et al., 1992;Shoham et al., 1999), a dozen were found useful, and anumber of them became commercially available. Thesedyes have very fast response times (�1 us) and excel-lent linearity (�300 mV, Ross et al., 1977), but all
have small fractional changes in absorption or fluores-cence. In biological tissues the fractional changes areonly about 10−2–10−5 of the resting light intensity(RLI) per 100 mV of membrane potential change.
In the past 10 years or so, new dyes based onfluorescence resonance energy transfer (FRET) havebeen developed which have the potential to yield muchlarger signals (�100–101) (Cacciatore et al., 1999).However, these dyes are still too slow to follow actionpotentials (Taylor et al., 2000) and the methods forloading dyes into biological tissue need to be improvedbefore they can be used for most of the applications.
Before the new FRET dyes become available, allVSD measurements are forced to use the old dyes withsmall fractional changes. However, a small fractionalchange does not always imply a poor signal-to-noiseratio. In this report we show that in brain slice prepara-tions it is possible to reduce noise and achieve a decentsignal-to-noise ratio (5–30) in single recording trials.
* Corresponding author. Tel.: +1-202-687-1617; fax: +1-202-687-0617.
E-mail address: [email protected] (J.-y. Wu).
0165-0270/02/$ - see front matter © 2002 Elsevier Science B.V. All rights reserved.PII: S 0 1 6 5 -0270 (01 )00511 -8

W. Jin et al. / Journal of Neuroscience Methods 115 (2002) 13–2714
This signal-to-noise ratio would allow imaging of theinitiation and propagation of population activity with-out averaging, which is particularly useful for examin-ing the dynamics of population neuronal activities.
Cortical tissue is rich in neuropils and thus has arelatively large area of stained excitable membranes perunit volume. During population events cortical neuronsare usually activated in ensembles; the combined dyesignals from many neurons may be significantly larger.These factors make cortical tissue a preferred prepara-tion for VSD measurements.
Imaging with VSDs not only provides informationabout where the activity occurs and how it propagates,but also about the synchrony of the activity, i.e. thefraction of neurons activated in a population in a giventime bin.
Over the last 20 years many authors have publishedVSD imaging studies using brain slices (Grinvald et al.,1982b; Albowitz and Kuhnt, 1993; Colom and Saggau,1994; Tanifuji et al., 1994; Hirota et al., 1995; Tsau etal., 1998a, 1999; Demir et al., 1999, 2000; Laaris et al.,2000; Wu et al., 1999b, 2001, for reviews see Ebner andChen, 1995; Wu et al., 1999a), but most of the worksconcentrated on the scientific subject without discussingtechnical details for measuring small VSD signals. Tworecent papers by Momose-Sato et al. (1999), Tominagaet al. (2000) have described dyes and methods fordetecting larger (10−3–10−2) and averageable signalsin hippocampal slices. There is an increasing interest indetecting small (10−5–10−4) VSD signals in corticaltissue during oscillations and other population activities(Wu et al., 1999b, 2001). These signals are not synchro-nized to the stimulus and cannot be averaged. In thisreport we will discuss the optimized methods for detect-ing such small signals in single trials.
2. Methods
2.1. Preparation of cortical slices
Sprague–Dawley rats of both sexes from P14 to P35were used in the experiments. Following NIH guideli-nes, the animals were deeply anesthetized withhalothane and quickly decapitated using a Stoeltingsmall animal decapitator. The whole brain was chilledin cold (0–4 °C) artificial CSF [ACSF, containing (inmM) NaCl, 132; KCl, 3; CaCl2, 2; MgSO4, 2;NaH2PO4, 1.25; NaHCO3, 26; dextrose 10; and satu-rated with 95% O2, 5% CO2] for 90 s before slicing.Coronal slices (400 um thick) from somatosensory andauditory cortices were cut with a vibratome stage(752M Vibroslice, Campden Instruments, Sarasota, FL)and transferred to a holding chamber where the solu-tion was slowly bubbled by a mixture of 95% O2 and5% CO2. Slices were incubated for at least 1 h beforethe experiment.
2.2. Staining with �oltage-sensiti�e dye
The staining chamber contained about 50 ml ofACSF, bubbled with O2–CO2 gas and circulated by astirring bar. For absorption measurements the sliceswere stained with 0.005–0.02 mg/ml of an oxonol dye,NK3630 (first synthesized by R. Hildesheim and A.Grinvald as RH482; available from Nippon Kankoh-Shikiso Kenkyusho Co., Ltd., Japan), for 30–60 min.For fluorescence measurements the slices were stainedwith 0.01–0.05 mg/ml of fluorescent dye, RH 795 (firstsynthesized by R. Hildesheim and A. Grinvald; avail-able from Molecular Probes), for 45–60 min. Afterstaining the slices were transferred back to the holdingchamber (to rinse out excess dye) and held in thechamber until needed in the experiments.
2.3. Optical imaging apparatus and light intensity
VSD imaging was performed with a 124-elementphotodiode array (Centronics Inc., Newbury Park, CA)at a frame rate of 1000 frames per s. The array wasmounted on the ‘C’ mount of a fixed-stage microscope(Zeiss Axiophot). Objectives of 5× (0.12 NA, Zeiss),20× (0.6 NA, water immersion, Nikon) or 40× (0.75NA, water immersion, Zeiss) were used to project theimage of the preparation onto the array. Each photode-tector received light from an area of 0.33×0.33, 0.08×0.08, and 0.04×0.04 mm2 of tissue for the 5× , 20×and 40× objectives, respectively. The light source forthe optical recording was a 100 W halogen– tungstenfilament bulb. We use the term ‘illumination intensity’to describe the light intensity that the tissue receivesduring the imaging and RLI for the light intensityreaching the diode array. Usually the RLI is about1/100 to 1/10 000 of illumination intensity during ab-sorption and fluorescence measurements. In our experi-ments the RLI was about 109 photons per ms perdetector for absorption dyes and about 107 photons perms per detector for fluorescence measurement. Thephotocurrent from each photodetector was individuallyamplified through a two-stage amplifier system. Thefirst stage performed a current-to-voltage conversion.In our array the RLI was converted to a voltage ofabout 5 V. This voltage is also referred to as RLI in thisreport.
The VSD signal is a fractional change (0.001–0.1%)on a large DC component. When the RLI is �5 V, thefull range of the signal is only about 0.05–5 mV. A DCsubtraction/high-pass filter (1000 ms time constant or0.16 Hz corner frequency) circuit was used for eachindividual detector to eliminate the DC component (theentire RLI). The signal (dye related fractional changes)was then amplified 200–1000 times. This allowed thesmall fractional change (e.g. 10−4) to be digitized in thefull range of 12 bits. Before digitizing, a four-pole

W. Jin et al. / Journal of Neuroscience Methods 115 (2002) 13–27 15
Bessel analog low-pass filter with a 333 Hz cornerfrequency was applied to ensure that the frequency ofthe analog signal was lower than the Nyquest frequencyof the sampling. Signals were multiplexed and thendigitized with a 12-bit data acquisition board (Mi-crostar Laboratories, Bellevue, WA) installed in a com-puter (Pentium PC).
A commercial diode array system with similar perfor-mance and higher spatial resolution (464 photo ele-ments and eight electrical channels) is available fromWuTech Instruments, Gaithersburg, MD(www.wutech.com) as the 469III diode array system orthe NEUROPLEX II package (together with NEUROPLEX
software) from RedShirtImaging, LLC, Fairfield, CT(www.RedShirtImaging.com). Additional details aboutthe diode array circuits and noise consideration werediscussed in Wu and Cohen (1993) and Wu et al.(1999a).
2.4. Local field potential recordings
Tungsten lacquer-coated microelectrodes (FHC,Bowdoinham, ME) were used to simultaneously samplelocal field potentials (LFP). The tip resistance of theelectrodes ranged from 75 to 200 K-ohm. In order tominimize the damage to the cortical tissue the elec-trodes were carefully inserted about 100 �m into theslice in cortical layers II–III. With careful placement ofthe LFP electrode the tissue surrounding it producednormal VSD signals, which is important for comparingelectrical and optical signals. Electrical recordings weredigitized and stored concurrently with the optical im-ages. The LFP signals were amplified 1000× andbandpass filtered at 0.1–400 Hz (by a Brownlee Preci-sion 440 amplifier) and digitized concurrently with VSDsignals.
2.5. Vibration isolation
During absorption measurements photodetectors re-ceive high intensity light and, therefore, are extremelysensitive to vibration noise. A standard air table isusually not sufficient for isolating the floor noise. Wefound that the ‘Minus K’ isolation stage(www.minusk.com) is excellent in isolating low fre-quency floor vibrations. At 5 Hz the amplitude of thevibration on this table was about 1/10 of that on an airtable from Newport. Vibration noise will be discussedin Section 3.3.
2.6. Data analysis and display
The optical data were analyzed using the programNEUROPLEX (A. Cohen, C. Falk and L.B. Cohen, Red-ShirtImaging, LLC). Data were displayed in the formof traces for numerical analysis and pseudocolor images
for visualizing the spatiotemporal patterns. An exampleof data display is illustrated in Fig. 1, where the wave-forms from the LFP electrode and one optical detectorviewing the same location are shown in Fig. 1A. In Fig.1C the spatiotemporal pattern of the activity is pre-sented by means of pseudocolor maps (Senseman et al.,1999). To compose a pseudocolor map, signals fromeach individual detector are normalized to their ownmaximum amplitude (peak=1 and baseline/negativepeak=0). Then a scale of 16 colors are linearly as-signed to the values between 0 and 1. In this paperpseudocolor maps are displayed as ‘contour’ maps us-ing the CONTOUR function provided by IDL (Interac-tive Display Language, Research Systems Inc., Boulder,CO) and used by NEUROPLEX.
In Fig. 1c only a few VSD images (1 ms snapshots)selected from a total of 2000 images (a 2 s recordingtrial at 1 frame per ms) are shown. The times of theimages are marked as points a– f in Fig. 1A, withreference to the LFP signal. The interictal-like spikewas initiated at the stimulation point in the deep layersand propagated vertically and then horizontally as awave. In this example imaging the activity in a singletrial (without averaging) is important, because the ini-tiation and propagation of the activity varies signifi-cantly from trial to trial (Tsau et al., 1998a).
Throughout this paper the signal-to-noise ratio isdefined as the amplitude of the VSD signal divided bythe root mean square (RMS) value of the baselinenoise.
3. Results and discussion
3.1. Comparison of dye signals and local field potential
Although LFP and VSD recordings, both monitorthe neuronal population activity, the sources of thesignals are different. The amplitude of LFP signal isproportional to the current density near the tip of theelectrode while VSD measures the transmembrane po-tential. Thus the waveforms of the two measurementsfrom the same cortical tissue may be significantly differ-ent during some activities.
3.1.1. Wa�eformWhen a single neuron was simultaneously measured
by VSD imaging and an intracellular electrode, thewaveforms of the two recordings were remarkably sim-ilar (Ross et al., 1977; Zecevic, 1996; Fig. 2A). How-ever, this remarkable similarity only occurs when asingle neuron is measured intracellularly. During popu-lation activities the VSD waveform follows the sum ofthe transmembrane potential of all stained membranesunder one detector, and thus may be very differentfrom either the individual neuron’s intracellular poten-

W. Jin et al. / Journal of Neuroscience Methods 115 (2002) 13–2716
Fig
.1.
An
exam
ple
ofdi
spla
ying
VSD
data
.(A
)T
race
disp
lay.
VSD
sign
als
are
disp
laye
din
com
pari
son
wit
ha
sim
ulta
neou
sel
ectr
ical
reco
rdin
g(L
FP
)fr
omth
esa
me
loca
tion
(cor
tica
lla
yer
II–
III)
duri
ngan
evok
edin
teri
ctal
-lik
esp
ike.
The
prep
arat
ion
was
aco
rona
lsl
ice
stai
ned
wit
hN
K36
30,
and
perf
used
wit
h1
�Mbi
cucu
lline
.B
oth
trac
esar
eun
filte
red
data
ofa
sing
letr
ial.
(B)
Loc
atio
nm
ap.
The
rela
tive
loca
tion
sof
prep
arat
ion,
field
ofvi
ewan
dth
est
imul
atio
n-re
cord
ing
arra
ngem
ent
are
sket
ched
.St
im,
stim
ulat
ion
elec
trod
e;L
FP
,lo
cal
field
reco
rdin
gel
ectr
ode.
The
smal
lsq
uare
arou
ndth
eL
FP
elec
trod
eis
the
loca
tion
ofth
eop
tica
lde
tect
orw
hose
sign
alis
show
nin
A.
Hip
p,hi
ppoc
ampu
s;R
f,R
hina
lF
issu
re.
(C)
Pse
udoc
olor
imag
es.
Thi
ski
ndof
disp
lay
show
sth
esp
atio
tem
pora
ldi
stri
buti
onof
the
popu
lati
onac
tivi
ty.
Inth
isex
ampl
esi
xsn
apsh
ot(1
ms)
imag
esw
ere
sele
cted
from
2000
imag
es.
The
snap
shot
sw
ere
take
nat
the
tim
esla
bele
das
ath
roug
hf
inA
.
W. Jin et al. / Journal of Neuroscience Methods 115 (2002) 13–27 17
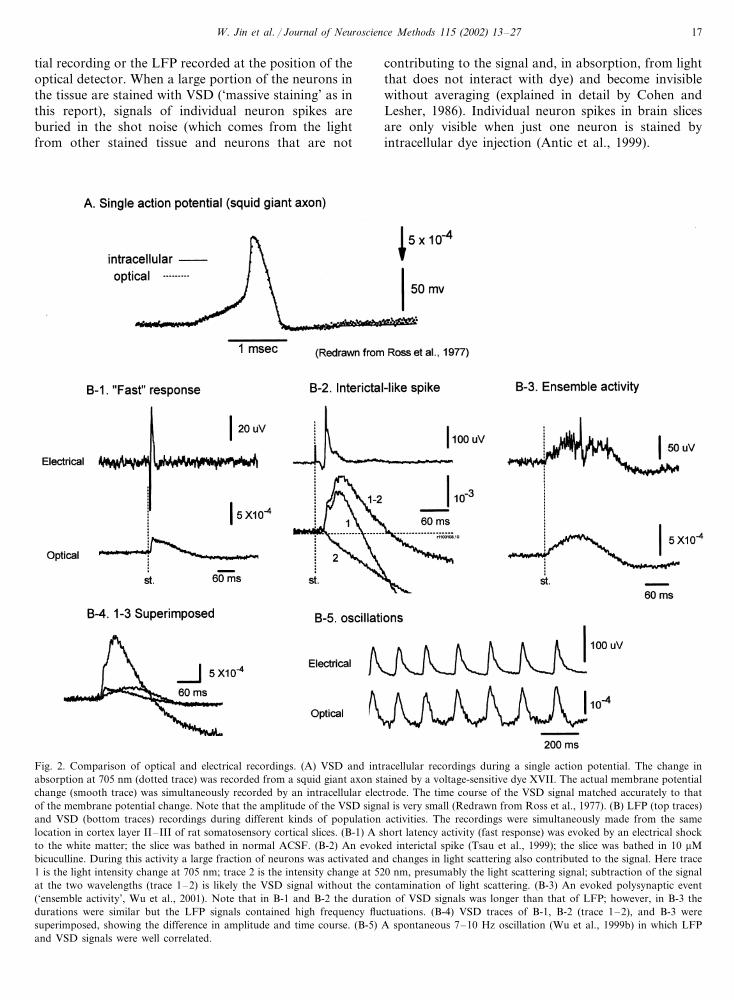
tial recording or the LFP recorded at the position of theoptical detector. When a large portion of the neurons inthe tissue are stained with VSD (‘massive staining’ as inthis report), signals of individual neuron spikes areburied in the shot noise (which comes from the lightfrom other stained tissue and neurons that are not
contributing to the signal and, in absorption, from lightthat does not interact with dye) and become invisiblewithout averaging (explained in detail by Cohen andLesher, 1986). Individual neuron spikes in brain slicesare only visible when just one neuron is stained byintracellular dye injection (Antic et al., 1999).
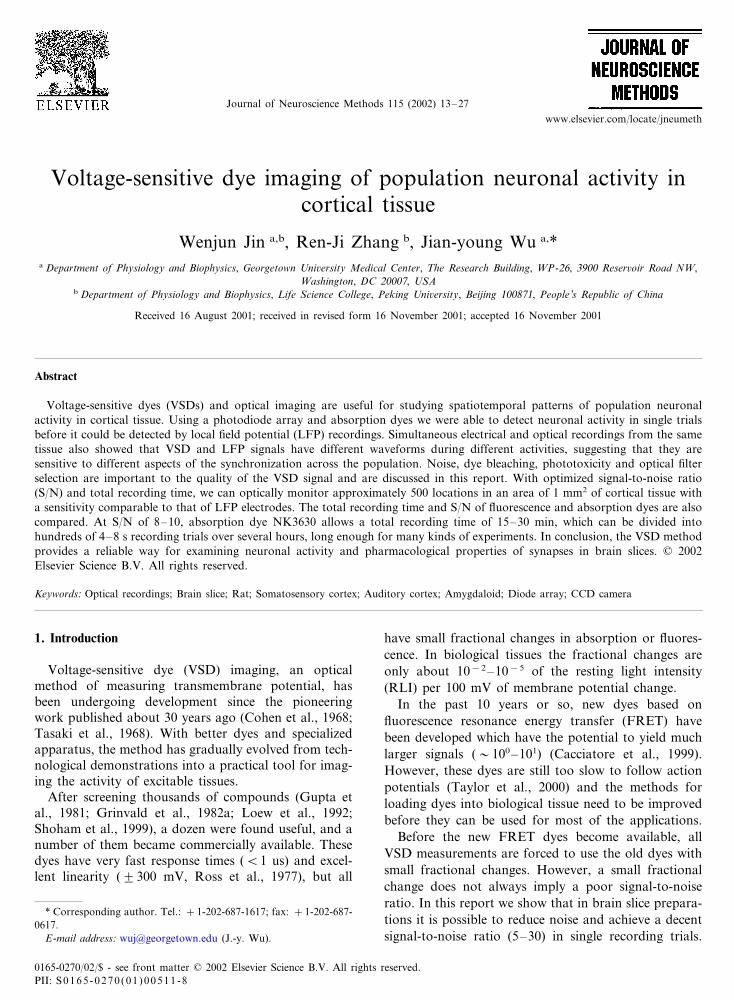
Fig. 2. Comparison of optical and electrical recordings. (A) VSD and intracellular recordings during a single action potential. The change inabsorption at 705 nm (dotted trace) was recorded from a squid giant axon stained by a voltage-sensitive dye XVII. The actual membrane potentialchange (smooth trace) was simultaneously recorded by an intracellular electrode. The time course of the VSD signal matched accurately to thatof the membrane potential change. Note that the amplitude of the VSD signal is very small (Redrawn from Ross et al., 1977). (B) LFP (top traces)and VSD (bottom traces) recordings during different kinds of population activities. The recordings were simultaneously made from the samelocation in cortex layer II–III of rat somatosensory cortical slices. (B-1) A short latency activity (fast response) was evoked by an electrical shockto the white matter; the slice was bathed in normal ACSF. (B-2) An evoked interictal spike (Tsau et al., 1999); the slice was bathed in 10 �Mbicuculline. During this activity a large fraction of neurons was activated and changes in light scattering also contributed to the signal. Here trace1 is the light intensity change at 705 nm; trace 2 is the intensity change at 520 nm, presumably the light scattering signal; subtraction of the signalat the two wavelengths (trace 1–2) is likely the VSD signal without the contamination of light scattering. (B-3) An evoked polysynaptic event(‘ensemble activity’, Wu et al., 2001). Note that in B-1 and B-2 the duration of VSD signals was longer than that of LFP; however, in B-3 thedurations were similar but the LFP signals contained high frequency fluctuations. (B-4) VSD traces of B-1, B-2 (trace 1–2), and B-3 weresuperimposed, showing the difference in amplitude and time course. (B-5) A spontaneous 7–10 Hz oscillation (Wu et al., 1999b) in which LFPand VSD signals were well correlated.

W. Jin et al. / Journal of Neuroscience Methods 115 (2002) 13–2718
Fig. 2B compares the waveforms of LFP (top traces)and VSD (bottom traces) recordings during four differ-ent forms of population activity. Fig. 2B-1 shows ashort latency (‘Fast’) response to an electrical stimulusto the white matter (slice bathed in normal ACSF).This response had a short latency and the amplitude ofVSD signal was proportional to the stimulus intensity.Presumably the response was mainly contributed byneurons activated either directly by the stimulus or viaa few synapses. The LFP response had a short duration(�30 ms) but the VSD signal from the tissue surround-ing the electrode had a much longer duration. This longoptical signal did not appear at 520 nm, indicating thatit was a wavelength dependent VSD signal, instead of awavelength independent signal resulting from light scat-tering or other intrinsic signals (Pazdalski et al., 1998).The long duration of the VSD signals suggests thatafter the initial phase of the fast response there was anasynchronized firing period which was not detectableby the LFP, probably because during the asynchronizedspiking period depolarizing and repolarizing currentscanceled each other out or because current flows maybe briefer than the potential elevation. Dye moleculesbound to the glial cells may also contribute to this longperiod due to glial membrane potential change causedby glutamate transporters (Kojima et al., 1999; Mo-mose-Sato et al., 1999).
Fig. 2B-2 shows optical and electrical signals from aninterictal-like spike (slice bathed in 10 uM bicuculline)evoked by a weak electrical shock to the white matter,measured in cortical layers II–III. Interictal-like spikesare all-or-none population events; the amplitude of thedye signal is relatively large and independent from thestimulus intensity. Again VSD signals had a long dura-tion with a smooth waveform while LFP signals had ashort duration and large fluctuations. VSD signal dur-ing an interictal-like spike had an obvious undershoot(move downward below the baseline after the positivepeak). Part of this undershoot also occurred at 520 nm(Fig. 2B-2, trace I), suggesting that it was caused bylight scattering signal. The sign of the light scatteringsignal under trans-illumination was opposite that of theVSD signal of NK3630 at 705 nm. Light scattering alsohad a slow onset (a tau of �100 ms) and the amplitudewas linearly proportional to the portion of the neuronsbeing activated (Pazdalski et al., 1998).
Fig. 2B-3 shows another evoked population activity,‘ensemble activity’ (slice bathed in normal ACSF, Wuet al., 2001). This activity is also an all-or-none popula-tion event but the VSD signal amplitude is only about1/10–1/4 of that of the interictal-like spikes (Fig. 2B-2).This indicates that this activity contains a much lowerdensity of active neurons than do interictal-like spikes.Interestingly, during this activity the duration of VSDand LFP signals were similar. However, LFP signalscontained complex fluctuations (Wu et al., 2001) whileVSD signals had a smooth waveform.
In Fig. 2B-4 the waveform of VSD signals during thethree population events shown in Fig. 2B1-3 are plottedin superimposed traces, illustrating the differences inamplitude and time course. If the neurons are evenlystained, the amplitude of the VSD signal should belinear to the synchrony of the activity and the areaunder the waveform envelope should be linear to thenumber of total spikes during the event. Fig. 2B-4suggests that the synchrony and duration during differ-ent cortical events are two independent variables.Higher synchrony (larger portion of neurons depolarizein each time bin) is not always accompanied by longerduration.
Fig. 2B-5 shows another example of VSD-LFP wave-forms of a population event. During a spontaneousoscillation (cortical slice bathed in low Mg media)—VSD and LFP signals had very similar waveforms andsimilar frequency compositions (Wu et al., 1999b).
These comparisons suggest that the difference be-tween VSD and LFP waveforms is related to the natureof the population activity in the cortical neural net-work. The VSD signals are linearly correlated to thepotential changes of all the membranes under onedetector. LFP signals, on the other hand, are a non-lin-ear summation of the current sources distributedaround the tip of the electrode. LFP amplitude de-creases with the square of the distance between thesource and the electrode. Thus, in this situation theLFP signal is likely to report localized activity sur-rounding its tip, although LFP recordings can also besensitive to the strong current flow far away from theelectrode.
3.1.2. Sensiti�itySensitivity of VSD measurement is important for
detecting small population activities. Here the detectingability of VSD measurements was compared with thatof a LFP electrode from the same tissue (Fig. 3).
A neocortical slice (rat barrel cortex) was stained byNK3630 and cortical layer II–III was monitored opti-cally. A LFP electrode was placed in the tissue at thesame location as the optical measurement. Electricalstimulation was delivered to the deep layers of thecortex and evoked a ‘fast’ response. In one slice, whenthe stimulus intensity was about 12% of the intensitythat generated maximum VSD signal (the saturationintensity), the fast response was seen in both LFP andVSD recordings (Fig. 3A). When the stimulus intensitywas reduced to 9% of the saturation intensity, theresponse on the LFP could not be detected (below‘threshold’), but the VSD trace still showed a reliableresponse in every single trial (Fig. 3B). In cortical tissuethe main power of the VSD signal was below 50 Hz inall four population events we have examined (Fig. 2B).Thus a proper low-pass filter could further improve thesignal-to-noise ratio. The bottom traces in Fig. 3A and

W. Jin et al. / Journal of Neuroscience Methods 115 (2002) 13–27 19
Fig. 3. Sensitivity of VSD and LFP measurements. VSD and LFP signals during the fast response were recorded from the same location in layerII–III. (A) At 12% of the stimulation intensity which generated a maximum response, the fast response was visible in both LFP and VSD signals.(B) With the stimulus reduced to 9% of the maximum intensity, only VSD response was visible. The bottom trace of panels A and B are the VSDsignal filtered at 50 Hz, showing an improved signal-to-noise ratio. (C) A stimulus–response curve showing that VSD measurement is moresensitive than LFP recordings from the same tissue. (D) In four different slices VSD measurements always had higher sensitivity than the LFPelectrode.
B are the same data as the middle traces but low-passfiltered at 50 Hz, resulting in an improved signal-to-noise ratio. This data suggests that VSD measurementin brain slice is more sensitive than the LFP in detect-ing small population activity.
Stimulus–response curves made with both sub- andsuper-threshold stimuli (Fig. 3C) further confirmed thesensitivity of VSD measurement. Fig. 3D shows thedetecting threshold in four slices tested. Although thethresholds for VSD and LFP measurements were differ-ent in different slices, VSD measurement always had ahigher detecting sensitivity than the LFP electrode.
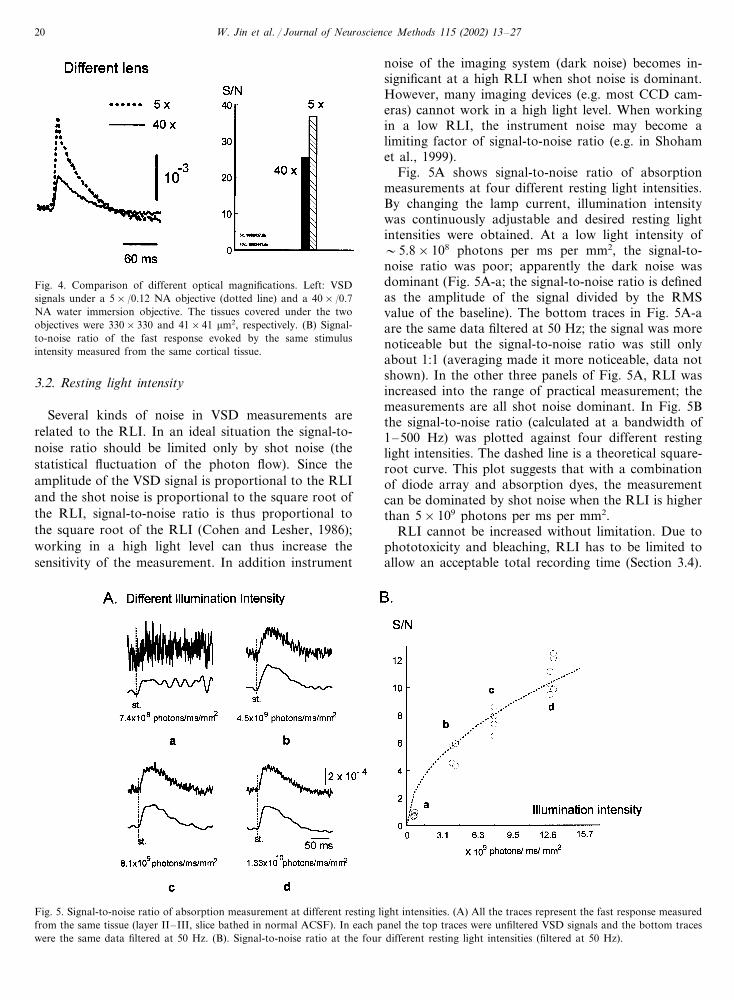
Using objectives with larger optical magnificationreduces the volume of tissue covered by each photode-tector. When a 40× objective was used, each photode-
tector was measuring 40×40 �m2 of cortical tissue, andthe signal-to-noise ratio was reduced to about 60% ofthat obtained when using a 5× objective (Fig. 4). Acomparison of the data in Figs. 3 and 4 suggests thateven with a high spatial resolution (40× magnification)the sensitivity of the optical measurement would still becomparable to that of LFP measurement.
The sensitivity comparison suggests that VSD imag-ing is useful for simultaneously measuring hundreds oflocations on a brain slice to examine the initiation andpropagation of population activities. Data in Figs. 3and 4 indicate that it is practical to record �500locations in an area of �1 mm in diameter (40×40�m2 per detector), with a sensitivity similar to that of aLFP electrode.
W. Jin et al. / Journal of Neuroscience Methods 115 (2002) 13–2720
Fig. 4. Comparison of different optical magnifications. Left: VSDsignals under a 5×/0.12 NA objective (dotted line) and a 40×/0.7NA water immersion objective. The tissues covered under the twoobjectives were 330×330 and 41×41 �m2, respectively. (B) Signal-to-noise ratio of the fast response evoked by the same stimulusintensity measured from the same cortical tissue.
noise of the imaging system (dark noise) becomes in-significant at a high RLI when shot noise is dominant.However, many imaging devices (e.g. most CCD cam-eras) cannot work in a high light level. When workingin a low RLI, the instrument noise may become alimiting factor of signal-to-noise ratio (e.g. in Shohamet al., 1999).
Fig. 5A shows signal-to-noise ratio of absorptionmeasurements at four different resting light intensities.By changing the lamp current, illumination intensitywas continuously adjustable and desired resting lightintensities were obtained. At a low light intensity of�5.8×10⁸ photons per ms per mm2, the signal-to-noise ratio was poor; apparently the dark noise wasdominant (Fig. 5A-a; the signal-to-noise ratio is definedas the amplitude of the signal divided by the RMSvalue of the baseline). The bottom traces in Fig. 5A-aare the same data filtered at 50 Hz; the signal was morenoticeable but the signal-to-noise ratio was still onlyabout 1:1 (averaging made it more noticeable, data notshown). In the other three panels of Fig. 5A, RLI wasincreased into the range of practical measurement; themeasurements are all shot noise dominant. In Fig. 5Bthe signal-to-noise ratio (calculated at a bandwidth of1–500 Hz) was plotted against four different restinglight intensities. The dashed line is a theoretical square-root curve. This plot suggests that with a combinationof diode array and absorption dyes, the measurementcan be dominated by shot noise when the RLI is higherthan 5×10⁹ photons per ms per mm2.
RLI cannot be increased without limitation. Due tophototoxicity and bleaching, RLI has to be limited toallow an acceptable total recording time (Section 3.4).
3.2. Resting light intensity
Several kinds of noise in VSD measurements arerelated to the RLI. In an ideal situation the signal-to-noise ratio should be limited only by shot noise (thestatistical fluctuation of the photon flow). Since theamplitude of the VSD signal is proportional to the RLIand the shot noise is proportional to the square root ofthe RLI, signal-to-noise ratio is thus proportional tothe square root of the RLI (Cohen and Lesher, 1986);working in a high light level can thus increase thesensitivity of the measurement. In addition instrument
Fig. 5. Signal-to-noise ratio of absorption measurement at different resting light intensities. (A) All the traces represent the fast response measuredfrom the same tissue (layer II–III, slice bathed in normal ACSF). In each panel the top traces were unfiltered VSD signals and the bottom traceswere the same data filtered at 50 Hz. (B). Signal-to-noise ratio at the four different resting light intensities (filtered at 50 Hz).

W. Jin et al. / Journal of Neuroscience Methods 115 (2002) 13–27 21
Fig. 6. Dye bleaching and total recording time. (A) Reduction of VSD signal due to light exposure. The slice was stained with NK3630 andexposed to an illumination intensity of 5×10¹¹ photons per ms per mm2 (RLI was �1010 photons per ms per mm2).The exposures were 2 mintrials with 2 min intermittent dark periods. The reduction of the optical signal was likely due to bleaching of the dye molecules on the membrane.(B) The total recording time was defined as the exposure time needed for the VSD signals to decrease to 50% of the pre-exposure amplitude. Theplot was composed of data from �25 locations in four slices.
3.3. Vibration noise
Vibration noise is defined as the light intensitychanges on a photodetector caused by the movement ofthe image. Absorption measurement has small frac-tional changes and a high RLI on the detectors, so it issensitive to the movement of the preparation.
Vibration noise is proportional to the RLI while shotnoise is proportional to the square root of the lightintensity. Thus when illumination intensity increases,vibration noise will ultimately become dominant.Above the level where vibration noise equals the shotnoise, signal-to-noise ratio will no longer increase withhigher illumination intensity. When high illuminationintensity is used (e.g. absorption methods), vibrationcontrol in many situations determines the ultimate sig-nal-to-noise ratio.
We use the following method for evaluating thevibration noise on a given apparatus:
Under Koehler illumination reduce the field di-aphragm of the microscope so that a clear image of thediaphragm (as a round hole with a sharp edge) isformed in the field of view and project the image ontothe photodetector. The sharp edge of the image gener-ates a near maximum contrast on the imaging system.Due to the vibration, the edge may move in the imageplane so that the light intensity on some detectorsviewing the edge changes from minimum to maximumand on other detectors changes from maximum tominimum. The intensity change on the detectors willreflect the worst possible effect of vibration noise.When the experimental stage is well isolated, the noiseon the edge of the hole should not be larger than thatin the center of the hole. With the chamber and prepa-
ration inserted into the light path, the vibration noisemay also become larger because of the vibration of thewater air interface. A cover slip or water immersionlens can eliminate this kind of vibration noise.
With this test we found that air tables performedpoorly in filtering vibrations below 5 Hz. A novelisolation stage designed for atomic force microscopy,the ‘Minus K’ table (www.minusk.com), is about tentimes better than our air tables. With the Minus Ktable the vibration noise can be reduced below the levelof shot noise at a RLI of �1011 photons per ms permm2.
3.4. Total recording time
Phototoxicity and dye bleaching set the limit forillumination intensity and total recording time. Whenstained slices were continuously exposed to high inten-sity light (e.g. �1012 photons per ms per mm2), LFPsignal and optical signal decreased gradually after 5–10min. We define this reduction in electrical activity dueto exposure as ‘phototoxicity’ (also called photody-namic damage, Cohen and Salzberg, 1978). Phototoxic-ity in cortical slices appeared to be irreversible evenafter a long dark recovery period.
Intermittent exposure significantly reduced phototox-icity. At an illumination intensity of 1012 photons permm per mm2 (RLI�10 photons per mm per mm2)when exposure is broken down to 2 min sessions with 2min dark intervals, phototoxicity of NK3630 becameless significant. In nine out of ten slices LFP signalsdropped only �30% after 60 min of total exposuretime. Optical signals, however, dropped �90% (Fig.6A). We define ‘bleaching’ as the reduction in optical

W. Jin et al. / Journal of Neuroscience Methods 115 (2002) 13–2722
signal while LFP signals remain unchanged. After longexposure the bleaching effect was visible as the exposedarea lost color. Optical signals recovered in thebleached area after the preparation was restained (datanot shown).
We define the total recording time as the exposuretime needed to reduce the amplitude of the opticalsignal to 50% of the pre-exposure level. Fig. 6B showsthe total recording time at different resting light intensi-ties. Using Fig. 5B, Fig. 6B we know that when illumi-nation intensity was adjusted for a signal-to-noise ratioof 8–10, the total recording time was about 15–30 min.This time can be divided into many intermittent record-ing sessions (e.g. 100 of 8 s trials). This total timeappears to be enough for most experiments.
3.5. Wa�elength and filter selection
Fig. 7A shows the absorption spectrum of unstainedcortical tissue and the spectrum of tissue stained withdye NK3630. Unstained brain tissue has a relatively
even transmission with a tendency to absorb less inlonger wavelengths (Fig. 7A, open circles). Stainedcortical tissue has a peak of absorption around 670 nm(Fig. 7A, solid circles). This peak stayed the same aftera long wash with dye-free ACSF. For a satisfactorystaining the light transmission at 670 nm (peak absorp-tion) through a 400 �m stained slice was reduced to1/10–1/50 of that of unstained slices.
In Fig. 7B and C the amplitudes of the dye signal(dI/I) and signal-to-noise ratio are plotted againstwavelength. The dI/I and signal-to-noise ratio reacheda maximum at 705 nm. The signal decreased signifi-cantly at wavelengths shorter than 690 nm and reacheda minimum at �675 nm. At wavelengths shorter than670 nm the signal became larger but the polarity of thesignal reversed. The signal reached a second maximumat 660 nm. After this 660 nm peak, the signal decreasedgradually and became undetectable at wavelengths of550 nm or shorter. This plot shows several usefulwavelengths: For non-ratiometric measurement, bandpass filtering around 705 nm should yield the largestsignal; An alternating illumination of 700 and 660 nmmay be used for ratiometric measurements; Illumina-tion at 675 nm should provide a minimum VSD signal,which can be used for measuring light scattering or fordistinguishing VSD from intrinsic signals.
The signal-to-noise ratio spectrum in Fig. 7C sug-gests that the best filter for NK3630 should have acenter wavelength around 705 nm. The bandwidth ofthe filter, however, depends upon other factors: Whenthe signal is small and shot noise is a limiting factor, awider bandpass would allow more light and thus in-crease the signal-to-noise ratio. In this case the filtershould have a center wavelength of 715 and a band-width of �30 nm. When measuring large signals,where long total recording time is needed, a narrowband filter of 705�5 should be used to reduce theillumination intensity. Using narrow band filters wouldalso help to reduce dye bleaching and vibration noise.
As an example we suggest narrow band filters formeasuring spontaneous epileptiform events in corticalslices. Epileptiform events have large signals (Tsau etal., 1998b, 1999) so that using a narrow band filter canhelp to increase total recording time and reduce vibra-tion noise.
3.6. Comparing NK3630 with the fluorescent dyeRH795
In the course of voltage-sensitive dye development,fluorescence and absorption dyes have been more orless equally developed (reviewed by Ebner and Chen,1995). Absorption dyes usually need trans-illumination,which is inconvenient or impossible for in vivo mea-surements [one exception is that in turtle visual cortex,a transillumination arrangement and absorption dye
Fig. 7. Absorption spectra and signal-to-noise ratio. (A) The absorp-tion spectrum of unstained slices (unfilled circles) and a slice stainedwith NK3630 (solid dots). (B) VSD signal amplitude at differentwavelengths. Note that the maximum amplitude is not at the peakabsorbance. (C) Signal-to-noise ratio at different wavelengths.

W. Jin et al. / Journal of Neuroscience Methods 115 (2002) 13–27 23
Fig. 8. Fluorescence and absorption signals from the same cortical tissue. The slice was stained by NK3630 (0.02 mg/ml) and RH795 (0.1 mg/ml)simultaneously. The two kinds of optical signals were recorded by a 40× (0.75 N.A) water immersion objective from the same area (40×40 �m2)in layer II–III of the somatosensory cortex. The stimulus electrode was placed in the deep layers in beam of the recording area. The stimulusintensity was 30% of the intensity that yields the maximum response. The signals were digitally filtered between 2 and 300 Hz. Top two traces:at a low illumination intensity (1.6×10¹¹ photons per ms, 100 W halogen filament lamp running at 6 A), absorption measurement has a bettersignal-to-noise ratio. Bottom trace: at a high illumination intensity (�1012 photons per ms per mm2, 100 W lamp running at 8.8 A), thesignal-to-noise ratio for the fluorescence measurement improved significantly.
was used (Senseman and Robins, 1999)]. In brain sliceboth epi- and trans-illumination can be used, sowhether the absorption or the fluorescent dyes arebetter remains an open question. In artificial membranesystems (Loew and Simpson, 1981; Fluhler et al., 1985)and cultured neuron systems (Chien and Pine, 1991;Stepnoski et al., 1991), fluorescent dyes have largerfractional changes (dI/I= �0.5–5%) which are about10–100 times larger than those of absorption dyes. Inbrain slices, however, this larger fractional change doesnot necessarily translate into higher signal-to-noise ra-tio. Cohen and Lesher (1986) have reasoned that in atissue where a large fraction of dye molecules is boundto non-excitable membrane (connective tissue and glialmembrane), absorption dyes could give a larger signal-to-noise ratio. In cortical tissue the ratio of excitable/nonexcitable membrane is unknown. In addition duringmany neuronal events only a small fraction of neuronsare active (Wu et al., 1999b, 2001).
The use of absorption dyes in brain slices has beensystematically evaluated; NK3630 (RH482) is one ofthe best absorption dyes and long-term optical record-ings using this dye is possible (Momose-Sato et al.,1999). Meanwhile long-term optical recording usingfluorescent dyes has also been demonstrated (Tominagaet al., 2000). However, exactly which kind of dye canhave larger signal-to-noise ratio and longer totalrecording time has not been evaluated. Here we com-pared the signal-to-noise ratio of a popular fluorescentstyryl dye RH795 to that of NK3630 under the same
illumination intensity (slice receives a similar level oflight exposure and total recording time).
The total recording time of RH795 seems to belimited by phototoxicity. When RH795 stained sliceswere illuminated with 520 nm light at an intensity of�1012 photons per ms per mm2, in all three prepara-tions tested LFP and optical signal disappeared in twoto five trials of 2 min exposures. After the signalsdisappeared, the fluorescence of the stained tissue re-mained at �80% of the pre-exposure level, suggestingthat phototoxicity occurred but bleaching wasinsignificant.
At this level of illumination intensity, the signal-to-noise ratio for RH795 was about 6 for a ‘fast’ responseevoked by a shock of 20% of saturation intensity (n=3slices).
For absorption measurement with NH3630, we ad-justed the illumination intensity to obtain a signal-to-noise ratio of 6 (stimulated by a shock of 20% ofsaturation). The signal was only reduced to 50% after40 min of exposure (two slices), which is about an orderof magnitude longer than RH795. We think that re-garding phototoxicity, absorption dye NK3630 is sig-nificantly better than fluorescent dye RH795 in brainslice experiments.
Fig. 8 compares the signal-to-noise ratio of a fluores-cence measurement and absorption measurement fromthe same tissue under the same illumination intensity.The slice was stained with RH795 and NK3630 at thesame time. Since the two dyes absorb different light

W. Jin et al. / Journal of Neuroscience Methods 115 (2002) 13–2724
wavelengths, their signals remained unchanged when thetissue was stained with the other dye. This allowed us toevaluate the signal size of the same evoked activity in thesame neuronal population. The fast response (Fig. 2B-1)had little trial-to-trial variation at the same stimulusintensity. We thus measured one trial with trans-illumi-nation at 705 nm (absorption of NK3630), and thenmeasured one trial again with the epi-illumination ar-rangement, illuminating the tissue with 520 nm light andmeasuring the signal in 610 nm and longer wavelengths(fluorescence of RH795). With the same illuminationintensity (1.6×10¹¹ photons per ms per mm2) RLI forabsorption measurement was 1.5×10¹⁰ photons per msper mm2 and the absorption signal for the same activityin the same tissue was �4×10⁻⁴. The resting fluores-
cence intensity of the tissue was about 3×10⁷ photonsper ms per mm2 and the fluorescence signal (dF/F) was�5×10⁻³ (Fig. 8 middle trace). Although the fractionalchange of the fluorescent dye was about 10 times largerthan that of the absorption dye, the signal-to-noise ratiofor the fluorescence measurement was substantially lower(Fig. 8, top two traces). The signal-to-noise ratio of ourfluorescence measurement was similar to the one mea-sured from a hippocampal slice stained with anotherfluorescent dye, Di-4-ANEPPS (Tominaga et al., 2000).Increasing illumination intensity to 1012 photons per msper mm2 significantly increased the signal-to-noise ratioof the same evoked activity (Fig. 8 bottom trace),however, the total recording time at this level would besignificantly shortened.
Fig. 9. Propagating activation during an oscillation. (A) A spontaneous oscillation occurred in the cortical slices bathed in low magnesium ACSF.Each episode started with an initial spike, and many cycles of oscillation followed. Three cycles, I, II and III, are shown in the pseudocolor imagesin B. (B) Imaging showed that these different cycles had different initiation sites and different propagation directions (redrawn from Wu et al.,1999b).

W. Jin et al. / Journal of Neuroscience Methods 115 (2002) 13–27 25
This direct comparison suggests that with a long totalrecording time, fluorescence measurements are onlyable to visualize large signals (e.g. from epileptiformactivity or the fast response evoked by a strong electri-cal shock) in single trials. In contrast, absorption mea-surements are able to detect small and non-averageableactivities (e.g. oscillations, Wu et al., 1999b; Fig. 9).
3.7. Application examples
The first example is to examine the spatiotemporalproperties of a population oscillation (Wu et al., 1999b;Fig. 9). This activity is an ‘epoch oscillation’ whichspontaneously occurs in cortical slices bathed in lowmagnesium ACSF. Each epoch started with an initialspike and was followed by many cycles of oscillations(Fig. 9A). In LFP recordings each oscillation cycle wassimilar (Fig. 9A) but imaging showed that differentcycles (cycles I, II and III in Fig. 9B) initiated atdifferent locations. In this example the oscillation could
not be detected by CCD devices because the signal wassmall (�10−4) and averaging could not be applied toincrease the signal-to-noise ratio.
Fig. 10 shows an example of mapping a special‘potentiation’ in the amygdaloid. When the fiber trackleading to the amygdaloid nuclei was stimulated at 1Hz for 15 min, a slow potentiation occurred in differentnuclei of the amygdaloid complex (Li et al., 1998). Withvoltage-sensitive dye imaging different degrees of po-tentiation in different clusters of neurons in amygdaloidcomplex could be examined simultaneously. Fig. 10shows that one small cluster had more than 100 timesstronger a potentiation than the neighboring areas. Thecluster was only about 166 um wide and simultaneouslyimaging the whole area was much easier when identify-ing the potentiated region than using field potential orintracellular recordings. Without multi-location record-ing this study would be difficult. In the measurementshown in Fig. 10 the LFP electrode was only 300 umaway from the locus with the large potentiation but
Fig. 10. A special potentiation in amygdaloid. The amygdaloid complex area, a box about 1×1 mm2, was imaged by VSD imaging. A fastresponse was elicited by an electrical shock to the external capsule (right traces). A train of potentiation shocks at 1 Hz×15 min was applied tothe stimulation electrode. About 70 min after the potentiation shocks, one small area showed a much larger response, about 100 times larger thanthe response before the shocks (upper three traces on the right). This dramatic enhancement of evoked response only occurred under one detector(83×83 �m2). Recordings 166 �m away from the site showed much less potentiation, and a LFP electrode 330 �m away from the site did notshow any significant potentiation.

W. Jin et al. / Journal of Neuroscience Methods 115 (2002) 13–2726
showed no potentiation at all (Fig. 10). VSD imagingprovided a map of the large potentiation in the tissue.After the imaging the same tissue could be used forimmunochemistry or in situ hybridization to study thesubtypes of receptors in different neuron clusters whichwere responsible for this large potentiation.
4. Conclusion
Data in this report suggest that using the combina-tion of absorption dyes, diode array and an advancedvibration control may achieve an optimum conditionfor measuring population activity in brain slices. Withthis combination about 500 locations in 1 mm2 ofcortical tissue can be measured simultaneously with asensitivity comparable to that of LFP electrode.
Acknowledgements
We thank Dr Lawrence B. Cohen for critical andvery helpful comments, Dr H. Li and Dr M.A. Ro-gawski for help with the amygdaloid slice experiment,and A. Schaefer and H. Frost for technical assistancewith the experiments and manuscript preparation. Sup-ported by NIH NS36477 and a Whitehall Foundationgrant.
References
Albowitz B, Kuhnt U. Evoked changes of membrane potential inguinea pig sensory neocortical slices: an analysis with voltage-sen-sitive dyes and a fast optical recording method. Exp Brain Res1993;93:213–25.
Antic S, Major G, Zecevic D. Fast optical recordings of membranepotential changes from dendrites of pyramidal neurons. J Neuro-physiol 1999;82:1615–21.
Cacciatore TW, Brodfuehrer PD, Gonzalez JE, Jiang T, Adams SR,Tsien RY, Kristan WB, Kleinfeld D. Identification of neuralcircuits by imaging coherent electrical activity with FRET-baseddyes. Neuron 1999;23:449–59.
Chien CB, Pine J. Voltage-sensitive dye recording of action potentialsand synaptic potentials from sympathetic microcultures. BiophysJ 1991;60:697–711.
Cohen LB, Salzberg BM. Optical measurement of membrane poten-tial. Rev Physiol Biochem Pharmacol 1978;83:35–88.
Cohen LB, Lesher S. Optical monitoring of membrane potential:methods of multisite optical measurement. Soc Gen Physiol Ser1986;40:71–99.
Cohen LB, Keynes RD, Hille B. Light scattering and birefringencechanges during nerve activity. Nature 1968;218:438–41.
Colom LV, Saggau P. Spontaneous interictal-like activity originatesin multiple areas of the CA2–CA3 region of hippocampal slices.J Neurophysiol 1994;71:1574–85.
Demir R, Haberly LB, Jackson MB. Sustained and acceleratingactivity at two discrete sites generate epileptiform discharges inslices of piriform cortex. J Neurosci 1999;19:1294–306.
Demir R, Haberly LB, Jackson MB. Characteristics of plateau activ-ity during the latent period prior to epileptiform discharges in
slices from rat piriform cortex. J Neurophysiol 2000;83:1088–98.Ebner TJ, Chen G. Use of voltage-sensitive dyes and optical record-
ings in the central nervous system. Prog Neurobiol 1995;46:463–506.
Fluhler E, Burnham VG, Loew LM. Spectra membrane binding, andpotentiometric responses of new charge shift probes. Biochemistry1985;24:5749–55.
Grinvald A, Hildesheim R, Farber IC, Anglister L. Improved fluores-cent probes for the measurement of rapid changes in membranepotential. Biophys J 1982a;39:301–8.
Grinvald A, Manker A, Segal M. Visualization of the spread ofelectrical activity in rat hippocampal slices by voltage-sensitiveoptical probes. J Physiol 1982b;333:269–91.
Gupta RK, Salzberg BM, Grinvald A, Cohen LB, Kamino K, LesherS, Boyle MB, Waggoner AS, Wang CH. Improvements in opticalmethods for measuring rapid changes in membrane potential. JMembr Biol 1981;58:123–37.
Hirota A, Sato K, Momose-Sato Y, Sakai T, Kamino K. A newsimultaneous 1020-site optical recording system for monitoringneural activity using voltage-sensitive dyes. J Neurosci Methods1995;56:187–94.
Kojima S, Nakamura T, Nidaira T, Nakamura K, Ooashi N, Ito E,Watase K, Tanaka K, Wada K, Kudo Y, Miyakawa H. Opticaldetection of synaptically induced glutamate transport inhippocampal slices. J Neurosci 1999;19:2580–8.
Laaris N, Carlson GC, Keller A. Thalamic-evoked synaptic interac-tions in barrel cortex revealed by optical imaging. J Neurosci2000;20:1529–37.
Li H, Weiss SRB, Chuang D, Post RM, Rogawski MA. Bidirectionalsynaptic plasticity in the rat basolateral amygdala: characteriza-tion of an activity-dependent switch sensitive to the presynapticmetabotropic glutamate receptor antagonist 2S-ethylglutamicacid. J Neurosci 1998;18:1662–70.
Loew LM, Simpson LL. Charge-shift probes of membrane potential:a probable electrochromic mechanism for p-aminostyrylpyri-dinium probes on a hemispherical lipid bilayer. Biophys J1981;34:353–65.
Loew LM, Cohen LB, Dix J, Fluhler EN, Montana V, Salama G,Wu J-Y. A naphthyl analog of the aminostyryl pyridinium classof potentiometric membrane dyes shows consistent sensitivity in avariety of tissue, cell, and model membrane preparations. JMembr Biol 1992;130:1–10.
Momose-Sato Y, Sato K, Arai Y, Yazawa I, Mochida H, Kamino K.Evaluation of voltage-sensitive dyes for long-term recording ofneural activity in the hippocampus. J Membr Biol 1999;172:145–57.
Pazdalski PS, Tsau Y, Wu J-Y. Light scattering in cortical tissue asan indicator of normal and epileptiform activity: an in vitro study.Neurosci Abstr 1998;24:1059.
Ross W, Salzberg B, Cohen L, Grinvald A, Davila H, Waggoner A,Wang C. Changes in absorption, fluorescence, dichroism, andbirefringence in stained giant axons: optical measurement ofmembrane potential. J Membr Biol 1977;33:141–83.
Senseman DM, Robins KA. Modal behavior of cortical neuralnetworks during visual processing. J Neurosci 1999;19(RC3):1–7.
Senseman DM, Vasquez S, Nash PL. Animated pseudocolor activitymaps PAMs: scientific visualization of brain electrical activity. In:Schilds D, editor. Information Processing of Chemical SensoryStimuli in Biological and Artificial Systems, NATO ASI Series,vol. H39. Berlin: Springer, 1999:329–47.
Shoham D, Glaser DE, Arieli A, Kenet T, Wijnbergen C, Toledo Y,Hildesheim R, Grinvald A. Imaging cortical dynamics at highspatial and temporal resolution with novel blue voltage-sensitivedyes. Neuron 1999;24:791–802.
Stepnoski RA, La Porta A, Raccuia-Behling F, Blonder GE, SlusherRE, Kleinfeld D. Noninvasive detection of changes in membranepotential in cultured neurons by light scattering. Proc Natl AcadSci USA 1991;88:9382–6.
W. Jin et al. / Journal of Neuroscience Methods 115 (2002) 13–27 27
Tanifuji M, Sugiyama T, Murase K. Horizontal propagation ofexcitation in rat visual cortical slices revealed by optical imaging.Science 1994;266:1057–9.
Tasaki I, Watanabe A, Carnay L. Changes in fluorescence, turbidity,and bireference associated with nerve excitation. Proc Natl AcadSci USA 1968;61:883–8.
Taylor AL, Cacciatore TW, Gonzalez JE, Rao J, Cottrell GW, TsienRY, Kleinfeld D, Kristan WBJ. Improved FRET-based voltagesensitive dye imaging in leech. Neurosci Abstr 2000;26:1722.
Tominaga T, Tominaga Y, Yamada H, Matsumoto G, Ichikawa M.Quantification of optical signals with electrophysiological signalsin neural activities of Di-4-ANEPPS stained rat hippocampalslices. J Neurosci Methods 2000;102:11–23.
Tsau Y, Guan L, Wu J-Y. Initiation of spontaneous epileptiformactivity in the neocortical slice. J Neurophysiol 1998a;80:978–82.
Tsau Y, Guan L, Wu J-Y. Initiation of spontaneous epileptiformevents in neocortical slices: dominant focus. Neurosci Abstr1998b;24:2141.
Tsau Y, Guan L, Wu J-Y. Epileptiform activity can be initiated invarious neocortical layers: an optical imaging study. J Neurophys-iol 1999;82:1965–73.
Wu J-Y, Cohen LB. Fast multisite optical measurement of membranepotential. In: Biological Techniques: Fluorescent and LuminescentProbes for Biological Activity. New York: W.T. Mason, Aca-demic Press, 1993:389–404.
Wu J-Y, Cohen LB, Falk CX. Fast Multisite Optical Measurement ofMembrane Potential. With Two Examples. Fluorescent and Lu-minescent Probes for Biological Activity. W.T. Mason, AcademicPress, 1999a:222–38.
Wu J-Y, Guan L, Tsau Y. Propagating activation during oscillationsand evoked responses in neocortical slices. J Neurosci1999b;19:5005–15.
Wu J-Y, Guan L, Bai L, Yang Q. Spatiotemporal properties of anevoked population activity in rat sensory cortical slices. J Neuro-physiol 2001;86:2461–74.
Zecevic D. Multiple spike-initiation zones in single neurons revealedby voltage-sensitive dyes. Nature 1996;381:322–5.