
Voltage Sags and Interruptions - The BEST Groupbest.eng.buffalo.edu/Research/Lecture Series...
37
Voltage Sags and Interruptions Presented by: Syed Khundmir T Department of Electrical Engineering University at Buffalo [email protected] The BEST Group THE BUFFALO ENERGY SCIENCE AND TECHNOLOGY GROUP Prime reference: Electrical Power Systems Quality By Roger C. Dugan, Mark F. McGranaghan, Surya Santoso, H. Wayne Beaty
-
Upload
nguyennguyet -
Category
Documents
-
view
219 -
download
1
Transcript of Voltage Sags and Interruptions - The BEST Groupbest.eng.buffalo.edu/Research/Lecture Series...

Voltage Sags and Interruptions
Presented by: Syed Khundmir T Department of Electrical Engineering University at Buffalo [email protected]
The BEST Group THE BUFFALO ENERGY SCIENCE AND TECHNOLOGY GROUP
Prime reference: Electrical Power Systems Quality By Roger C. Dugan, Mark F. McGranaghan, Surya Santoso, H. Wayne Beaty
Introduction
• Voltage Sag: A short duration reduction in rms voltage caused by faults on the power system and starting of large loads, such as motors.
• Interruption: Momentary interruptions cause a complete loss of voltage and are a common result of the actions taken by utilities to clear transient faults on their systems. Sustained interruptions of longer than 1 min are generally due to permanent faults.

Solutions at end-user level
• Aim is to improve the reliability and performance of a process or facility. • Types based on application: 1. Protection for small loads less than 5kVA. 2. Protection for equipment/s up to 300kVA. 3. Protection for group of loads or complete facility at low-voltage
level. 4. Protection at medium-voltage level or on the supply system.

Major technologies in the area
• Ferroresonant transformers: Ø These are also called as constant-voltage transformers. Ø 1:1 transformers with excitation. Output voltage is not significantly
affected by input voltage variations.
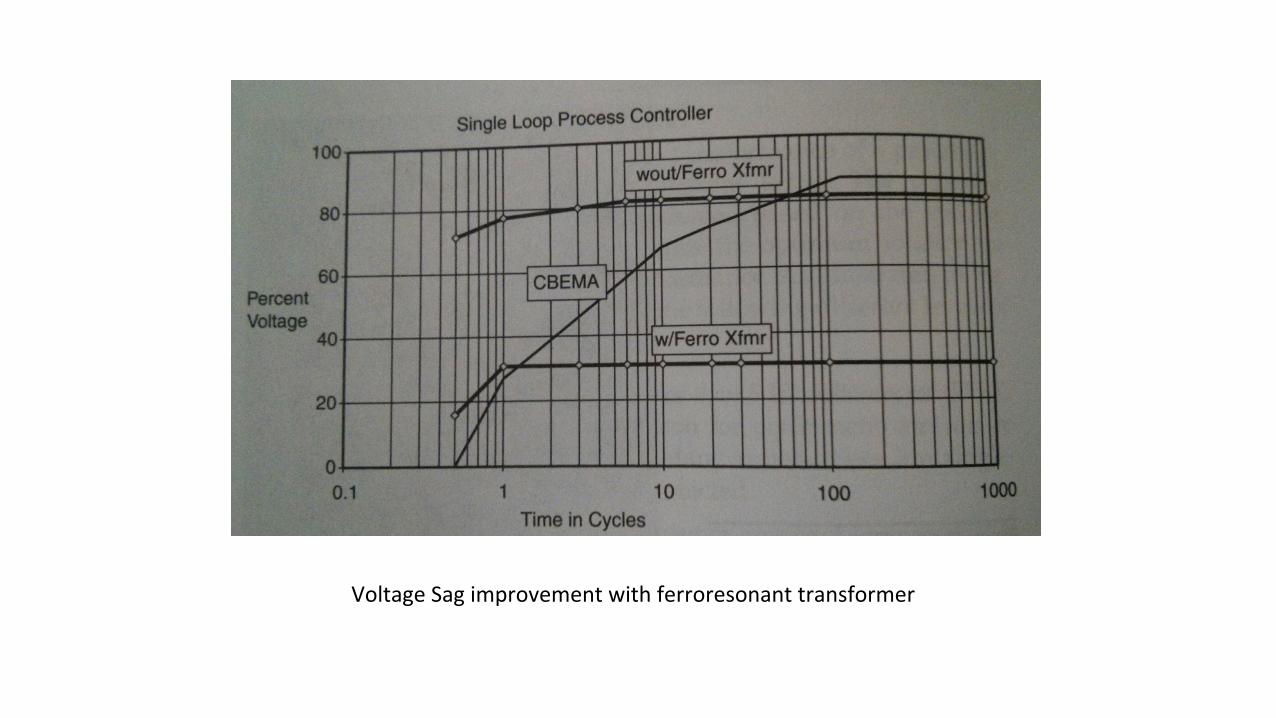
Voltage Sag improvement with ferroresonant transformer
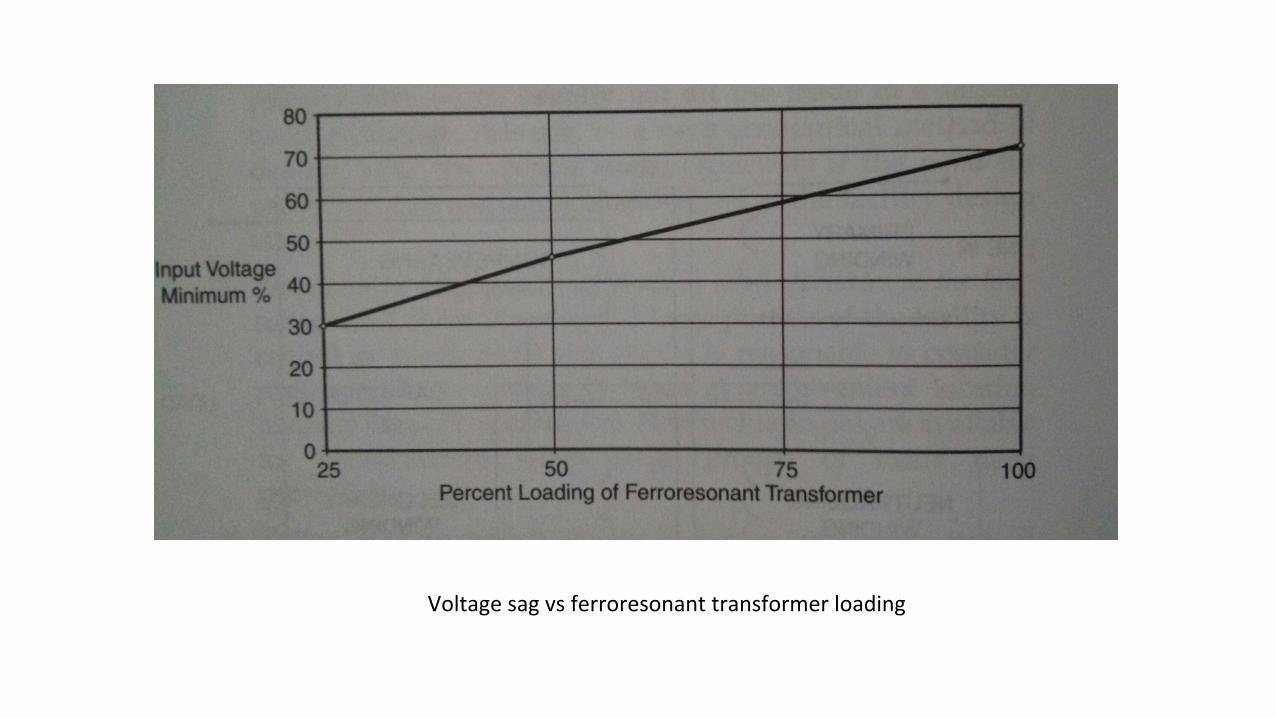
Voltage sag vs ferroresonant transformer loading

Magnetic Synthesizers
Ø Similar operating principle to that of ferroresonant transformers. Ø These are three phase devices and provide improved voltage sag
support and regulation for three-phase loads.
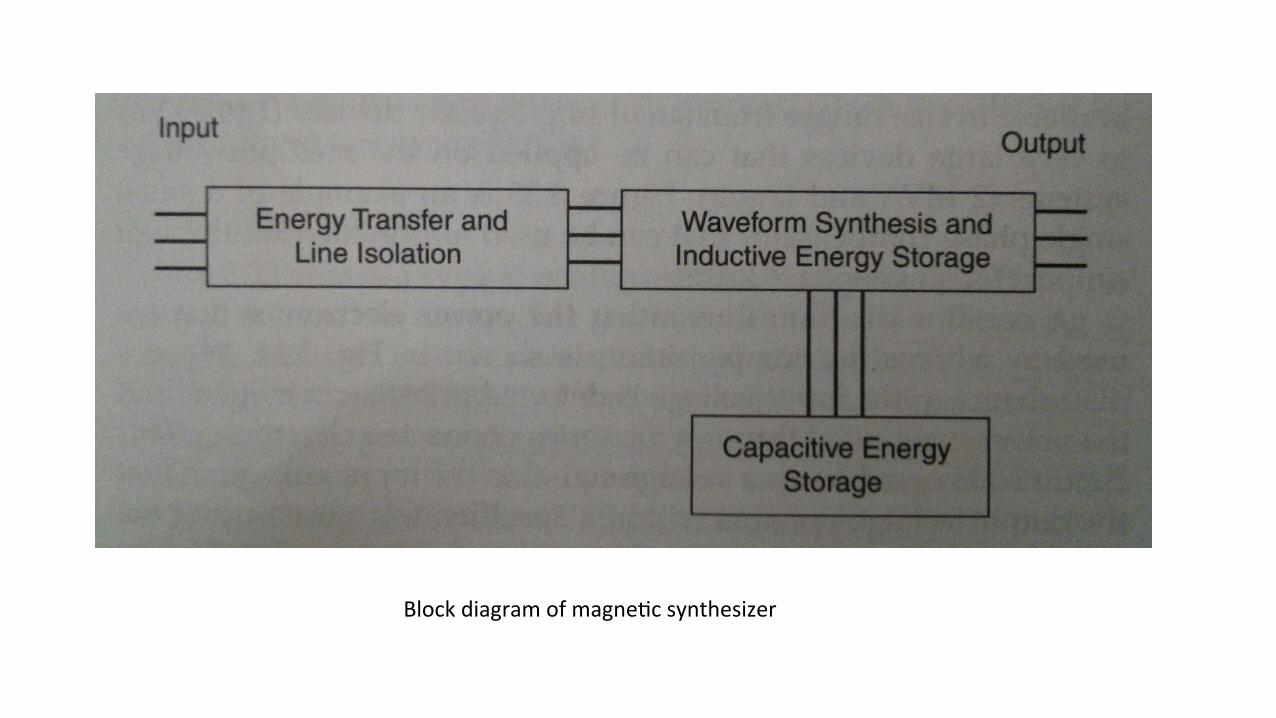
Block diagram of magne;c synthesizer

Magne;c Synthesizer voltage sag ride-‐through capability

Active Series Compensators
Ø Injects voltage in series with the remaining voltage during voltage sag compensation.
Ø Can be used for small single phase loads to large loads on the medium voltage system (2MVA and larger).
Ø Voltage boosting of about 50% is possible.
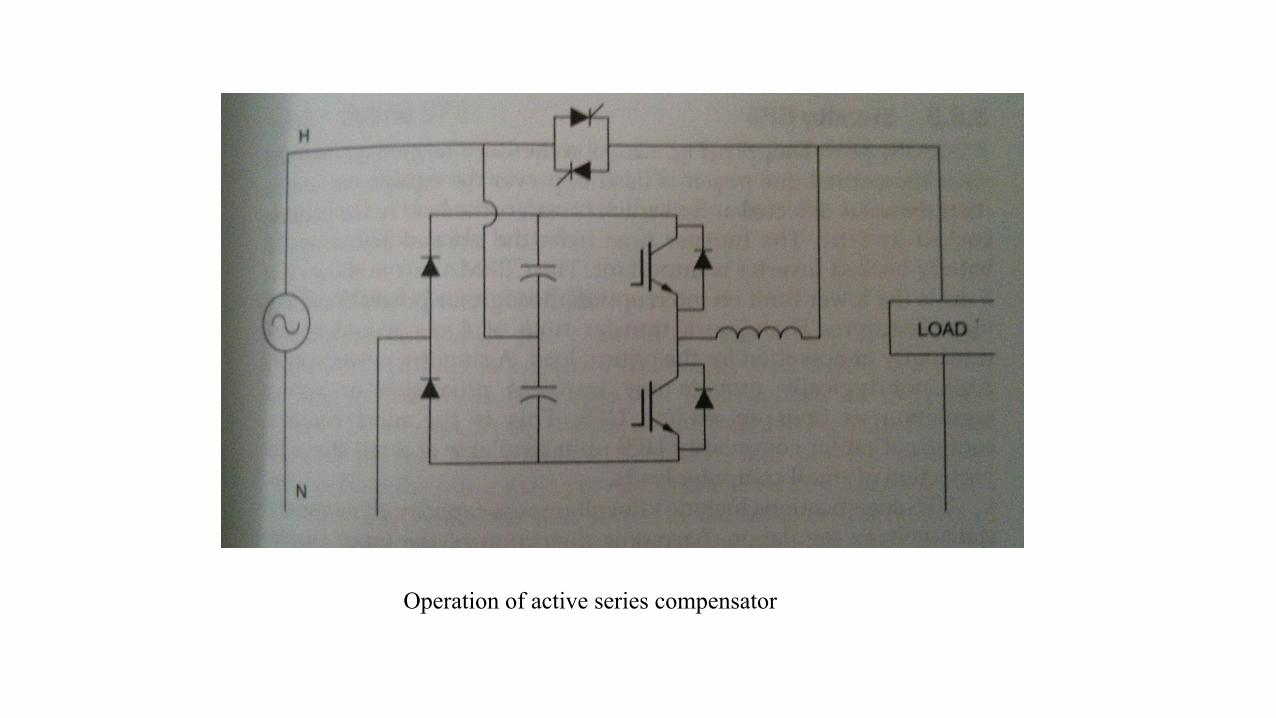
Operation of active series compensator
On-line UPS
Ø In this method, the load is always fed through the UPS.
Ø Provides ride-through for power outages.
Ø Provides very high isolation of the critical load form all power line disturbances.
Ø Increases losses and may be unnecessary for protection of many loads.

Block diagram for On-‐line UPS
Standby UPS
Ø Also known as off-line UPS. Ø During disturbance, a switch transfers a load to the battery backed
inverter. Ø From CBEMA curve, 8ms is the lower limit on interruption through
for power-conscious manufacturers. Ø Therefore, transfer time of 4ms is considered ideal for continuity of
operation. Ø Does not provide transient protection like on-line UPS.

Block diagram for standby UPS
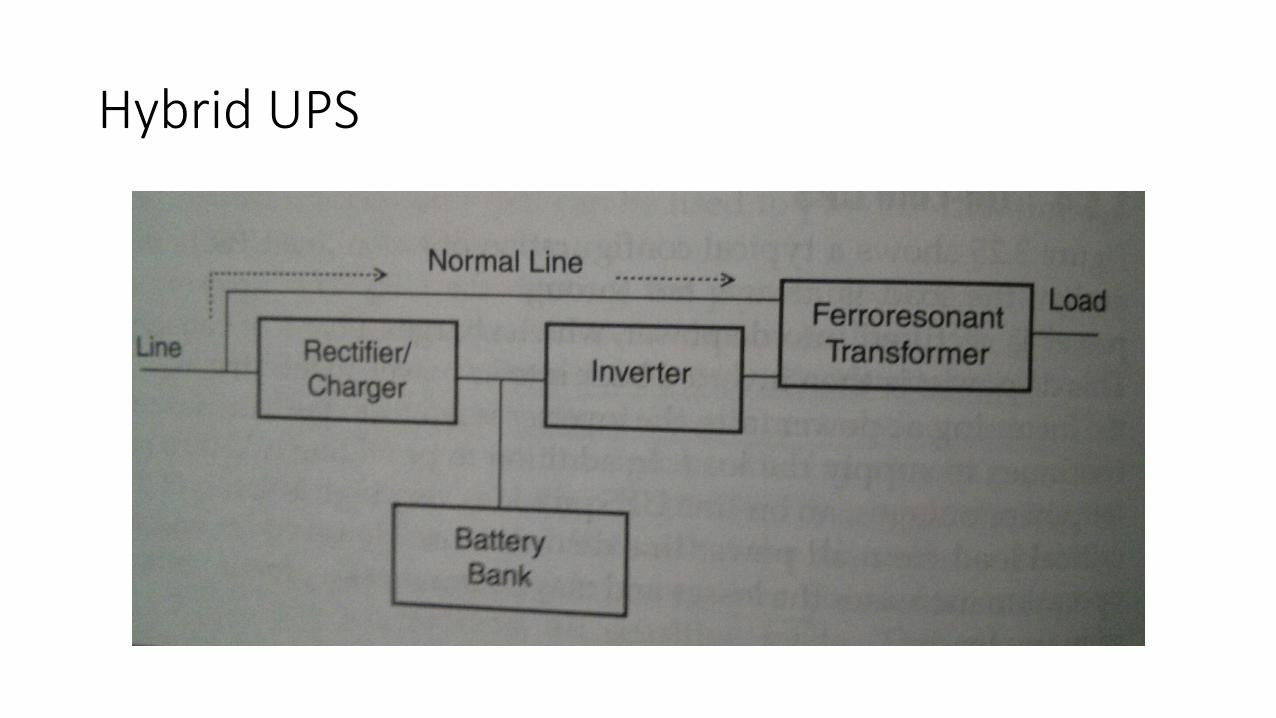
Hybrid UPS
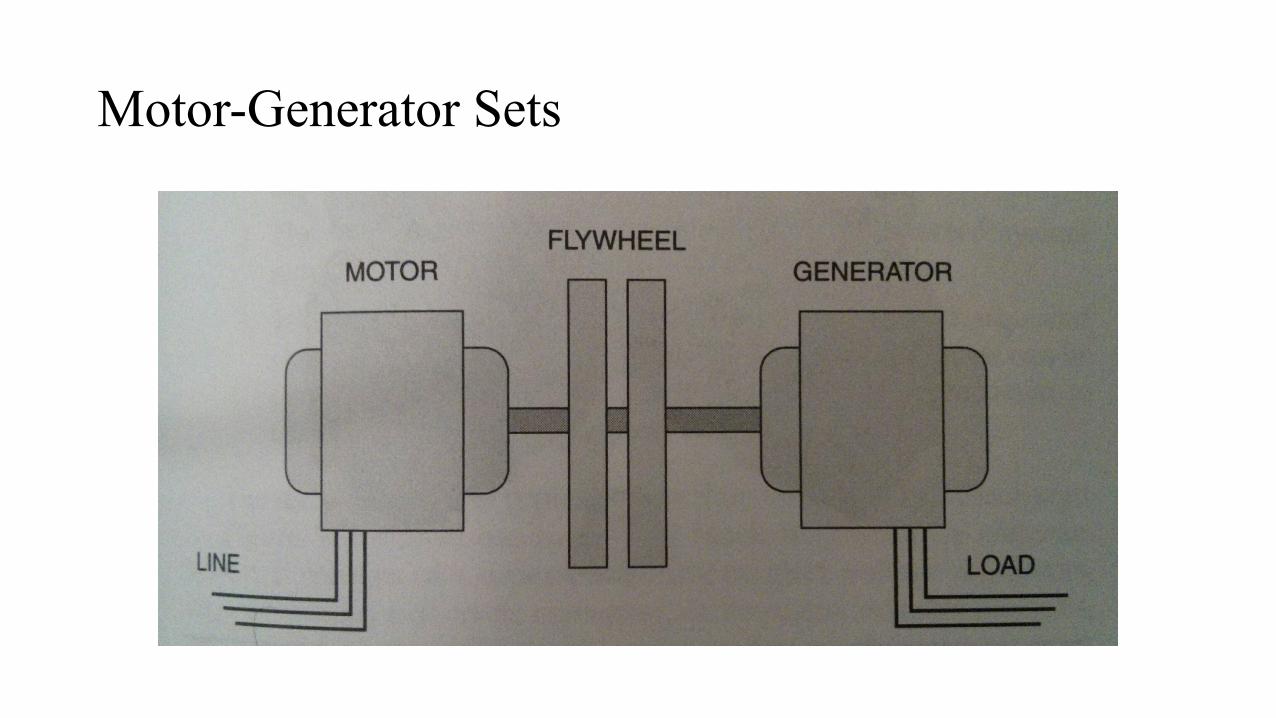
Motor-Generator Sets

• From the diagram, it is clear that the motor is supplied through the lines and drives the generator which provides power to load. • When line suffers disturbance, the inertia of the machines and the
flywheels maintain power of several seconds. • Disadvantages: 1. Losses associated with the machines. 2. Noise and maintenance may be issues with some installations. 3. The frequency and voltage drop during interruptions as the machine
slows. This might not work well with some loads.
Flywheel Energy Storage Systems
Ø Unlike in motor-generator set, these flywheels operate in a vaccum and employ magnetic bearings to reduce standby losses.
Ø These can rotate at speeds of 10,000 rpm or higher.
Ø Energy stored is proportional to square of speed.
Ø This high speed flywheel energy storage module can be used in place of the battery in any of the UPS mentioned earlier.

Flywheel used in Energy Storage Systems
Economics of different ride-through alternatives
• Steps for economic evaluation to find the best option for improving voltage sag performance are:
1. Characterize the system power quality performance. 2. Estimate the costs associated with the power quality variations. 3. Characterize the solution alternatives in terms of costs and
effectiveness. 4. Perform the comparative economic analysis.

Estimating costs for voltage sag events
• Costs vary according to different industry types as well as also with market conditions. • Costs might be higher if the end product is already in short supply. • If there is limited ability to make up for the lost production. • Cost od a power quality disturbance can be captured primarily through
three major categories: 1. Product-related losses. 2. Labor-related losses. 3. Ancillary costs such as damaged equipment and penalties.
• Cost typically vary with severity of the power quality disturbance.
• This relationship can be defined by a matrix of weighting factors.
• Weighting factors are developed using the cost of momentary interruption as base.
• Voltage sags and other power quality variations will always have an impact that is some portion of the total shutdown caused by interruption.
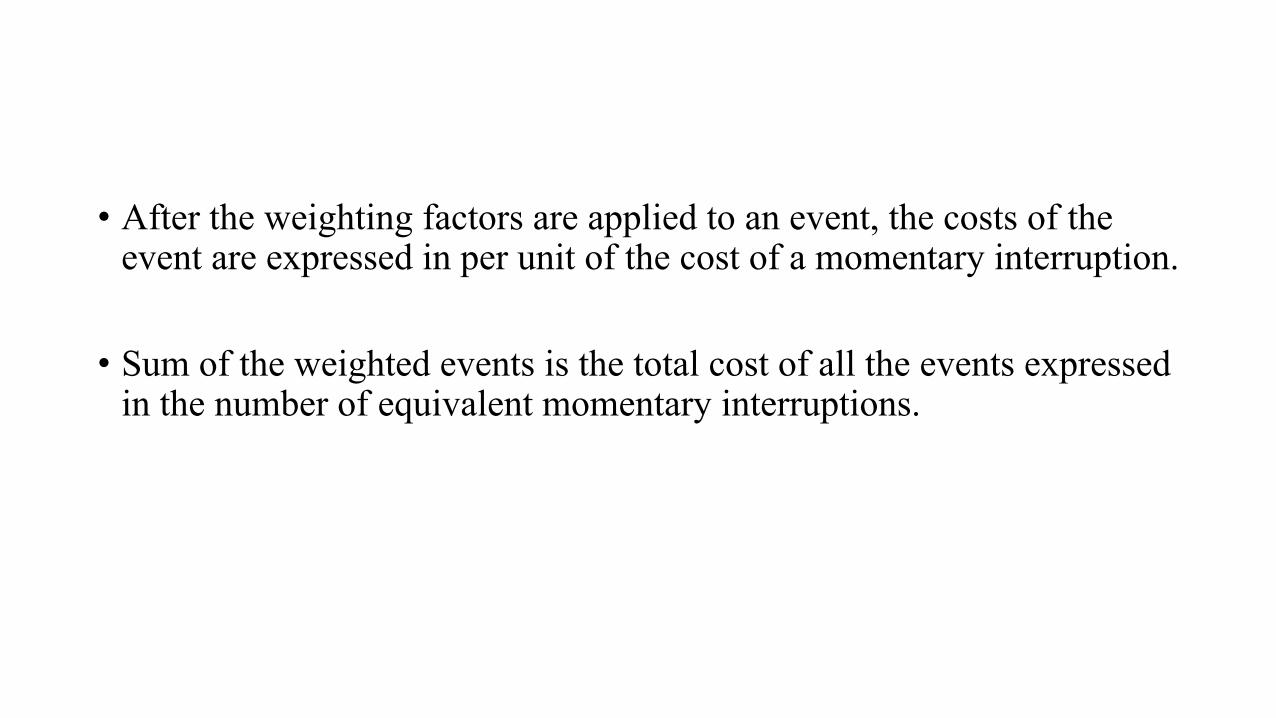
• After the weighting factors are applied to an event, the costs of the event are expressed in per unit of the cost of a momentary interruption.
• Sum of the weighted events is the total cost of all the events expressed in the number of equivalent momentary interruptions.

Example of weigh;ng factors for different voltage sag magnitudes
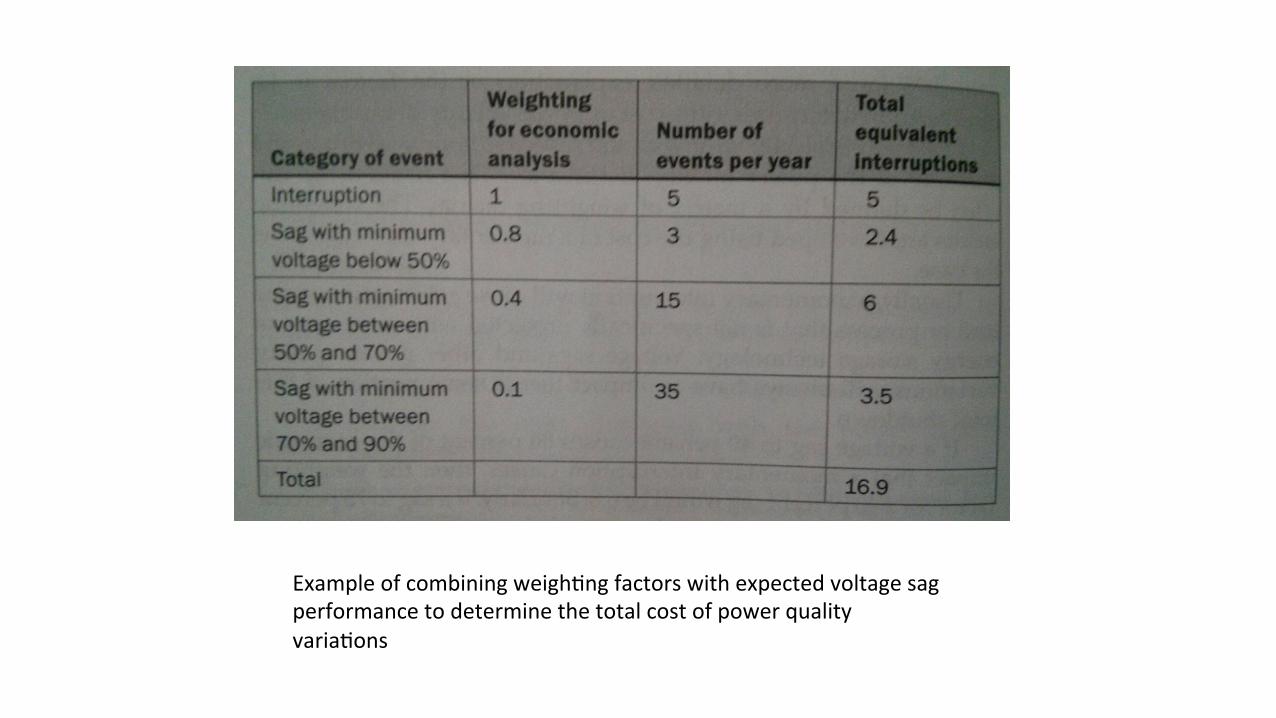
Example of combining weigh;ng factors with expected voltage sag performance to determine the total cost of power quality varia;ons
Characterizing the costs and effectiveness for Solution Alternatives • Solution cost should include initial procurement and installation
expenses, operating and maintenance expenses, and salvage value considerations if any.
• Cost of the extra space requirements can be incorporated as a space rental charge and included with other annual operating expenses.
• The following table provides an example of initial costs and operating costs for some general technologies used to improve performance for voltage sags and interruptions:

Example cost of different types of Power Quality Improvement Technologies

• Besides the costs, the solution effectiveness of each alternative needs to be quantified in terms of the performance improvement that can be achieved.
• It varies with the severity of the power quality disturbance. • The relationship can be defined by a matrix of “% voltage sags
avoided” values.
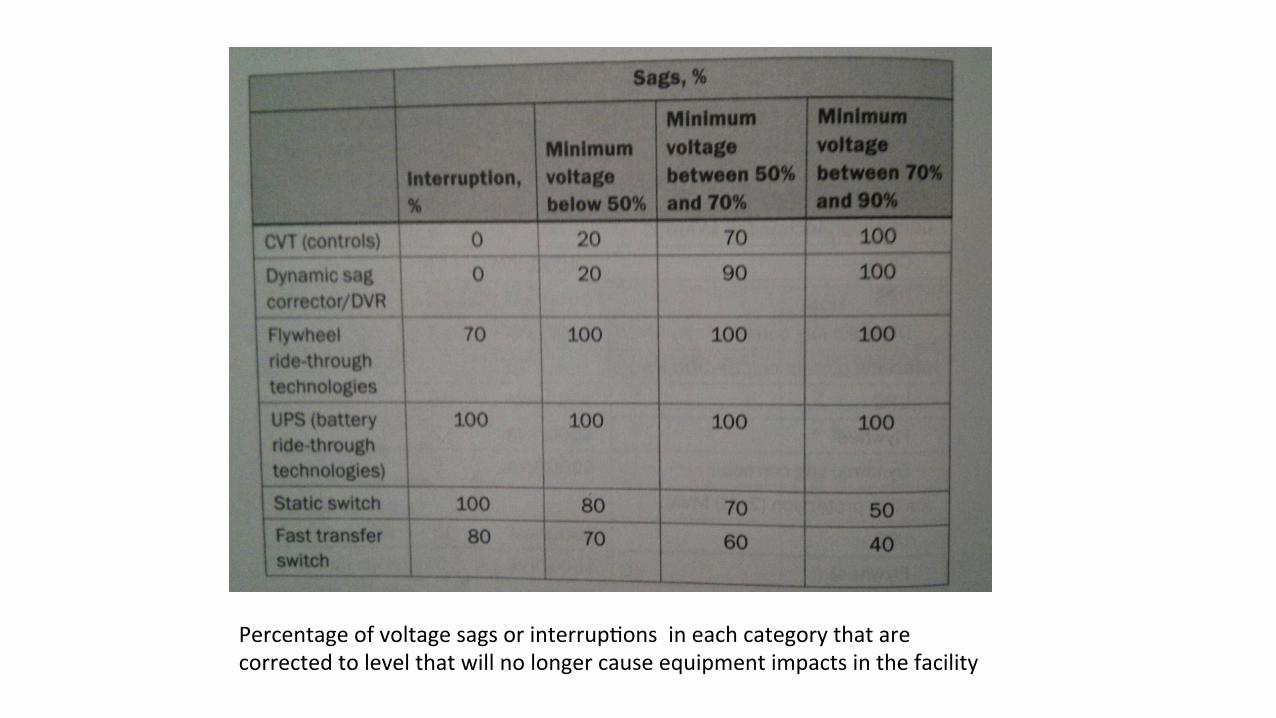
Percentage of voltage sags or interrup;ons in each category that are corrected to level that will no longer cause equipment impacts in the facility

Performing Comparative Economic Analysis
• Comparing the different alternatives used to improve performance involves determining the total annual cost of each alternative. • This annual cost includes the costs associated with the power quality
costs and solution costs. • Power quality costs is the cost incurred because of the voltage sags
since the solutions do not typically eliminate these costs completely. • Solution cost is the annualized costs of implementing the solution. • Objective is to minimize these costs.

• The base case is the do-nothing solution having zero annual power quality solution cost but highest annual power quality costs. • Most of the costs are annual costs by nature but the costs associated
purchasing and installations are one-time upfront costs. • These can be annualized using an appropriate interest rate and
assumed lifetime or evaluation period. • The chart shown in the next slide is based on an example and the
matrix of the weighted factors discussed earlier. From the chart, it will be clear that all the options reduce the total annual costs. In other words, any of them will have a net benefit on the facility.

Example of comparing solu;on with the base case using total annualized costs

• Even though the best solution seems to be using equipment on the utility side (fast transfer switch), more commonly the solution is applied on the facility side. • The major assumption with the utility side solution is that a back up
feeder is provided without any charge other that equipment and operating costs. • Thus, a better solution would be using a Dynamic Voltage Restorer for
protecting sensitive loads.

Next Lecture:
• The next lecture will deal with the “Fault locating using Voltage and Current Measurements”.
Various methods will be dealt such as • Impedance-Based Fault Location Methods. • Locating Incipient Faults. • Fault Current Profile.

References
• J. Lamoree, J. C. Smith, P. Vinett, T. Duffy, M. Klein, “The Impact of Voltage Sags on Industrial Plant Loads,” First International Conference on Power Quality, PQA ’91, Paris, France.
• G. Beam, E. G Dolack, C. J. Melhorn, V. Misiewicz, M. Samotyj, “Power Quality Case Studies, Voltage Sags: The Impact on the Utility and Industrial Customers,” Third International Conference on Power Quality, PQA ’93, San Diego, CA, November 1993.
• J. Lamoree, D. Mueller, P. Vinett, W. Jones, “Voltage Sag Analysis Case Studies,” 1993 IEEE I&CPS Conference, St. Petersburg, FL.
• M. F. McGranaghan, D. R. Mueller, M. J. Samotyj, “Voltage Sags in Industrial Systems,” IEEE Transactions on Industry Applications, vol. 29, no. 2, March/April 1993.


