Volt Resources - Emerging natural graphite supplier …...total demand for graphite (natural +...
68
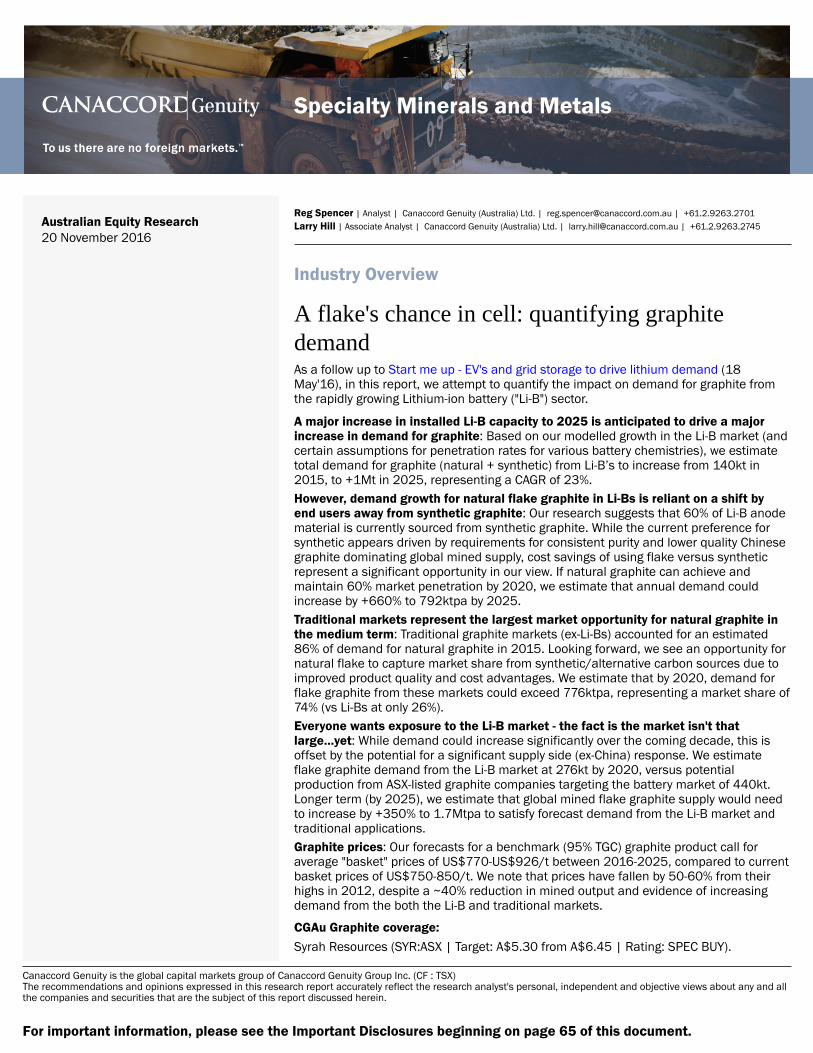
Specialty Minerals and Metals Canaccord Genuity is the global capital markets group of Canaccord Genuity Group Inc. (CF : TSX) The recommendations and opinions expressed in this research report accurately reflect the research analyst's personal, independent and objective views about any and all the companies and securities that are the subject of this report discussed herein. Australian Equity Research 20 November 2016 Reg Spencer | Analyst | Canaccord Genuity (Australia) Ltd. | [email protected] | +61.2.9263.2701 Larry Hill | Associate Analyst | Canaccord Genuity (Australia) Ltd. | [email protected] | +61.2.9263.2745 Industry Overview A flake's chance in cell: quantifying graphite demand As a follow up to Start me up - EV's and grid storage to drive lithium demand (18 May'16), in this report, we attempt to quantify the impact on demand for graphite from the rapidly growing Lithium-ion battery ("Li-B") sector. A major increase in installed Li-B capacity to 2025 is anticipated to drive a major increase in demand for graphite: Based on our modelled growth in the Li-B market (and certain assumptions for penetration rates for various battery chemistries), we estimate total demand for graphite (natural + synthetic) from Li-B’s to increase from 140kt in 2015, to +1Mt in 2025, representing a CAGR of 23%. However, demand growth for natural flake graphite in Li-Bs is reliant on a shift by end users away from synthetic graphite: Our research suggests that 60% of Li-B anode material is currently sourced from synthetic graphite. While the current preference for synthetic appears driven by requirements for consistent purity and lower quality Chinese graphite dominating global mined supply, cost savings of using flake versus synthetic represent a significant opportunity in our view. If natural graphite can achieve and maintain 60% market penetration by 2020, we estimate that annual demand could increase by +660% to 792ktpa by 2025. Traditional markets represent the largest market opportunity for natural graphite in the medium term: Traditional graphite markets (ex-Li-Bs) accounted for an estimated 86% of demand for natural graphite in 2015. Looking forward, we see an opportunity for natural flake to capture market share from synthetic/alternative carbon sources due to improved product quality and cost advantages. We estimate that by 2020, demand for flake graphite from these markets could exceed 776ktpa, representing a market share of 74% (vs Li-Bs at only 26%). Everyone wants exposure to the Li-B market - the fact is the market isn't that large...yet: While demand could increase significantly over the coming decade, this is offset by the potential for a significant supply side (ex-China) response. We estimate flake graphite demand from the Li-B market at 276kt by 2020, versus potential production from ASX-listed graphite companies targeting the battery market of 440kt. Longer term (by 2025), we estimate that global mined flake graphite supply would need to increase by +350% to 1.7Mtpa to satisfy forecast demand from the Li-B market and traditional applications. Graphite prices: Our forecasts for a benchmark (95% TGC) graphite product call for average "basket" prices of US$770-US$926/t between 2016-2025, compared to current basket prices of US$750-850/t. We note that prices have fallen by 50-60% from their highs in 2012, despite a ~40% reduction in mined output and evidence of increasing demand from the both the Li-B and traditional markets. CGAu Graphite coverage: Syrah Resources (SYR:ASX | Target: A$5.30 from A$6.45 | Rating: SPEC BUY). For important information, please see the Important Disclosures beginning on page 65 of this document.
Transcript of Volt Resources - Emerging natural graphite supplier …...total demand for graphite (natural +...
Specialty Minerals and Metals
Canaccord Genuity is the global capital markets group of Canaccord Genuity Group Inc. (CF : TSX)The recommendations and opinions expressed in this research report accurately reflect the research analyst's personal, independent and objective views about any and allthe companies and securities that are the subject of this report discussed herein.
Australian Equity Research20 November 2016
Reg Spencer | Analyst | Canaccord Genuity (Australia) Ltd. | [email protected] | +61.2.9263.2701Larry Hill | Associate Analyst | Canaccord Genuity (Australia) Ltd. | [email protected] | +61.2.9263.2745
Industry Overview
A flake's chance in cell: quantifying graphitedemandAs a follow up to Start me up - EV's and grid storage to drive lithium demand (18May'16), in this report, we attempt to quantify the impact on demand for graphite fromthe rapidly growing Lithium-ion battery ("Li-B") sector.
A major increase in installed Li-B capacity to 2025 is anticipated to drive a majorincrease in demand for graphite: Based on our modelled growth in the Li-B market (andcertain assumptions for penetration rates for various battery chemistries), we estimatetotal demand for graphite (natural + synthetic) from Li-B’s to increase from 140kt in2015, to +1Mt in 2025, representing a CAGR of 23%.However, demand growth for natural flake graphite in Li-Bs is reliant on a shift byend users away from synthetic graphite: Our research suggests that 60% of Li-B anodematerial is currently sourced from synthetic graphite. While the current preference forsynthetic appears driven by requirements for consistent purity and lower quality Chinesegraphite dominating global mined supply, cost savings of using flake versus syntheticrepresent a significant opportunity in our view. If natural graphite can achieve andmaintain 60% market penetration by 2020, we estimate that annual demand couldincrease by +660% to 792ktpa by 2025.Traditional markets represent the largest market opportunity for natural graphite inthe medium term: Traditional graphite markets (ex-Li-Bs) accounted for an estimated86% of demand for natural graphite in 2015. Looking forward, we see an opportunity fornatural flake to capture market share from synthetic/alternative carbon sources due toimproved product quality and cost advantages. We estimate that by 2020, demand forflake graphite from these markets could exceed 776ktpa, representing a market share of74% (vs Li-Bs at only 26%).Everyone wants exposure to the Li-B market - the fact is the market isn't thatlarge...yet: While demand could increase significantly over the coming decade, this isoffset by the potential for a significant supply side (ex-China) response. We estimateflake graphite demand from the Li-B market at 276kt by 2020, versus potentialproduction from ASX-listed graphite companies targeting the battery market of 440kt.Longer term (by 2025), we estimate that global mined flake graphite supply would needto increase by +350% to 1.7Mtpa to satisfy forecast demand from the Li-B market andtraditional applications.Graphite prices: Our forecasts for a benchmark (95% TGC) graphite product call foraverage "basket" prices of US$770-US$926/t between 2016-2025, compared to currentbasket prices of US$750-850/t. We note that prices have fallen by 50-60% from theirhighs in 2012, despite a ~40% reduction in mined output and evidence of increasingdemand from the both the Li-B and traditional markets.
CGAu Graphite coverage:Syrah Resources (SYR:ASX | Target: A$5.30 from A$6.45 | Rating: SPEC BUY).
For important information, please see the Important Disclosures beginning on page 65 of this document.

2
Investment Summary
Graphite is an essential raw material in Li-Bs – overall graphite demand could grow by
+730% to 2025…
Based on our research in Start me up – electric vehicles and grid storage to drive
lithium demand (18 May’16), we estimate that rapidly increasing sales of Electric
Vehicles (EVs) and continued development of the grid storage industry will drive a
+200% increase in installed Li-B manufacturing capacity to +250GWh by 2020.
Our research indicates an average “battery grade” graphite consumption ratio of
0.92kg/1kWh of Li-B energy capacity dependent on cathode chemistry used.
Based on our modelled growth in the Li-B market (and certain assumptions for
penetration rates for various battery chemistries), we estimate demand for
graphite (synthetic and flake) feedstock from Li-B’s to increase from 140kt in
2015, to +1Mt in 2025, representing a CAGR of 23%.
…but natural flake graphite has competition – opportunity for graphite miners in
battery anode materials is reliant upon a significant shift by end users away from
synthetic
Our research suggests that ~60% of Li-B anode material is sourced from synthetic
graphite, with the current preference for synthetic driven by a desire for consistent
product purity (essential in determining Li-B performance) and low quality Chinese
flake graphite dominating global mined supply. We understand that only 84kt
(from a total market of ~650kt) of natural graphite was used in Li-Bs in 2015.
That said, cost savings associated with Li-B anode material derived from flake
(versus higher priced synthetic) represent a material market opportunity in our
view (Li-B manufacturers continue to target aggressive reductions in battery
costs). If natural flake graphite can achieve a +5% YoY increase in penetration
from current levels of ~40%, to 60% from 2020, annual demand could increase to
792ktpa by 2025, giving natural flake graphite for Li-Bs a 39% share of what
could then be a ~2Mtpa global flake graphite market.
Traditional markets (as dull as they are…) still represent the largest market
opportunity for natural flake graphite in the medium term
Traditional markets for natural graphite comprise recarburisers (carbon additives
used in electric arc furnace [EAF] steel production), foundries, refractories and
other industrial applications (i.e. lubricants, friction products). Together, these
markets accounted for an estimated 86% (+500kt) of demand for natural graphite
in 2015. This compares with a total market share (across synthetic and natural) of
~90% or, 1.7Mt.
Key considerations for natural graphite to capture market share from synthetic
include consistent product purity and competitive costs. That said, our research
suggests a significant market opportunity for increased use of natural flake
graphite through a shift to increasing crude steel production from EAFs, and
displacement of lower quality amorphous graphite in the cast iron market. By
2020, we estimate that demand for natural graphite from traditional markets
could exceed 770kt (versus Li-Bs at ~275kt).
Specialty Minerals and MetalsIndustry Overview
20 November 2016 2

3
Figure 1: Natural flake graphite – breakdown of forecast market share
Source: Company Reports, Canaccord Genuity estimates
The elephant in an already crowded room – everyone wants exposure to Li-Bs but the
market isn’t that large…yet
We note a number of aspiring graphite producers seeking to target the Li-B
market for their production plans – however, based on our estimates of possible
future demand, only 275kt of natural flake will be required by the Li-B sector by
2020. This compares with production from existing and potential new supply (as
per announced project timetables from various ASX-listed companies) of ~440kt.
Figure 2: Potential supply vs demand (Natural graphite)
Source: Company Reports, Canaccord Genuity estimates
We believe the most advanced of this group of companies is Syrah Resources
(SYR:ASX | Rated SPEC BUY), which plan to produce ~340ktpa of graphite
concentrate with first production expected in H2’17. Balama will be the largest
project of its kind ever built, and once at full production, will produce an average
of 25% of global mined output between 2017 and 2020.
In the longer term, we anticipate that the growth of the Li-B sector and potential
for natural flake to capture increased market share in traditional applications
could see demand increase sufficiently to support much of the planned
production being targeted by ASX-listed graphite companies. Our longer term
expectations are for the natural flake graphite market to increase in size by
+100% to ~800kt by 2020, and to +1.7Mt by 2025, representing a CAGR of 16%.
21% 24%30% 35% 38% 39% 40% 40% 41% 41% 40%
21%20%
20% 21% 22% 26% 29% 31% 34% 36% 39%
0%
10%
20%
30%
40%
50%
60%
70%
80%
90%
100%
2015 2016 2017 2018 2019 2020 2021 2022 2023 2024 2025
Ma
rke
t s
ha
re
Recarburisers Foundries Batteries Industrials Lubricants Other
0
200
400
600
800
1000
1200
1400
1600
1800
2000
2200
2017 2018 2019 2020 2021 2022 2023 2024 2025
Na
tru
al
Gra
ph
ite
(k
t)
Fines 75um (200mesh) 150um (100mesh) 300um (50mesh)
Balama Existing Flake Existing Amorp Demand
Specialty Minerals and MetalsIndustry Overview
20 November 2016 3

4
Unusual pricing environment – natural graphite prices falling vis-à-vis supply
reductions and rising demand
We have revised our graphite pricing assumptions across the various product size
fractions (Figure 3), which now calls for an average “basket price” between 2016-
2025 of US$770/t – US$926/t. Revisions represent an average 22% reduction
versus previous basket price assumptions.
In Figure 4, we highlight an unusual pricing dynamic currently evident in the flake
graphite market – despite global (i.e. Chinese) production falling by ~40%, and
evidence of increasing demand from both the Li-B sector and traditional markets,
graphite prices have fallen by 50-60%, suggesting that lower priced substitutes
are capturing market share.
Figure 3: Natural flake graphite basket pricing revisions Figure 4: Historical natural graphite production vs weighted avg
basket price
Source: Company Reports, Canaccord Genuity estimates Source: Industrial Minerals, Benchmark Minerals
CG Graphite Coverage
Syrah Resources (SYR:ASX | Target: A$5.30 from A$6.45 | Rating: SPECULATIVE
BUY)
Appendix I – ASX-listed graphite company overview
Black Rock Mining (BTR:ASX | Not rated) – Mahnege Project, Tanzania
Hexagon Resources (HXG:ASX | Not rated) – McIntosh Project, Western Australia
Kibaran Resources (KNL:ASX | Not rated) – Epanko Project, Tanzania
Magnis Resources (MNS:ASX | Not rated) – Nachu Project, Tanzania
Metals of Africa (MTA:ASX | Not rated) – Montepuez Project, Mozambique
Volt Resources (VRC:ASX | Not rated) – Namangale Project, Tanzania
$0
$200
$400
$600
$800
$1,000
$1,200
2016 2017 2018 2019 2020 2021 2022 2023 2024 2025
Av W
eig
hte
d B
aske
t P
rice
(U
S$
/t)
FO
B
New CGe Old CGe
0
400
800
1200
1600
2000
2400
0
200
400
600
800
1000
1200
'04 '05 '06 '07 '08 '09 '10 '11 '12 '13 '14 '15
Ave
rag
e G
rap
hite
Price
(U
S$
/t)
Est.
Gra
phite P
roductio
n (
kt)
Chinese Amorphous Chinese Flake
ROW Natural Weighted Price
Specialty Minerals and MetalsIndustry Overview
20 November 2016 4
5
Contents
Investment Summary ................................................................................................. 2
Contents ..................................................................................................................... 5
Graphite Fundamentals .............................................................................................. 7
WHAT IS GRAPHITE? ....................................................................................................... 7
SYNTHETIC VS NATURAL ................................................................................................. 7
NATURAL GRAPHITE – MAKING SENSE OF GRADES, FLAKE SIZE, AND PURITY ......... 9
GLOBAL RESOURCES .................................................................................................... 11
Market supply ........................................................................................................... 12
NATURAL GRAPHITE PRODUCTION DOMINATED BY CHINA ........................................ 12
OTHER KEY PRODUCTION SOURCES ........................................................................... 12
PROJECTED SUPPLY - CHINA’S DOMINANCE TO BE CHALLENGED BY HIGHER QUALITY
RESOURCES OUTISDE CHINA?................................................................................ 12
PROJECTED SUPPLY ...................................................................................................... 13
OTHER KEY CONSIDERATIONS ..................................................................................... 15
Market demand - overview ....................................................................................... 17
TRADITIONAL MARKETS THE MAIN SOURCE OF DEMAND; DEMAND GROWING FOR
BATTERIES BUT MARKET REMAINS COMPARATIVELY SMALL .............................. 17
SYNTHETIC DOMINATES BUT OPPORTUNITY FOR NATURAL TO INCREASE MARKET
SHARE ...................................................................................................................... 17
Demand analysis - Lithium-ion batteries .................................................................. 18
LITHIUM ION (Li-B’s) BATTERIES –A RECAP ................................................................. 18
SPHERICAL GRAPHITE – AN OVERVIEW ....................................................................... 19
SYNTHETIC VS NATURAL GRAPHITE ANODES – NATURAL NOW COMPETING ON A
PERFORMANCE BASIS ............................................................................................. 21
HOW MUCH GRAPHITE GOES INTO A LI-B? .................................................................. 22
QUANTIFYING GRAPHITE DEMAND FROM LI-B’s ......................................................... 23
Demand analysis – traditional markets ................................................................... 26
RECARBURISERS – AN OPPORTUNITY FOR NATURAL FLAKE BUT MARKET DOMINATED
BY ALTERNATIVE CARBONS .................................................................................... 26
CAST IRON RECARBURISERS........................................................................................ 29
REPLACING LOW QUALITY AMORPHOUS GRAPHITE IN TRADITIONAL MARKETS ...... 30
REPLACING LOW QUALITY INDUSTRIAL ANODES IN ALUMINUM INDUSTRY ............. 31
OTHER INDUSTRIAL MARKETS ..................................................................................... 32
Other graphite product markets ............................................................................... 33
EXPANDABLE GRAPHITE (50kt produced in 2015). .................................................... 33
Natural graphite demand – putting it all together .................................................... 35
Specialty Minerals and MetalsIndustry Overview
20 November 2016 5

6
Supply vs Demand .................................................................................................... 37
SYR: THE ELEPHANT IN THE ROOM - SUPPLY COULD OUTPACE DEMAND TO 2020 37
EVERYONE WANTS EXPOSURE TO THE LI-B THEMATIC – FACT OF THE MATTER IS
DEMAND IS NOT YET THAT LARGE ......................................................................... 38
Key forecast risks ..................................................................................................... 39
Product Pricing & Forecasts ..................................................................................... 40
NATURAL FLAKE GRAPHITE PRICES STILL FALLING DESPITE LOWER SUPPLY AND
INCREASING DEMAND ............................................................................................. 40
FALLING FEEDSTOCK COSTS FOR SYNTHETIC IMPACTING NATURAL FLAKE PRICES?41
OTHER PRICING INFLUENCES ...................................................................................... 42
ASX Listed Graphite Companies – Peer Comparison ............................................... 43
Company Updates .................................................................................................... 46
Syrah Resources Ltd (SYR:ASX) ................................................................................ 47
Appendix I - ASX Listed Graphite Companies ............................................................ 49
Black Rock Mining Ltd (BKT:ASX) ............................................................................. 50
Hexagon Resources Ltd (HXG:ASX)........................................................................... 53
Kibaran Resources Ltd (KNL:ASX) ............................................................................ 55
Magnis Resources Ltd (MNS:ASX) ............................................................................ 57
Metals of Africa Ltd (MTA:ASX) ................................................................................. 60
Volt Resources Ltd (VRC:ASX) ................................................................................... 62
Specialty Minerals and MetalsIndustry Overview
20 November 2016 6

7
Graphite Fundamentals
WHAT IS GRAPHITE?
Graphite is the hexagonal crystalline form of carbon and occurs naturally as
disseminated crystal flakes in high-grade metamorphic rocks, as veins, and as
microcrystalline ‘amorphous’ graphite associated with metamorphosed coal
seams. Graphite sits in the middle phase of the three forms of carbon between
coal (amorphous carbon) at the lower end of carbon content, and diamond at the
higher end.
Graphite has many properties which lends itself to a number of different uses
across a broad range of product markets. These properties include lubrication,
reactivity, strength and resilience to high temperatures (for use in refractories).
More significantly, graphite has conductive properties (known as reversible
capacity) which makes it suitable for use as an anode material within Li-ion
batteries. Graphite is consumed as a number of different product types and can
be derived from both Natural and Synthetic sources. ‘
SYNTHETIC VS NATURAL
The global graphite market can be broken down into its two key primary sources,
Synthetic, and Natural. Based on an estimated total market size (2015) of
~1.85Mtpa, synthetic graphite represents ~65% of all graphite
production/consumption, with natural graphite comprising the balance of
~650ktpa (Figure 5).
Figure 5: "Family tree" of graphite products and estimated market share in 2015
Source: Industrial Minerals, Company Reports, Canaccord Genuity estimates
Synthetic Graphite
Synthetic graphite is produced when calcined pet coke (CPC) is mixed with a pitch
based binder, baked and extruded into a shape. The shape can be round
(electrode) or block form (mould stock specialty graphite). After baking, the
material is subjected to high temperatures (+2700°C) in order to convert the
carbon to graphite. This process is typically carried out in an Acheson furnace in
which a DC current of low voltage and very high current is applied to the furnace
Graphite
Synthetic
1.2 Mtpa
Primary
0.48 Mtpa
Secondary
0.72 Mtpa
Natural
0.65 Mtpa
Amorphous
0.26 Mtpa
Flake
0.38 Mtpa
Expandable
Spherical
GrapheneVein
<10ktpa
Specialty Minerals and MetalsIndustry Overview
20 November 2016 7

8
charge in an anaerobic (oxygen depleted) environment. This simulates the
“mesophase” melting that occurs in the geological formation of natural graphite.
Within this intermediate process the carbon bonds within the lattice structure re-
orientate and cure to replicate natural graphite. The duration for this process can
be as long as 2-3 weeks due to controlled cooling requirements. Synthetic
graphite typically has fixed carbon levels of >99%, volatiles <0.5% and sulfur
<0.02%. After graphitization the material is classified (screened) to its final
product specifications.
Synthetic graphite can be segmented into primary (direct) applications and
secondary applications that require further manufacturing steps. The primary use
of synthetic graphite (representing 43% market share) is as an electrode for use
in electric arc furnaces in the steel production process. Synthetic graphite also
forms part of the much larger Alternative Carbons Market (includes products
derived from coal or bitumen sources), as well as being used as an anode
material within rechargeable batteries.
Natural Graphite
There are three main forms of natural graphite:
Amorphous Graphite (~ 40% of market): Amorphous Graphite is a seam
mineral formed by the local metamorphism of previously existing anthracite
coal seams rather than a distinct graphite deposit (as for flake graphite).
Amorphous graphite is typically recovered at lower purity than natural graphite
(at ~75-85% total graphitic carbon, or TGC) due to the adhesion of the
graphite crystalline structure with surrounding mineral ash. The affinity of
graphite and ash results in conventional recovery methods such as flotation
that rely on surface properties being highly inefficient.
Mineral processing methods (i.e washing, classification) to recover
amorphous graphite typically result in lower operating costs (<US$200/t) but
produce a lower quality product (~75-85% purity). The “ashing” properties of
amorphous graphite assist in coating and lubricant applications. Amorphous
graphite is unlikely to compete in the same markets as high quality carbon
products.
Figure 6: Amorphous graphite concentrate Figure 7: Large Natural Flake concentrate Figure 8: Vein graphite grading +95% TGC
Source: Reade Advanced Materials Source: Asbury Carbons Source: First Graphite
Flake Graphite: (~59% of market) Crystalline flake graphite is recognizable by
its high metallic lustre, and plate‐like particle morphology. It is formed in
metamorphic rock, in concentrations of 5%‐ 12% carbon content (TGC) in the
ore body. Depending on the metamorphic conditions (heat, pressure,
Specialty Minerals and MetalsIndustry Overview
20 November 2016 8

9
duration) that were present as the deposit formed, gangue materials such as
ash, iron and sulphides can be ‘intercalated’ within the graphite flake
structure, which affects overall product purity. This impacts overall processing
costs (mostly through flotation reagent consumption) and the ability for
potential producers to place their product in higher end applications such as
feedstock to the lithium-ion battery sector.
Concentrate purities for further conversion to spherical graphite are typically
+95% TGC with the level of impurity intercalation a key determinant in the
costly and hazardous requirement for hydrofluoric acid leaching prior to
coating for a broad range of applications (see Spherical Graphite section
below). Our view is this will be a key determinant in a project’s ability to
provide reliable, comparable product that can displace synthetic graphite as
an anode material.
Vein Graphite (<1% of market). Vein graphite is a very high grade crystalline
graphite that contains in-situ grades of over 95% TGC. The only country
producing commercial quantities of material is Sri Lanka with only ~2kt of
material produced from 2 operations. While the benefits of direct whole ore
extraction and superior product pricing (>US$1,500/t) offer attractive project
features the difficulties of extraction through shallow shafts (water ingress,
ventilation, mining rate) present as likely barriers to any major increase to
supply over the short/medium term.
NATURAL GRAPHITE – MAKING SENSE OF GRADES, FLAKE SIZE, AND PURITY
In situ graphite content of an ore deposit is typically quoted as a percentage of
total graphitic carbon (%TGC). However, unlike most other metals and mineral
commodities, tonnes (size) and grades are not the only considerations when
assessing what constitutes an economic deposit.
Flake size and product purity are also other key considerations, which are a
geological feature inherent to the deformation of carbonaceous sediments such
as shales and sandstones within the deposit.
Ore bodies with higher in-situ grades (+10% TGC) such as those found in
Mozambique are usually associated with a finer flake distribution (i.e <100µm).
Conversely, larger flake deposits (50% >180µm) are typical of those found in the
Paleoproterozoic Usagaran Belt within Tanzania, East Africa, albeit at a lower in-
situ grade (<8% TGC).
Figure 9: Natural flake graphite size fractions
Source: Company Reports
In general terms, a higher in-situ grade will result in lower operating costs due to
less processing being required to achieve the same level of purity in the
concentrate. More specifically, processing costs are impacted by the required
amount of flotation stages and reagent consumption which is a function of flake
size distribution.
Due to flotation being a recovery method exploiting graphite’s hydrophobic (water
repelling) properties, cleaner, larger flakes are usually recovered first at higher
purities which is the general trend presented in Figure 10. Additional flotation
Flake Microns Mesh size
Jumbo >300 >48
Large >180 >80
Medium >106 >150
Small >75 >200
Fine <75 <200
Specialty Minerals and MetalsIndustry Overview
20 November 2016 9

10
stages are likely as presented in Figure 11, to increase product purity for natural
flake ore bodies with a greater proportion of fine flake.
Figure 10: Graphite flake size and purity relationship
Source: Company Reports
Natural Graphite production methods
Mining of natural flake graphite is relatively straightforward through the extraction
of ore from sedimentary hosted or metamorphic (schist) deposits. Graphite is
quite friable (i.e. free digging) in nature with deposits typically requiring minimal
blasting.
Dependent on the morphology and weathering within the deposit, flake graphite
can be quite easily liberated from gangue (usually quartz, silica and feldspar)
using conventional crush>grind>float processes as indicated in Figure 11 below.
The end product is a high purity (+95% TGC) graphite concentrate.
The effect of head grade, expressed as % TGC is most apparent when determining
flotation circuit configuration and the quantity of material that will report to the
concentrate product (mass pull). Graphite is well suited to flotation due to being a
hydrophobic mineral (concentrate purities of +95% TGC can generally be achieved
without the need for reagents beyond high quality water and air).
One of the key features to assist aspiring graphite producers to displace current
natural graphite supply is achieving a concentrate purity of +97% TGC. Depending
on the metamorphic conditions (heat, pressure, duration) that were present as the
deposit was formed, gangue materials such as ash, iron and sulphides can be
‘intercalated’ within the graphite flake structure and can’t be removed without the
use of thermal/chemical purification.
Balama
Nachu
McIntosh
EpankoMontepeuz
Mahenge
Namangale
95.5%
96.0%
96.5%
97.0%
97.5%
98.0%
98.5%
99.0%
99.5%
0 50 100 150 200 250
Co
nc
en
tra
te P
uri
ty
(%T
GC
)
Median Flake Size (um)
Specialty Minerals and MetalsIndustry Overview
20 November 2016 10

11
Figure 11: Standard Processing Flowsheet for Natural Flake Graphite concentrate production
Source: Kibaran Resources
GLOBAL RESOURCES
The USGS estimates known global resources at +800Mt of recoverable graphite.
Figure 12 below shows East Africa to host the majority of known global graphite
resources, predominantly the large scale deposits in Mozambique.
Figure 12: Global resources by country (contained graphite)
Source: SNL Mining
Mo
za
mb
iqu
e x
10
Ta
nza
nia
Can
ad
a US
A
Ma
da
ga
sca
r
Sw
ed
en
Au
str
alia
Ma
law
i
Bra
zil
0
5
10
15
20
25
30
35
40
45
Co
nta
ine
d t
e R
es
ou
rce
s (
Mt)
Specialty Minerals and MetalsIndustry Overview
20 November 2016 11

12
Market supply
NATURAL GRAPHITE PRODUCTION DOMINATED BY CHINA
Due to the opaque nature of the industry, updated production data is difficult to
obtain, but it is estimated that global flake graphite production was ~650kt in
2015. This was dominated by Chinese domestic production (~76%, Figure 13)
from operations mainly located in the Shandong, Heilongjiang and Jixi regions of
China. These operations are usually small in size and often prone to poor
environmental practices.
According to Benchmark Minerals (Figure 14), global production is estimated to
have decreased by 45% since 2013, mainly due to the supply of marginal, lower
quality Chinese amorphous production coming under pressure from influences
such as increasing government intervention (i.e. closure of mines), and plateauing
of demand from Chinese steel production.
Figure 13: Global flake graphite production by country (% global market at
650kt) Figure 14: Historical flake graphite production
Source: USGS, Company Reports, Canaccord Genuity estimates Source: Industrial Minerals, USGS, Benchmark Minerals
OTHER KEY PRODUCTION SOURCES
Brazil: Two main companies dominate production - Nacional de Grafite (~70ktpa)
and Grafite de Brasil (~20ktpa). Brazil is endowed with ~2.5Mt reserves of
graphite mostly located in the province of Minas Gerais. Brazilian production is
unlikely to increase materially in the future (i.e. compete with other natural flake
sources) owing to the poor grade (<4%) and flake size distribution (~25% as flake
and 75% as amorphous).
PROJECTED SUPPLY - CHINA’S DOMINANCE TO BE CHALLENGED BY HIGHER
QUALITY RESOURCES OUTISDE CHINA?
China’s dominance in the production of natural graphite is expected to diminish
over the coming years, primarily through the closure of smaller operations (Figure
15) and through competition from emerging sources of higher quality production
from projects mostly located in East Africa.
China -Amorphorus,
40%
China -Flake, 36%
Brazil, 9%
India, 4%
Canada, 2%
Turkey, 5% Other, 5%
0
400
800
1200
1600
2000
2400
0
200
400
600
800
1000
1200
'04 '05 '06 '07 '08 '09 '10 '11 '12 '13 '14 '15
Avera
ge G
raphite P
rice (
US
$/t
)
Est.
Gra
phite P
roduction (
kt)
Chinese Amorphous Chinese Flake
ROW Natural Weighted Price
Specialty Minerals and MetalsIndustry Overview
20 November 2016 12

13
Figure 15: China Natural Graphite production 2012A, 2015E Figure 16: Projected China Natural Graphite production
Source: Industrial Minerals, Roskill Source: Industrial Minerals, Canaccord Genuity Estimates
PROJECTED SUPPLY
Our research indicates that there are +20 natural flake graphite projects globally
(ex-China) which have had various levels of project feasibility completed on them
in the last 4 years (Figure 17). The largest and most advanced of these is Syrah
Resources’ 340ktpa Balama project, located in Mozambique, which is currently
anticipated to achieve first production in mid’17.
Between them, these projects represent a potential +1.7Mtpa of natural graphite
production (versus 2015 global production of ~650ktpa), requiring in excess of
US$2.6bn in capital.
Figure 17: Global development projects
Source: SNL Mining; * See Appendix 1 for company overview ** See company update section
Province Type
Operating
Mines
2012
Production Capacity (ktpa)
2015E
Production
Hunan Amorphous 1 400 510 260
Heilongjiang Flake 9 170 280
Henan Flake 7 70 160
Shandong Flake 7 50 90
Shanxi Flake 2 30 60
Inner Mongolia Flake 2 30 54
Hubei Flake 2 22 22
Hebei Flake 1 8 10
Total 780 1186 500
240
0
50
100
150
200
250
300
350
400
450
500
2016 2017 2018 2019 2020 2021 2022 2023 2024 2025
Nau
tral G
rap
hit
e P
rod
uc
tio
n (
kt)
China - Amorphous China - Flake
Study Date Type Property Country Reporting Company Ticker
Market Cap
($m
AUD/CAD)
Capital Cost
(US$m)
Production
LOM (ktpa)
29/05/15 DFS Balama Mozambique Syrah Resources Ltd.** SYR-AU 892 138 340
24/11/14 PEA Nicanda Hill Mozambique Triton Minerals TON-AU 33 110 300
31/03/16 DFS Nachu Tanzania Magnis Resources Ltd.* MNS-AU 272 269 240
01/09/15 PEA Duwi Malawi Sovereign Metals Ltd. SVM-AU 25 112 111
10/02/16 PEA Montepuez Mozambique Metals of Africa Ltd.* MTA-AU 42 166 100
02/12/15 PEA Oakdale Australia Oakdale Resources Ltd. OAR-AU 7 48 95
23/11/15 PFS Chilalo Tanzania Graphex Mining GPX-AU 18 74 69
02/06/15 DFS Uley Australia Valence Industries Ltd. VXL-AU 23 50 64
06/02/15 DFS Molo Madagascar Energizer Resources Inc. EGZ-CA 31 188 53
22/03/16 PEA Mahenge North Tanzania Black Rock Mining Ltd.* BKT-AU 45 57 52
25/09/15 DFS Lac Gueret Canada Mason Graphite Inc. LLG-CA 151 166 52
15/04/15 PEA McIntosh Australia Hexagon Resources Ltd.* HXG-AU 66 123 50
22/06/16 PEA Matawinie Canada Nouveau Monde Mining NOU-CA 17 144 50
08/08/14 DFS Lac Knife Canada Focus Graphite Inc. FMS-CA 12 166 44
24/06/14 PEA Bissett Creek Canada Northern Graphite Corp. NGC-CA 13 134 44
23/07/15 DFS Epanko Tanzania Kibaran Resources Ltd.* KNL-AU 41 78 44
01/06/15 PEA Albany Canada Zenyatta Ventures Ltd. ZEN-CA 54 411 30
27/11/15 PEA Coosa USA Alabama Graphite Corp. ALP-CA 15 43 15
19/09/16 PEA Campoona Australia Archer Exploration Ltd. AXE-AU 8 36 12
04/03/16 PEA Miller Canada Canada Carbon Inc. CCB-CA 25 44 2
12/10/16 Pre-PFS Namangale Tanzania Volt Resources* VRC-AU 66 TBC Q4'16 TBC Q4'16
TOTAL 1790 2558 1766
*See Appendix 1 for company overview
**See company update section
Specialty Minerals and MetalsIndustry Overview
20 November 2016 13
14
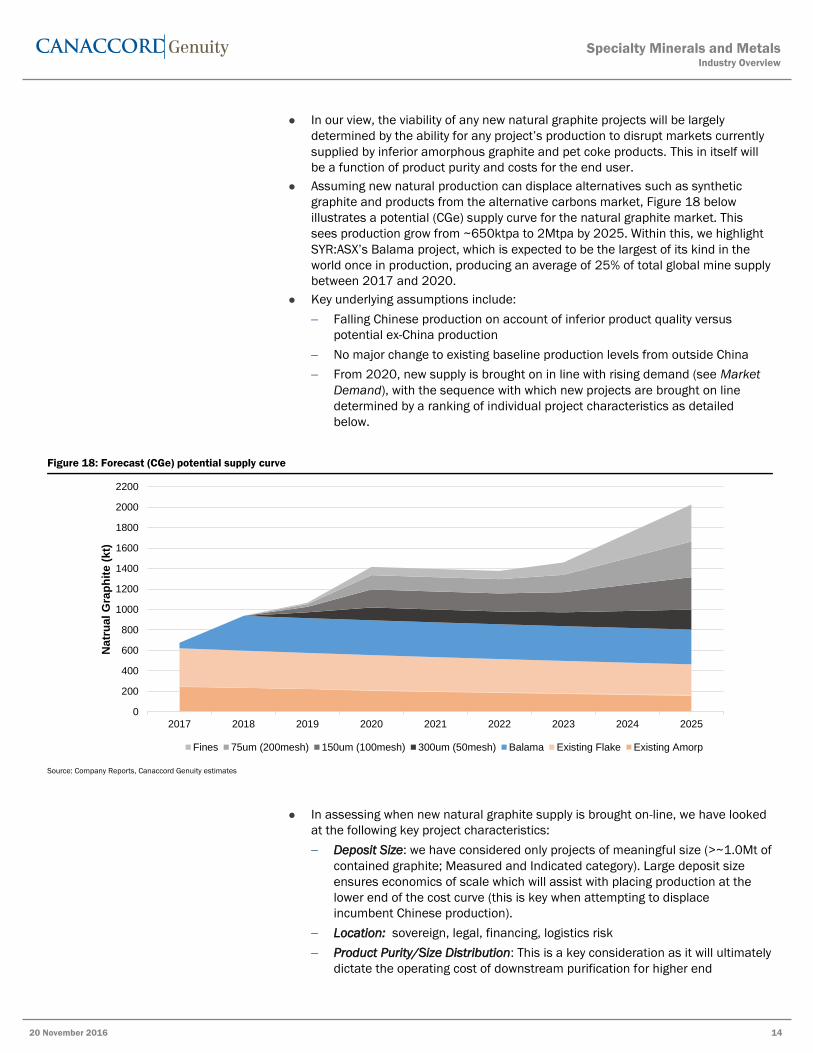
In our view, the viability of any new natural graphite projects will be largely
determined by the ability for any project’s production to disrupt markets currently
supplied by inferior amorphous graphite and pet coke products. This in itself will
be a function of product purity and costs for the end user.
Assuming new natural production can displace alternatives such as synthetic
graphite and products from the alternative carbons market, Figure 18 below
illustrates a potential (CGe) supply curve for the natural graphite market. This
sees production grow from ~650ktpa to 2Mtpa by 2025. Within this, we highlight
SYR:ASX’s Balama project, which is expected to be the largest of its kind in the
world once in production, producing an average of 25% of total global mine supply
between 2017 and 2020.
Key underlying assumptions include:
Falling Chinese production on account of inferior product quality versus
potential ex-China production
No major change to existing baseline production levels from outside China
From 2020, new supply is brought on in line with rising demand (see Market
Demand), with the sequence with which new projects are brought on line
determined by a ranking of individual project characteristics as detailed
below.
Figure 18: Forecast (CGe) potential supply curve
Source: Company Reports, Canaccord Genuity estimates
In assessing when new natural graphite supply is brought on-line, we have looked
at the following key project characteristics:
Deposit Size: we have considered only projects of meaningful size (>~1.0Mt of
contained graphite; Measured and Indicated category). Large deposit size
ensures economics of scale which will assist with placing production at the
lower end of the cost curve (this is key when attempting to displace
incumbent Chinese production).
Location: sovereign, legal, financing, logistics risk
Product Purity/Size Distribution: This is a key consideration as it will ultimately
dictate the operating cost of downstream purification for higher end
0
200
400
600
800
1000
1200
1400
1600
1800
2000
2200
2017 2018 2019 2020 2021 2022 2023 2024 2025
Natr
ual
Gra
ph
ite (
kt)
Fines 75um (200mesh) 150um (100mesh) 300um (50mesh) Balama Existing Flake Existing Amorp
Specialty Minerals and MetalsIndustry Overview
20 November 2016 14

15
applications such as spherical graphite for lithium-ion batteries. In the advent
of an oversupplied market it is our view that products with higher
specifications will be at a distinct competitive advantage with regard to end
user requirements.
Offtake agreements: we consider binding agreements as key in helping attract
both equity and debt finance for new projects.
Stage of development: All other things being equal, the more advanced (i.e.
DFS vs PFS), the sooner the project could be developed.
Capital costs: This considers financing requirements, balance sheet and
quantum of capital expenditure. We estimate that global capital requirements
exceed combined market capitalisation by ~1.5x. With traditional project
finance a rarity in the natural graphite sector, a projects capex/market cap
ratio is a key determinant in the project being able to secure development
funding.
OTHER KEY CONSIDERATIONS
Battery anode supply chain
It is well acknowledged that the lithium ion battery industry contains a labyrinthine
array of suppliers and customers all featuring differing levels of integration along
the supply chain (see Figure 19). This is even more apparent within graphite
where substitute products (natural vs synthetic), additives (silicon influence) and
cathode chemistry (metal oxide blend) all influence the ultimate end use objective
(discharge performance vs safety aspects).
Figure 19: Anode Supply Chain
Source: Washington Post, Canaccord Genuity
Due to the critical performance that the anode plays relative to its low input cost
(~5% of total battery cost in US$/kWh terms) we view that the transition to natural
flake graphite will be progressive and have assumed this to peak at 60% of anode
material by 2020.
We note with interest the challenge for most ASX listed graphite developers to
progress product offtakes to binding status. We view that the recent period of
lowering feedstock prices for synthetic graphite have meant that anode
manufacturers are more willing to take time to qualify potential natural graphite
feedstock rather than commit to quantities and prices from one supplier.
Specialty Minerals and MetalsIndustry Overview
20 November 2016 15

16
Figure 20: Selected ASX Graphite Companies Offtake/Project Status.
Source: Company Reports, Canaccord Genuity
In addition while the economics of integrating downstream to produce spherical
graphite are compelling (our SYR estimates indicate an un-risked 63% EBITDA
margin) we note that internalizing this capability is likely to prolong the product
qualification process which in turn could further delay securing offtake.
Market demand - overview
Key product markets for the graphite (synthetic and natural) market include:
Recarburisers – carbon additives used in steel and cast iron production as a
hardening agent
Foundries – production of metal castings (primarily cast iron)
Refractories – materials used in linings for furnaces, kilns and reactors
Lithium-ion batteries – use as an anode material
Other industrial markets - these include friction products (carbon brushes,
brake pads and hard metals) which utilize graphite’s superior wear properties,
lubricants, and other applications including metallurgical powders, foils and
gaskets.
Figure 21: Key product markets – synthetic vs natural graphite
Source: Company Reports, Canaccord Genuity
Construct
BFS
Pre-PFS
BFS
DFS
PFS
Pre-PFS
0
50
100
150
200
250
300
350
400
SYR MNS HXG KNL MTA BKT VRC
An
nu
al
Fla
ke P
rod
ucti
on
(ktp
a)
Binding Internal Spherical Other Remainder
Graphite
Synthetic
Electrodes for EAF’s
Recarburisers
Friction products
Batteries
Other
Natural
Flake
Recarburisers
Foundries
Batteries
Other
Amorphous
Refractories
Friction products
Foundries
Vein
Friction products
Other
Specialty Minerals and MetalsIndustry Overview
20 November 2016 16

17
TRADITIONAL MARKETS THE MAIN SOURCE OF DEMAND; DEMAND GROWING FOR
BATTERIES BUT MARKET REMAINS COMPARATIVELY SMALL
It is estimated that carbon additives (recarburisers), foundries and refractories
(i.e. traditional carbon market) dominate demand for both synthetic and natural
graphite with a total +90% of market share. Splitting out natural graphite,
recarburisers, refractories and foundries consume half (~80%, or ~500ktpa) of all
natural graphite produced.
The emergence of the lithium-ion battery sector has seen demand for graphite
(synthetic + natural) for use in battery anodes increase by an estimated ~40%
from 2014-2016 to ~200kt. However, we point out that compared with traditional
carbon markets, batteries represent only a relatively small proportion of the
market with a current estimated market share of 11%, of which <50% (~100kt) is
derived from natural sources.
Figure 22: Synthetic graphite demand (2015) breakdown by end use Figure 23: Natural graphite demand (2015) breakdown by end use
Source: Benchmark Minerals, Company Reports, Canaccord Genuity Source: Benchmark Minerals, Company Reports, Canaccord Genuity
SYNTHETIC DOMINATES BUT OPPORTUNITY FOR NATURAL TO INCREASE MARKET
SHARE
We note that synthetic graphite is currently the dominant graphite product used in
these end-markets (1.1Mt vs 0.65Mt in 2015). In our view, the potential for
natural graphite to displace existing synthetic graphite and/or capture any
increase in demand is reliant on key considerations including consistent product
purity, performance and cost.
We understand synthetic graphite to cost >US$10,000/t dependent on
application, with input energy the key cost driver. This is more likely to be in the
range of US$12,000 – 20,000/t to produce a product for the battery anode
market compared with ~US$7,000/t for coated natural flake as presented in
Figure 25.
We highlight in Figure 59 that falling energy costs have likely influenced the
demand for flake graphite over the last several years contributing to suppressed
pricing.
43%
32%
8%
7%
4%6%
Electrodes Synthetic Carbon
Graphite Blocks Li-ion Battery Anodes
Synthetic Carbon Other Other
29%
22%19%
12%
11%
7%
Recarburisers Refractories Batteries
Industrials Lubricants Other
Specialty Minerals and MetalsIndustry Overview
20 November 2016 17

18
Figure 24: Comparison of Anode Materials for Li-ion batteries Figure 25: Cost Breakdown of Coated spherical graphite
Source: The outlook for EVs and future potential demand for graphite Christoph Frey - Managing Director
ProGraphite GmbH Source: Company Reports, Canaccord Genuity estimates
That said, we highlight that the historic preference for the use of synthetic
graphite in key end markets appears to be driven by poor quality natural
production (high proportion of amorphous graphite), compounded by recent
decreases in Chinese production. On this basis, we acknowledge an
opportunity for higher quality flake production from outside China to capture
existing market share and/or incremental demand growth.
Demand analysis - Lithium-ion batteries
LITHIUM ION (Li-Bs) BATTERIES –A RECAP
In Start me up – electric vehicles and grid storage to drive lithium demand (18
May’16), we outlined the key principles of how Li-Bs work, and the raw materials
required for the various battery components. As a recap:
Li-Bs all contain a positive cathode, a negative anode, and an electrolyte which as
acts as the conductor of Li ions as they move back and forth between the
cathode and anode during charge and discharge cycles.
The cathode is manufactured from a lithium-metal oxide compound, while the
anode is manufactured from a porous carbon (graphite). Graphite used in the
anode is derived from both synthetic and natural sources, shaped into
spheres to improve density and hence energy storage characteristics (i.e.
tapping density). A larger proportion of synthetic graphite has historically been
used (ratio can vary widely depending on the specific battery chemistry
employed by the anode manufacturer’s preferences; we understand the
market in 2015 to be ~70% synthetic in use as anode material currently) due
to its more consistent purity characteristics.
Material Energy Life Power Safety Cost
Synthetic Very Good Good Moderate Good Moderate
Natural Flake Very Good Moderate Moderate Moderate Very Good
Meso Phase Moderate Very Good Very Good Very Good Moderate
Hard Carbon Moderate Very Good Very Good Very Good Moderate
Soft Carbon Moderate Good Very Good Very Good Good
0
1000
2000
3000
4000
5000
6000
7000
Inp
ut
Ite
m U
S$/t
coated margin coatinguncoated margin acid purificationspheronising flake
Specialty Minerals and MetalsIndustry Overview
20 November 2016 18

19
Figure 26: Ionic flow in a Li-B
Source: Battery University
SPHERICAL GRAPHITE – AN OVERVIEW
Spherical graphite is the physically and chemically altered form of natural graphite
that is used in the manufacture of carbon anodes for use in Li-Bs. A contained
purity of 99.95% TGC is essential for battery use, which requires a graphite
feedstock grade of +95% TGC.
The conventional processing route for producing spherical graphite involves the
following key processing steps (Figure 27) and is explained in further detail below.
Figure 27: Process Flowsheet for Spherical Graphite Production from Mine Site (Red) to Spherical Plant (Blue)
Source: Company Reports, Canaccord Genuity
Specialty Minerals and MetalsIndustry Overview
20 November 2016 19
20
Milling: the natural flake feed (-100 US mesh or 150 µm) is milled to a
product size for spherodisation of d50 (50% passing). A jet milling reduces
particle size on a ratio of ~5:1.
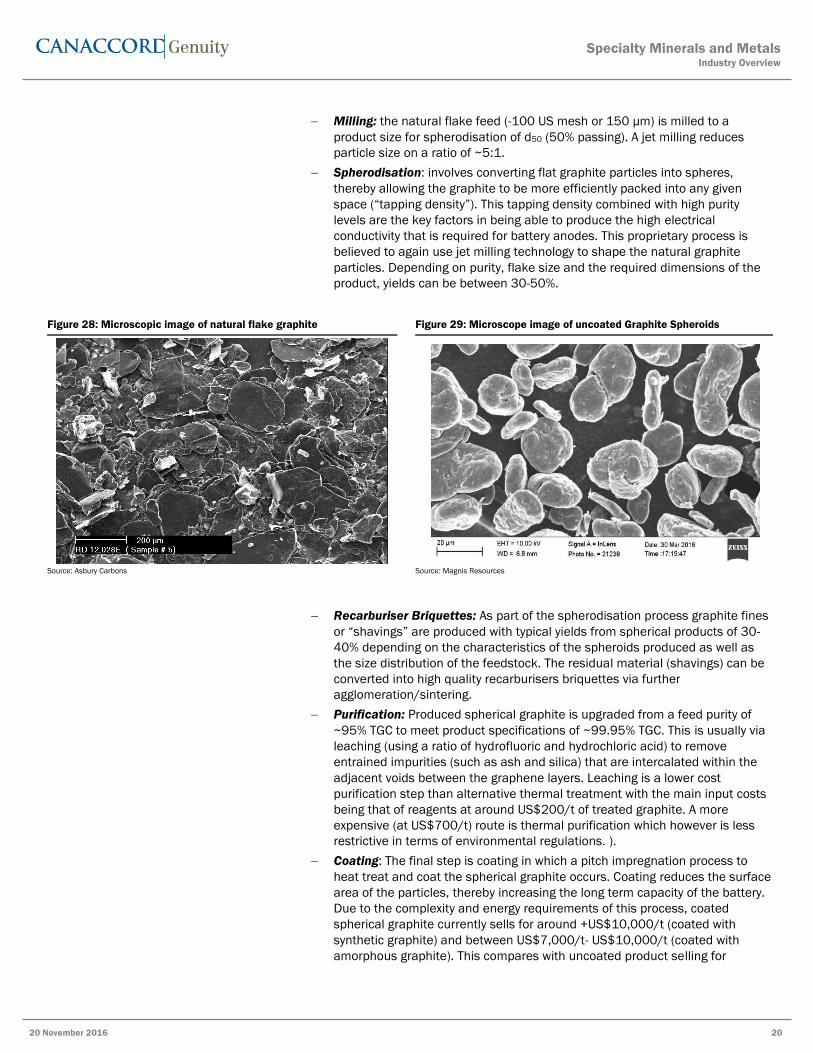
Spherodisation: involves converting flat graphite particles into spheres,
thereby allowing the graphite to be more efficiently packed into any given
space (“tapping density”). This tapping density combined with high purity
levels are the key factors in being able to produce the high electrical
conductivity that is required for battery anodes. This proprietary process is
believed to again use jet milling technology to shape the natural graphite
particles. Depending on purity, flake size and the required dimensions of the
product, yields can be between 30-50%.
Figure 28: Microscopic image of natural flake graphite Figure 29: Microscope image of uncoated Graphite Spheroids
Source: Asbury Carbons Source: Magnis Resources
Recarburiser Briquettes: As part of the spherodisation process graphite fines
or “shavings” are produced with typical yields from spherical products of 30-
40% depending on the characteristics of the spheroids produced as well as
the size distribution of the feedstock. The residual material (shavings) can be
converted into high quality recarburisers briquettes via further
agglomeration/sintering.
Purification: Produced spherical graphite is upgraded from a feed purity of
~95% TGC to meet product specifications of ~99.95% TGC. This is usually via
leaching (using a ratio of hydrofluoric and hydrochloric acid) to remove
entrained impurities (such as ash and silica) that are intercalated within the
adjacent voids between the graphene layers. Leaching is a lower cost
purification step than alternative thermal treatment with the main input costs
being that of reagents at around US$200/t of treated graphite. A more
expensive (at US$700/t) route is thermal purification which however is less
restrictive in terms of environmental regulations. ).
Coating: The final step is coating in which a pitch impregnation process to
heat treat and coat the spherical graphite occurs. Coating reduces the surface
area of the particles, thereby increasing the long term capacity of the battery.
Due to the complexity and energy requirements of this process, coated
spherical graphite currently sells for around +US$10,000/t (coated with
synthetic graphite) and between US$7,000/t- US$10,000/t (coated with
amorphous graphite). This compares with uncoated product selling for
Specialty Minerals and MetalsIndustry Overview
20 November 2016 20

21
US$3,000/t -US$4,000/t. We understand the coating stage costs to be
around US$2000/t (~25% of processing costs as presented in Figure 25).
Classification: Once coating has occurred a producer will plan to split the
spherical graphite product into various size fractions as specified by the
anode customer. For example a d50 of 23µm for grid storage applications and
a d50 of 16µm and 10µm for use in EV/Hybrid vehicles and consumer
electronics are examples of particle size specifications.
SYNTHETIC VS NATURAL GRAPHITE ANODES – NATURAL NOW COMPETING ON A
PERFORMANCE BASIS
The ability to customize synthetic graphite is in direct contrast to the natural
variability of flake graphite, and perceived as a potential limitation to the broad
range use of lower cost spherical natural graphite in battery anodes. That said,
continual refinements to the production process have seen the performance of
spherical natural flake graphite improve to now be comparable with synthetic
graphite.
Figure 30 and 31 below compare the reversible capacity of natural graphite and
synthetic, with natural being >360mAh/g which approaches theoretical limits of
372mAh/g. This suggests that on a like for like purity basis, natural graphite can
compete with synthetic graphite in determining battery performance.
Figure 30: Reversible Capacity of Synthetic Graphite -363 Ah/kg Figure 31: Reversible Capacity of Natural Spherical Graphite
Source: Focus Graphite Source: Focus Graphite
A key limiting factor of battery performance is the formation of solid electrolyte
interface (SEI, Figure 32 & 33), which initially coats the graphite anode to offer
protection against solvent degradation (within the electrolyte) at higher voltages.
SEI is essentially formed on the graphite surface, hence the irreversible charge
loss on the first cycle will be dictated by the properties of the surface area that is
exposed to the electrolyte solution. These properties include particle size, coating
thickness, crystallographic structure and particle morphology (shaping etc).
Specialty Minerals and MetalsIndustry Overview
20 November 2016 21

22
Figure 32: Representation of Graphite Degradation Figure 33: Solid Electrolyte Interface at the Anode
Source: Norwegian University of Science and Technology Source: Norwegian University of Science and Technology
Each anode application will have specific material requirements which will
influence the preferred source of graphite (natural or synthetic). It should also be
noted that this is likely to influence the product qualification process (duration,
consistency, limits) that new sources of natural flake will encounter to take
market share from synthetically produced graphite.
Our research suggests that ~40% of ~100kt of anode material is derived from
spherical natural flake graphite. The remaining 60% is from a source of synthetic
graphite materials which will depend on the specific performance required (see
Figure 24). Early stage test work from a number of graphite companies indicates
that coated natural flake graphite products have comparable if not superior
discharge performance versus synthetic graphite.
HOW MUCH GRAPHITE GOES INTO A LI-B?
In Start me up – electric vehicles and grid storage to drive lithium demand we
investigated the composition of raw materials used in the various types of Li-B
(based on varying cathode chemistry, Figure 34).
Figure 34: Li-B variants based on cathode chemistry
Source: Battery University
We have reviewed the material specification sheets of a number of established
battery manufacturers’ products to determine the bills of materials for Li-B types
as presented in Figure 36 below. This indicates that on average 0.92kg/kWh of
coated graphite is required in spherical natural flake or synthetic form. From this
work, we see that the non-nickel based cathode chemistries use the most
graphite with Lithium Cobalt Oxide (LCO), Lithium Manganese Oxide (LMO) and
Lithium Iron Phosphate (LFP) batteries requiring the most amount of graphite per
Short Fom LCO LMO LFP NMC NCA
Specific Energy Excellent Good Fair Excellent Excellent
Specific Power Fair Good Excellent Excellent Good
Heat Capacity (J/g) 1100 820 300 850 950
Safety Fair Good Excellent Good Fair
Performance Good Fair Good Good Good
Life Span Fair Fair Excellent Good Good
Cost Good Good Good Good Fair
In use since 1991 1995 1996 2003 1999
Voltage 3.60V 3.70V 3.30V 3.60V 3.0V
Cycles 1000 700 2000 1500 500
ApplicationsMobile Phones,
laptops, camera
Power tools, medical
devices
Large Scale (grid
storage), Buses
E-Bikes, EV's
(performance)
E-Bikes, EV's (range),
disposable
Lithium Nickel Cobalt
Aluminium OxideBattery Chemistry
Lithium Cobalt
Oxide
Lithium Manganese
Oxide
Lithium Iron
Phosphate
Lithium Nickel
Manganese Cobalt
Specialty Minerals and MetalsIndustry Overview
20 November 2016 22

23
kWh versus Lithium Nickel Cobalt Aluminium Oxide (NCA) which only uses
0.66kg/kWh.
Figure 35: Bill of Materials for standardized Li-ion battery (contained graphite shown in kg/kWh).
Source: Company Reports, Canaccord Genuity, SAFT, LG Chemicals, BYD, Panasonic
QUANTIFYING GRAPHITE DEMAND FROM LI-B’s
Expectations for significant growth in the Li-B market driven by e-transport and grid
storage
Figure 36 below illustrates our modelled installed battery energy capacity from the
electric transport (EV’s, e-buses etc), grid storage, and electronic device markets
(for further detail, see Start me up – electric vehicles and grid storage to drive
lithium demand).
We anticipate that the electric vehicle/electric transport markets will be the key
driver of demand for Li-B’s, with an estimated CAGR of installed battery energy
capacity across the electric transport market of 24% to 2025, and a CAGR of 20%
across the entire Li-B sector.
Figure 36: Li-B energy requirements across Segments
Source: Company Reports, Canaccord Genuity estimates
1.32
0.95
1.16
0.85 0.66
0.00
1.00
2.00
3.00
4.00
5.00
6.00
7.00
8.00
LCO LMO LFP NMC NCA
kg
pe
r k
Wh
Graphite Lithium Carbonate Steel Nickel Managense Copper Cobalt Aluminium
0
100
200
300
400
500
600
700
800
2014 2015 2016 2017 2018 2019 2020 2021 2022 2023 2024 2025
Ins
tall
ed
En
erg
y (
GW
h)
E-Motorbikes E-Scooters E-Bikes Battery Electric Bus Electric Vehicle - Large
Electric Vehicle - Small Plug-In Vehicle Hybrid Vehicle Other Electrical Devices Personal Computing
Smart Phones Mobile Phones Stationary Residential
Specialty Minerals and MetalsIndustry Overview
20 November 2016 23

24
Based on the above, we estimate total battery capacity requirements of +250GWh
by 2020, representing a CAGR of 21% from 2015. To support this, we further
estimate an additional ~150GWh of battery manufacturing capacity will be
required by 2020 alone, in the absence of any material impacts of battery
recycling and/or adoption of new battery chemistries/technologies. This is
illustrated in Figure 37, which shows global announced/required battery
manufacturing capacity estimates to 2020.
Figure 37: Installed battery manufacturing capacity (GWh)
Source: Company Reports, Canaccord Genuity estimates
Not all Li-B’s are created equal – specific graphite demand for Li-B’s based on
battery chemistry
Our modelled forecasts for the growth in the e-transport and grid storage sectors
are based on the various Li-B battery chemistries as shown in Figures 35 and 36
above (i.e. different batteries are used in different applications). Based upon our
projected installed battery capacity, we have broken this down into projected
demand (in GWh of installed capacity) according to cathode chemistry (Figure 38).
Figure 38: Installed Battery Capacity by Cathode type
Source: Company Reports, Canaccord Genuity estimates
0
20
40
60
80
100
120
140
160
180
200
220
240
260
2014 2015 2016 2017 2018 2019 2020
Ins
talle
d C
ap
ac
ity (
GW
h)
Samsung SDI LG Chem
BYD Telsa
Pansonic Optimium Nano
CATL Boston Power
Electrovaya Faraday
Damlier Additional China
Additional ex China Various Current Chinese
Gigafactory Output (GWh) Gigafactory Output (EV's only; GWh)
0
100
200
300
400
500
600
700
2014 2015 2016 2017 2018 2019 2020 2021 2022 2023 2024 2025
Ins
tall
ed
Cap
ac
ity
(GW
h)
LCO LMO LFP NMC NCA
Specialty Minerals and MetalsIndustry Overview
20 November 2016 24

25
Use of natural graphite in Li-B’s will depend on a significant shift away from
synthetic
Based upon our projections for Li-ion battery demand depending on the various
cathode chemistries and graphite raw material requirements, we have estimated
the required demand for natural flake graphite in Figure 39 below. This shows
that demand for flake graphite from the Li-B market could grow by a CAGR of 25%
from 2015 to 2025 to 792kt (from ~84kt).
Figure 39: Natural Flake Demand from the Li-ion battery market
Source: Canaccord Genuity estimates
As part of our projections, we have assumed a spherical graphite yield (from
natural flake feedstock) of 40% increasing to 50% by 2020 (based on an
assumption that production processes improve and higher volumes of higher
quality non-Chinese flake feedstock). Against this we present three scenarios
relating to the penetration rates of natural graphite as battery anode material;
Business as usual (40%): This projects a business as usual scenario whereby
Natural flake graphite only supplies 40% of all future battery anode material.
In this case we forecast natural graphite demand to double from ~80kt in
2015 to ~180ktpa in 2020 and to ~200ktpa by 2025, implying a CAGR of
20%.
Mid Case (50%): For comparison we have forecast the impact of 50% of
battery anode being from natural flake from 2016-2025. This implies a CAGR
of 23% to 2025 with 660kt of natural flake expected by this stage.
Base Case (60% from 2020): Under this scenario we assume that the cost
savings associated with using spherical graphite derived from natural flake
(~US$7/kg vs +US$10/kg) will translate to a rapid shift in preference away
from synthetic graphite. We also assume that as further test work validates
performance characteristics, acceptance of naturally sourced anode materials
will become more widespread. This is expected to translate to a 5% YoY
increase in natural flake use from 40% to 60% from 2020 onwards. Under our
base case, we forecast natural graphite demand to more than treble from
~80kt in 2015 to ~300ktpa in 2020 and to ~820ktpa by 2025, implying a
CAGR of 26%.
0
100
200
300
400
500
600
700
800
900
2015 2016 2017 2018 2019 2020 2021 2022 2023 2024 2025
An
nu
al
De
ma
nd
(k
tpa
)
Business as Usual 50% Base Case
Specialty Minerals and MetalsIndustry Overview
20 November 2016 25

26
Demand analysis – traditional markets
Traditional markets for graphite include recarburisers (steel production), foundries
(metal casting), refractories, lubricants, and other industrial applications such as
friction products. Within these markets, we have identified four key opportunities
for increased demand for natural flake:
Adoption of electric arc furnaces in crude steel production.
Replacement of lower-quality recarburisers in cast iron production.
Replacement of lower-quality amorphous graphite in traditional markets
Replacement of lower-quality industrial anodes in aluminum smelting
RECARBURISERS – AN OPPORTUNITY FOR NATURAL FLAKE BUT MARKET
DOMINATED BY ALTERNATIVE CARBONS
Recarburisers are additives in the steel and cast iron production process that are
used to adjust carbon content and hardness properties. Recarburisers for steel
production and foundries currently account for an estimated ~31% of total
graphite (synthetic and natural) demand, and ~45% of demand for natural flake.
The recarburiser market is estimated at ~3Mtpa, of which 76% is attributed to
Gray Iron and Ductile Iron production, and 24% to electric arc furnace (EAF) steel
production (Figure 40). The supply of carbon products into this market is
dominated by Alternative Carbon sources including metallurgical coke, pet coke
and synthetic graphite, with ~195ktpa of natural graphite currently used (despite
recent falls in natural graphite prices).
Figure 40: Global recarburiser market breakdown Figure 41: Recarburiser market by carbon source
Source: Company reports, Canaccord Genuity estimates Source: Company reports, Canaccord Genuity estimates
In our view, these segments are likely to continue to be the foundation market for
natural flake graphite on the basis that it contains lower sulphur and other
impurities, and is expected to increase in use as regulatory and customer
requirements in these markets become more stringent.
Demand -EAF, 24%
Demand -Gray, 47%
Demand -Ductile,
29%
13%
4%
4%
79%
Synthetic Natural Flake
Amorphorus Alternative Carbon
Specialty Minerals and MetalsIndustry Overview
20 November 2016 26

27
Growth in EAF steel production a positive for natural graphite recarburisers
Global steel production is currently ~1.6Btpa, with global demand for steel directly
correlated with gross domestic product. China produces ~50% of world crude
steel, with an annual CAGR from 2000-2015 of 12%. This compares with global
(ex-China) CAGR’s of 2%.
Figure 42: Historical crude steel production profile 2000-2015 Figure 43: Global steel production – BOF vs EAF
Source: World Steel Association Source: World Steel Association
The global steel industry has undergone significant change over the past two
decades as steel production from EAFs has increased significantly (in volume
terms), driven by an increase in environmental regulations in the developed world
and the increased capacity to process recycled steel. Of the global crude steel
market, approximately 28% is now produced via EAF (6% in China), which has
increased by +80% in the last 10 years in absolute terms (Figure 43).
Due to the ability to use larger volumes of scrap steel, EAF offer several
advantages over basic oxygen furnaces (BOF) including:
Lower carbon emissions
Lower raw material requirements
Lower energy requirements
Lower capital intensity
While the use of graphite as a recarburiser in BOFs is limited (autogenous
oxidation and difficulties with furnace ignition using graphite), the growth of EAF
steel production offers a potential market opportunity for natural graphite. EAFs
require higher purity recarburisers, which gives natural graphite carbon additives
a clear advantage given superior purity levels (+95% TGC vs met coke at ~85%
TGC).
However, major shift from BOF to EAF not yet evident
Tighter environmental standards in China and around the world could provide
impetus for increased conversion to EAF (e.g. China’s commitment to cut CO2
emissions by 60-65% of GDP by 2030 as part of 2016 Paris Climate Agreement),
with other factors including increased supply of scrap/recycled steel and better
electric energy supplies.
However, we note that only 6% of steel production in China (representing 3%
share of global production) comes via EAF. A large-scale conversions of BOF to
EAF steel production in China does not yet appear evident, while on a global scale,
we note that the global market share of EAF steel production has remained largely
unchanged since 2010 (Figure 43).
38% 36%36%
34%29%
29%
31%33% 30%
24%
25%32%
27%25%
26%26%
0
200
400
600
800
1000
1200
1400
1600
1800
2000 2001 2002 2003 2004 2005 2006 2007 2008 2009 2010 2011 2012 2013 2014 2015
m t
on
ne
s
BOF EAF
Specialty Minerals and MetalsIndustry Overview
20 November 2016 27

28
Quantifying natural graphite demand from recarburisers (EAF steel production)
Figure 44 details assumptions used as the basis for our demand projections for
natural flake from the EAF recarburiser market.
Figure 44: Crude steel segment assumptions
Source: Global Castings Magazine, company reports, Canaccord Genuity estimates
Figure 45 highlights two scenarios for possible growth in natural flake demand
from crude steel production. These include growth to ~330kpta by 2020 (vs
~300ktpa for Li-Bs) if natural flake graphite accounts for 50% of all new
recarburiser demand, and growth to ~280kpta by 2020 if the adoption rate to
convert from EAF to BOF grows at 10% CAGR. Under these scenarios, steel
production via EAF would be 44% globally and 19% in China by 2020 versus
current estimates of 28% globally and 6% in China.
Figure 45: Forecast natural flake graphite demand from crude steel segment (2012-2020e)
Source: Company reports, Canaccord Genuity estimates
Historic Forecast
Base Case Parameters 2 0 10 - 2 0 15 Global ( ex C hina) C hina
Crude Steel Production Grow th Rate % CAGR 5.0% 2.00% 2.00%
Adoption to EAF Furnaces ∆% YoY 1.3% 2.50% 1.50%
Carbon Addition in EAF Furances* 0.15% 0.15%
Scenario 1 - Peneration of new growth
Base Case % Natural f lake 7.6%
Low Case -10% peneration % Natural f lake 10% 10%
High Case - 50% peneration % Natural f lake 50% 50%
Scenario 2 - Adoption to EAF Furnaces
Base Case ∆% YoY 2.5% 1.5%
Low Case Grow th ∆% YoY 5.0% 5.0%
High Case Grow th ∆% YoY 10% 10%
0
50
100
150
200
250
300
350
0
500
1000
1500
2000
2500
3000
3500
2012 2013 2014 2015 2016 2017 2018 2019 2020
Fla
ke G
rap
hit
e D
em
an
d (k
pta
)
Glo
bal R
ecarb
usie
r D
em
an
d (
ktp
a)
Ductile Iron - ex.China Ductile Iron - ChinaGray Iron - ex.China Gray Iron - ChinaEAF - ex.China EAF - ChinaLow Case -10% peneration High Case -50% penerationLow Case Growth - 5% adoption High Case Growth -10% adoptionBase Case - Business as Usual
Specialty Minerals and MetalsIndustry Overview
20 November 2016 28

29
CAST IRON RECARBURISERS
Cast iron production provides a strong source of demand for recarburisers
through the inherent requirement for higher carbon content additives versus other
ferroalloys. Cast iron is usually produced in EAFs through the melting of pig iron
along with other input materials such as scrap iron, limestone and coke. Within
this process it is necessary to adjust carbon levels depending on the type of cast
required. These usually range between 2-4%.
Gray iron: This is a lower-quality ferroalloy that requires carbon in the form of
graphite (flake or highly refined coke products) and silicon to create a
graphitic microstructure within the melting iron. It is estimated only 12.5% of
carbon feed is from natural flake graphite.
Ductile iron: This is a higher-quality ferroalloy that possesses superior material
properties than gray iron (ductility, malleability, strength) due to the graphitic
microstructure within the melting iron. The shape of the graphite is in the form
of spheroids due to the addition of magnesium or cerium. As a result, carbon
content is typically higher than gray iron – due to the requirement for graphite
spheroids, ductile iron is more susceptible to impurities. This results in high-
purity natural flake graphite being less likely to be displaced by lower-quality
alternative carbons or amorphous graphite.
Figure 46: Historical cast iron production by product type Figure 47: Cast iron segment assumptions
Source: Global castings Magazine Source: Global Casting Magazine, company presentations, Canaccord Genuity estimates
Figure 48 highlights two scenarios for possible growth in natural flake demand
within the cast iron recarburiser market. These include growth to ~400kpta by
2020 if natural flake graphite accounts for 100% of all new recarburiser demand
from ductile iron, and growth to ~340kpta by 2020 if natural flake graphite
accounts for 50% of all new recarburiser demand from gray iron. If both of these
scenarios were to occur, then natural flake graphite would account for 25% of the
cast iron recarburiser market (1.6Mtpa) by 2020, up from our current estimate of
~5%. Our forward base case forecasts assume 3%.
Historic Forecast
Base Case Parameters 2010-2015 Global (ex China) China
Gray Iron Grow th* % CAGR 3.20% 3.00% 3.00%
Ductile Iron Grow th* % CAGR 2.5% 3.00% 3.00%
Carbon Addition - Gray Iron % Carbon 3.00% 3.00%
Carbon Addition - Ductile Iron % Carbon 3.50% 3.50%
Gray Iron Scenarios
Base Case % Natural f lake 7.6%
Low Case -10% peneration % Natural f lake 10% 10%
High Case - 50% peneration % Natural f lake 50% 50%
Ductile Iron Scenarios
Base Case % Natural f lake 7.6%
Low Case -50% peneration % Natural f lake 50% 50%
High Case - 100% peneration % Natural f lake 100% 100%
Specialty Minerals and MetalsIndustry Overview
20 November 2016 29

30
Figure 48: Forecast natural flake graphite demand from cast iron segment (2012-2020e)
Source: Company reports, Canaccord Genuity estimates
REPLACING LOW-QUALITY AMORPHOUS GRAPHITE IN TRADITIONAL MARKETS
We have combined the high-growth demand projections from the steel and cast
iron segments to evaluate a feasible upper demand limit for natural flake graphite
in the recarburiser market. This is presented in Figure 51 indicating up to
~700kpta of demand is expected by 2020, which would be an increase in total
market penetration of natural flake in the recarburiser market from ~7% to 20%.
Figure 49: Historical natural graphite supply to recarburisers Figure 50: High-demand growth assumptions
Source: Benchmark Minerals, USGS, Canaccord Genuity estimates Source: Benchmark Minerals, USGS, Canaccord Genuity estimates
While it’s conceivable that natural flake graphite will represent the majority of
growth in demand, the influence of amorphous graphite supply in China must be
considered. Our estimates of the historical composition of the supply of natural
graphite to the recarburiser market is presented in Figure 49. This indicates the
0
50
100
150
200
250
300
350
400
450
0
500
1000
1500
2000
2500
3000
3500
2012 2013 2014 2015 2016 2017 2018 2019 2020
Fla
ke G
rap
hit
e D
em
an
d (k
pta
)
Glo
ba
l R
ecarb
us
ier
Dem
an
d (
ktp
a)
Ductile Iron - ex.China Ductile Iron - ChinaGray Iron - ex.China Gray Iron - ChinaEAF - ex.China EAF - ChinaLow Case -50% Ductile Iron High Case -100% Ductile IronLow Case -10% Gray Iron High Case -50% Gray IronBase Case - Business as Usual
Global China
Electric Arc Furnaces
Peneration of new grow th % Natural f lake 50% 50%
Adoption rate to EAF Furnaces % CAGR 10% 10%
Gray Iron
Grow th Rate % CAGR 3% 3%
Peneration of new grow th % Natural f lake 50% 50%
Ductile Iron
Grow th Rate % CAGR 3% 3%
Peneration of new grow th % Natural f lake 50% 50%
Natural Graphite Type
Current % Natural f lake 58% 58%
Low Case % Natural f lake 50% 50%
High Case % Natural f lake 100% 100%
Specialty Minerals and MetalsIndustry Overview
20 November 2016 30

31
shift over the last few years to flake graphite in preference to amorphous as a
result of falling prices and the forced shutdown of lower-quality projects in China.
We have assumed for the purposes of our forecasting that growth in demand for
natural graphite will be via the capture of new demand rather than widespread
displacement of alternative carbons in the present market. This approach has
also been used to reflect the elasticity of supply that has occurred in recent years
as alternative carbons have substituted natural flake graphite.
We currently estimate flake (versus amorphous) comprising ~58% of overall
natural graphite supply to the recarburiser market, so have run low and high
scenarios of future natural flake graphite supply of 50% and 100%. The low
scenario captures any synthetic graphite that may compete with natural flake in
the future given we have assumed that the contribution of amorphous graphite to
the recarburiser market will be negligible.
Based on this analysis, we estimate that natural flake graphite demand for the
recarburiser sector as a whole will grow from ~130kt in 2015 to ~400kt in 2020,
with a CAGR of 20% to 2025 for 817t.
Figure 51: Forecast natural flake graphite demand – high-growth and adoption in each segment
(2012-2020e)
Source: Company reports, Canaccord Genuity estimates
REPLACING LOW-QUALITY INDUSTRIAL ANODES IN ALUMINUM INDUSTRY
Petroleum coke is currently the preferred feedstock for large carbon-based
anodes in aluminium smelting due to the high purity (low sulphur, ash) required
– this precludes amorphous graphite and lower-quality flake graphite from being
used.
The Hall-Héroult method is the major industrial process for smelting aluminum
and typically consumes 450kg of anode per metric tonne of aluminum produced.
With an estimated ~60Mt of aluminium produced globally in 2015, the
addressable market is significant. That said, calcined petroleum coke is likely to
remain a preferred source of carbon due to pricing being <US$250/t, lower than
the marginal cost of production for any natural flake graphite producer.
0
100
200
300
400
500
600
700
800
0
500
1000
1500
2000
2500
3000
3500
2012 2013 2014 2015 2016 2017 2018 2019 2020
Fla
ke G
rap
hit
e D
em
an
d (k
pta
)
Glo
ba
l R
ecarb
us
ier
Dem
an
d (
ktp
a)
Ductile Iron - ex.China Ductile Iron - China
Gray Iron - ex.China Gray Iron - China
EAF - ex.China EAF - China
Low Case - 50% Flake High Case - 100% Flake
High Growth at current
Specialty Minerals and MetalsIndustry Overview
20 November 2016 31

32
Figure 52: Calcined petroleum coke pricing – 2016
Source: Platts
OTHER INDUSTRIAL MARKETS
These markets combined represented an estimated ~36% (or ~230kt) of natural
flake demand.
Within our demand estimates for natural flake graphite we have assumed that
smaller segments of the industrial markets such as friction products and
lubricants will grow at historic rates of ~2%, in line with global GDP. We also view
these segments as unlikely to materially drive increased demand for natural flake
on account of amorphous graphite being more widely used in the lubricant
industry (11% of market demand in 2015) due to the “ashing” properties of
amorphous material.
For the purposes of our modelling we have assumed that 50% of future demand
from foundries and industrials will utilize amorphous graphite most likely on a
price rationale. We consider that 100% of lubricant and “other” categories will
provide base line demand for amorphous graphite.
Figure 53: Forecast industrial use demand (2014-2025e)
Source: Company reports, Canaccord Genuity estimates
0
50
100
150
200
250
300
350
400
450
500
2014 2015 2016 2017 2018 2019 2020 2021 2022 2023 2024 2025
An
nu
al
De
ma
nd
(k
pta
)
Foundries Industrials Lubricants Other Amorphorus
Specialty Minerals and MetalsIndustry Overview
20 November 2016 32

33
Other graphite product markets
EXPANDABLE GRAPHITE (50kt produced in 2015)
Expandable flake graphite is a form of intercalated graphite. Intercalation is a
process where chemical species such as alkali metals, sulfides and organics are
placed within the crystalline structure of the host graphite. The resultant graphite
material takes on enhanced properties in terms of structure, surface area,
density, electronic properties and chemical reactivity.
Expandable graphite is mostly used in applications such as fire retardants, high-
performance gaskets and refractory products.
Figure 54: Unexpanded graphite Figure 55: Expanded graphite
Source: Asbury Carbons Source: Asbury Carbons
GRAPHENE: (<20tpa in 2014)
Graphene, with its potential applications, has been a widely publicised
breakthrough in nano-science technology since it was discovered in 2004 by
professors at the University of Manchester through isolating one-carbon-atom-
thick graphene sheets using the ‘Scotch Tape’ mechanical exfoliation method.
Since this time, key attributes such as unsurpassed strength, optical, permeability
and electronic conductivity properties have been identified.
While the graphene industry is nascent with few applications at commercial scale
the addressable market is enormous. Applications besides battery anode
materials include paints, coatings, galvanics, polymers and building materials – a
sector collectively worth over US$620 billion annually.
Graphene is highly abundant but economic production the key challenge
When assessing the suitability of a graphitic ore body to commercial graphene
potential, a number of inherent geo-metallurgical factors are important. These
include a high insitu grade (TGC%), a highly crystalline structure with consistent
homogeneity and the nature and ratios of the non-graphite minerals dispersed
through the ore (gangue). About 3 million layers of graphene sheets exist in 1mm
of graphite, hence developing economic separation methods is the current
challenge.
Forms of graphene:
Graphene exists in many forms, generally determined by the method of
production, source of precursor and the method used to stabilize the product.
Specialty Minerals and MetalsIndustry Overview
20 November 2016 33

34
Single layer graphene: This is the purest and typically the most expensive
form. Desirable to high-tech end-users and product markets, the graphene
exists in a single-atom-thick sheet, with bonded carbon atoms adhered to a
substrate or freely suspended.
Few-layer graphene (FLG) and multi-layer graphene (MLG). This typically
ranges from two to ten layers thick, either free standing or substrate bound. It
is typically used in composite materials and reinforcements.
Graphene oxide. This chemically modified graphene prepared by oxidation
and exfoliation. Graphene oxide is a monolayer material with a high oxygen
content. Major uses are for thin membranes that allow water to pass through
but block off harmful gases.
Graphite nano-platelets, graphite nano-sheets, graphite nano-flakes, and 2D
graphite materials with a thickness and/or lateral dimension of less than 100
nano metres. The use of nanoscale terminology here can be used to help
distinguish these new ultrathin forms from conventional finely milled graphite
powders, whose thickness is typically more than 100 nano metres. These
materials are excellent for electrically conductive composites.
Methods of production:
Bottom-up approaches involve organic synthesis of carbon from small molecules
via their deposition on a substrate through a reduction process. Substrate-based
growth of single layer graphene can be achieved through chemical vapour
deposition (CVD) or via the reduction of silicon carbide. Both of these processes
are limited however by the heating requirements (+1000°C) and the high
substrate cost due to removing the underlying metal layer. This impacts the ability
to scale up these processes to produce commercial levels of graphene.
Top-down approaches isolate graphene layers from the parent graphite ore under
various physico-chemical conditions. Alongside mechanical exfoliation (the
“Scotch Tape” approach), liquid phase exfoliation offers the most likely path to
produce few layer graphene (FLG) within a one-step process.
Liquid phase exfoliation (LPE) has been used in the production of carbon
materials upon the reduction of graphene oxide since the 1950s. This shear-
based method is known as the “Hummers” method and, due to the structural
defects introduced by the oxidation process, results in structural defects within
the graphene that degrade the conductive and morphology (dimensional)
properties.
Paths to commercializing graphene
An advancement on the “Hummers” LPE method with the assistance of sonication
is the “Chemical Exfoliation” method described above. It is our understanding that
this method might provide the most likely path to commercial production of
graphene based on the work of advanced materials company Talga Resources
(ASX:TLG | Not rated).
During ultra-sonication, the growth and deformation of micro-bubbles within the
liquid induce pressure fluctuations at the surface of the immersed graphite block
and induce exfoliation. The liquid (usually a non-volatile organic solvent) needs to
have a chemical affinity that keeps isolated graphene sheets dispersed.
Sonication properties (frequency and duration) impact the form of graphene that
is exfoliated (either single layer (SLG), few layer (FLG) or multi-layer (MLG) and the
subsequent yield.
Specialty Minerals and MetalsIndustry Overview
20 November 2016 34

35
Natural graphite demand – putting it all together
We have considered the six main product markets for natural graphite, and
combined our forecasts to project total estimated demand out to 2025. Based on
this, we estimate the market for natural graphite to grow from ~640ktpa in 2015,
~1.1Mtpa in 2020, and to +2.0Mtpa by 2025, representing CAGR’s of 5% and
12% respectively.
Figure 56: Overall Natural graphite demand 2015-2025e
Source: Company reports, Canaccord Genuity estimates
Figure 57: Natural flake graphite market – market share by end use application (2015-2025e)
Source: Company reports, Canaccord Genuity estimates
Our forecasts are based on the following assumptions:
Lithium-ion batteries: We have incorporated our demand projections for our
base case scenario for Li-B demand into our total market demand. This
results in the battery anode market shifting from 21% of natural flake graphite
demand to 26% in 2020E, and 39% in 2025E.
0
400
800
1200
1600
2000
2400
2016 2017 2018 2019 2020 2021 2022 2023 2024 2025
An
nu
al
De
ma
nd
(k
pta
)
Recarburisers Foundries Batteries IndustrialsLubricants Other Flake Amorphorus
21% 24%30% 35% 38% 39% 40% 40% 41% 41% 40%
21%20%
20% 21% 22% 26% 29% 31% 34% 36% 39%
0%
10%
20%
30%
40%
50%
60%
70%
80%
90%
100%
2015 2016 2017 2018 2019 2020 2021 2022 2023 2024 2025
Ma
rke
t s
ha
re
Recarburisers Foundries Batteries Industrials Lubricants Other
Specialty Minerals and MetalsIndustry Overview
20 November 2016 35

36
Figure 58: Battery anode feedstock (natural flake vs synthetic, 2014-2025e)
Source: Company reports, Canaccord Genuity estimates
Recarburisers: we have modelled demand in this segment based on our high-
demand scenario parameters set out in Figure 51. This implies an annual
growth rate of 12% until 2020 for 400kt of natural graphite. From 2020
onwards we have assumed 15% growth to arrive at a market of 816kt by
2025, representing total market share of 40%.
Foundries: According to estimates by Roskill (July’16), the casting (foundries)
industry is expected to grow at 3% p.a with graphite use growing at 2.5% p.a.
We have assumed a steady growth rate of 2%, noting the large influence that
alternative carbons and amorphous graphite still have on overall supply. This
results in forecasts that flake graphite will represent 50% of total demand
against our current estimated market share of 40%.
Industrials, lubricants and other: we have assumed that natural flake graphite
will share with amorphous 50% of future demand growth within the industrial
and other segments. Lubricants are likely to dominate the market for
amorphous graphite owing to the favorable viscosity that comes from the ash
content
Figure 59: Market share 2016e Figure 60: Market share 2020e Figure 61: Market share 2025e
Source: Company reports, Canaccord Genuity estimates Source: Company reports, Canaccord Genuity estimates Source: Company reports, Canaccord Genuity estimates
0
100
200
300
400
500
600
700
800
900
2014 2015 2016 2017 2018 2019 2020 2021 2022 2023 2024 2025A
nn
ua
l D
em
an
d (
ktp
a)
Natural Flake Synthetic
24%
24%
20%
13%
12%
7% Recarburisers
Foundries
Batteries
Industrials
Lubricants
Other
39%
15%
26%
8%
7%5% Recarburisers
Foundries
Batteries
Industrials
Lubricants
Other
40%
9%
39%
5%4% 3%
Recarburisers
Foundries
Batteries
Industrials
Lubricants
Other
Specialty Minerals and MetalsIndustry Overview
20 November 2016 36

37
Supply vs demand
SYR: THE ELEPHANT IN THE ROOM – SUPPLY COULD OUTPACE DEMAND TO 2020
We have combined our assumed market supply and projected demand forecasts
for natural graphite in Figure 62 below. Based on this, our current
assumptions/forecasts suggest the potential for an over supplied market as soon
as 2018.
As we have noted earlier, SYR’s Balama project is expected to be the largest
project of its kind, representing an average of 25% share of global production
from 2018-2020. We recognize the first-mover advantage that SYR enjoys as a
large-scale, low-cost future producer. This will present as a hurdle for aspiring
natural flake graphite developers to place competing products until such time as
demand in higher-growth markets (such as battery anode materials) increases.
We have forecast a 5% YoY reduction in supply from Chinese natural (flake and
amorphous) production consistent with commentary around industry
consolidation and increased environmental regulation. We do, however, recognize
that this appears to be the most like market that can be replaced owing to the
lower-quality material (<95% TGC) produced.
Figure 62: Natural graphite market – supply vs demand (2017-2020e)
Source: Company reports, Canaccord Genuity estimates
0
200
400
600
800
1000
1200
1400
1600
1800
2000
2200
2017 2018 2019 2020 2021 2022 2023 2024 2025
Natr
ual
Gra
ph
ite
(k
t)
Fines 75um (200mesh) 150um (100mesh) 300um (50mesh)
Balama Existing Flake Existing Amorp Demand
Specialty Minerals and MetalsIndustry Overview
20 November 2016 37

38
Figure 63: Market surplus/(deficit) forecasts for natural graphite by flake size
Source: Canaccord Genuity estimates
EVERYONE WANTS EXPOSURE TO THE LI-B THEMATIC – THE FACT OF THE MATTER
IS DEMAND IS THE MARKET IS NOT THAT LARGE…YET
Our research has shown that demand for natural graphite for the Li-B sector could
increase by up to ~500% to 2025, representing a CAGR of 25%. With such
significant growth potential, it’s no surprise a large number of aspiring graphite
producers are seeking to target this market for their production.
While we acknowledge the significant growth potential of the Li-B sector and
impact on demand for natural graphite, when we compare this to the scale of
potential production seeking to enter the Li-B market and consider competition
from synthetic graphite, we see the potential for significant oversupply until 2021
(Figure 64). This assumes that production from future producers attracts finance,
meets project time lines and get into production.
Figure 64: Flake demand from Li-B’s vs announced supply into Li-B market (2016-2025e)
Source: Company reports, Canaccord Genuity estimates
-300
-200
-100
0
100
200
300
400
2017 2018 2019 2020 2021 2022 2023 2024 2025
Su
rplu
s (
+)/
Defi
cit
(-)
kt
300um (50mesh) 150um (100mesh) 75um (200mesh) Fines Total
0
100000
200000
300000
400000
2016 2017 2018 2019 2020 2021 2022 2023 2024 2025
Gra
ph
ite S
up
ply
/dem
an
d (
tpa)
Existing Flake Balama
Project 3 Project 1
Project 2 Anode Material - Flake
Anode Material - Synthetic
Specialty Minerals and MetalsIndustry Overview
20 November 2016 38

39
The recarburiser market (as boring as it is) should remain a highly important
market to aspiring producers
Based on the above, we believe many graphite companies are failing to
acknowledge the significantly less “sexy” but equally important demand center in
graphite’s more traditional markets.
As shown in Figure 57 and 58, recarburisers together are estimated to comprise
39% total market share by 2020 and 40% by 2025, against forecast market share
for Li-B’s of 26% and 39% respectively.
Key forecast (market) risks
Key downside risks to our forecasts include:
- Slower than expected EV/grid storage penetration owing to changes in policy
(i.e. removal of government subsidies).
- Battery manufacturing capacity: With key demand drivers for Li-B’s being EV’s
and grid storage, insufficient battery manufacturing capacity could hamper
growth in these industries and result in lower demand.
- Change in battery technology: As rechargeable battery market grows, further
R&D may lead to development of competing technologies. However, we
consider risk of this in the next ~10 years is low due to 1) incumbency of Li-B
technology 2) long lead times to commercialization of new battery
technologies 3) desire for return on capital from investments in new battery
facilities
- Changes in anode materials: these include inclusion of silicon within the
anode (research has shown significant increases in reversible capacities can
be achieved when blended with graphite) and/or other changes in anode raw
materials which could be driven by a desire to reduce battery costs or improve
battery performance.
One example is the solid-state lithium-metal battery in which the carbon
anode is completed replaced with an ultra-thin lithium metal, reducing the
dead weight of the carbon anode with an active lithium structure to host
lithium ions. These batteries have already found commercial applications in
some portable electric devices. More ambitious batteries such as Li/sulphur
(500Wh/kg) and Li/air (+10kWh/kg) are at a nascent stage of development.
Figure 65: Battery types
Source: Company reports, Nature magazine
Specialty Minerals and MetalsIndustry Overview
20 November 2016 39

40
- Cost incentive to change battery anode materials: We highlighted earlier in
Figure 19 the exhaustive process that customers will undertake to qualify
potential natural flake as an alternative battery anode material. We currently
understand that production costs for Li-ion batteries are around US$350/kWh
with materials comprising around US$60/kWh (see Figure 66). Given the
relatively low input cost that graphite has in the overall cost of a Li-ion battery,
we present in Figure 67 the change that moving battery anode material from
40% flake (as per 2015) to 60% from 2020 will have on overall battery costs.
We conclude that across an average of the investigated cathode chemistries
only a 5% drop (from 34% to 29%) in material costs could be expected. This
results in a saving of US$3/kWh or 1% of overall battery costs on 2015 or
1.5% on 2025 based on overall costs presented in Figure 66.
Figure 66: Li-battery cost breakdown Figure 67: Overall cost of graphite and natural flake graphite as % of
material cost of a Li-Battery
Source: Company reports, Canaccord Genuity estimates Source: Company reports, Canaccord Genuity estimates
- Battery recycling: Unlikely to influence supply and demand for the foreseeable
future due to the relatively low cost of the raw input material and the cost of
recycling.
- Slower conversion to EAF steel production: Steel from EAFs require higher
purity recarburisers (i.e. natural flake graphite vs met coke), but slower
conversion of BOF to EAF and/or inability for graphite to displace alternative
carbon products could impact demand for natural flake graphite.
- Lower rates of growth in global crude steel and cast iron production: A slow
down in global crude steel and cast iron production will negatively impact
demand for carbon products.
Product pricing & forecasts
NATURAL FLAKE GRAPHITE PRICES STILL FALLING DESPITE LOWER SUPPLY AND
INCREASING DEMAND
Due to the opaque nature of the graphite market and the various product
specifications, obtaining accurate pricing information is a futile exercise. Some
historic natural flake graphite prices are presented in Figure 68, which illustrates
a significant fall in prices since 2012.
We note that the fall in prices coincides with lower supply (closure of Chinese
mines) and growing demand for carbon products – this leads to the likelihood that
lower-priced substitutes are capturing market share. Understanding the markets
0
50
100
150
200
250
300
350
400
450
500
2013 2015 2020
US
$/k
Wh
Cathode Anode Electrolyte Separator Packing Material Manufacturing Product Cost
9% 9%
11%
6%6%
8%
4% 4%
11%
6%
19% 9%
0%
5%
10%
15%
20%
25%
30%
35%
40%
45%
50%
LCO LMO LFP NMC NCA AverageGra
ph
ite
as
% o
f M
ate
ria
l C
os
t
2015 Graphite Cost 2025 Graphite Cost
Specialty Minerals and MetalsIndustry Overview
20 November 2016 40

41
that natural graphite currently service provides insights to the alternative carbon
products that may have filled the gap. For example, ~30% of total natural graphite
(~195kt) goes into the much larger ~3Mtpa recarburiser market.
Figure 68: Various sized graphite prices (FOB Qingdao) Figure 69: Historical natural graphite production vs weighted
average basket price
Source: Benchmark Mineral Intelligence, Lincoln Minerals Source: Industrial Minerals, USGS, Benchmark Minerals
FALLING FEEDSTOCK COSTS FOR SYNTHETIC IMPACTING NATURAL FLAKE
PRICES?
Raw material costs for synthetic graphite can be presented by coal and oil prices
as per Figure 70. This highlights that the high fixed cost (thermal treatment) to get
bituminous feedstock to comparable purities of natural flake is being offset by a
significant drop in raw material cost.
It also illustrates the strong correlation over recent years between the decline in
natural fine flake prices with the prevailing decline in metallurgical coking coal
and Brent oil prices. We present this as a background to the likely influences that
synthetic graphite supply will have on the prevailing natural flake graphite price.
Figure 70: Raw material cost for synthetic graphite VS natural graphite fines VS quarterly Chinese
steel production (2012-2020e)
Source: World Steel Association, company reports, Factset, Benchmark Minerals,, Canaccord Genuity estimates
0
400
800
1200
1600
2000
2400
0
200
400
600
800
1000
1200
'04 '05 '06 '07 '08 '09 '10 '11 '12 '13 '14 '15
Avera
ge G
raphite P
rice (
US
$/t
)
Est.
Gra
phite P
roduction (
kt)
Chinese Amorphous Chinese Flake
ROW Natural Weighted Price
Specialty Minerals and MetalsIndustry Overview
20 November 2016 41

42
OTHER PRICING INFLUENCES
Graphite is sold on contract terms between a producer and an intermediate. This
pricing structure is dependent on primary factors associated with ore
characteristics (flake size, TGC%, impurities) and secondary factors associated
with terms and conditions of shipment which impact the cost of delivered product.
An important feature of graphite is how different product markets are
distinguished upon flake size, purity and dimensions (angular or rounded
surfaces). Due to large flake being in scarce supply from the majority of Chinese
producers, large flake currently commands a significant price premium. Graphite
concentrate product that grades below 94% TGC competes with marginal
amorphous product out of China, which our research suggests is priced at
US$400-600/t dependent on purity levels.
Figure 71: Oct’16 graphite pricing
Source: Industrial Minerals
PRICING FORECASTS
We have assessed the natural flake graphite market balance until 2025 across
four distinct flake size distributions; Jumbo flake (+300 µm), Large (+150 µm),
Medium (+75 µm), Fine/Amorphous (-75µm). In addition we have classified our
four key market sectors by growth potential and present our assumptions in figure
71.
Figure 72: Assumed natural flake distribution
Source: Canaccord Genuity estimates
As we have previously pointed out, product purity (grade and deleterious
elements) is as important in determining product pricing as flake size. While we
have used a benchmark 95% TGC purity natural flake, we acknowledge that many
developers aspire to produce superior grade flake concentrates directed toward
higher-growth markets such as Li-ion battery anode materials. These concentrates
are likely to command a premium to the prices we have presented, underpinned
by the prevailing market balance.
Presented in Figure 73 is our resultant pricing forecast for a benchmark 95% TGC
purity product across the various flake size fractions.
Size Grade Low (US$/t) High (US$/t)
Spherical (15µm)99.95%
(uncoated)2500 3000
+200µm 94-97% 850 950
-200µm 94-97% 750 850
-150µm 94-97% 550 700
-150µm +97% 700 750
Low Growth Low Growth Mid Growth Mid Growth High Growth
Lubricants Industrials Foundries RecarburisersBatteries
Growth rate (CAGR) 1.8% 1.8% 1.8% 18.6% 19.7%
Flake Distribution
300µm (50mesh) 0% 10% 10% 10% 10%
150µm (100mesh) 0% 20% 20% 20% 20%
75µm (200mesh) 0% 20% 20% 30% 30%
-75µm Fines 100% 50% 50% 40% 40%
Specialty Minerals and MetalsIndustry Overview
20 November 2016 42

43
Figure 73: CG natural graphite price forecasts
Source: Company reports, Canaccord Genuity estimates
ASX-listed graphite companies – peer comparison
As per Figure 17, we have identified +20 companies globally (ex-China) that have
had various levels of project assessment (PEA, PFS, DFS etc) completed on them
in the last four years. We have refined this list further in Figure 74 below, where
we include those ASX-listed companies whose projects are the most advanced, or,
where individual project characteristics set them apart from the peer group (we
provide more detailed summaries in Appendix 1 (pages 50-65).
In Figures 75 to 86 below, we compare and rank key project characteristics.
Figure 74: ASX-listed graphite developers
Source: Factset, company Reports, Canaccord Genuity estimates (Prices as at 14/11/16)
2016 2017 2018 2019 2020 2021 2022 2023 2024 2025
Updated CGe - Benchmark 95% TGC purity
300um (50mesh) $2,000 $2,069 $1,866 $1,813 $1,860 $1,936 $1,978 $1,998 $2,000 $2,005
150um (100mesh) $1,000 $1,016 $943 $949 $956 $981 $995 $1,002 $1,001 $1,003
75um (200mesh) $750 $764 $720 $730 $729 $742 $750 $753 $752 $752
Fines $550 $562 $525 $540 $540 $549 $554 $555 $552 $551
"Basket Price" $802 $824 $770 $838 $882 $908 $924 $926 $913 $905
Previous CGe - Benchmark 95% TGC purity
300um (50mesh) $2,040 $2,415 $2,590 $2,440 $2,440 $2,400 $2,400 $2,400 $2,400 $2,400
150um (100mesh) $800 $800 $800 $800 $800 $800 $800 $800 $800 $800
75um (200mesh) $703 $900 $1,175 $1,075 $1,075 $1,075 $1,075 $1,075 $1,075 $1,075
Fines $538 $725 $800 $813 $850 $900 $900 $900 $900 $900
"Basket Price" $753 $928 $1,042 $1,079 $1,122 $1,136 $1,137 $1,135 $1,127 $1,121
Ticker
Market Cap ($m
AUD) Property Country Type
Capital Cost
(US$m)
Prod'n LOM
(ktpa)
Syrah Resources Ltd SYR-AU 891.50 Balama Mozambique Construction 138 340
Magnis Resources Ltd. MNS-AU 272.09 Nachu Tanzania DFS 269 240
Hexagon Resources Ltd. HXG-AU 66.37 McIntosh Australia PEA 123 50
Volt Resources VRC-AU 65.50 Namangale Tanzania Pre-PFS TBC Q4'16 TBC Q4'16
Black Rock Mining Ltd. BKT-AU 45.23 Mahenge North Tanzania PEA 57 52
Metals of Africa Ltd. MTA-AU 42.41 Montepuez Mozambique PEA 166 100
Kibaran Resources Ltd. KNL-AU 41.21 Epanko Tanzania DFS 78 44
831 826
Specialty Minerals and MetalsIndustry Overview
20 November 2016 43

44
Figure 75: Resource size (Meas + Ind + Inf) Figure 76: EV/resource tonne (contained graphite)
Source: Company reports, Canaccord Genuity estimates; Source: Company reports, Canaccord Genuity estimates;
Figure 77: Resource size vs in-situ grade Figure 78: Resource flake size distribution
Source: Company reports, Canaccord Genuity estimates Source: Company reports, Canaccord Genuity estimates
Figure 79: In-situ resource grade vs % large flake Figure 80: Flake size distribution vs concentrate grade
Source: Company reports, Canaccord Genuity estimates Source: Company reports, Canaccord Genuity estimates
147.8
0.0
5.0
10.0
15.0
20.0
25.0
30.0
35.0
40.0
45.0
Balama Nachu McIntosh Epanko Montepeuz Mahenge Namangale
Reso
urc
e s
ize (
Mt
co
nta
ined
g
rap
hit
e)
0
10
20
30
40
50
60
70
80
90
SYR-AU MNS-AU HXG-AU KNL-AU MTA-AU BKT-AU VRC-AU
EV
/Reso
urc
e t
on
ne (
A$/t
)
Balama
Nachu
McIntosh
Epanko
Montepeuz
Mahenge
Namangale
0.0%
2.0%
4.0%
6.0%
8.0%
10.0%
12.0%
0 50 100 150
Insit
u R
eso
urc
e g
rad
e
(%T
GC
)
Contained graphite Mt
0%
10%
20%
30%
40%
50%
60%
70%
80%
90%
100%
Balama Nachu McIntosh Epanko Montepeuz Mahenge Namangale
Mass R
eta
ined
(%
)
300um 180um 150um 75um <75um
Balama
Nachu
McIntosh
Epanko
Montepeuz
Mahenge
Namangale
0.0%
2.0%
4.0%
6.0%
8.0%
10.0%
12.0%
0% 20% 40% 60% 80%
Insit
u R
eso
urc
e g
rad
e
(%T
GC
)
Flake size dist'n - % large flake (>150um)
Balama
Nachu
McIntosh
Epanko
Montepeuz
Mahenge
0%
10%
20%
30%
40%
50%
60%
70%
96% 96% 97% 97% 98% 98% 99% 99% 100%
La
rge
Fla
ke D
istr
ibu
tio
n (
%)
Average Concentrate Grage (TGC%)
Specialty Minerals and MetalsIndustry Overview
20 November 2016 44

45
Figure 81: Project capital costs (US$m) Figure 82: : Capital intensity
Source: Company reports, Canaccord Genuity estimates Source: Company reports, Canaccord Genuity estimates
Figure 83: Capital hurdle ratio Figure 84: Planned production (ktpa concentrate)
Source: Company reports, Canaccord Genuity estimates Source: Company reports, Canaccord Genuity estimates
Figure 85: Operating cost estimate (as per CGe/study results) Figure 86: Stage of development vs capital costs vs production (bubble
size = production)
Source: Company reports, Canaccord Genuity estimates Source: Company reports, Canaccord Genuity estimates
0
50
100
150
200
250
300
Balama Nachu McIntosh Epanko Montepeuz Mahenge Namangale
Develo
pm
en
t cap
ital co
sts
(U
S$m
)
0
200
400
600
800
1000
1200
1400
1600
1800
Balama Nachu McIntosh Epanko Montepeuz Mahenge Namangale
Cap
ital in
ten
sit
y (
US
$/t
)
0.0
0.5
1.0
1.5
2.0
2.5
3.0
3.5
4.0
Balama Nachu McIntosh Epanko Montepeuz Mahenge Namangale
Mark
et
cap
/Cap
ex (
x)
0
50
100
150
200
250
300
350
400
Balama Nachu McIntosh Epanko Montepeuz Mahenge Namangale
Pla
nn
ed
pro
du
cti
on
(ktp
a
co
ncen
trate
)
$0
$200
$400
$600
$800
$1,000
$1,200
$1,400
Balama Nachu McIntosh Epanko Montepeuz Mahenge
US
$/t
Cash Costs FOB Margin Q4'16 'Basket Price'
Balama
Nachu
McIntosh EpankoMontepeuzMahenge
0
50
100
150
200
250
300
350
Pla
nt
Cap
ex (
US
$m
)
Explore Scope PFS DFS Construct
Specialty Minerals and MetalsIndustry Overview
20 November 2016 45

46
Company updates
Specialty Minerals and MetalsIndustry Overview
20 November 2016 46
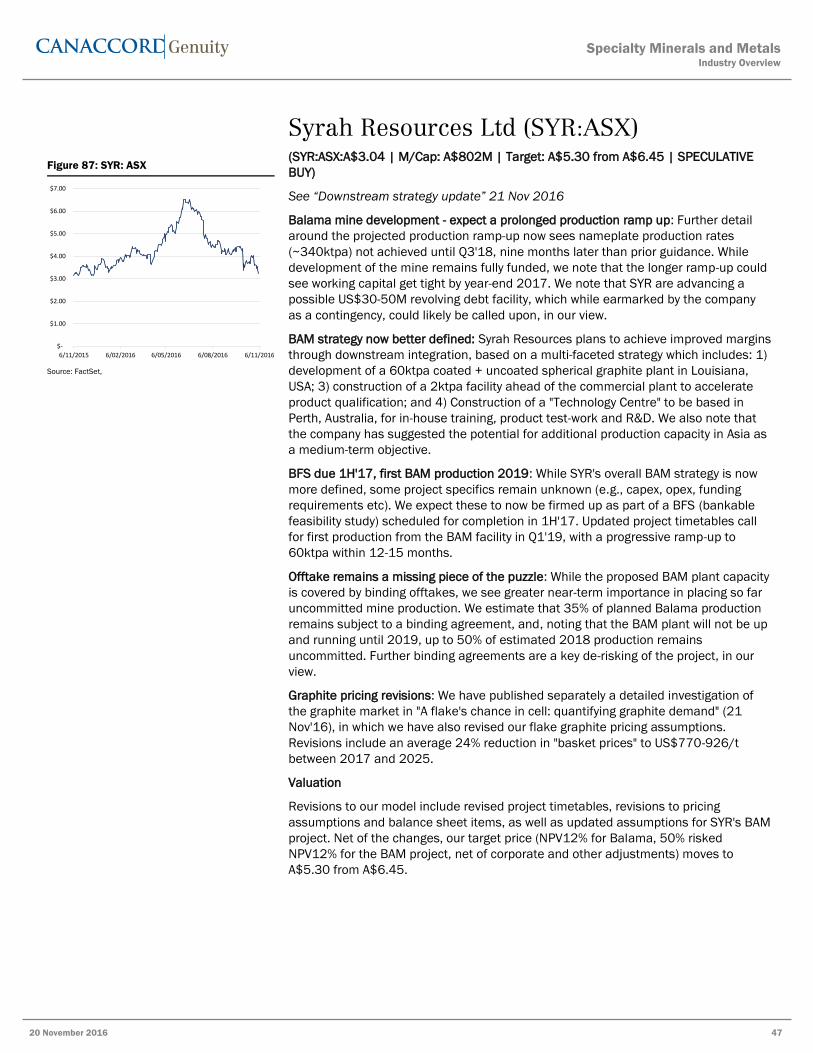
47
Syrah Resources Ltd (SYR:ASX) (SYR:ASX:A$3.04 | M/Cap: A$802M | Target: A$5.30 from A$6.45 | SPECULATIVE
BUY)
See “Downstream strategy update” 21 Nov 2016
Balama mine development - expect a prolonged production ramp up: Further detail
around the projected production ramp-up now sees nameplate production rates
(~340ktpa) not achieved until Q3'18, nine months later than prior guidance. While
development of the mine remains fully funded, we note that the longer ramp-up could
see working capital get tight by year-end 2017. We note that SYR are advancing a
possible US$30-50M revolving debt facility, which while earmarked by the company
as a contingency, could likely be called upon, in our view.
BAM strategy now better defined: Syrah Resources plans to achieve improved margins
through downstream integration, based on a multi-faceted strategy which includes: 1)
development of a 60ktpa coated + uncoated spherical graphite plant in Louisiana,
USA; 3) construction of a 2ktpa facility ahead of the commercial plant to accelerate
product qualification; and 4) Construction of a "Technology Centre" to be based in
Perth, Australia, for in-house training, product test-work and R&D. We also note that
the company has suggested the potential for additional production capacity in Asia as
a medium-term objective.
BFS due 1H'17, first BAM production 2019: While SYR's overall BAM strategy is now
more defined, some project specifics remain unknown (e.g., capex, opex, funding
requirements etc). We expect these to now be firmed up as part of a BFS (bankable
feasibility study) scheduled for completion in 1H'17. Updated project timetables call
for first production from the BAM facility in Q1'19, with a progressive ramp-up to
60ktpa within 12-15 months.
Offtake remains a missing piece of the puzzle: While the proposed BAM plant capacity
is covered by binding offtakes, we see greater near-term importance in placing so far
uncommitted mine production. We estimate that 35% of planned Balama production
remains subject to a binding agreement, and, noting that the BAM plant will not be up
and running until 2019, up to 50% of estimated 2018 production remains
uncommitted. Further binding agreements are a key de-risking of the project, in our
view.
Graphite pricing revisions: We have published separately a detailed investigation of
the graphite market in "A flake's chance in cell: quantifying graphite demand" (21
Nov'16), in which we have also revised our flake graphite pricing assumptions.
Revisions include an average 24% reduction in "basket prices" to US$770-926/t
between 2017 and 2025.
Valuation
Revisions to our model include revised project timetables, revisions to pricing
assumptions and balance sheet items, as well as updated assumptions for SYR's BAM
project. Net of the changes, our target price (NPV12% for Balama, 50% risked
NPV12% for the BAM project, net of corporate and other adjustments) moves to
A$5.30 from A$6.45.
Figure 87: SYR: ASX
Source: FactSet,
$-
$1.00
$2.00
$3.00
$4.00
$5.00
$6.00
$7.00
6/11/2015 6/02/2016 6/05/2016 6/08/2016 6/11/2016
Specialty Minerals and MetalsIndustry Overview
20 November 2016 47

48
FINANCIAL SUMMARYSyrah Resources Limited ASX:SYR
Analyst : Reg Spencer
Date: 17/11/2016 Rating:
Year End: December Target Price:
Market Information Company Description
Share Price A$ 3.04
Market Capitalisation A$m 801.8
12 Month Hi A$ 6.66
12 Month Lo A$ 2.96
Issued Capital m 263.76 Profit & Loss (A$m) 2015a 2016e 2017e 2018e
Options m 6.25 Revenue 0.0 0.0 0.0 277.4
Fully Diluted m 270.00 Operating Costs 0.0 0.0 36.6 140.4
Royalties 0.0 0.0 0.0 8.3
Valuation A$m Risk Adj. A$/share Corporate & O'heads 8.2 14.9 18.2 18.6
Balama Graphite 743.4 100% 2.82 Exploration (Expensed) 0.1 0.1 5.1 0.2
Spherical Graphite 951.9 50% 1.80 EBITDA -7.9 -12.1 -56.7 110.9
Exploration & Projects 100.0 0.38 Dep'n 0.3 0.0 20.1 104.8
Corporate (108.2) (0.41) EBIT -8.2 -12.1 -76.8 6.1
Cash 215.4 0.82 Net Interest 0.4 2.8 0.9 1.1
Debt (26.4) (0.10) Tax 0.2 0.0 0.0 5.2
TOTAL NAV 1,400.2 5.31 NPAT -8.4 -12.1 -78.1 -0.0
Target Price 5.30 Abnormals 4.8 0.0 0.0 0.0
P/NAV 0.57x NPAT (reported) -3.5 -12.1 -78.1 -0.0
Assumptions 2015 2016e 2017e 2018e Cash Flow (A$m) 2015a 2016e 2017e 2018e
W/Avg Graphite Price (US$/t) 924 1,122 1,084 1,101 Cash Receipts 0.0 0.0 0.0 277.4
AUD:USD 0.73 0.75 0.76 0.75 Cash paid to suppliers & emp. -3.9 -14.9 -54.8 -167.3
Tax Paid 0.0 0.0 0.0 -5.2
Valuation Sensitivity Net Interest 0.2 2.8 1.8 0.1
Operating Cash Flow -3.7 -12.0 -53.0 105.0
Exploration and Evaluation -0.4 -0.4 -20.0 -0.8
Capex -15.7 -143.5 -138.7 -13.6
Other 0.3 0.0 0.0 0.0
Investing Cash Flow -15.9 -144.0 -158.7 -14.4
Debt Drawdown (repayment) 0.0 0.0 26.4 -26.8
Share capital 211.0 194.3 0.0 0.0
Dividends 0.0 0.0 0.0 0.0
Financing Expenses -8.9 -5.5 0.0 0.0
Financing Cash Flow 202.1 188.8 26.4 -26.8
Opening Cash 8.9 191.8 215.4 30.2
Increase / (Decrease) in cash 182.5 32.8 -185.3 63.8
FX Impact 0.3 -9.1 0.0 0.0
Production Metrics 2015 2016e 2017e 2018e Closing Cash 191.8 215.4 30.2 94.0
Balama Graphite
Graphite Production (kt) 0 0 38 265 Balance Sheet (A$m) 2015a 2016e 2017e 2018e
Total Cash Costs (US$/t) 0 0 n/a 563 Cash + S/Term Deposits 191.8 215.4 30.2 94.0
Spherical Graphite Other current assets 10.4 12.5 10.5 54.5
Production (kt) 0 0 0 0 Current Assets 202.2 227.9 40.7 148.5
Total Cash Costs (US$/t) 0 0 0 0 Property, Plant & Equip. 3.8 18.1 30.0 20.9
Exploration & Develop. 48.7 49.1 64.1 64.7
Reserves & Resources Other Non-current Assets 17.7 146.8 253.6 171.6
Balama (Graphite) Resources Mt % TGC Contained Payables 0.0 0.3 0.3 27.8
(@ 3% Cut-off) Measured 75 11.2% 8.4 Short Term debt 0.0 13.4 13.4 0.0
(@ 3% Cut-off) Indicated 228 11.9% 27.1 Long Term Debt 0.0 0.0 0.0 0.0
(@ 3% Cut-off) Inferred 1,018 11.1% 113 Other Liabilities 7.8 -5.1 -7.1 9.5
Total 1,321 11.2% 148 Net Assets 264.6 446.8 368.7 368.6
Shareholders Funds 296.7 491.1 491.1 491.1
Balama (Graphite) Reserves Mt % TGC Contained Reserves 1.8 1.8 1.8 1.8
(@ 9% Cut-off) Proved 20 19.2% 3.84 Retained Earnings -33.9 -46.1 -124.2 -124.2
(@ 9% Cut-off) Probable 95 0.0% 15.13 Total Equity 264.6 446.8 368.7 368.6
Total 115 16.6% 18.97
Ratios & Multiples 2015a 2016e 2017e 2018e
Directors EBITDA Margin nm nm nm 40%
Name Position Shares (%) EV/EBITDA nm nm nm 6.4x
Jim Askew Exec Chairman 0.0% Op. Cashflow/Share -$0.02 -$0.05 -$0.20 $0.40
Sam Rigall Non-exec Director 0.0% P/CF nm nm nm 7.6x
Rhett Brans Non-exec Director 0.0% EPS -$0.02 -$0.05 -$0.30 $0.00
Darrin Strange COO 0.0% EPS Growth nm nm nm nm
Michael Chan Gen Manager, Development 0.0% PER nm nm -10.3x -71906.4x
Dividend Per Share $0.00 $0.00 $0.00 $0.00
Dividend Yield 0% 0% 0% 0%
Substantial Shareholders Shares (m) % ROE -1% -3% -21% 0%
Regal Funds Management 23.0 8.7% ROIC -3% -2% -16% 2%
T Kumova 14.7 5.6% Debt/Equity 0% 0% 0% 0%
AustralianSuper 14.6 5.5% Net Interest Cover nm nm -34.5x nm
JCP Investment Partners 13.6 5.1% Book Value/share $1.15 $1.69 $1.40 $1.40
Standard Life Investments 13.5 5.1% Price/Book Value 2.7x 1.8x 2.2x 2.2x
Source: SYR & Canaccord Genuity estimates
Syrah Resources (SYR:ASX) is an Australian based mineral development company whose primary project is the world
class Balama graphite project location in Northern Mozambique. The company recently completed a DFS which
demonstrates the viability of a +40 year, +300ktpa graphite operation. Production is estimated to commence in early
2017. SYR is also advancing its 25-50ktpa spherical graphite development project.
SPECULATIVE BUY
A$5.30
$0.00
$1.00
$2.00
$3.00
$4.00
$5.00
$6.00
$7.00
$8.00
-30% -20% -10% 0% 10% 20% 30%
NA
V
Change in input variable
Graphite price (140 mesh flake) Graphite price fines Discount Rate (NPV @ 12%)
Specialty Minerals and MetalsIndustry Overview
20 November 2016 48

49
Appendix I – ASX Listed Graphite Companies
Specialty Minerals and MetalsIndustry Overview
20 November 2016 49

50
Black Rock Mining Ltd (BKT:ASX)
(BKT: ASX : A$0.15 | M/Cap: A$48M | Not Rated)
We do not provide a rating, estimates, or a target price for Black Rock Mining.
Overview
BKT’s primary asset is the Mahenge flake graphite project, located in the Morongo
region of southern Tanzania. The project consists of 4 tenements, covering an
area of 533km2, with over 14,000m of RC and 3,000m of diamond drilling
occurring since 2015 to define a maiden JORC resource in Feb’16 that has since
been updated to 162.5Mt @ 7.8% TGC for 12.7Mt of Graphite.
The project is proximal to power infrastructure and the major TAZARA railway to
the major port at Dar es Salaam.
Figure 89: Mahenge Project Location map
Source: Company reports,
Geology: Graphite mineralisation at the Mahenge Project is described as schist-hosted
flaky graphite. The mineralization is hosted within upper amphibolite facies gneiss of
the Mozambique Mobile Belt.
Resources/Reserves: With a deposit totalling 163Mt @ 7.8% for 12.7Mt Mahenge is
one of the top 5 graphite deposits by size globally. ~75% of resources are contained
within the north/south-trending Ulanzi deposit. ~2km away is the Cascades deposit of
which a 30-hole drill program to ~12m deep indicates higher grades than those at
Figure 88: BKT: ASX
Source: FactSet,
$-
$0.05
$0.10
$0.15
$0.20
$0.25
6/11/2015 6/02/2016 6/05/2016 6/08/2016 6/11/2016
Specialty Minerals and MetalsIndustry Overview
20 November 2016 50

51
Ulanzi. A drilling program is expected to be completed over Q1’17 to augment the
current 12.3Mt @ 9.5% for 1.2Mt Inferred resource estimate. .
Metallurgy: Testwork conducted in Jul’16 on a primary composite from Ulanzi and
Epanko North indicated that flake purities of ~99% could be obtained on material
<75um (80% of feed). According to company reports, these purities could be obtained
across oxide and fresh portions with early indications the oxide from the Cascades
deposit displays similar characteristics.
In Sep’16 the company indicated that 99.98% TGC spherical graphite could be
manufactured from Mahenge feed with current testwork aimed at bypassing
conventional acid purification.
Samples have been received by end-users in the battery anode space for evaluation
along with development work based on the indications of Mahenge’s product
suitability to expandable graphite applications.
Figure 90: Mahenge Flake Size distribution
Source: Company reports
Feasibility, development & production: The company completed a scoping study in
Mar’16 calling for a 52ktpa project with an initial mine life of 25 years and capital
expenditure of US$57M. Base case assumptions were for a 500ktpa capacity plant
with cash costs of US$450/t. The company expects to complete a PFS in DecQ’16
followed by a DFS in Q2’17.
Specialty Minerals and MetalsIndustry Overview
20 November 2016 51

52
Figure 91: Mahenge project timetable
Source: Company reports
Product marketing and offtake: BKT is targeting first offtake negotiations by the end of
2016. Bulk 99.2% TGC concentrates have been distributed to test facilities and end
users for test work.
An analyst has not visited the properties held by Black Rock Mining Limited
Specialty Minerals and MetalsIndustry Overview
20 November 2016 52

53
Hexagon Resources Ltd (HXG:ASX)
(HXG: ASX : A$0.27 | M/Cap: A$65M | Not Rated)
We do not provide a rating, estimates, or a target price for Hexagon Resources.
Overview
HXG’s (formerly Lamboo Resources) primary asset is the McIntosh flake graphite
project located in the Kimberly region of Western Australia, approximately 100km
north of Halls Creek. The project was acquired in 2012, and covers an area of
330km2. The tenements are owned 100% by HXG.
The project area is located ~295km by all-weather road from the deep water port
of Wyndham. The port features ship-loading infrastructure, and numerous bulk
storage options.
HXG is currently completing feasibility studies to assess the development of the
McIntosh project.
Figure 93: McIntosh Graphite project – location map (refer subset)
Source: Company reports, Canaccord Genuity estimates
Geology: The McIntosh Project graphite schist horizons occur in the high-grade
metamorphic terrain of the Halls Creek Mobile Zone of Western Australia. The host
stratigraphy is the Tickalara Metamorphics which extend for approximately 130 km
along the western side of a major fault line. HXG has identified graphite schist
horizons and accompanying aerial EM anomalies over a strike length in excess of 15
km within the granted tenements, with outcropping graphite mineralisation identified
a number of deposits. HXG have noted the potential for another 35 km strike length of
graphite schist in EL applications.
Resources/Reserves: HXG reported updated Resources for the McIntosh project in
Jan’16, with the project now hosting Indicated (46%) and Inferred (54%) Resources of
17.2Mt at a grade of 4.63% TGC across four main deposits. The largest of the
Figure 92: HXG: ASX
Source: FactSet,
$-
$0.05
$0.10
$0.15
$0.20
$0.25
$0.30
$0.35
6/11/2015 6/02/2016 6/05/2016 6/08/2016 6/11/2016
Specialty Minerals and MetalsIndustry Overview
20 November 2016 53

54
resource positions is at Emperor, which hosts Indicated and Inferred resources 8.4Mt
at 4.6% TGC. There are currently no defined Reserves at the project.
Flake-size analysis of the McIntosh Resource has shown that 44.5% lies within the
Jumbo and Large flake categories.
Figure 94: McIntosh Flake Size distribution
Source: Company reports
Metallurgy: HXG has reported that bulk scale test work has shown the flake graphite
at McIntosh to have few deleterious inclusions, allowing high purity concentrates to be
produced via a simple crush/grind/float process. HXG reported that concentrates with
grades up to 99% TGC can be produced, thereby avoiding chemical or thermal
purification.
HXG has also reported that bulk scale flotation test work shows that high purity
concentrates can be produced across the entire flake size range.
Feasibility, development & production: HXG commenced a PFS for McIntosh in
Mar’16, which the company currently expects to be completed in Q1’17. A DFS is
scheduled to then be completed by mid’17.
The company has not reported potential project parameters.
Figure 95: McIntosh project timetable
Source: Company reports
Product marketing and off-take: HXG reported that it has prepared a bulk sample from
the McIntosh project to be sent to potential offtake parties.
An analyst has not visited the properties held by Hexagon Resources.
Specialty Minerals and MetalsIndustry Overview
20 November 2016 54

55
Kibaran Resources Ltd (KNL:ASX)
(KNL: ASX : A$0.19 | M/Cap: A$44M | Not Rated)
We do not provide a rating, estimates, or a target price for Kibaran Resources.
Overview
KNL’s key project is the Epanko flake graphite project, located ~450km SW of the
Tanzanian capital and port city of Dar es Salaam. The project features a granted
mining licence covering a total area of ~10km2, and lies within proximity to other
major infrastructure including grid power and rail. KNL completed a BFS on
Epanko in 2015 which demonstrated the viability of a 40ktpa open pit project.
KNL is currently finalising debt funding for the project, supported by various
binding offtake agreements. A Scoping Study for the development of a 15ktpa
spherical graphite plant was completed in Aug’15.
KNL also has a 100% interest in the Merelani-Arusha graphite project, located
55km SE of the Arusha, in NE Tanzania.
Figure 97: Epanko Project Location map
Source: Company reports
Geology: Graphite mineralisation at the Epanko Project is hosted within a quartz–
feldspar-carbonate graphitic schist, part of a Neoproterozoic metasediment package,
including marble and gneissic units. Two zones of graphitic schist have been mapped,
named the East Zone and the West Zone.
Resources/Reserves: Epanko hosts total Resources of 23.3Mt at 9.4% TGC, with 62%
in the Measured and Indicated category. KNL BFS for Epanko estimated total reserves
of 10.9Mt at 8.6% TGC. Total Resources at the Merelani-Arusha project stand at
17.2Mt at 6.5% TGC.
Flake size analysis completed in 2015 showed a clear bias of flake size distribution to
larger size fractions, with 55% in the Jumbo and Large categories.
Figure 96: KNL: ASX
Source: FactSet,
$-
$0.05
$0.10
$0.15
$0.20
$0.25
$0.30
$0.35
6/11/2015 6/02/2016 6/05/2016 6/08/2016 6/11/2016
Specialty Minerals and MetalsIndustry Overview
20 November 2016 55
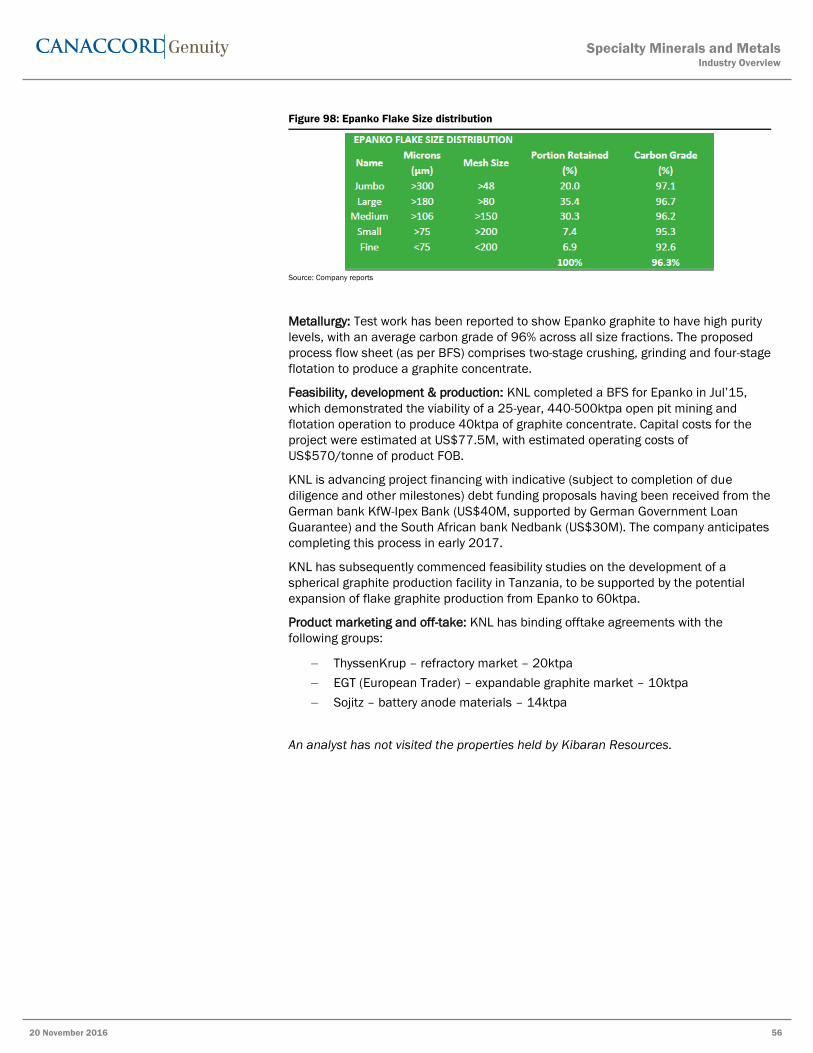
56
Figure 98: Epanko Flake Size distribution
Source: Company reports
Metallurgy: Test work has been reported to show Epanko graphite to have high purity
levels, with an average carbon grade of 96% across all size fractions. The proposed
process flow sheet (as per BFS) comprises two-stage crushing, grinding and four-stage
flotation to produce a graphite concentrate.
Feasibility, development & production: KNL completed a BFS for Epanko in Jul’15,
which demonstrated the viability of a 25-year, 440-500ktpa open pit mining and
flotation operation to produce 40ktpa of graphite concentrate. Capital costs for the
project were estimated at US$77.5M, with estimated operating costs of
US$570/tonne of product FOB.
KNL is advancing project financing with indicative (subject to completion of due
diligence and other milestones) debt funding proposals having been received from the
German bank KfW-Ipex Bank (US$40M, supported by German Government Loan
Guarantee) and the South African bank Nedbank (US$30M). The company anticipates
completing this process in early 2017.
KNL has subsequently commenced feasibility studies on the development of a
spherical graphite production facility in Tanzania, to be supported by the potential
expansion of flake graphite production from Epanko to 60ktpa.
Product marketing and off-take: KNL has binding offtake agreements with the
following groups:
ThyssenKrup – refractory market – 20ktpa
EGT (European Trader) – expandable graphite market – 10ktpa
Sojitz – battery anode materials – 14ktpa
An analyst has not visited the properties held by Kibaran Resources.
Specialty Minerals and MetalsIndustry Overview
20 November 2016 56

57
Magnis Resources Ltd (MNS:ASX)
(MNS: ASX : A$0.73 | M/Cap: A$326M | Not Rated)
We do not provide a rating, estimates, or a target price for Magnis Resources.
Overview
MNS’s primary asset is the Nachu natural flake graphite project, located in south-
eastern Tanzania. MNS own 95% of the project with the national government
retaining 5% free carry equity. The company (then known as Uranex Limited) first
discovered the deposit in 2013 with trench sampling, EM survey and ground
mapping leading to a maiden resource (156Mt at 5.2% for 8.1Mt) being declared
in Nov’14.
The tenement areas of ~200m2 are situated ~220km by sealed road from the
regional centre of Mtwara, which hosts a population of ~80,000. Mtwara has an
underutilised deepwater port (serviceable by oceangoing container vessels) and is
serviced by an airport.
Since a maiden resource was declared in 2014, MNS progressed development
work leading to a bankable feasibility study (BFS) being released in March 2016.
The BFS is based on a 5.0Mtpa processing plant using a conventional crush float
screen flowsheet for the production of ~240ktpa of graphite over a variety of
product sizes.
Figure 100: Nachu Project Location map
Source: Company reports, Canaccord Genuity estimates
Geology: Proterozoic basement rocks of the Mozambique Mobile Belt system which
comprise principally metamorphic rocks ranging from schist to gneisses including
marbles, amphibolite, graphitic schist, mica and kyanite schist, acid gneisses,
hornblende, biotite and garnet gneisses, quartzite, granulite, and pegmatite veins.
Within the project area, there are widespread occurrences of outcropping Graphite,
which typically has grades in the range of 5-10% Graphitic Carbon.
Resources/Reserves: The maiden resource that was completed in Nov’14 was
updated during Feb’16 to 2012 JORC standards with Nachu now containing 174Mt at
5.4% Graphitic Carbon at a 3% cut-off. 71% of the resource is contained within the
Figure 99: MNS: ASX
Source: FactSet,
$-
$0.20
$0.40
$0.60
$0.80
$1.00
$1.20
6/11/2015 6/02/2016 6/05/2016 6/08/2016 6/11/2016
Specialty Minerals and MetalsIndustry Overview
20 November 2016 57
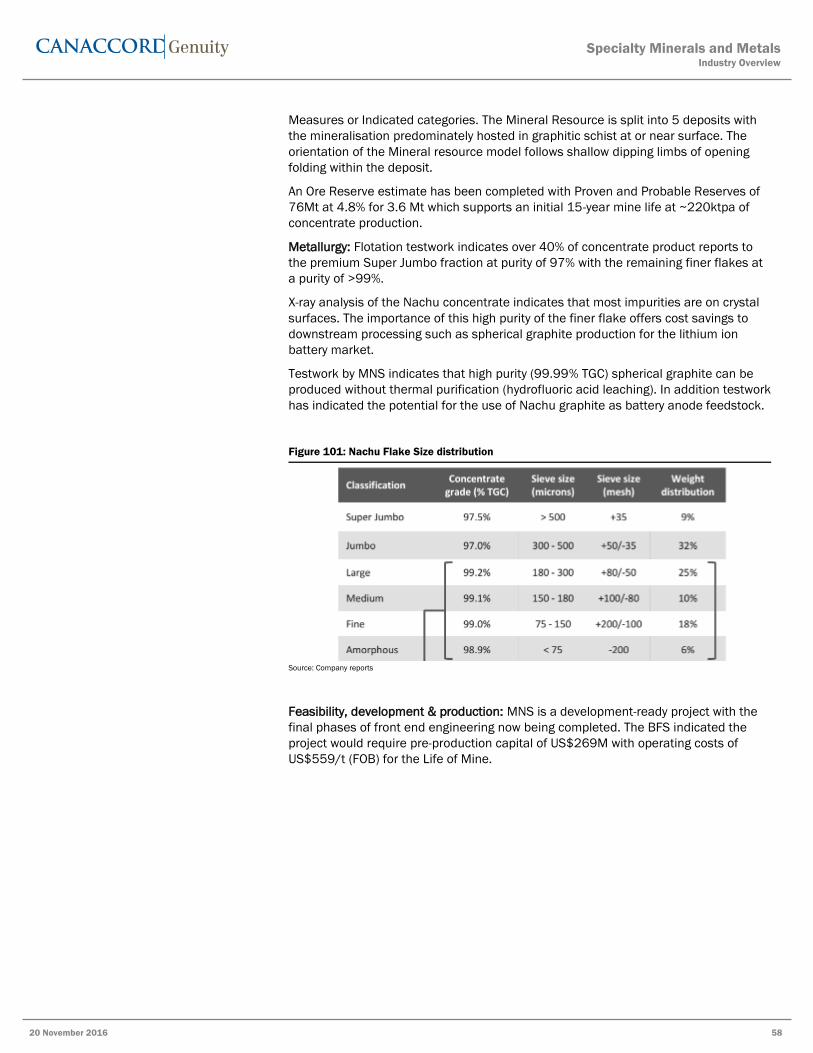
58
Measures or Indicated categories. The Mineral Resource is split into 5 deposits with
the mineralisation predominately hosted in graphitic schist at or near surface. The
orientation of the Mineral resource model follows shallow dipping limbs of opening
folding within the deposit.
An Ore Reserve estimate has been completed with Proven and Probable Reserves of
76Mt at 4.8% for 3.6 Mt which supports an initial 15-year mine life at ~220ktpa of
concentrate production.
Metallurgy: Flotation testwork indicates over 40% of concentrate product reports to
the premium Super Jumbo fraction at purity of 97% with the remaining finer flakes at
a purity of >99%.
X-ray analysis of the Nachu concentrate indicates that most impurities are on crystal
surfaces. The importance of this high purity of the finer flake offers cost savings to
downstream processing such as spherical graphite production for the lithium ion
battery market.
Testwork by MNS indicates that high purity (99.99% TGC) spherical graphite can be
produced without thermal purification (hydrofluoric acid leaching). In addition testwork
has indicated the potential for the use of Nachu graphite as battery anode feedstock.
Figure 101: Nachu Flake Size distribution
Source: Company reports
Feasibility, development & production: MNS is a development-ready project with the
final phases of front end engineering now being completed. The BFS indicated the
project would require pre-production capital of US$269M with operating costs of
US$559/t (FOB) for the Life of Mine.
Specialty Minerals and MetalsIndustry Overview
20 November 2016 58

59
Figure 102: Nachu project timetable
Source: Company reports
Product marketing and off-take: MNS signed an MOU with South Korean industry
leader POSCO E&C in October 2015 outlining the basis for co-operation on the
procurement of funding and construction of the Nachu Graphite Project.
An analyst has not visited the properties held by Magnis Resources Ltd.
Specialty Minerals and MetalsIndustry Overview
20 November 2016 59
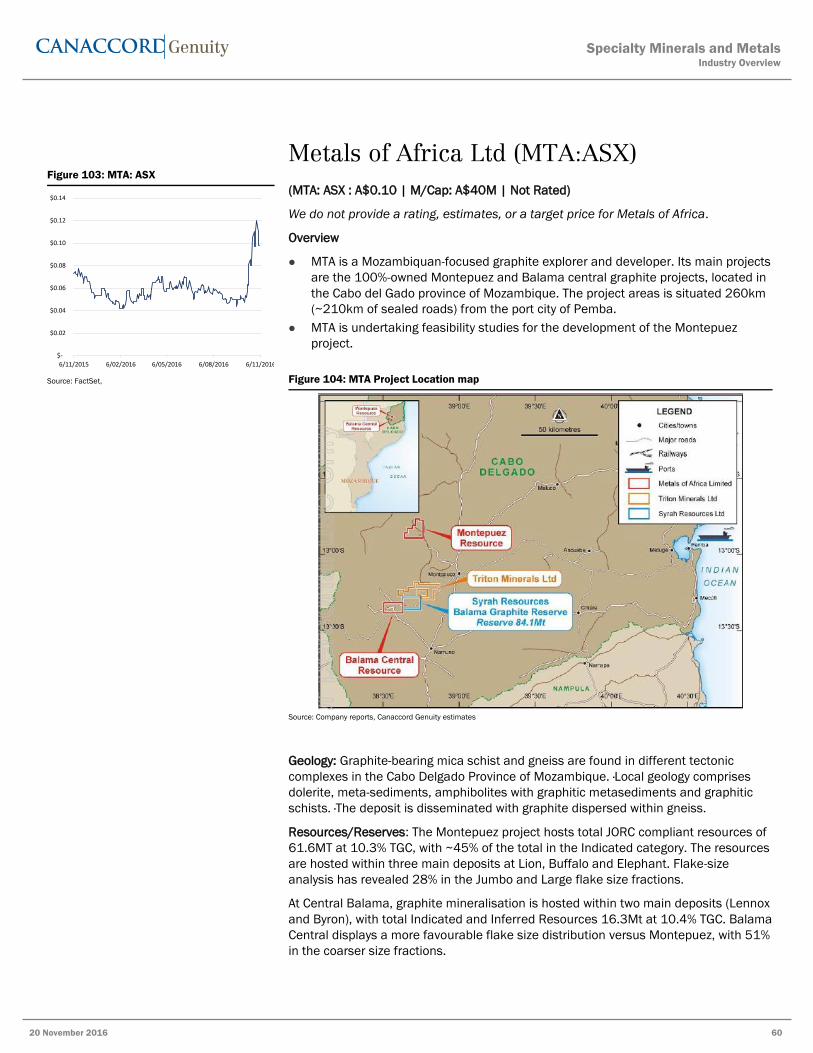
60
Metals of Africa Ltd (MTA:ASX)
(MTA: ASX : A$0.10 | M/Cap: A$40M | Not Rated)
We do not provide a rating, estimates, or a target price for Metals of Africa.
Overview
MTA is a Mozambiquan-focused graphite explorer and developer. Its main projects
are the 100%-owned Montepuez and Balama central graphite projects, located in
the Cabo del Gado province of Mozambique. The project areas is situated 260km
(~210km of sealed roads) from the port city of Pemba.
MTA is undertaking feasibility studies for the development of the Montepuez
project.
Figure 104: MTA Project Location map
Source: Company reports, Canaccord Genuity estimates
Geology: Graphite-bearing mica schist and gneiss are found in different tectonic
complexes in the Cabo Delgado Province of Mozambique. ·Local geology comprises
dolerite, meta-sediments, amphibolites with graphitic metasediments and graphitic
schists. ·The deposit is disseminated with graphite dispersed within gneiss.
Resources/Reserves: The Montepuez project hosts total JORC compliant resources of
61.6MT at 10.3% TGC, with ~45% of the total in the Indicated category. The resources
are hosted within three main deposits at Lion, Buffalo and Elephant. Flake-size
analysis has revealed 28% in the Jumbo and Large flake size fractions.
At Central Balama, graphite mineralisation is hosted within two main deposits (Lennox
and Byron), with total Indicated and Inferred Resources 16.3Mt at 10.4% TGC. Balama
Central displays a more favourable flake size distribution versus Montepuez, with 51%
in the coarser size fractions.
Figure 103: MTA: ASX
Source: FactSet,
$-
$0.02
$0.04
$0.06
$0.08
$0.10
$0.12
$0.14
6/11/2015 6/02/2016 6/05/2016 6/08/2016 6/11/2016
Specialty Minerals and MetalsIndustry Overview
20 November 2016 60

61
Figure 105: Balama Central/Montepuez Flake Size distribution
Source: Company reports
Metallurgy: MTA completed detailed metallurgical test work in Jun’16, based on
composite metallurgical samples from all mineralised lithologies within both the
Balama Central and Montepuez deposit. The Stage 1 flotation test work was reported
to have achieved up to 99% TGC purity, with +95% purity achieved across all +38um
size fractions at a coarse (P100 850um). It was also reported that the results were
achieved without chemical purification. Stage 2 bulk flotation test work has
commenced to provide potential end users with concentrate samples.
Feasibility, development & production: MTA completed a Concept Study for the
Montepuez project in Feb’16, which assessed a 60-year, 1.2Mtpa open pit project
producing 100ktpa of graphite concentrate. The concept study included the
development of a spherical graphite plant which would use feedstock from the
concentrator to produce 25ktpa of coated spheroidal graphite. Total capital costs
were estimated at US$166M (including the spherical plant at US$80M), with
estimated operating costs of US$300/t for large flake graphite products and
US$3,500/t for coated spherical graphite. MTA anticipate the completion of a DFS in
Dec’16.
Product marketing and off-take: n/a
An analyst has not visited the properties held by Metals of Africa.
Specialty Minerals and MetalsIndustry Overview
20 November 2016 61

62
Volt Resources Ltd (VRC:ASX)
(VRC:ASX:A$0.07 | M/Cap: A$69M | Not Rated)
We do not provide a rating, estimates, or a target price for Volt Resources.
Overview
VRC’s primary asset is the Namangale flake graphite project, located in south-
eastern Tanzania. The project consists of 11 tenements, covering an area of
~2,000km2, with the 100% interest in the project acquired in mid’15. The
tenements are subject to a 3% royalty on production to the previous holders,
which can be reduced to 1.5%.
The tenement areas are situated ~140km by sealed road from the regional centre
of Mtwara, which hosts a population of ~80,000. Mtwara has an underutilised
deepwater port (serviceable by oceangoing container vessels), and is serviced by
an airport. Grid-based electricity (gas-fired power station) is available in Mtwara.
VRC is currently undertaking feasibility studies to assess the development of the
Namangale graphite project.
Figure 107: Namangale Project Location map
Source: Company reports, Canaccord Genuity estimates
Geology: Proterozoic basement rocks of the Mozambique Mobile Belt system which
principally comprise metamorphic rocks ranging from schist to gneisses including
marbles, amphibolite, graphitic schist, mica and kyanite schist, acid gneisses,
hornblende, biotite and garnet gneisses, quartzite, granulite, and pegmatite veins.
Within the project area there are widespread occurrences of outcropping Graphite,
which typically has grades in the range of 5-10% Graphitic Carbon.
Figure 106: VRC: ASX
Source: FactSet,
$-
$0.02
$0.04
$0.06
$0.08
$0.10
$0.12
$0.14
6/11/2015 6/02/2016 6/05/2016 6/08/2016 6/11/2016
Specialty Minerals and MetalsIndustry Overview
20 November 2016 62

63
Resources/Reserves: The key deposits within the project area are the Namangale
North and Namangale South deposits, located ~35km apart on a north-easterly trend.
Total Measured, Indicated (33%) and Inferred (62%) JORC-compliant resources were
last updated in Oct’16 to 446Mt at 5.01% TGC, defined to a depth of <100m.
Namangale North hosts a majority of the resource with +86% of the total.
Preliminary flake-size analysis conducted in Jul’16 on near-surface (oxide) bulk
samples from various test pits revealed a graphite flake size distribution heavily
skewed to larger flake, with ~57% in super jumbo (+500um) and jumbo (+300um)
flake sizes, and 81% including large (+180um) flake size.
Figure 108: Namangale Flake Size distribution*
Source: Company reports
Metallurgy: Subsequent test work was reported to have shown that graphite
concentrates can achieve a +99% purity using milling and flotation, with no chemical
leaching.
Feasibility, development & production: VRC’s most recent reported project timetable
calls for the completion of a PFS in Q4’16, with off-take agreements scheduled to be
finalised during MarQ’17, ahead of the completion of a BFS by JunQ’17.
No proposed project parameters have been reported and are expected to be released
with the project’s PFS.
Specialty Minerals and MetalsIndustry Overview
20 November 2016 63
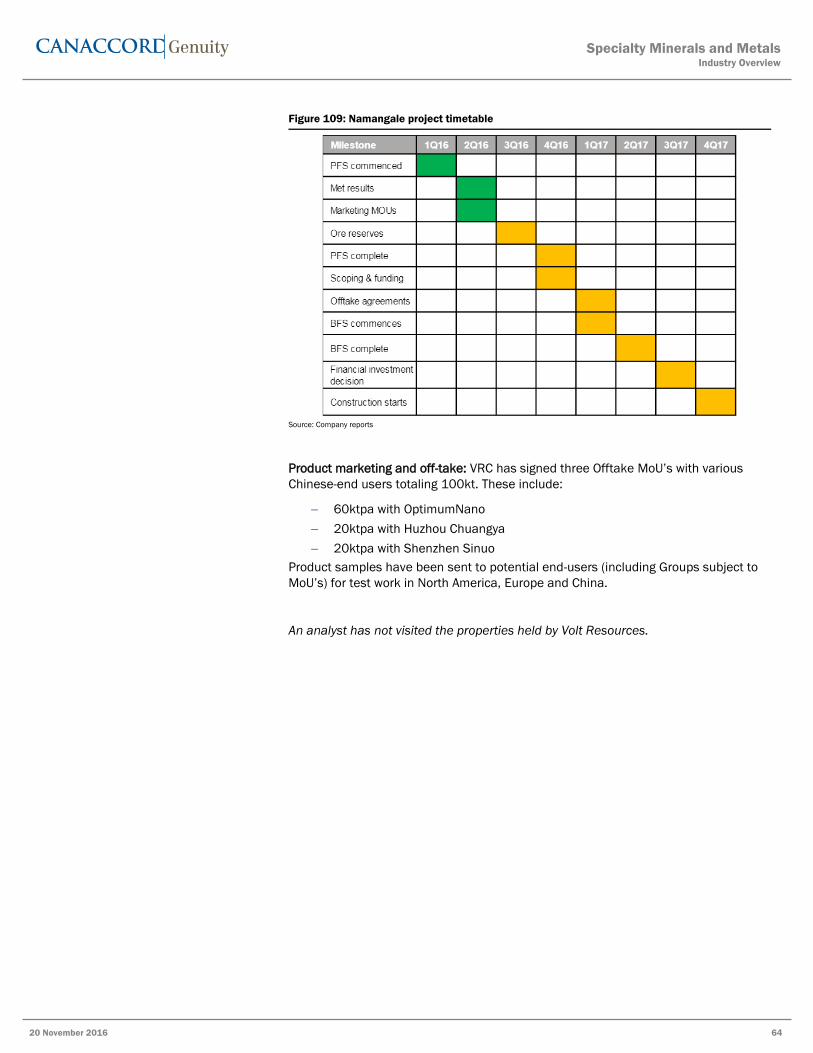
64
Figure 109: Namangale project timetable
Source: Company reports
Product marketing and off-take: VRC has signed three Offtake MoU’s with various
Chinese-end users totaling 100kt. These include:
60ktpa with OptimumNano
20ktpa with Huzhou Chuangya
20ktpa with Shenzhen Sinuo
Product samples have been sent to potential end-users (including Groups subject to
MoU’s) for test work in North America, Europe and China.
An analyst has not visited the properties held by Volt Resources.
Specialty Minerals and MetalsIndustry Overview
20 November 2016 64

Appendix: Important DisclosuresAnalyst CertificationEach authoring analyst of Canaccord Genuity whose name appears on the front page of this research hereby certifies that (i) therecommendations and opinions expressed in this research accurately reflect the authoring analyst’s personal, independent andobjective views about any and all of the designated investments or relevant issuers discussed herein that are within such authoringanalyst’s coverage universe and (ii) no part of the authoring analyst’s compensation was, is, or will be, directly or indirectly, related to thespecific recommendations or views expressed by the authoring analyst in the research.Analysts employed outside the US are not registered as research analysts with FINRA. These analysts may not be associated persons ofCanaccord Genuity Inc. and therefore may not be subject to the FINRA Rule 2241 and NYSE Rule 472 restrictions on communicationswith a subject company, public appearances and trading securities held by a research analyst account.Sector CoverageIndividuals identified as “Sector Coverage” cover a subject company’s industry in the identified jurisdiction, but are not authoringanalysts of the report.
Investment RecommendationDate and time of first dissemination: November 20, 2016, 14:59 ETDate and time of production: November 20, 2016, 15:28 ETTarget Price / Valuation Methodology:Syrah Resources Limited - SYROur target price is derived using a diluted net asset valuation approach, comprising our NPV12% for operating assets and projects, anominal valuation ascribed for other projects and resources, net of corporate and other adjustments.Risks to achieving Target Price / Valuation:Syrah Resources Limited - SYRThe key investment risks for SYR include: Technical Risk: There remain few comparative graphite prospects in the world similar tothe robust grades and nature of deposit representative to SYR's project. Understanding all elements of the technical risk involved inmining and processing graphite have been determined independently by third parties and are naturally inherent to risk. FinancingRisk: The ability for SYR to fund the development of Balama should be considered a key investment risk. Whilst we believe that SYR willcomfortably secure debt financing, markets could become conducive to securing the required funds to complete construction of theproject. Marketing and Off take Risk: Graphite is not traded on open exchanges such as the LME and therefore markets and pricingare generally set by off-take agreements between supplier and trader and or end customer. We expect that SYR will establish multipleoff-take agreements with traders and end-users. Establishing off-take agreements for economic quantities and prices is a key riskto SYR and our valuation and recommendation. Commodity price risk: All revenues derived from SYR will be subject to the contractprices received on the graphite product. Graphite is not a publically traded commodity; therefore, SYR is subject to commodity pricerisk via contract pricing that is agreed upon between SYR and its customer(s). We have factored in our modelling five different contractprices derived from the different mesh quality of graphite accepted into the market. Capital Expenditure Risk: Capital costs could comeunder pressure and exceed budget/or exhaust available funding before completion. This could result in a number of major impactsat the project and company level. Management and labour risk: An experienced and skilled management team is essential to thesuccessful development of Balama to take it into production and operations of the project. We view the current management team ascomplementary to the project; however, any additions or withdrawals to the current team could bring risk to the project.
Distribution of Ratings:Global Stock Ratings (as of 11/20/16)Rating Coverage Universe IB Clients
# % %Buy 565 59.98% 36.46%Hold 288 30.57% 17.36%Sell 25 2.65% 20.00%Speculative Buy 64 6.79% 68.75%
942* 100.0%*Total includes stocks that are Under Review
Canaccord Genuity Ratings SystemBUY: The stock is expected to generate risk-adjusted returns of over 10% during the next 12 months.
Specialty Minerals and MetalsIndustry Overview
20 November 2016 65

HOLD: The stock is expected to generate risk-adjusted returns of 0-10% during the next 12 months.
SELL: The stock is expected to generate negative risk-adjusted returns during the next 12 months.
NOT RATED: Canaccord Genuity does not provide research coverage of the relevant issuer.“Risk-adjusted return” refers to the expected return in relation to the amount of risk associated with the designated investment or therelevant issuer.Risk QualifierSPECULATIVE: Stocks bear significantly higher risk that typically cannot be valued by normal fundamental criteria. Investments in thestock may result in material loss.
12-Month Recommendation History (as of date same as the Global Stock Ratings table)A list of all the recommendations on any issuer under coverage that was disseminated during the preceding 12-month periodmay be obtained at the following website (provided as a hyperlink if this report is being read electronically) http://disclosures-mar.canaccordgenuity.com/EN/Pages/default.aspx
Required Company-Specific Disclosures (as of date of this publication)Syrah Resources Limited currently is, or in the past 12 months was, a client of Canaccord Genuity or its affiliated companies. During thisperiod, Canaccord Genuity or its affiliated companies provided investment banking services to Syrah Resources Limited.In the past 12 months, Canaccord Genuity or its affiliated companies have received compensation for Investment Banking services fromSyrah Resources Limited .In the past 12 months, Canaccord Genuity or any of its affiliated companies have been lead manager, co-lead manager or co-manager ofa public offering of securities of Syrah Resources Limited or any publicly disclosed offer of securities of Syrah Resources Limited or in anyrelated derivatives.Canaccord Genuity or one or more of its affiliated companies intend to seek or expect to receive compensation for Investment Bankingservices from Syrah Resources Limited in the next three months.
Jan 2014 Apr 2014 Jul 2014 Oct 2014 Jan 2015 Apr 2015 Jul 2015 Oct 2015 Jan 2016 Apr 2016 Jul 2016 Oct 2016
98765432
Syrah Resources Limited Rating History as of 11/17/2016
Closing Price Target Price
Buy (B); Speculative Buy (SB); Sell (S); Hold (H); Suspended (SU); Under Review (UR); Restricted (RE); Not Rated (NR)
B:AUD6.1611/20/13
B:AUD6.4212/16/13
B:AUD7.0503/10/14
B:AUD7.8003/25/14
B:AUD8.4004/30/14
B:AUD8.1006/10/14
B:AUD8.7608/03/14
B:AUD8.9109/25/14
B:AUD8.2512/22/14
B:AUD8.1012/30/14
B:AUD8.3402/02/15
B:AUD8.8502/10/15
B:AUD6.8506/03/15
B:AUD7.5006/18/15
B:AUD6.4508/09/15
B:AUD6.1004/26/16
B:AUD6.1504/28/16
B:AUD7.0007/18/16
SB:AUD7.0010/05/16
SB:AUD6.4510/26/16
Online DisclosuresUp-to-date disclosures may be obtained at the following website (provided as a hyperlink if this report is being read electronically)http://disclosures.canaccordgenuity.com/EN/Pages/default.aspx; or by sending a request to Canaccord Genuity Corp. Research, Attn:Disclosures, P.O. Box 10337 Pacific Centre, 2200-609 Granville Street, Vancouver, BC, Canada V7Y 1H2; or by sending a requestby email to [email protected]. The reader may also obtain a copy of Canaccord Genuity’s policies and proceduresregarding the dissemination of research by following the steps outlined above.General DisclaimersSee “Required Company-Specific Disclosures” above for any of the following disclosures required as to companies referred to in thisreport: manager or co-manager roles; 1% or other ownership; compensation for certain services; types of client relationships; researchanalyst conflicts; managed/co-managed public offerings in prior periods; directorships; market making in equity securities and relatedderivatives. For reports identified above as compendium reports, the foregoing required company-specific disclosures can be found ina hyperlink located in the section labeled, “Compendium Reports.” “Canaccord Genuity” is the business name used by certain whollyowned subsidiaries of Canaccord Genuity Group Inc., including Canaccord Genuity Inc., Canaccord Genuity Limited, Canaccord GenuityCorp., and Canaccord Genuity (Australia) Limited, an affiliated company that is 50%-owned by Canaccord Genuity Group Inc.
Specialty Minerals and MetalsIndustry Overview
20 November 2016 66

The authoring analysts who are responsible for the preparation of this research are employed by Canaccord Genuity Corp. a Canadianbroker-dealer with principal offices located in Vancouver, Calgary, Toronto, Montreal, or Canaccord Genuity Inc., a US broker-dealerwith principal offices located in New York, Boston, San Francisco and Houston, or Canaccord Genuity Limited., a UK broker-dealer withprincipal offices located in London (UK) and Dublin (Ireland), or Canaccord Genuity (Australia) Limited, an Australian broker-dealer withprincipal offices located in Sydney and Melbourne.The authoring analysts who are responsible for the preparation of this research have received (or will receive) compensation based upon(among other factors) the Investment Banking revenues and general profits of Canaccord Genuity. However, such authoring analystshave not received, and will not receive, compensation that is directly based upon or linked to one or more specific Investment Bankingactivities, or to recommendations contained in the research.Some regulators require that a firm must establish, implement and make available a policy for managing conflicts of interest arising asa result of publication or distribution of research. This research has been prepared in accordance with Canaccord Genuity’s policy onmanaging conflicts of interest, and information barriers or firewalls have been used where appropriate. Canaccord Genuity’s policy isavailable upon request.The information contained in this research has been compiled by Canaccord Genuity from sources believed to be reliable, but (with theexception of the information about Canaccord Genuity) no representation or warranty, express or implied, is made by Canaccord Genuity,its affiliated companies or any other person as to its fairness, accuracy, completeness or correctness. Canaccord Genuity has notindependently verified the facts, assumptions, and estimates contained herein. All estimates, opinions and other information containedin this research constitute Canaccord Genuity’s judgement as of the date of this research, are subject to change without notice and areprovided in good faith but without legal responsibility or liability.From time to time, Canaccord Genuity salespeople, traders, and other professionals provide oral or written market commentary ortrading strategies to our clients and our principal trading desk that reflect opinions that are contrary to the opinions expressed in thisresearch. Canaccord Genuity’s affiliates, principal trading desk, and investing businesses also from time to time make investmentdecisions that are inconsistent with the recommendations or views expressed in this research.This research is provided for information purposes only and does not constitute an offer or solicitation to buy or sell any designatedinvestments discussed herein in any jurisdiction where such offer or solicitation would be prohibited. As a result, the designatedinvestments discussed in this research may not be eligible for sale in some jurisdictions. This research is not, and under nocircumstances should be construed as, a solicitation to act as a securities broker or dealer in any jurisdiction by any person or companythat is not legally permitted to carry on the business of a securities broker or dealer in that jurisdiction. This material is prepared forgeneral circulation to clients and does not have regard to the investment objectives, financial situation or particular needs of anyparticular person. Investors should obtain advice based on their own individual circumstances before making an investment decision.To the fullest extent permitted by law, none of Canaccord Genuity, its affiliated companies or any other person accepts any liabilitywhatsoever for any direct or consequential loss arising from or relating to any use of the information contained in this research.Research Distribution PolicyCanaccord Genuity research is posted on the Canaccord Genuity Research Portal and will be available simultaneously for access by allof Canaccord Genuity’s customers who are entitled to receive the firm's research. In addition research may be distributed by the firm’ssales and trading personnel via email, instant message or other electronic means. Customers entitled to receive research may alsoreceive it via third party vendors. Until such time as research is made available to Canaccord Genuity’s customers as described above,Authoring Analysts will not discuss the contents of their research with Sales and Trading or Investment Banking employees without priorcompliance consent.For further information about the proprietary model(s) associated with the covered issuer(s) in this research report, clients shouldcontact their local sales representative.Short-Term Trade IdeasResearch Analysts may, from time to time, discuss “short-term trade ideas” in research reports. A short-term trade idea offers a near-term view on how a security may trade, based on market and trading events or catalysts, and the resulting trading opportunity that maybe available. Any such trading strategies are distinct from and do not affect the analysts' fundamental equity rating for such stocks. Ashort-term trade idea may differ from the price targets and recommendations in our published research reports that reflect the researchanalyst's views of the longer-term (i.e. one-year or greater) prospects of the subject company, as a result of the differing time horizons,methodologies and/or other factors. It is possible, for example, that a subject company's common equity that is considered a long-term ‘Hold' or 'Sell' might present a short-term buying opportunity as a result of temporary selling pressure in the market or for otherreasons described in the research report; conversely, a subject company's stock rated a long-term 'Buy' or “Speculative Buy’ could beconsidered susceptible to a downward price correction, or other factors may exist that lead the research analyst to suggest a sale overthe short-term. Short-term trade ideas are not ratings, nor are they part of any ratings system, and the firm does not intend, and does notundertake any obligation, to maintain or update short-term trade ideas. Short-term trade ideas are not suitable for all investors and arenot tailored to individual investor circumstances and objectives, and investors should make their own independent decisions regardingany securities or strategies discussed herein. Please contact your salesperson for more information regarding Canaccord Genuity’sresearch.For Canadian Residents:
Specialty Minerals and MetalsIndustry Overview
20 November 2016 67

This research has been approved by Canaccord Genuity Corp., which accepts sole responsibility for this research and its disseminationin Canada. Canaccord Genuity Corp. is registered and regulated by the Investment Industry Regulatory Organization of Canada (IIROC)and is a Member of the Canadian Investor Protection Fund. Canadian clients wishing to effect transactions in any designated investmentdiscussed should do so through a qualified salesperson of Canaccord Genuity Corp. in their particular province or territory.For United States Persons:Canaccord Genuity Inc., a US registered broker-dealer, accepts responsibility for this research and its dissemination in the United States.This research is intended for distribution in the United States only to certain US institutional investors. US clients wishing to effecttransactions in any designated investment discussed should do so through a qualified salesperson of Canaccord Genuity Inc. Analystsemployed outside the US, as specifically indicated elsewhere in this report, are not registered as research analysts with FINRA. Theseanalysts may not be associated persons of Canaccord Genuity Inc. and therefore may not be subject to the FINRA Rule 2241 and NYSERule 472 restrictions on communications with a subject company, public appearances and trading securities held by a research analystaccount.For United Kingdom and European Residents:This research is distributed in the United Kingdom and elsewhere Europe, as third party research by Canaccord Genuity Limited,which is authorized and regulated by the Financial Conduct Authority. This research is for distribution only to persons who are EligibleCounterparties or Professional Clients only and is exempt from the general restrictions in section 21 of the Financial Services andMarkets Act 2000 on the communication of invitations or inducements to engage in investment activity on the grounds that it is beingdistributed in the United Kingdom only to persons of a kind described in Article 19(5) (Investment Professionals) and 49(2) (High NetWorth companies, unincorporated associations etc) of the Financial Services and Markets Act 2000 (Financial Promotion) Order 2005(as amended). It is not intended to be distributed or passed on, directly or indirectly, to any other class of persons. This material is not fordistribution in the United Kingdom or elsewhere in Europe to retail clients, as defined under the rules of the Financial Conduct Authority.For Jersey, Guernsey and Isle of Man Residents:This research is sent to you by Canaccord Genuity Wealth (International) Limited (CGWI) for information purposes and is not to beconstrued as a solicitation or an offer to purchase or sell investments or related financial instruments. This research has been producedby an affiliate of CGWI for circulation to its institutional clients and also CGWI. Its contents have been approved by CGWI and we areproviding it to you on the basis that we believe it to be of interest to you. This statement should be read in conjunction with your clientagreement, CGWI's current terms of business and the other disclosures and disclaimers contained within this research. If you are in anydoubt, you should consult your financial adviser.CGWI is licensed and regulated by the Guernsey Financial Services Commission, the Jersey Financial Services Commission and the Isleof Man Financial Supervision Commission. CGWI is registered in Guernsey and is a wholly owned subsidiary of Canaccord Genuity GroupInc.For Australian Residents:This research is distributed in Australia by Canaccord Genuity (Australia) Limited ABN 19 075 071 466 holder of AFS Licence No234666. To the extent that this research contains any advice, this is limited to general advice only. Recipients should take into accounttheir own personal circumstances before making an investment decision. Clients wishing to effect any transactions in any financialproducts discussed in the research should do so through a qualified representative of Canaccord Genuity (Australia) Limited. CanaccordGenuity Wealth Management is a division of Canaccord Genuity (Australia) Limited.For Hong Kong Residents:This research is distributed in Hong Kong by Canaccord Genuity (Hong Kong) Limited which is licensed by the Securities and FuturesCommission. This research is only intended for persons who fall within the definition of professional investor as defined in the Securitiesand Futures Ordinance. It is not intended to be distributed or passed on, directly or indirectly, to any other class of persons. Recipients ofthis report can contact Canaccord Genuity (Hong Kong) Limited. (Contact Tel: +852 3919 2561) in respect of any matters arising from, orin connection with, this research.Additional information is available on request.Copyright © Canaccord Genuity Corp. 2016 – Member IIROC/Canadian Investor Protection Fund
Copyright © Canaccord Genuity Limited. 2016 – Member LSE, authorized and regulated by the Financial Conduct Authority.
Copyright © Canaccord Genuity Inc. 2016 – Member FINRA/SIPC
Copyright © Canaccord Genuity (Australia) Limited. 2016 – Participant of ASX Group, Chi-x Australia and of the NSX. Authorized andregulated by ASIC.
All rights reserved. All material presented in this document, unless specifically indicated otherwise, is under copyright to CanaccordGenuity Corp., Canaccord Genuity Limited, Canaccord Genuity Inc or Canaccord Genuity Group Inc. None of the material, nor its content,nor any copy of it, may be altered in any way, or transmitted to or distributed to any other party, without the prior express writtenpermission of the entities listed above.None of the material, nor its content, nor any copy of it, may be altered in any way, reproduced, or distributed to any other partyincluding by way of any form of social media, without the prior express written permission of the entities listed above.
Specialty Minerals and MetalsIndustry Overview
20 November 2016 68