
VolII B FC a Coast - Oregon Department of Fish and Wildlife · Yes Nestucca Nestucca River basin...
31
Oregon Native Fish Status Report – Volume II 72 Fall Chinook
-
Upload
phungduong -
Category
Documents
-
view
215 -
download
0
Transcript of VolII B FC a Coast - Oregon Department of Fish and Wildlife · Yes Nestucca Nestucca River basin...
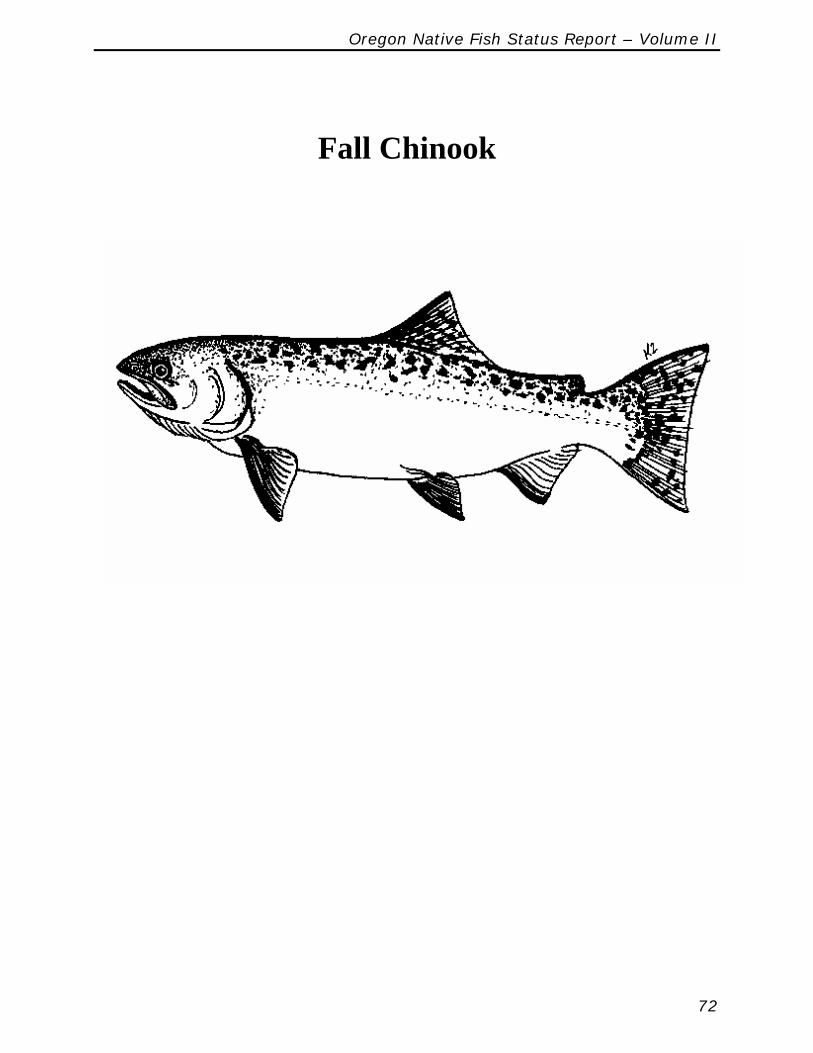
Oregon Native Fish Status Report – Volume II
72
Fall Chinook

Oregon Native Fish Status Report – Volume II
Coastal Fall Chinook 73
Coastal Fall Chinook
Existing Populations
The Coastal Fall Chinook SMU includes 18 populations within Oregon coastal tributaries between the Necanicum River and Sixes River. Each of the populations is still in existence (Table 24). The Nehalem early-run population was identified as “summer run” by Kostow (1995). These fish begin entering the Nehalem as early as July, and the end of their arrival overlaps with the beginning of fall Chinook arrivals in September (Kostow 1995; Nicholas and Hankin 1989) Table 24. Population list and existence status for the Coastal Fall Chinook SMU.
Exist Population Description Yes Necanicum Necanicum River basin plus ocean tributaries south to Cape Falcon. Yes Nehalem Early-run Nehalem River basin. Yes Nehalem Nehalem River basin. Yes Tillamook All tributaries to Tillamook Bay plus Netarts Bay tributaries. Yes Nestucca Nestucca River basin plus Neskowin Creek and Sand Lake watersheds. Yes Salmon Salmon River basin. Yes Siletz Siletz River basin. Yes Yaquina Yaquina River basin. Yes Alsea Alsea River basin. Yes Yachats Yachats River basin. Yes Siuslaw Siuslaw River basin. Yes North Umpqua North Fork Umpqua river basin. Yes Upper Umpqua Umpqua River basin upstream of, and including Elk Creek, but excluding
the North Fork Umpqua basin. Yes Lower Umpqua Umpqua River basin (including Smith River) upstream to Elk Creek (near
Elkton). Yes Coos Coos River basin. Yes Coquille Coquille River basin. Yes Floras Floras Creek basin and coastal tributaries north to Coquille River mouth. Yes Sixes Sixes River basin.
Habitat Use Distribution
The criterion was evaluated based on current and historically accessible areas. Many populations show “0 miles inaccessible” (Table 25). It must be recognized that these estimates are derived at the 1:100,000 scale and thus will not capture habitat lost in many smaller (1:24,000) streams resulting from barriers such as culverts. Habitat lost in smaller streams will vary by population, but is not likely to account for 50% of any population, and thus does not alter assessment outcomes derived using data at the 1:100,000 scale. Data presented in this report on accessibility of habitat should be viewed as general approximations and not as a definitive analysis on habitat availability/accessibility. These issues will be more thoroughly addressed through the conservation planning process.
These data also do not reflect changes in habitat usage due to changes in habitat quality, or changes in availability of estuary habitat. Christy (2004) estimated that 74% of freshwater wetland and saltwater marsh habitat has been lost or converted to other habitat types in basins within the Coastal Coho SMU since 1850. These types of habitat may be critical to juvenile fall Chinook rearing as well and are not captured in our assessments based on accessible and inaccessible freshwater spawning and rearing habitat.

Oregon Native Fish Status Report – Volume II
Coastal Fall Chinook 74
Habitat usage by Nehalem early-run Chinook is somewhat uncertain. Early-run Nehalem fall Chinook are thought to spawn primarily in Rock Creek, and the mainstem Nehalem upstream of Humbug Creek (pers. comm., B. Buckman, 1/28/05) though they have access to as much habitat as the later-run of Nehalem fall Chinook. Table 25. Habitat accessibility data used in evaluating interim criteria for the Coastal Fall Chinook SMU.
Population Accessible (miles) Inaccessible (miles) Percent Accessible Necanicum 29 0 100% Nehalem Early-run 185 0 100% Nehalem 176 0 100% Tillamook 228 4 98% Nestucca 162 0 100% Salmon 37 0 100% Siletz 156 0 100% Yaquina 158 0 100% Alsea 197 0 100% Yachats 20 0 100% Siuslaw 360 0 100% North Umpqua 63 0 100% Upper Umpqua 261 4 98% Lower Umpqua 171 1 99% Coos 210 0 100% Coquille 299 0 100% Floras 19 0 100% Sixes 48 0 100%
Abundance
The primary source of abundance data for this SMU are peak counts in standard survey reaches. Standard surveys began in several coastal basins as early as 1947, and by 1986 were being conducted for 11 different populations. Peak counts in Table 26 reflect abundance of hatchery and naturally-produced fish combined. Hatchery fractions are not well understood in some basins, but in most basins are thought to be fairly negligible. Other abundance indices include counts of fall Chinook passing Winchester Dam in the North Umpqua, and abundance estimates extrapolated from aerial redd counts in the Upper Umpqua (Moyers et al. 2003). In the Salmon, mark-recapture estimates have been used to estimate the total spawning population since 1986. The Salmon River estimates were adjusted by the hatchery-to-naturally produced fraction of spawners to estimate naturally-produced spawners. No abundance trends were available for the early-run Nehalem or Lower Umpqua populations.

Oregon Native Fish Status Report – Volume II
Coastal Fall Chinook 75
Table 26. Abundance estimates used in evaluating interim criteria for the Coastal Fall Chinook SMU. Data are peak counts (in fish per mile) of live and dead fish unless otherwise noted. Cause of death for dead fish is not ascertained during surveys.
30 Year 25th Abundance by Return Year No. Years >25% Population Average Percentile 1999 2000 2001 2002 2003 2004 of Average Necanicuma,b 7 2 2 4 10 11 21 -- 4 Nehalem Early-runb Similar to Nehalem Pass Nehalem 67 17 -- 53 89 156 86 78 5 Tillamook 63 16 -- 17 65 74 61 66 5 Nestucca 181 45 -- 80 132 310 68 190 5 Salmonc 1,748 437 1,208 1,245 1,273 1,196 3,302 -- 5 Siletz 52 13 -- 54 103 145 101 34 5 Yaquina 34 9 -- 1 26 28 31 26 4 Alsea 69 17 -- 80 203 188 193 160 5 Yachatsd 90 23 135 128 109 149 194 -- 5 Siuslaw 186 47 -- 138 349 423 604 476 5 North Umpquae 166 42 -- 202 247 154 581 267 5 Upper Umpquaf 4,344 1,086 1,979 2,591 5,402 7,621 10,158 -- 5 Lower Umpquag Insufficient Data 20.0 57.1 60.5 186.0 241.0 -- Pass Coos 101 25 -- 87 148 195 434 155 5 Coquille 78 20 -- 73 93 137 187 142 5 Floras 71 18 -- 42 128 173 170 62 5 Sixes 60 15 -- 2 67 57 51 153 4 a. 30-year average based on 15 years of data. Data is sum of peak fall Chinook counts in two standard coho survey
reaches. b. See “Population Details” for further information on the pass designation. c. Spawner abundance estimate. Average based on 17 years of data. d. Catch card estimates. Average abundance based on 17 years of data. e. Counts of non-finclipped fish at Winchester Dam. f. Abundance estimate based on aerial redd counts in South Umpqua. 2002 estimate is still preliminary. Average abundance based on 24 years of data. g. Inferred to pass based on increasing abundance trend and assessment outcomes of North and Upper Umpqua, and the observed high degree of correlation between returns in all three areas.
Productivity
Productivity was estimated using spawner abundance estimates and annual spawner age compositions. Hatchery composition was only included where available. For other populations, estimates were either not available, or hatchery fish were essentially absent from natural spawning. Age compositions were provided by ODFW (pers. comm., Lisa Borgerson, 6/25/04). Where possible, only wild fish were included in age composition estimates. Annual estimates of age composition were included when sample sizes were greater than 50. In other years, an aggregate age composition from all years of sampling was used. Productivity could not be estimated for populations without abundance data.

Oregon Native Fish Status Report – Volume II
Coastal Fall Chinook 76
Table 27. Productivity estimates used in evaluating interim criteria for the Coastal Fall Chinook SMU.
Recent Complete Brood Years Productivity (R/S) Population of Below Average Abundance Year 1 Year 2 Year 3 Year 4 Year 5 Years > 1.2 Necanicuma 1993-95, 1997-98 >1.2 >1.2 2.8 10.4 6.5 5 Nehalem Early-runb Similar to Nehalem Pass Nehalem 1994-96, 1998-99 1.4 1.3 0.6 2.1 1.4 4 Tillamookb 1991, 1993-94, 1997, 1999 0.6 1.0 0.8 1.6 3.1 Pass Nestucca 1990, 1993, 1996-98 2.3 1.6 1.5 3.2 1.8 5 Salmonc 1990-91,93 -- -- 1.3 0.7 1.2 Pass Siletzb 1991, 1993, 1995, 1997, 1999 0.7 1.1 0.7 4.7 1.8 Pass Yaquina 1990-1993, 1999 9.4 11.3 2.5 2.8 1.4 5 Alsea 1991, 1993-94, 1997-98 1.0 3.3 1.9 3.8 2.8 4 Yachats Increasing freshwater harvest trend – indicative of abundance Pass Siuslaw 1993-95, 1997-98 2.1 0.8 1.2 1,9 3.8 4 North Umpqua 1993-94, 1997-99 1.5 0.5 1.8 4.3 13.7 4 Upper Umpqua 1987-88, 1990, 1993, 1998 2.1 1.8 1.8 2.0 5.3 5 Lower Umpquad Increasing abundance trend – short term dataset Pass Coos 1991-92, 1997-99 3.5 2.6 1.9 3.3 5.2 5 Coquille 1990, 1993-94, 1996-97 1.7 0.9 1.7 0.7 1.6 3 Floras 1991, 1993, 1996-98 2.9 1.8 10.6 5.5 2.6 5 Sixese 1990-91, 1993, 1997, 1999 3.7 4.2 2.0 1.7 1.8 5 a. First two years yielded recruits from a brood where no parents were observed. Recruits not divisible by 0. b. See “Population Details” for further information on pass designation. c. Only three years with parent abundance below wild average. See “Population Details” for explanation of pass designation. d. Pass designation based on increasing abundance trend, and assessment outcomes for the North and Upper Umpqua populations. e. See “Population Details” for this population. Estimates of productivity may be high.
Reproductive Independence
In general, hatchery fractions throughout the SMU were very low (<5%). Assessments for most of the populations within this SMU were based largely on hatchery release levels, observations of finmarked fish on the spawning ground in select basins, and anectodal information. Spawning ground observations of finmarked and non-finmarked fish from many basins and years were deemed insufficient for use in this assessment due to some data quality concerns. Spawning ground observation data included in this assessment were limited to 2002 and 2003 observations in the Nehalem, Siuslaw, Coquille, Wilson (Tillamook), Siletz, and Sixes rivers.
Hatchery release data were provided by ODFW (pers. comm., Mark Lewis, 4/27/04). Recoveries of finmarked and non-finmarked carcasses during spawning ground surveys were provided by ODFW (pers. comm., Briana Sounhein). Those observations were expanded by hatchery release finmark rates downloaded from the RMIS online database (PSMFC 2004). It was assumed that the mark rates of hatchery adults within a basin was the same as the mark rate of hatchery juveniles released in that basin.
Hatchery fractions of fall Chinook on the spawning grounds in the Salmon have been estimated by ODFW for the period 1987-2003 (pers. comm., Brian Riggers, 7/28/04). Those estimates were used in assessment of the Salmon.
Explanation of the pass/fail designation of other populations can be found in the “Population Details” section.

Oregon Native Fish Status Report – Volume II
Coastal Fall Chinook 77
Table 28. Reproductive independence estimates used in evaluating interim criteria for the Coastal Fall Chinook SMU.
Percent of Spawning Fish of Hatchery Origin Years Population 1999 2000 2001 2002 2003 Below 10% Necanicum Smolt releases average 25,000 – low levels of releases per mile Pass Nehalem Early-run No hatchery releases – assumed similar to Nehalem Pass Nehalem -- -- -- -- 0% Pass Tillamook Smolt releases average 113,000 0% 0% Pass Nestucca Few hatchery fish observed Pass Salmon 38% 53% 59% 61% 66% 0 Siletz No recent hatchery releases 1% 1% Pass Yaquina Very few marked fish observed on spawning grounds Pass Alsea No recent hatchery releases Pass Yachats No hatchery releases Pass Siuslaw Very few marked fish observed – PST index basin Pass North Umpqua Identified by Pacific Salmon Treaty as index basin Pass Upper Umpqua Identified by Pacific Salmon Treaty as index basin Pass Lower Umpqua Identified by Pacific Salmon Treaty as index basin Pass Coos Insufficient data, but large hatchery program Fail Coquille -- -- 1% 0% 1% >3 Floras Limited releases of unfed fry Pass Sixes -- -- -- 38% 15% Fail
Hybridization Hybridization has not been identified as an issue for coastal fall Chinook.
Population Details Necanicum The only abundance data available were 15 years of counts of fall Chinook during standard coho surveys in the Necanicum River and Ecola Creek.
Assessment of hatchery to naturally-produced ratios in the Necanicum were difficult because hatchery releases were made in that basin, but no spawning ground data were available to get empirical estimates of hatchery fractions. Several population within the SMU with hatchery releases and data to estimate hatchery fractions among spawners indicate that the presence of hatchery releases does not necessarily indicate high frequencies of hatchery spawners. The Tillamook, Coos, and Coquille each have hatchery releases and have low frequencies of hatchery spawners. The Salmon has high numbers of releases and high hatchery-to-naturally produced ratios. The Sixes has no hatchery releases, but has high hatchery fractions. It is likely strays there result from massive releases in the nearby Elk River. We examined smolt releases-per-mile of fall Chinook habitat in the Tillamook, Coos, Coquille, and Salmon and compared them to releases-per-mile in the Necanicum. The intent of the analysis was to examine the relationship between releases-per-mile and the pass/fail status of the criterion. Release per mile in the Tillamook, Coos, and Coquille where hatchery fractions among spawners were low ranged from 332-478. Releases-per-mile in the Salmon with extremely high hatchery fractions were 5,423. Since releases in the Necanicum were only 510 fish-per-mile, we reasoned that the population should pass the criterion since the “release density” was similar to other basins that passed the criterion. Use of the Tillamook in this analysis should be taken with some caution because hatchery fish are primarily released in the Trask, and mark observations were from the Wilson.

Oregon Native Fish Status Report – Volume II
Coastal Fall Chinook 78
This analysis does not take into account rearing and release strategies, freshwater harvest levels, or adult removal practices.
Nehalem and Nehalem Early-run The Nehalem Early-run population primarily spawns in Rock Creek and in the mainstem Nehalem River above Humbug Creek. In the late 1980s and early 1990s, ODFW showed that there was a spatial segregation in the spawn timing of the early run population and the late run population (pers. comm., ODFW, Bob Buckman, 1/28/05). Early run spawning was past its peak generally by mid-October, several weeks before a secondary peak of the fall run population. We examined data provided by ODFW (pers. comm., Brian Riggers, 1/27/05) to determine if that segregation still existed. ODFW has conducted spawner surveys throughout the Nehalem since 2000 as part of Oregon’s obligation to the Pacific Salmon Treaty. Spawning survey reaches were grouped into five categories, two for early-run and three for fall run. The two summer run categories were “Mainstem Nehalem above Humbug Creek” and “Rock Creek”. The three fall run categories were “Mainstem Nehalem below Humbug Creek”, “Lower Mainstem Tributaries”, and “Upper Mainstem Tributaries”. The upper and lower tributaries were distinguished by their position along the mainstem relative to Humbug Creek.
Examination of the number of carcasses per stream survey (only including surveys where at least one carcass was sampled) showed a distinct difference in peak spawn timing between the early-run spawning areas and the fall run spawning areas (Figure 9). In 2002, the year with the largest sample size, peak spawning in the early-run areas peaked in week 43 and was completed by week 47. In fall run reaches, spawning was initiated in earnest in week 43 and peaked in week 49 with completion near the end of the year (week 52). This evidence suggests clear spatial and temporal differences in spawning of early-run and fall chinook in the Nehalem. Less extensive data from 2003 corroborates the findings from 2002.
Nehalem Spawn Timing
0102030405060708090
100
39 40 41 42 43 44 45 46 47 48 49 50 51 52
Week Number
Fish
per
Sur
vey
Nehalem (above Humbug)Rock Cr
Lower TribsNehalem (below Humbug)
Upper Tribs
Figure 9. 2002 spawn timing of Chinook in areas of the Nehalem Basin. The mainstem Nehalem above Humbug Creek and Rock Creek are thought to be the main spawning areas for early-run fall Chinook. Dataset only included surveys where at least one fish was observed.

Oregon Native Fish Status Report – Volume II
Coastal Fall Chinook 79
It was presumed that the Nehalem early-run passed the abundance and productivity criteria because abundance trends for the early-run are related to trends of the fall run population. Using spawning survey data from 1989-1993 and 2000-2003, we examined trends in abundance indicies for the two populations. Those were the only two periods with data to index the early-run population. The two populations were distinguished within spawning surveys based on spatial segregation identified above. In each year, the trend in abundance from the previous year (increasing or decreasing) was the same with only one exception (1990). While increases and decreases were not proportionally equal for the two populations, the data provide evidence that the two populations are reacting similarly to environmental conditions. Using this relationship, and the fact that the Nehalem population passed both the abundance and productivity criteria, it was decided that the Nehalem Early-run population should pass these criteria as well.
Both of these populations passed the reproductive independence criterion. No releases of early-run or later run fall Chinook are made in the Nehalem. Recoveries of marked carcasses during spawning surveys in 2003 suggest that few stray fall Chinook enter the Nehalem. Of 845 carcasses sampled, none were hatchery-marked. While those surveys may target the later-run of Chinook, we assumed that stray rates would be similar for the early-run. Further, the Nehalem Basin was identified in the Pacific Salmon Treaty as an index basin because it was presumed to be free of hatchery fish influences.
Tillamook Assessment of productivity in the Tillamook using methods applied to other populations yielded results that were not believed to accurately reflect the condition of the population. Using peak counts, age compositions, and methods outlined by the interim criteria, productivity in the Tillamook was below 1.2 in three of the last five years of below average abundance. Those five years included 1991, 1993, 1994, 1997, and 1999. These years were selected based on the assumption that density dependent factors would not be strong due to below average spawner abundance. This assumption of weak density dependent mechanisms is essential to the assessment. Strong density dependent factors would be indicative of a population at or near carrying capacity. A population at carrying capacity would be expected to approximately replace itself. It would not be expected to meet the criterion of 1.2 recruits per spawner in three of the last five years.
Nicholas and Hankin (1989) indicated that in the early 1980s, juvenile fall Chinook in Tillamook Bay were very abundant and well distributed. In addition, they termed the Tillamook Bay as a “high stocking density” rearing area leaving little room for additional recruitment. In sampling by the Tillamook Estuaries Partnership in the late 1990s, they found that juvenile chinook were abundant and well distributed in the bay. Further, sampling at outmigrant traps in the Little North Fork Wilson and Little South Fork Kilchis have recently shown extraordinary production of juvenile Chinook (in excess of 1 million juveniles) even though these basins contain a small portion of the spawing habitat within Tillamook Bay tributaries. Spawner densities in the early 1980s at the time of the Nicholas and Hankin study and the late 1990s are similar (23-53 spawners per mile compared to 32-35 spawners per mile). The juvenile production data would indicate that full seeding is somewhere at or below these spawner levels. Spawner levels examined in our productivity estimate ranged from 22-61 spawners per mile with four years greater than 50 spawners per mile). This suggests that years in which productivity estimates were examined, the Tillamook had exceeded full seeding, density dependent mechanisms were occurring, and recruits per spawner was unlikely to meet the criterion of 1.2. If we were to examine R/S estimates only in years with less than 50 spawners per mile, we find that 1.2 would have been exceeded in all five years (1981-84 and 1999 broods). Fifty spawners per mile is at or

Oregon Native Fish Status Report – Volume II
Coastal Fall Chinook 80
above the level we would expect to see full seeding based on juvenile production information, but below the 30-year average abundance. Citing the preceding information, we determined that the population passed the criterion. In this instance, it was determined based on juvenile production information that the 30-year average abundance over-estimated full seeding, and resulted in an overly-conservative evaluation of the productivity criterion.
The Tillamook population passed the reproductive independence criterion. Significant hatchery releases have been made in Tillamook Bay tributaries over the past decade. Unfed fry releases have ranged from 10,000-400,000 annually, and smolt releases from 100,000-170,000 annually. Despite these releases, Kostow (1995) suggested that stray rates in the Tillamook population were low. This was based on data from a 1990 ODFW creel survey that showed 10% of fall Chinook harvested in Tillamook Bay were hatchery origin, and the presumption that returns of naturally-produced fall Chinook were healthy. Hatchery releases into the Tillamook have decreased since the mid 1980s. Nicholas and Hankin (1989) reported that 300,000 fingerlings and 150,000 smolts were released annually into Tillamook Bay tributaries in the 1980s. Releases from 1998-2002 averaged 180,000 unfed fry and 105,000 smolts. Reductions in release levels led us to presume that stray rates have been reduced and at largest would be expected to be less than 10%. This presumption is supported by spawning ground observations in 2002 and 2003 that suggest stray rates in the Tillamook population are very low. No fish out of 675 carcasses sampled in the Wilson in 2002 and 2003 were finmarked. Not all coastal fall Chinook are finmarked, but 30-50% of juveniles released in the Trask were marked between 1990 and 2000 (PSMFC online data 2004).
Nestucca The Rhoades Pond STEP rearing project began releasing 40,000-100,000 smolts beginning in 2000. The Nestucca population passed the reproductive independence criterion because age four and five fish from those releases would not begin returning until 2003, so at least three of the last five years would have had very few hatchery spawners (assuming low out-of-basin stray rates). Spawner surveys in 2004 indicate that hatchery fractions have remained low despite returns from the hatchery program. Expansion of finmarks observed on the spawning ground by hatchery mark rates indicated that only 4.6% of naturally spawning fish were of hatchery origin.
Salmon Abundance estimates and hatchery-to-naturally produced ratios in the Salmon population were provided by ODFW (pers. comm., Brian Riggers, 7/28/04). Productivity could be estimated for the 1987-1997 broods. In only three years was total parent abundance below the average naturally-produced abundance. In two of those three years, recruit per spawner estimates equaled or exceeded 1.2. This result was cited as the reason for the Salmon population to pass the productivity criterion. This method is consistent with the assessment of reproductive independence for coho in the Clatskanie when only three years of estimates were available.
Hatchery-to-natural ratios estimated based on spawning ground surveys were used in this assessment. Spawning ground estimates are corroborated by estimates from the freshwater fishery which over the past 17 years have averaged 6% higher than ratios on the spawning ground (49% compared to 43%).
Siletz
Assessment of productivity in the Siletz population using methods applied to other populations yielded results that were not believed to accurately reflect the population. Using peak counts, age compositions, and methods outlined by the interim criteria, productivity in the Siletz was

Oregon Native Fish Status Report – Volume II
Coastal Fall Chinook 81
below 1.2 in three of the last five years of below average abundance. Those five years included 1991, 1993, 1995, 1997, and 1999. These years were selected based on the assumption that density dependent factors would not be strong due to below average spawner abundance. This assumption of weak density dependent mechanisms is essential to the assessment. Strong density dependent factors would be indicative of a fish population at carrying capacity. A population at carrying capacity would be expected to approximately replace itself. It would not be expected to meet the criteria for of 1.2 recruits per spawner in three of the last five years.
Nicholas and Hankin (1989) indicated that for the 1977-1986 Siletz fall chinook brood years, juvenile abundance in the Siletz estuary was generally high and size of fish was small. This indicates density dependent mechanisms were coming into play. However, the spawner abundances in the years examined under the productivity assessment are within the range observed in years evaluated by Nicholas and Hankin (1989) where density dependent factors were operating.
Nicholas and Hankin also identified that in a year with very low chinook spawner success due to extended drought (1976), Siletz fall chinook average size at ocean entrance was estimated at 13.4 cm. This is much larger than the size of juvenile chinook for the 1977-1986 broods, and much larger than anything seen in seining by ODFW from 1997-1999 (pers. comm., B. Buckman, 1/12/05). This reaffirms density dependent mechanisms are substantial in all but the most exceptional years and that the Siletz is near habitat carrying capacity.
Zhou and Williams (2000) determined maximum sustained yield (MSY) and maximum sustained production (MSP) values for Siletz fall chinook. They estimated MSY at 2,400 to 4,700 spawners and MSP at 2,900 to 4,800 spawners which correlated to redd densities of 17-35 spawners per mile. Parent redd densities in years analyzed for the productivity assessment ranged from 30.9-50.9, well above the MSY level. Further, Zhou and Williams (2000) found that the Siletz is a highly productive stock with an average pre-harvest recruit per spawner estimate of 4.3 (1967-1991 broods).
Given the combination of the outmigrant study and stock-recruitment analysis we found it reasonable to conclude that the Siletz population is sufficiently productive to pass the interim criterion. Failure to pass under original assessment methods resulted from over-estimation of the abundance level at which density dependence in the Siletz begins to occur (30-year average abundance).
The Siletz population passed the reproductive independence criterion because no hatchery releases of fall Chinook have been made in this basin, and among basin stray rates have been documented to be low. In 2002 and 2003, only five of 770 carcasses sampled were hatchery finmarked. Marking rates of juveniles released from the Yaquina and Salmon (nearby hatchery programs) have been 70% from 1997-2000 (PSMFC online data 2004). The Siletz was identified in the Pacific Salmon Treaty as an index basin because it was presumed to be free of hatchery fish influences.
Yaquina The Yaquina population passed the independence criterion based on observations of finclipped and non-finclipped fish during spawning ground surveys in the past five years. Over five years, only two of 900 fish have been marked, and zero out of 650 in the last two years. While not all fall chinook juveniles released on the Oregon coast are marked, mark rate observations among adults in the Yaquina are so infrequent it can safely be said that hatchery fractions have been below 10%.
Oregon Native Fish Status Report – Volume II
Coastal Fall Chinook 82
Alsea The Alsea population passed the reproductive independence criterion because no hatchery releases of fall Chinook have been made in this basin since 1996.
Yachats The only index of abundance in the Yachats population was from salmon catch card data. Harvest estimates were available from 1987-2003 and showed a clear increasing trend. Estimating recruits per spawner with catch card data may be misleading, but the increasing trend in harvest and the outcome of assessments for the remainder of the SMU served as sufficient evidence for a pass of the criterion. Harvest-based abundance indices may be biased by variable fishery effort although effort is often positively correlated with abundance. As a result, harvest-based indices would tend to be inflated in large return years and deflated in low return years. Juvenile production in Tenmile Creek (just south of the Yachats) lends support to the pass of both the abundance and productivity criteria. Since 1992, juvenile production in Tenmile Creek has increased nearly every year through 2003 from 587 juveniles to 35,176. There was a major decrease in production in 2004 with only 2,932 juveniles emigrating, but this is still substantially greater than the 1992-1995 estimates.
Siuslaw The Siuslaw population passed the reproductive independence criterion because no hatchery fall Chinook are released in this basin, and observations of finmarked and non-finmarked carcasses on the spawning ground the last two years indicate stray rates are very low. In the last two years, only 28 marked carcasses have been observed during fall Chinook surveys out of a total of 4,446 carcasses. At an adult trap near Mapleton, only eight out of 2,850 fish have been adipose finclipped since 2001. Further, the Siuslaw was identified by the Pacific Salmon Treaty as an index basin because it was presumed to be free of hatchery influences.
North/Upper/Lower Umpqua Abundance data were only available for the Lower Umpqua population for 1999-2003 from surveys in Mill and Camp creeks. In those years, there has been a marked increase in abundance to high levels (241 fish/mile). We assumed that the increasing trend and positive assessment outcomes for both the North and Upper Umpqua populations were sufficient evidence for a pass designation for both abundance and productivity in the Lower Umpqua.
All of the Umpqua populations passed the reproductive independence criterion. The Umpqua basin was identified in the Pacific Salmon Treaty as an index basin because it was presumed to be free of hatchery fish influences. Less than 1% of fall Chinook observed in surveys in Mill and Camp creeks spawning surveys have been of hatchery origin. In addition, less than 2% of the fall Chinook captured at Smith River Falls have been hatchery fish.
Sampling at weirs in the Umpqua has also shown very low hatchery ratios. Less than 1% of fish captured at traps at Tidewater and Happy Valley have had fin clips. The hatchery release mark rate of these recovered fish is unknown, but even if it is very low (5-10%), hatchery fractions would still be under 10%.
Coos The Coos population failed the reproductive independence criterion. Significant releases of hatchery fish have been made into the Coos. Roughly two million fingerlings and 100,000 smolts have been released annually over the last 10 years. The low mark rates of hatchery fish made it impossible to accurately estimate the percentage of hatchery fall chinook in natural
Oregon Native Fish Status Report – Volume II
Coastal Fall Chinook 83
spawning areas from recovered fin-clipped carcasses. Due to the high number of hatchery fish released and insufficient data to accurately assess reproductive independence, a precautionary approach was taken and the population failed the criterion.
Coquille The Coquille population passed the reproductive independence criterion based on adult trapping at Arago, and observations of finmarked fish during spawning surveys in 2003. In those years, only 10 of 2,395 fish at Arago (2001-2003) and six of 1,106 on the spawning grounds have been marked. Since 1993, 30-80% of juvenile fall Chinook released in the Coquille have been adipose fin-clipped (PSMFC online data 2004). With those mark rates, it is unlikely that hatchery fractions in the Coquille would exceed 10% based upon observed marked to unmarked rates. In addition, the Coquille was identified in the Pacific Salmon Treaty as an index basin because it was presumed to be free of hatchery fish influences despite consistent annual hatchery smolt releases of 100,000. The numbers presented in Table 28 represent expanded estimates from the Arago trap.
Floras The Floras population passed the reproductive independence criterion because limited releases have been made there. A small number of unfed fry from the Elk River Hatchery have been released into the Floras over the last decade. This assessment may be in error if significant numbers of Elk River fish are straying into the Floras. Hatchery releases are not made in the Sixes, but significant numbers of fish (likely Elk River releases) stray into the Sixes which is just south of the Floras.
Sixes Straying of Elk River fall Chinook (Rogue SMU) into the Sixes population has been a consistent occurrence over the years and we felt it reasonable to assume that the Sixes would fail the reproductive independence criterion. In the early 1990s, it was estimated that stray rates in the Sixes may be near 20% (Kaczynski and Palmisano, 1993 as cited in NMFS 1998). Spawning ground surveys in the Sixes in 2002-2003 showed that 24% and 9% of carasses were finmarked. Juvenile marking rates in the Elk River were 60-65% in years that would have produced the 2003 returns (PSMFC online data 2004). Expanded mark rates gave a hatchery fraction of 38% and 15% in 2002 and 2003 respectively. Estimates of productivity included both naturally-produced and hatchery-produced fish as recruits because hatchery-to-naturally produced ratios were uncertain prior to 2002.
Assessment Conclusions
This SMU includes 18 populations between the Necanicum and Sixes basins. Spawner returns to these basins have been strong in recent years, and hatchery influence is generally low. The SMU met all six criteria so the near-term sustainability of the population is not at risk.

Oregon Native Fish Status Report – Volume II
Coastal Fall Chinook 84
0 20 40 60 80 100
Percent of Existing Populations Meeting CriteriaExist
DistributionAbundance
ProductivityRepr. Ind.
Hybridization
Figure 10. Assessment outcome for the six interim criteria with reference to the 80% threshold identified by the NFCP.

Oregon Native Fish Status Report – Volume II
Coastal Fall Chinook 85
Necanicum – Coastal Fall Chinook The Necanicum population passed all of the interim criteria. Abundance was indexed by peak counts of fall Chinook during standard coho surveys since 1989. Hatchery releases of about 25,000 smolts are made annually, but the release levels are small in comparison to basin size. All of the historically accessible habitat remains accessible today with the exception of habitat losses in streams not reflected at the 1:100,000 scale.
0
5
10
15
20
25
1989 1991 1993 1995 1997 1999 2001 2003Spawning Year
Abu
ndan
ce (P
eak
coun
t/mile
)
Assessment Outcome Existence Distribution Abundance Productivity Independence Hybridization
Pass Pass Pass Pass Pass Pass
Oregon Native Fish Status Report – Volume II
Coastal Fall Chinook 86
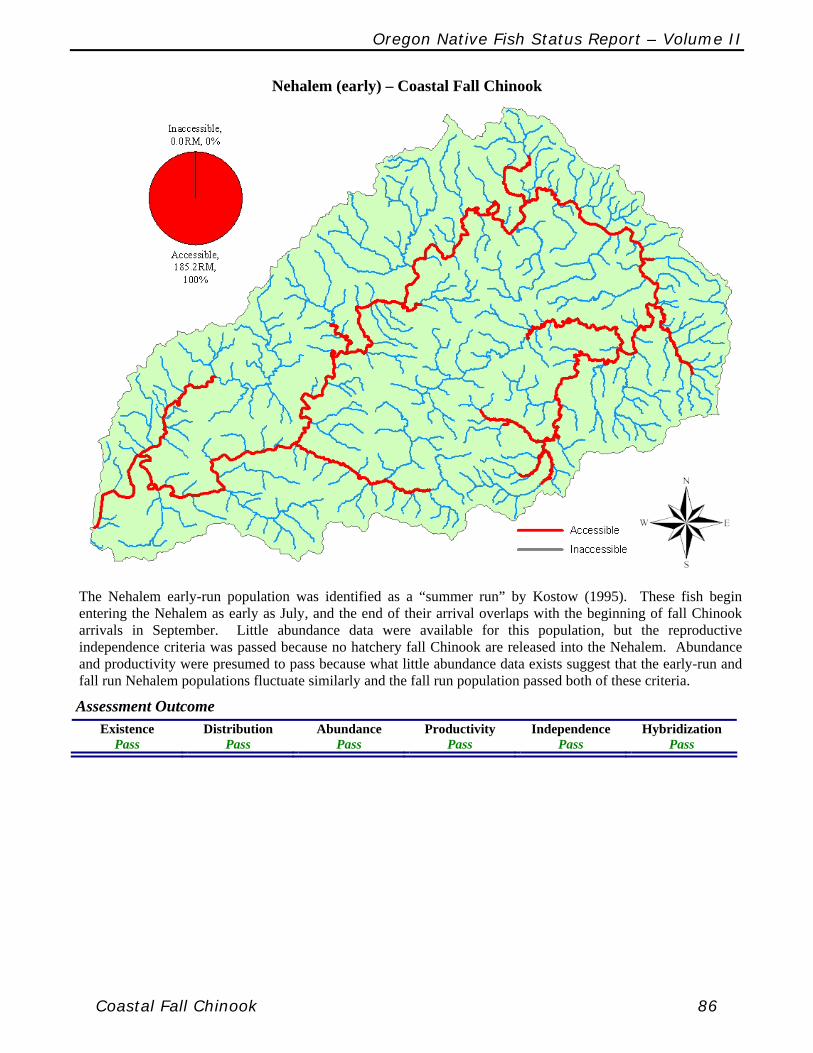
Nehalem (early) – Coastal Fall Chinook
The Nehalem early-run population was identified as a “summer run” by Kostow (1995). These fish begin entering the Nehalem as early as July, and the end of their arrival overlaps with the beginning of fall Chinook arrivals in September. Little abundance data were available for this population, but the reproductive independence criteria was passed because no hatchery fall Chinook are released into the Nehalem. Abundance and productivity were presumed to pass because what little abundance data exists suggest that the early-run and fall run Nehalem populations fluctuate similarly and the fall run population passed both of these criteria.
Assessment Outcome
Existence Distribution Abundance Productivity Independence Hybridization Pass Pass Pass Pass Pass Pass

Oregon Native Fish Status Report – Volume II
Coastal Fall Chinook 87
Nehalem – Coastal Fall Chinook
The Nehalem population passed each of the interim criteria. Abundance has been monitored via standard index spawner surveys since 1952. Returns have been steadily increasing since monitoring efforts began. Productivity has varied cyclically with periods of high productivity followed by low periods. No releases of fall Chinook are made into the Nehalem. Recoveries of finmarked carcasses during spawning surveys in 2003 suggest very few hatchery fish stray into the basin.
020406080
100120140160180
1952 1962 1972 1982 1992 2002Spawning Year
Abu
ndan
ce (P
eak
coun
t/mile
)
0.0
2.0
4.0
6.0
1952 1957 1962 1967 1972 1977 1982 1987 1992 1997Brood Year
Rec
ruits
/Spa
wne
r
Assessment Outcome Existence Distribution Abundance Productivity Independence Hybridization Pass Pass Pass Pass Pass Pass

Oregon Native Fish Status Report – Volume II
Coastal Fall Chinook 88
Tillamook – Coastal Fall Chinook
02040
6080
100120
140160180
1950 1960 1970 1980 1990 2000Spawning Year
Abu
ndan
ce (P
eak
coun
t/mile
)
0.0
2.0
4.0
6.0
8.0
10.0
12.0
14.0
1950 1956 1962 1968 1974 1980 1986 1992 1998Brood Year
Rec
ruits
/Spa
wne
r
The Tillamook population passed each of the criteria. Abundance has been monitored via standard surveys since 1950. Returns have varied widely with recent numbers being near average for the entire time period. Productivity has generally been less than the criterion of 1.2 over the last 10 broods. Limited juvenile data, when compared to a juvenile sampling study from the 1980s, indicates that the Tillamook populations are consistently fully seeded, and in years below full seeding levels, productivity is high. While significant hatchery releases have been made in the basin, the available evidence suggests that stray rates are less than 10%.
Assessment Outcome Existence Distribution Abundance Productivity Independence Hybridization
Pass Pass Pass Pass Pass Pass

Oregon Native Fish Status Report – Volume II
Coastal Fall Chinook 89
Nestucca – Coastal Fall Chinook
0
100
200
300
400
500
600
1947 1957 1967 1977 1987 1997Spawning Year
Abu
ndan
ce (P
eak
coun
t/mile
)
0123456789
1949 1959 1969 1979 1989 1999Brood Year
Rec
ruits
/Spa
wne
r
The Nestucca passed each of the interim criteria. Abundance has been monitored since 1947, and while it has fluctuated widely, has shown no consistent increasing or decreasing trend. In 2000, Cedar Creek Hatchery began releasing 40,000 – 100,000 smolts annually. Spawning surveys in 2004 which should include returns from those releases indicate that hatchery ratios are less than 10%.
Assessment Outcome Existence Distribution Abundance Productivity Independence Hybridization
Pass Pass Pass Pass Pass Pass

Oregon Native Fish Status Report – Volume II
Coastal Fall Chinook 90
Salmon – Coastal Fall Chinook
0
1
2
3
4
5
1987 1992 1997 2002Spawning Year
Wild
Abu
ndan
ce (t
hous
ands
)
The Salmon population passed each of the criteria with the exception of reproductive independence. Abundance mark-recapture estimates have been used to estimate the total spawning population since 1986. Those estimates were adjusted by hatchery-to-naturally produced fractions of fish observed on the spawning ground. Hatchery fractions have been increasing since monitoring began in 1987. Estimates have typically been greater than 50% since 1994.
0%
10%
20%
30%
40%
50%
60%
70%
1987 1989 1991 1993 1995 1997 1999 2001 2003Spawning Year
Perc
ent H
atch
ery
Spaw
ner
0.0
0.2
0.4
0.6
0.8
1.0
1.2
1.4
1.6
1987 1989 1991 1993 1995 1997Brood Year
Rec
ruits
/Spa
wne
r
Assessment Outcome Existence Distribution Abundance Productivity Independence Hybridization
Pass Pass Pass Pass Fail Pass

Oregon Native Fish Status Report – Volume II
Coastal Fall Chinook 91
Siletz – Coastal Fall Chinook
The Siletz population passed each of the criteria. Abundance has been monitored via standard spawner surveys since 1952, and has gradually increased since surveys began. Hatchery fall chinook are not released into the Siletz, so it was unlikely hatchery fractions on the spawning ground exceeded 10%. Juvenile monitoring data and stock recruitment analysis suggest that the population is highly productive despite the fact that only two of the last five years of below average abundance had R/S levels of 1.2 or greater. It is believed that the 30-year average abundance was not a good indicator of full seeding.
0
20
40
60
80
100
120
140
160
1952 1962 1972 1982 1992 2002Spawning Year
Abu
ndan
ce (P
eak
coun
t/mile
)
0.0
1.0
2.0
3.0
4.0
5.0
6.0
1952 1957 1962 1967 1972 1977 1982 1987 1992 1997Brood Year
Rec
ruits
/Spa
wne
r
Assessment Outcome
Existence Distribution Abundance Productivity Independence Hybridization Pass Pass Pass Pass Pass Pass
Oregon Native Fish Status Report – Volume II
Coastal Fall Chinook 92
Yaquina – Coastal Fall Chinook
0
20
40
60
80
100
120
140
1952 1962 1972 1982 1992 2002Spawning Year
Abu
ndan
ce (P
eak
coun
t/mile
)
0
2
4
6
8
10
12
14
1952 1957 1962 1967 1972 1977 1982 1987 1992 1997Brood Year
Rec
ruits
/Spa
wne
r
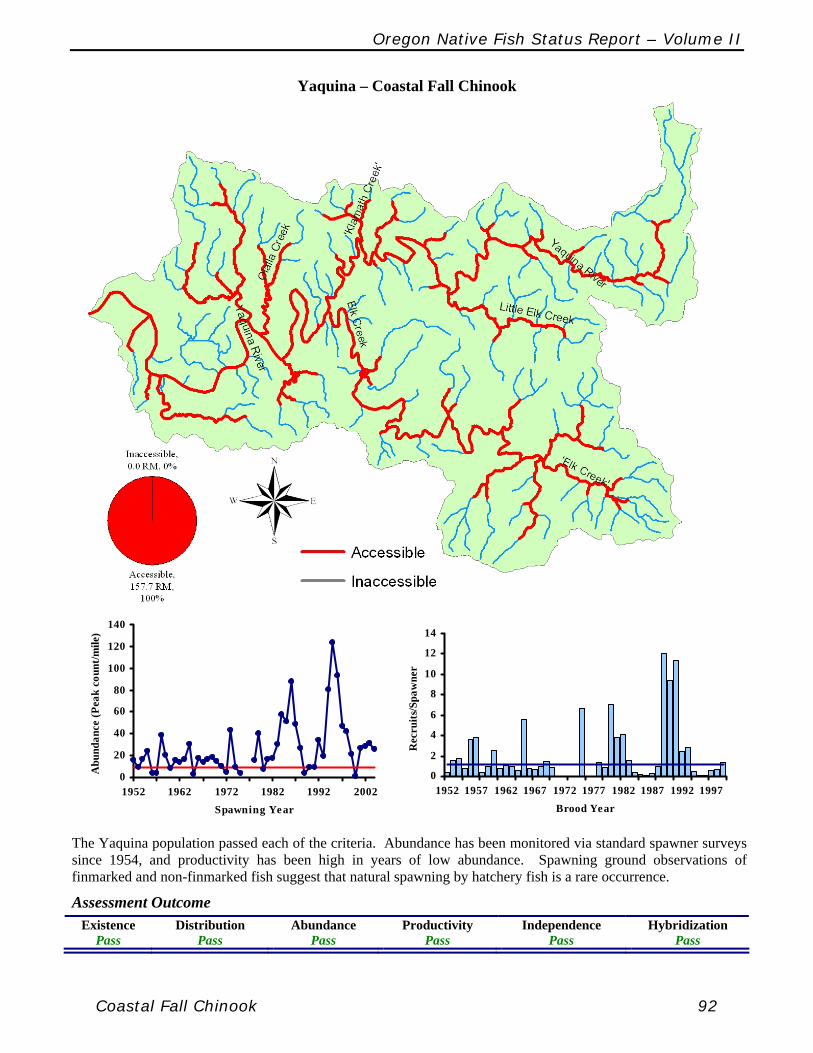
The Yaquina population passed each of the criteria. Abundance has been monitored via standard spawner surveys since 1954, and productivity has been high in years of low abundance. Spawning ground observations of finmarked and non-finmarked fish suggest that natural spawning by hatchery fish is a rare occurrence.
Assessment Outcome
Existence Distribution Abundance Productivity Independence Hybridization Pass Pass Pass Pass Pass Pass

Oregon Native Fish Status Report – Volume II
Coastal Fall Chinook 93
Alsea – Coastal Fall Chinook
The Alsea population passed each of the criteria. Abundance is monitored via standard index spawner surveys, and has been steadily increasing since the late 1970s. Productivity has consistently been above the criterion of 1.2. Hatchery fall Chinook have not been released in the Alsea since 1996.
0
50
100
150
200
250
1952 1962 1972 1982 1992 2002
Spawning Year
Abu
ndan
ce (P
eak
coun
t/mile
)
0
1
2
3
4
5
6
1950 1960 1970 1980 1990
Brood Year
Rec
ruits
/Spa
wne
r
Assessment Outcome Existence Distribution Abundance Productivity Independence Hybridization
Pass Pass Pass Pass Pass Pass
Oregon Native Fish Status Report – Volume II
Coastal Fall Chinook 94
Yachats – Coastal Fall Chinook
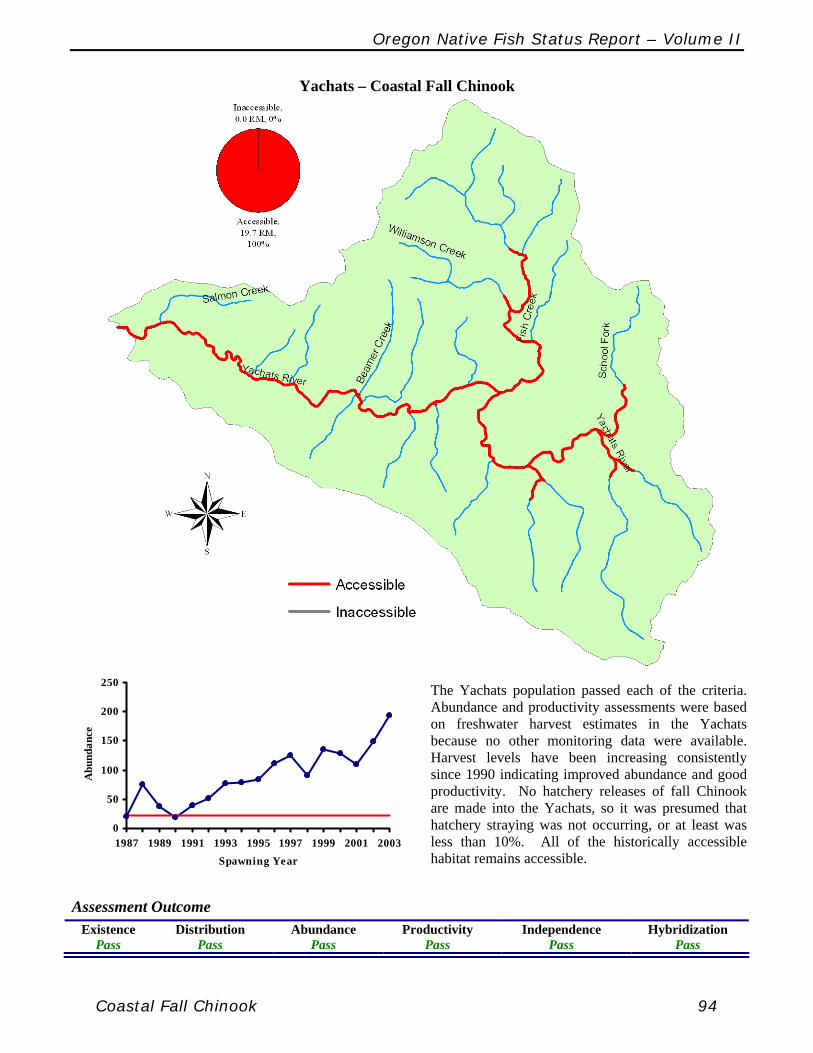
The Yachats population passed each of the criteria. Abundance and productivity assessments were based on freshwater harvest estimates in the Yachats because no other monitoring data were available. Harvest levels have been increasing consistently since 1990 indicating improved abundance and good productivity. No hatchery releases of fall Chinook are made into the Yachats, so it was presumed that hatchery straying was not occurring, or at least was less than 10%. All of the historically accessible habitat remains accessible.
Assessment Outcome Existence Distribution Abundance Productivity Independence Hybridization
Pass Pass Pass Pass Pass Pass
0
50
100
150
200
250
1987 1989 1991 1993 1995 1997 1999 2001 2003Spawning Year
Abu
ndan
ce

Oregon Native Fish Status Report – Volume II
Coastal Fall Chinook 95
Siuslaw – Coastal Fall Chinook
The Siuslaw population passed each of the criteria. Abundance has been monitored via standard spawner surveys since 1953, and has been steadily increasing since the early 1970s. No hatchery releases of fall Chinook are made into the Siuslaw, so it was presumed that hatchery straying was not occurring, or at least was less than 10%. Spawning ground observations and data from an adult trap suggest hatchery fractions since 2001 have been very low (<2%).
0
100
200
300
400
500
600
700
1953 1963 1973 1983 1993 2003Spawning Year
Abu
ndan
ce (P
eak
coun
t/mile
)
0.0
2.0
4.0
6.0
8.0
10.0
12.0
14.0
1953 1958 1963 1968 1973 1978 1983 1988 1993 1998Brood Year
Rec
ruits
/Spa
wne
r
Assessment Outcome Existence Distribution Abundance Productivity Independence Hybridization
Pass Pass Pass Pass Pass Pass
Oregon Native Fish Status Report – Volume II
Coastal Fall Chinook 96
North Umpqua – Coastal Fall Chinook
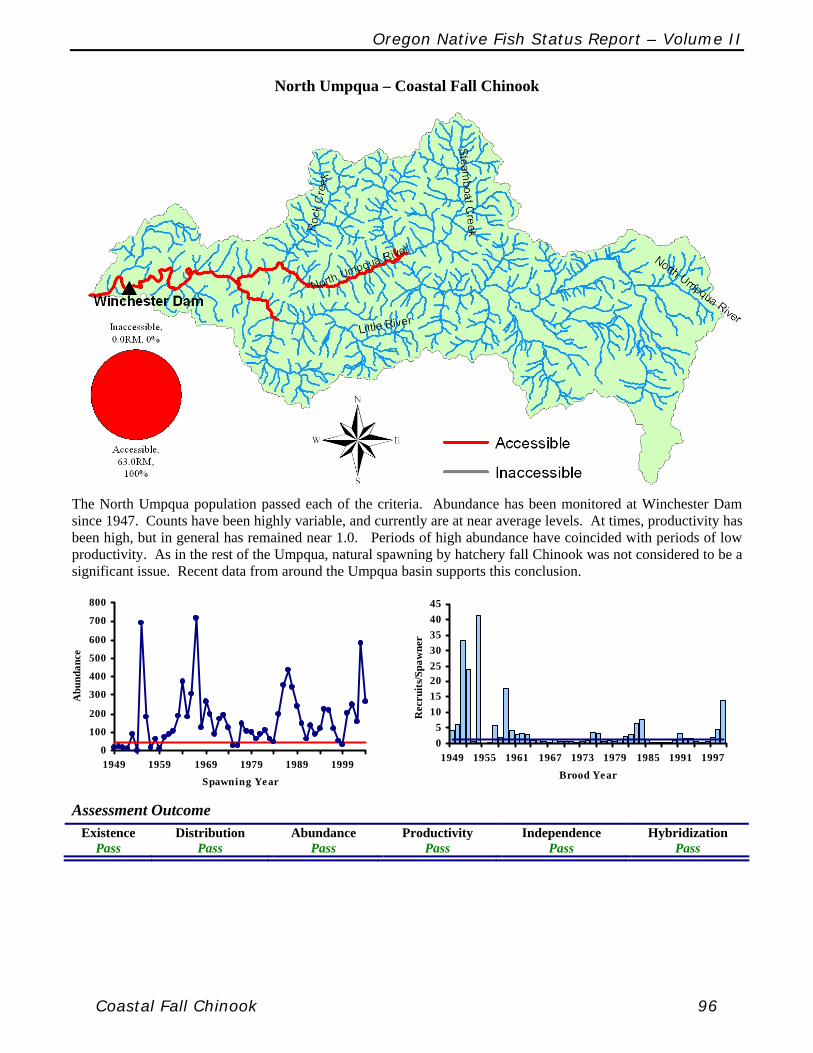
The North Umpqua population passed each of the criteria. Abundance has been monitored at Winchester Dam since 1947. Counts have been highly variable, and currently are at near average levels. At times, productivity has been high, but in general has remained near 1.0. Periods of high abundance have coincided with periods of low productivity. As in the rest of the Umpqua, natural spawning by hatchery fall Chinook was not considered to be a significant issue. Recent data from around the Umpqua basin supports this conclusion.
0
100
200
300
400
500
600
700
800
1949 1959 1969 1979 1989 1999Spawning Year
Abu
ndan
ce
05
1015202530354045
1949 1955 1961 1967 1973 1979 1985 1991 1997Brood Year
Rec
ruits
/Spa
wne
r
Assessment Outcome Existence Distribution Abundance Productivity Independence Hybridization
Pass Pass Pass Pass Pass Pass
Oregon Native Fish Status Report – Volume II
Coastal Fall Chinook 97
Upper Umpqua – Coastal Fall Chinook
0
2
4
6
8
10
12
1980 1985 1990 1995 2000Spawning Year
Abu
ndan
ce (t
hous
ands
)
0.0
0.5
1.0
1.5
2.0
2.5
3.0
3.5
1980 1982 1984 1986 1988 1990 1992 1994 1996 1998Brood Year
Rec
ruits
/Spa
wne
r
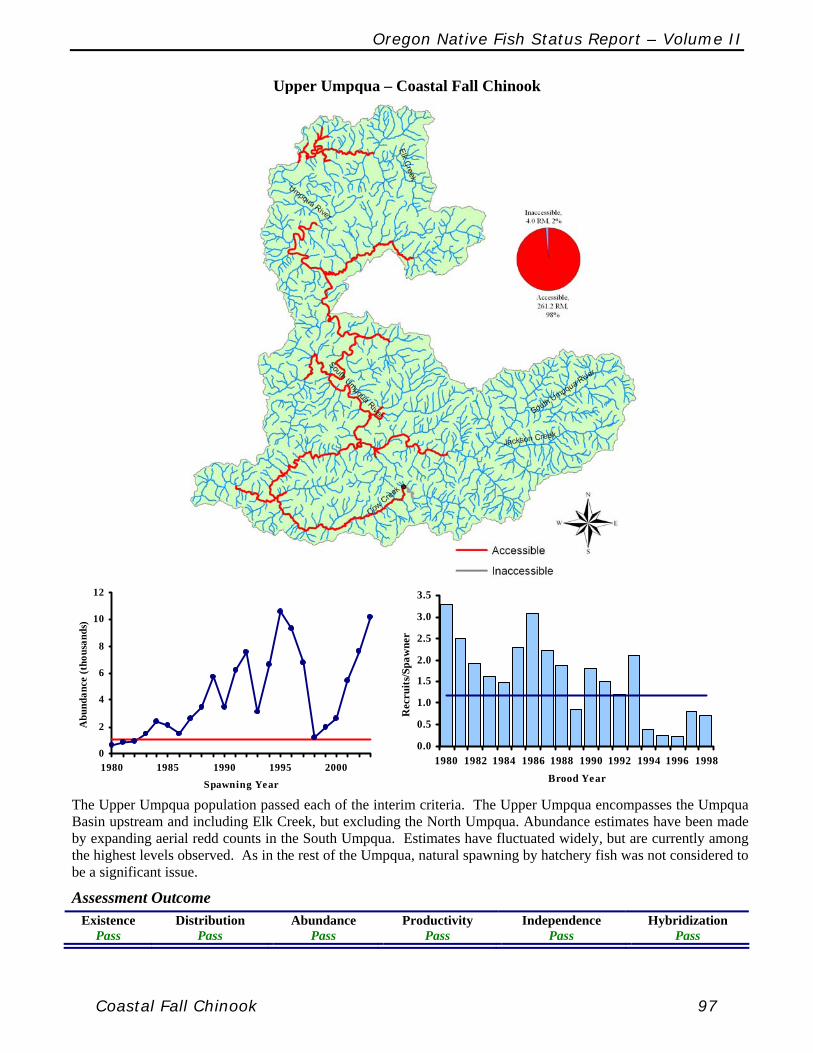
The Upper Umpqua population passed each of the interim criteria. The Upper Umpqua encompasses the Umpqua Basin upstream and including Elk Creek, but excluding the North Umpqua. Abundance estimates have been made by expanding aerial redd counts in the South Umpqua. Estimates have fluctuated widely, but are currently among the highest levels observed. As in the rest of the Umpqua, natural spawning by hatchery fish was not considered to be a significant issue.
Assessment Outcome
Existence Distribution Abundance Productivity Independence Hybridization Pass Pass Pass Pass Pass Pass

Oregon Native Fish Status Report – Volume II
Coastal Fall Chinook 98
Lower Umpqua – Coastal Fall Chinook
The Lower Umpqua population passed each of the criteria for which it could be assessed. No assessment could be made for productivity because abundance data for the Lower Umpqua do not exist. Abundance was presumed to have passed because all populations within the SMU with abundance data passed. Productivity was passed because the North and Upper Umpqua populations passed the criterion. It is expected that these three populations would react similarly to environmental conditions. The Umpqua basin as a whole was considered to have minimal spawning by hatchery fish, so it was presumed that the population passed the independence criterion. The population maintains access to nearly all of its historically accessible habitat.
Assessment Outcome Existence Distribution Abundance Productivity Independence Hybridization
Pass Pass Pass Pass Pass Pass
Oregon Native Fish Status Report – Volume II
Coastal Fall Chinook 99
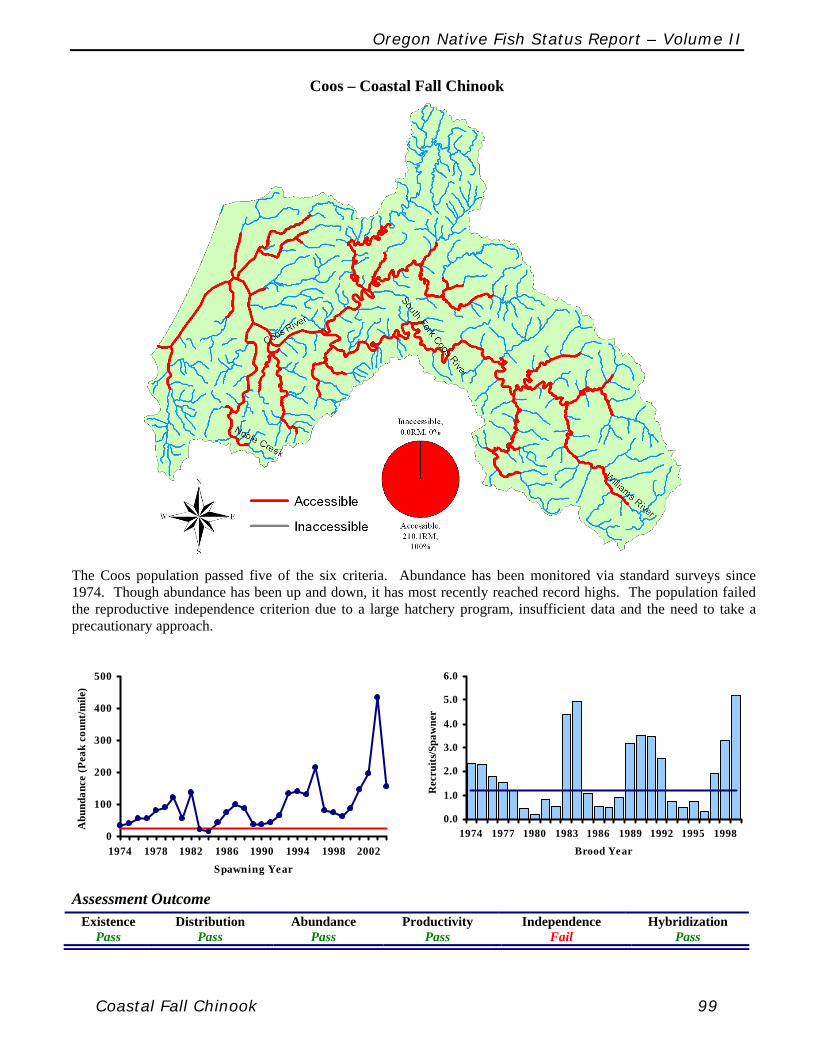
Coos – Coastal Fall Chinook
The Coos population passed five of the six criteria. Abundance has been monitored via standard surveys since 1974. Though abundance has been up and down, it has most recently reached record highs. The population failed the reproductive independence criterion due to a large hatchery program, insufficient data and the need to take a precautionary approach.
0
100
200
300
400
500
1974 1978 1982 1986 1990 1994 1998 2002Spawning Year
Abu
ndan
ce (P
eak
coun
t/mile
)
0.0
1.0
2.0
3.0
4.0
5.0
6.0
1974 1977 1980 1983 1986 1989 1992 1995 1998Brood Year
Rec
ruits
/Spa
wne
r
Assessment Outcome
Existence Distribution Abundance Productivity Independence Hybridization Pass Pass Pass Pass Fail Pass

Oregon Native Fish Status Report – Volume II
Coastal Fall Chinook 100
Coquille – Coastal Fall Chinook
020406080
100120140160180200
1958 1968 1978 1988 1998Spawning Year
Abu
ndan
ce (P
eak
coun
t/mile
)
0
2
4
6
8
10
1958 1963 1968 1973 1978 1983 1988 1993 1998Brood Year
Rec
ruits
/Spa
wne
r
The Coquille population passed each of the criteria. Abundance has been monitored via standard surveys since 1958, and abundance has been consistently increasing. Adult trapping information and spawning ground observations from 2003 support the conclusion that few hatchery fish are spawning naturally. Productivity has been above 1.2 in many years since 1958, and was consistently greater than the replacement rate of 1.0.
Assessment Outcome Existence Distribution Abundance Productivity Independence Hybridization
Pass Pass Pass Pass Pass Pass

Oregon Native Fish Status Report – Volume II
Coastal Fall Chinook 101
Floras – Coastal Fall Chinook
020406080
100120140160180200
1986 1988 1990 1992 1994 1996 1998 2000 2002 2004Spawning Year
Abu
ndan
ce (P
eak
coun
t/mile
)
0.0
2.0
4.0
6.0
8.0
10.0
12.0
1986 1988 1990 1992 1994 1996 1998Brood Year
Rec
ruits
/Spa
wne
r
The Floras population passed each of the criteria. Abundance in the Floras has been monitored via standard spawning surveys since 1986 and has shown an increasing trend. Small releases of hatchery fish are made into the basin, but straying of adults onto natural spawning grounds was thought to be low. In 2003, all 47 carcasses recovered on the spawning ground were unmarked.
Assessment Outcome
Existence Distribution Abundance Productivity Independence Hybridization Pass Pass Pass Pass Pass Pass

Oregon Native Fish Status Report – Volume II
Coastal Fall Chinook 102
Sixes – Coastal Fall Chinook
The Sixes population passed each of the criterion with the exception of reproductive independence. Straying of Elk River fall Chinook into the Sixes has been a persistent issue. Those strays were probably greater than 10% of the spawning population in most years. Data from 2002 and 2003 support this conclusion. Abundance in the Sixes has been monitored by standard surveys since the 1960s. Since annual estimates of hatchery-to-naturally produced fractions were not available, both the abundance and productivity graph estimates include hatchery fish. Abundance has likely been over-represented, and productivity may not be representative of the natural population.
02040
6080
100120
140160180
1967 1972 1977 1982 1987 1992 1997 2002Spawning Year
Abu
ndan
ce (P
eak
coun
t/mile
)
0.00.51.01.52.02.53.03.54.04.55.0
1967 1971 1975 1979 1983 1987 1991 1995 1999Brood Year
Rec
ruits
/Spa
wne
r
Assessment Outcome
Existence Distribution Abundance Productivity Independence Hybridization Pass Pass Pass Pass Fail Pass


![Law and Critique VoLII no.2 [1991] CRITICAL CRIMINOLOGYtheinternationale.com/papers/Critical_criminology... · 192 Law and Critique VoLII no.2 [1991] wider discourses and discursive](https://static.fdocuments.net/doc/165x107/5f9e136d29a2a84e13287511/law-and-critique-volii-no2-1991-critical-criminol-192-law-and-critique-volii.jpg)


![Law and Critique VoLII no.2 [1991] CRITICAL …...192 Law and Critique VoLII no.2 [1991] wider discourses and discursive practices of 'governmentality'. This represents a challenge](https://static.fdocuments.net/doc/165x107/5ea5d013425cd23e8f12f7db/law-and-critique-volii-no2-1991-critical-192-law-and-critique-volii-no2.jpg)


