Vol. 30, No 2, 2006 18 The Devaluation of Social Studies...
13
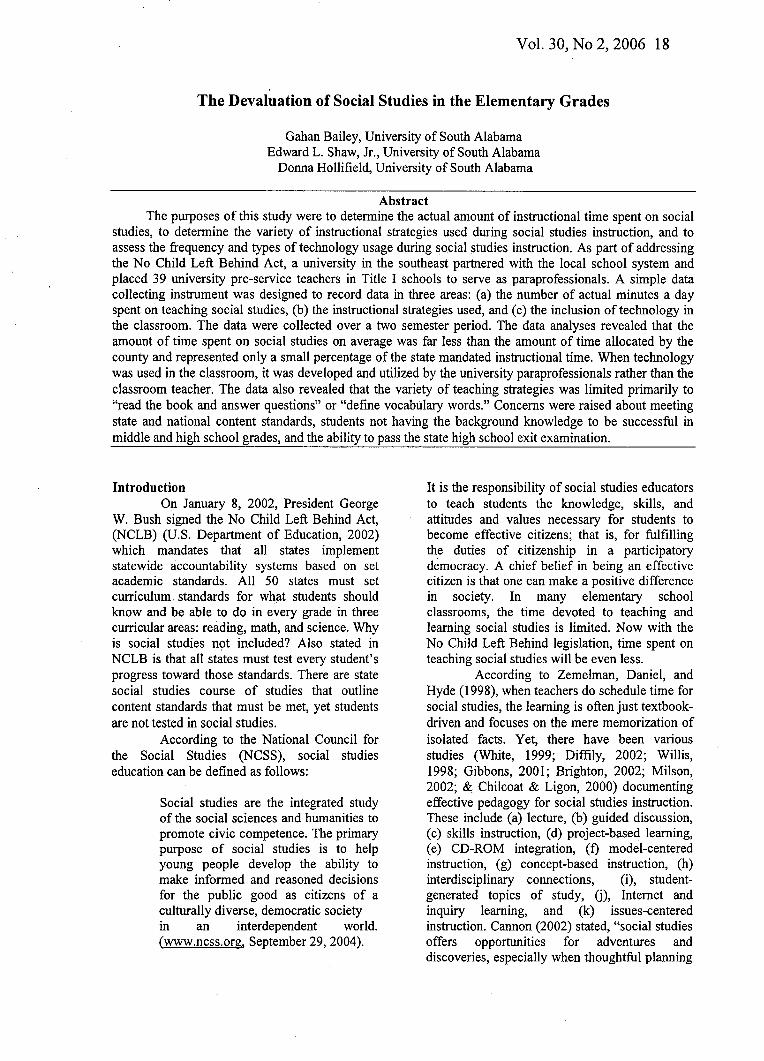
Vol. 30, No 2, 2006 18 The Devaluation of Social Studies in the Elementary Grades Gahan Bailey, University of South Alabama Edward L. Shaw, Jr., University of South Alabama Donna Hollifield, University of South Alabama Abstract The purposes of this study were to determine the actual amount of instructional time spent on social studies, to determine the variety of instructional strategies used during social studies instruction, and to assess the frequency and types of technology usage during social studies instruction. As part of addressing the No Child Left Behind Act, a university in the southeast partnered with the local school system and placed 39 university pre-service teachers in Title I schools to serve as paraprofessionals. A simple data collecting instrument was designed to record data in three areas: (a) the number of actual minutes a day spent on teaching social studies, (b) the instructional strategies used, and (c) the inclusion of technology in the classroom. The data were collected over a two semester period. The data analyses revealed that the amount of time spent on social studies on average was far less than the amount of time allocated by the county and represented only a small percentage of the state mandated instructional time. When technology was used in the classroom, it was developed and utilized by the university paraprofessionals rather than the classroom teacher. The data also revealed that the variety of teaching strategies was limited primarily to "read the book and answer questions" or "define vocabulary words." Concems were raised about meeting state and national content standards, students not having the background knowledge to be successful in middle and high school grades, and the ability to pass the state high school exit examination. Introduction On January 8, 2002, President George W. Bush signed the No Child Left Behind Act, (NCLB) (U.S. Department of Education, 2002) which mandates that all states implement statewide accountability systems based on set academic standards. All 50 states must set curriculum, standards for what students should know and be able to do in every grade in three curricular areas: reading, math, and science. Why is social studies not included? Also stated in NCLB is that all states must test every student's progress toward those standards. There are state social studies course of studies that outline content standards that must be met, yet students are not tested in social studies. According to the National Council for the Social Studies (NCSS), social studies education can be defined as follows: Social studies are the integrated study of the social sciences and humanities to promote civic competence. The primary purpose of social studies is to help young people develop the ability to make informed and reasoned decisions for the public good as citizens of a culturally diverse, democratic society in an interdependent world. (www.ncss.org. September 29, 2004). It is the responsibility of social studies educators to teach students the knowledge, skills, and attitudes and values necessary for students to become effective citizens; that is, for fulfilling the duties of citizenship in a participatory democracy. A chief belief in being an effective citizen is that one can make a positive difference in society. In many elementary school classrooms, the time devoted to teaching and leaming social studies is limited. Now with the No Child Left Behind legislation, time spent on teaching social studies will be even less. According to Zemelman, Daniel, and Hyde (1998), when teachers do schedule time for social studies, the leaming is often just textbook- driven and focuses on the mere memorization of isolated facts. Yet, there have been various studies (White, 1999; Diffily, 2002; Willis, 1998; Gibbons, 2001; Brighton, 2002; Milson, 2002; & Chilcoat & Ligon, 2000) documenting effective pedagogy for social studies instruction. These include (a) lecture, (b) guided discussion, (c) skills instmction, (d) project-based leaming, (e) CD-ROM integration, (f) model-centered instmction, (g) concept-based instmction, (h) interdisciplinary connections, (i), student- generated topics of study, (j), Intemet and inquiry learning, and (k) issues-centered instruction. Cannon (2002) stated, "social studies offers opportunities for adventures and discoveries, especially when thoughtful plaiming
Transcript of Vol. 30, No 2, 2006 18 The Devaluation of Social Studies...
Vol. 30, No 2, 2006 18
The Devaluation of Social Studies in the Elementary Grades
Gahan Bailey, University of South AlabamaEdward L. Shaw, Jr., University of South Alabama
Donna Hollifield, University of South Alabama
AbstractThe purposes of this study were to determine the actual amount of instructional time spent on social
studies, to determine the variety of instructional strategies used during social studies instruction, and toassess the frequency and types of technology usage during social studies instruction. As part of addressingthe No Child Left Behind Act, a university in the southeast partnered with the local school system andplaced 39 university pre-service teachers in Title I schools to serve as paraprofessionals. A simple datacollecting instrument was designed to record data in three areas: (a) the number of actual minutes a dayspent on teaching social studies, (b) the instructional strategies used, and (c) the inclusion of technology inthe classroom. The data were collected over a two semester period. The data analyses revealed that theamount of time spent on social studies on average was far less than the amount of time allocated by thecounty and represented only a small percentage of the state mandated instructional time. When technologywas used in the classroom, it was developed and utilized by the university paraprofessionals rather than theclassroom teacher. The data also revealed that the variety of teaching strategies was limited primarily to"read the book and answer questions" or "define vocabulary words." Concems were raised about meetingstate and national content standards, students not having the background knowledge to be successful inmiddle and high school grades, and the ability to pass the state high school exit examination.
IntroductionOn January 8, 2002, President George
W. Bush signed the No Child Left Behind Act,(NCLB) (U.S. Department of Education, 2002)which mandates that all states implementstatewide accountability systems based on setacademic standards. All 50 states must setcurriculum, standards for what students shouldknow and be able to do in every grade in threecurricular areas: reading, math, and science. Whyis social studies not included? Also stated inNCLB is that all states must test every student'sprogress toward those standards. There are statesocial studies course of studies that outlinecontent standards that must be met, yet studentsare not tested in social studies.
According to the National Council forthe Social Studies (NCSS), social studieseducation can be defined as follows:
Social studies are the integrated studyof the social sciences and humanities topromote civic competence. The primarypurpose of social studies is to helpyoung people develop the ability tomake informed and reasoned decisionsfor the public good as citizens of aculturally diverse, democratic societyin an interdependent world.(www.ncss.org. September 29, 2004).
It is the responsibility of social studies educatorsto teach students the knowledge, skills, andattitudes and values necessary for students tobecome effective citizens; that is, for fulfillingthe duties of citizenship in a participatorydemocracy. A chief belief in being an effectivecitizen is that one can make a positive differencein society. In many elementary schoolclassrooms, the time devoted to teaching andleaming social studies is limited. Now with theNo Child Left Behind legislation, time spent onteaching social studies will be even less.
According to Zemelman, Daniel, andHyde (1998), when teachers do schedule time forsocial studies, the leaming is often just textbook-driven and focuses on the mere memorization ofisolated facts. Yet, there have been variousstudies (White, 1999; Diffily, 2002; Willis,1998; Gibbons, 2001; Brighton, 2002; Milson,2002; & Chilcoat & Ligon, 2000) documentingeffective pedagogy for social studies instruction.These include (a) lecture, (b) guided discussion,(c) skills instmction, (d) project-based leaming,(e) CD-ROM integration, (f) model-centeredinstmction, (g) concept-based instmction, (h)interdisciplinary connections, (i), student-generated topics of study, (j), Intemet andinquiry learning, and (k) issues-centeredinstruction. Cannon (2002) stated, "social studiesoffers opportunities for adventures anddiscoveries, especially when thoughtful plaiming

Vol. 30, No 2, 2006 19
has been done" (^ 1), and Kaplan (2002) addedthat "inherent in the social studies context is theopportunity to develop complex concepts andgeneralizations, critical thinking, and researchmethodology (^ 1).
The devaluation' of social studies,according to Kaplan (2002) is due in part thatstandardized tests predominantly assess languagearts and math; thus, social studies is perceived asa less-important area of study. Another reasonthat elementary teachers are not addressing thesocial studies curriculum may be that they lackknowledge of the social sciences subject matter.Thomton (2001) wrote the following:
Many elementary teachers have alimited acquaintance with the socialsciences in college, perhaps a fewcourses. Moreover, different elementaryteachers will have studied differentaspects of the social sciences. In otherwords, there appears to be scant socialscience subject matter knowledge thatAmerican elementary teachers hold incommon, and what they have studied isunlikely to have been in depth. (^ 5)
He stated that secondary teachers hold a major inthe social science they are responsible forteaching, but elementary teachers assumeresponsibility for subjects across the entirecurriculum.
Results from a study conducted for theBayer Corporation (Market Research Institute,Inc., 2004) showed that in pre-service educationprograms 86% of teachers indicated they spentmore time in their general teaching methodscourses on English and math, than they did inscience and social studies. The same reportidentified the key finding that "...elementaryschoolteachers report they are three times morelikely to teach English (95%) and math (93%)every day than they are to teach science (35%)and social studies (33%)" (p. 4). A primarytrend for teaching social studies in the 21"Century is "Integrated Curriculum" (Parker,2005, p. 23). Social studies can easily serve as anintegrating core for much of the teaching andleaming that takes place in the elementaryclassroom. A web sitenittp://suzvred.com/inte gratedcurriculum.htm].2004) on integrated curriculum reported, "whensubjects are taught individually there really isn'tenough time to fit everything in, but then, thereal world doesn't divide our day into math.
reading, science, and social studies" (IntegratedCurriculum, | 2). Continuing that thought, theweb site listed, "isolating subjects in thecurriculum robs the brain of what it does best -integrate and make connections that apply tosolving problems" (^ 3). In the article "Teachers'Refiections on Their Practice of Social Studies"(Christensen, L. M., Wilson, E. K., Anders, S.K., Dennis, M. B., Kirkland, L., Beacham, M., &Warren, E. P., 2001), two elementary teacherscame to view social studies as integral to thewhole curriculum. It was noted that integratingthe curricular content areas "could bring abalance to the curriculum and prevent it beingtoo heavily weighted toward literacy and math"(p. 206). The teachers posited that social studiesis seen as an "extra" because the emphasis is onliteracy and math. Referring to the politicallandscape and power bases of teaching socialstudies, they reported "feeling confiicted, stified,and silenced because of the school system'sadministration, state mandates, standardizedtests, and pressure from fellow teachers" (p.208).
The NCLB Act does not list socialstudies as one of the curricular areas for whichelementary teachers will be held accountable;thus, our nations' youth are not being educatedon what it means to be an effective citizen. The1916 Report of the Committee on the SocialStudies (U.S. Bureau of Education, 1916)asserted, "The social studies should cultivate asense of membership in the 'world community,'with all the sympathies and sense of justice thatthis involves among the different divisions ofhuman society" (p. 9). Regarding "CitizenshipEducation and Democratic Values," Parker(2005) wrote:
Democracy requires that we educatechildren to the ideals of democracy, andthose ideals require citizens of greatcharacter and civility. They require theability to reason in principled ways, forexample, to possess a deep appreciationfor democratic values such as liberty,the common good, justice, and equality;to think critically and to resolvedisputes in nonviolent ways; to insist onother people's rights (not only on one'sown); to cooperate with persons withwhom one may not want to cooperate;and to tolerate religious and politicalviews different from one's own. (p. 69)

Vol. 30, No 2, 2006 20
The 21" Century has arrived. How canwe morally, ethically, and intellectually defendnot teaching the United States of America'sfuture adult citizens the knowledge, skills, andattitudes and values which are intrinsic to socialstudies education? There is no defense forneglecting children's education in how to livetogether fairly and freely, and how to improvethe world by making a positive difference.Within this background of concem for the lackof time being spent on social studies instruction,this study examined (a) the actual amount ofinstmctional time spent on social studies, (b) thevariety of instructional strategies used, and (c)the frequency and types of technology used.
MethodologySubjects
Participants in this study consisted of 17elementary education pre-service teachersenrolled in a spring semester social studiesmethods block and 22 elementary education pre-service teachers in a fall semester social studiesmethods block at a university in the southeast.As part of addressing the No Child Left Behindlegislation, the university partnered with thelocal school system and placed the 39 pre-serviceteachers in Title I schools to serve asparaprofessionals. The participants collected datafor 13 weeks during the spring semester and 14weeks during the fall semester. The studentswere placed in grades kindergarten tlirough fifthand served in the schools Monday throughFriday from 8:00 a.m. to 2:00 p.m. and attendedtheir university methods courses on Mondaythrough Thursday from 3:00 p.m. to 5:00 p.m.
InstrumentationA weekly record log for social studies
(Appendix A) was used to collect the dataindicating (a) the amount of time allocated forsocial studies, (b) the instmctional strategiesused, and (c) the inclusion of technology in theclassroom. The pre-service teachers received theweekly record logs at the beginning of eachsemester and tumed them in weekly to the socialstudies professor. (See Appendix A at the end ofthis text)
Data Analysis and ResultsThe data for the amount of time
allocated for social studies were analyzed bycalculating a mean for the daily and weekly timespent teaching social studies. The data wereanalyzed to report the amount of time each of the
39 teachers spent teaching the subject as well asa calculation of time spent for each grade level.Additionally, the data were analyzed todetermine the number of week's social studieswas not taught.
The calculated amount of time spentteaching social studies during the spring and fallsemesters is represented in Appendices B and C(See Appendix B and C at the end of this text).During the spring semester, the results show thatthe one kindergarten teacher spent an average of33.26 minutes per day teaching social studiesand missed one week of social studiesinstruction. The fall semester data show that thefour kindergarten teachers spent an average of77.76 minutes per day teaching social studies.The daily averages spanned from a high of 27.54minutes per day to a low of 11.29 minutes perday. Also revealed were the number of weeks inwhich social studies was not taught. One teacherdid not teach social studies for two weeks,another did not address social studies for fourweeks, one never missed a week of teachingsocial studies, and one missed five weeks ofsocial studies instmction.
Pre-service teachers in the two firstgrade classrooms during the spring reported acombined daily mean of 28.55 minutes teachingsocial studies; the high daily time was 18.86minutes and the low daily time was 9.69minutes. One of the teachers did not teach socialstudies for six weeks and the other did notengage in social studies instmction for twoconsecutive weeks. Pre-service teachers in thesix first grade classrooms during the fall reporteda combined daily mean of 102.14 minutesteaching social studies. The daily averagesspanned from a high of 42.86 minutes per day toa low of 5.86 minutes per day. One teachermissed teaching social studies for one week,another for two weeks, and one teacher did notengage in social studies instmction for 11 of the14 weeks. Another first grade teacher missedeight weeks of social studies instruction, anotherskipped four consecutive weeks, and the lastteacher excluded social studies for 9 of the 14weeks.
Four second grade paraprofessionalsduring the spring semester recorded a total dailymean of 48.77 minutes of social studiesinstruction. The span ranged from a high of16.62 minutes to a low of 7.54 minutes of dailyinstmction. One teacher skipped three weeks ofinstruction, two of the teachers missed fourweeks, and one teacher did not teach social

Vol. 30, No 2, 2006 21
studies for six weeks. Two pre-service teacherswere placed as paraprofessionals in two secondgrade classrooms during the fall semester andrecorded a combined daily mean of 19.86minutes of social studies instmction; the lowdaily time was 6.21 minutes and the high was13.64 minutes. One teacher missed one week ofsocial studies instruction and the other did notteach social studies the first nine weeks of the 14week period.
During the spring semester, two thirdgrade teachers showed a combined daily mean of28.35 minutes of social studies instmction with alow mean of 5.58 minutes and a high of 22.77.One of the teachers missed two consecutiveweeks teaching social studies and the otherteacher skipped three weeks. The three thirdgrade teachers in the fall semester showed acombined daily mean of 102.57 minutes of socialstudies instmction with a high of 78.14 minutes,to a low of 8.50 minutes. One teacher nevermissed a week teaching social studies during the14 weeks, one teacher did not teach socialstudies for three weeks, and the last teachermissed six weeks of social studies instruction.
The data for the three fourth gradeclassrooms during the spring semester revealed atotal daily mean of 47.69 minutes of socialstudies instmction with a low of 13.23 minutesof instmction and a high of 20.86 minutes. Oneteacher missed three weeks of instmction,another skipped one week, and the last teacherdid not teach social studies for seven weeks. Thetwo fourth grade teachers in the fall semestershowed a combined daily mean of 49.36 minuteson social studies instmction; the highest meanwas 27.93 and the lowest mean was 21.93minutes per day. One teacher did not miss anyweeks of social studies instmction and the otherteacher skipped two weeks of instruction.
The combined daily mean for the fivefifth grade teachers during the spring semesterwas 74.06 minutes of social studies instructionwith a high of 20.38 minutes to a low of 5.95minutes per day. Two of the teachers did notaddress social studies for 3 of the 13 weeks, onemissed five weeks and two of the teachers didnot engage in social studies instruction for twoweeks. The combined daily mean for the fivefifth grade teachers during the fall semester was74.07 minutes of social studies instmction with ahigh of 22.86 minutes to a low of 9.00 minutesper day. One teacher did not address socialstudies for 5 of the 14 weeks, another skippedthree weeks, and one teacher taught social
studies every week. Another fifth grade teachermissed one week of instruction and the lastteacher excluded social studies for seven weeks.
The data revealed that over the 13 weekspring semester the fifth grade teachers spent thegreatest amount of time on social studiesinstruction. The next highest group was thesecond grade teachers; followed by the fourthgrade teachers; the kindergarten teacher; then thefirst grade teachers; and lastly, the third gradeteachers. Regarding the number of weeks inwhich social studies was not taught, thekindergarten teachers missed the least amount ofweeks on instruction and the second gradeteachers missed the most number of weeks.During the 14 week fall semester, the third gradeteachers spent the greatest amount of time onsocial studies instruction. The next highest groupwas the first grade teachers; followed by thekindergarten teachers; the fifth grade teachers;then the fourth grade teachers; and lastly, thesecond grade teachers. Concerning the number ofweeks in which social studies was not taught, the4* grade teachers missed the least amount ofweeks on instruction and the first grade teachersmissed the most number of weeks.
The data in Tables 1 and 2 (AppendixD) represents the various instmctional strategiesthe teachers implemented while teaching socialstudies during the spring and fall semesters. (SeeAppendix D at the end of this text.) The tablesreport the total number of instructional strategiesfor each grade level for the combined 13 and 14weeks. The three instmctional strategies mostoften used during both semesters in socialstudies were (a) Whole GroupDiscussion/Activity, (b) Define VocabularyWords, and (c) Read Book & Answer Questions.The two instmctional strategies used the leastduring each semester were (a) Inquiry and (b)Hands-on Activity from Book.
The data in Tables 3 and 4 (AppendixE) represents the inclusion of technology duringsocial studies instmction for each semester.( See Appendix E dt the end of this text). Thenumber of times each grade level usedtechnology and what form of technology wasused during social studies instmction is reported.During the spring semester, results showedPowerPoint was used 29 times, followed by theIntemet being used 11 times. EducationalSoftware 9 times, and Inspiration 1 titne. Thedata analysis showed that the fifth gradesteachers implemented technology the most,followed by the third grade teachers, the second

Vol. 30, No 2, 2006 22
grade teachers, then the first grade teachers,fourth grade teachers, and the kindergartenteacher using technology the least number oftimes. During the spring semester, technologywas implemented a total of 17 times duringsocial studies instmction. PowerPoint was used 7times, followed by Educational Software beingused 6 times, the Intemet used 4 times, andInspiration was not used at all. The third gradeteacher was accountable for utilizing technology14 of the 17 times. The second grade teacheraccounted for 2 times and the kindergartenteacher 1 time. Technology was not incorporatedin any lessons in grades 1,4, and 5.
DiscussionThis study focused on social studies
insfruction over a two semester period in gradesK - 5 self-contained classrooms. A crucialquestion that arises from this study is: How wellwill the elementary schools students be preparedfor social studies when they enter middle school?Beginning with their middle school years,students will be in classes that devote 50 - 60minutes to each subject. It is very likely that themiddle school teachers will have to spend moretime on remediation and time teaching inquirybased leaming than they would have if thestudents had been exposed to the content andleaming strategies in the elementary grades. Theresults of this study indicate that theseelementary students will not be prepared in theknowledge, skills, and attitudes and valueswithin social studies. Additionally, they will nothave the ability to engage in inquiry leaming andthe critical thinking processes necessary forhigher order thinking and solving real worldproblems. Whereas the pre-service teachers havebeen exposed to various teaching strategies andemerging technology in the methods courses,their exposure to them in the real classroomsetting has been limited.
According to the Alabama State Code(1975), the Scholastic Day "shall not be less thansix hours of actual teaching, exclusive of allrecesses or intermission periods..." (p. 743).While the state mandates 360 minutes ofinstmction per day, the local school district inthis study mandates 30 minutes a day for socialstudies instmction. The only grade levels thatmet this requirement were the kindergartenteacher during the spring semester and one firstgrade teacher and one third grade teacher duringtiie fall semester. The great disparity in theamount of instmctional time among the social
studies teachers is a grave concem. There is noequity between the grade levels, teachers, oramount of instructional time.
The number of weeks in which socialstudies was not taught is another frightfuldiscovery; there is no consistency. Conversationswith the paraprofessionals in this study revealedthat teachers would teach social studies when, orif, they got around to it. This is supported by theresearch literature that the instructional emphasisis on literacy and math; social studies is viewedas a second class citizen. Perhaps even less timewill now be spent on social studies due to themath, reading, and science accountabilityoutlined in No Child Left Behind.
In the social studies methods course, thepre-service teachers are exposed to numerousand varied instructional strategies for teachingthe social studies content. An emphasis is placedon the Inquiry Teaching Strategy, a commonform of study for social studies; however,inquiry as an instmctional method did not rank inthe top three strategies used to teach socialstudies. During the spring semester it was theleast used method and it was the second to leastused method during the fall semester. Two formsof leaming that ranked in the top three. ReadBook & Answer Questions and DefineVocabulary Words are two modes of leamingthat many elementary school students find lessthan interesting. There is no excitement,challenge, or real world application; thus, there isan immense lack of enthusiasm for leamingsocial studies among young leamers.
Integrating social studies was anotherfocus in the methods course; however, there wasno evidence that interdisciplinary teaching wastaking place. Many teachers claim they do nothave enough time to teach social studies, yet theyreject the idea and research on the effectivenessof integrated instmction. Social studies is anatural fit for interdisciplinary learning in that itemphasizes solving problems in the real world;and after all, the real world day is not separatedby blocks of reading, math, science, and socialstudies.
The results from this study ontechnology inclusion are quite alarming. Toachieve and maintain accreditation in teachereducation, university faculty must includetechnology objectives, activities, andassessments in their courses. In the social studiesmethods course, students were required to utilizethe Intemet, create PowerPoint presentations,and research emerging technologies. The data

Vol. 30, No 2, 2006 23
reveal that teachers are not utilizing technologyin their classrooms; and, during conversationswith the paraprofessionals in this study, it wasleamed that when technology was beingimplemented, it was by the university studentsand not the classroom teacher. However, it wasobserved by the paraprofessionals that theclassroom teachers were enthusiastic about theintegration of technology.
RecommendationsThis study was limited to social studies
instruction, but future studies should also includedata collection for reading, math, and science toprovide a picture of the full day in an elementaryclassroom. The pre-service teachers in this studywere competent in utilizing technology,however, the classroom teachers did notdemonstrate competency in technology. It isrecommended that university faculty partner withthe schools to provide professional developmentin areas of technology. Additionally, methodscourse faculty and pre-service teachers shouldwork with classroom teachers in designing andimplementing integrated instruction. Socialstudies is a natural fit, hence this could serve asthe starting point and establish social studiesbeing taught every day, not just when the teacherhas time to get around to it.
It is recommended that elementarystudents be tested in social studies and that theteachers should be held accountable for theirstudents' social studies success. The No ChildLeft Behind Act is a federal mandate, however,the 10* Amendment makes education a functionof the state. Therefore, the state and local schooldistricts need to recognize the importance ofsocial studies and hold teachers accountable forteaching social studies for at least the required 30minutes per day.
According to the Bayer Report (MarketResearch Institute, Inc., 2004), most teacherswish social studies (60%) had received moreemphasis during their pre-service training. Thislacic of rigorous training, erratic time forteaching and technology, and inconsistentteaching strategies will have a negative impacton the way students view social studies. Theresults will have long-term effects that are notmeasured by paper and pencil tests.
References
Alabama State Code (Code 1940, T. 52, §lActsl984,No. 84-323, P. 743,§l.).http://www.legislature.state.al.us/CodeofAlabama/1975/16-1-1.htm
Brighton, C. M. (2002). Straddling the fence:Implementing best practices in anage of accountability [Electronic version].Gifted Child Today Magazine. 25(3), 30-34.
Cannon, M. W. (2002). Concepts and themes: Aleaming odyssey [Electronicversion]. Gifted Child today Magazine.25(3), 24-30.
Chilcoat, G. W., & Ligon, J. A. (2000). Issues-centered instmction in the elementarysocial studies classroom [Electronicversion]. Theory and Research in SocialEducation. 28(2), 220-272.
Christensen, L. M., Wilson, E. K., Anders, S. K.,Dennis, M. B., Kirkland, L., Beacham,M.,&Warren, E.P. (2001,September/October). Teachers'reflections on their practice of socialstudies. The Social Studies, 205-208.
Diffily, D. (2002). Project-based leaming:Meeting social studies standards andthe needs of gifted leamers [Electronicversion]. Gifted Child Today Magazine.25(3), 40-45.
Gibbons, A. S. (2001). Model-centeredinstruction [Electronic version]. Journalof Structural Learning and IntelligentSystems. 14(4), 511-540. IntegratedCurriculum. (October 2, 2004).Education for the real world.http://suzvred.com/integratecurriculum.html

Kaplan, S. N. (2002). Awakening andelaborating [Electronic version]. GiftedChild Today Magazine. 25(2), 18-34.Market Research Institute, Inc. (2004,May). The Bayer facts of scienceeducation X: Are the nation's collegesand universities adequately preparingelementary schoolteachers of tomorrowto teach science (Executive Summary).Mission, KS: Author.
Milson, A. J. (2002). The Intemet and inquiryleaming: Integrating medium andmethod in a sixth grade social studiesclassroom [Electronic version]. Theoryand Research in Social Education.30(3), 330-353.
National Council for the Social Studies.(September 24, 2004). www.ncss.orgParker, W. C. (2005). Social studies in.elementary education (12* Ed.). UpperSaddlcxe River, NJ: Prentice Hall.
Thomton, S. J. (2001). Educating the educators:Rethinking subject matter and methods[Electronic version]. Theory IntoPractice, 40(1), 72-79.
U.S. Bureau of Education. (1916) Report of thecommittee on social studies.Washington, DC: Govemment PrintingOffice.
Vol. 30, No 2,2006 24
United States Department of Education (2002).Meeting the highly qualified teachers
challenge: The Secretary's annualreport to Congress. Washington, D.C:Office of Postsecondary Education,Office of Policy Planning andInnovation.
White, R. (1999). A primer on pedagogy: Basicmethodology for the beginning socialstudies teacher [Electronic version].Southern Social Studies Journal. 25(1),2-11.
Willis, A. (1998). Effective practice: The viewfrom across the nation [Electronicversion]. Social Studies Review. 38(1),18-20.
Zemelman, S., Daniel, H., & Hyde, A. (1998).Best practice: New standards forteaching and learning in America'sschools (2"'' ed.). Portsmouth, NH:Heinemann.

Vol. 30, No 2, 2006 25
Appendix A
Name:
Social Studies Teaching Log
Grade Level:
Teacher's Name: Is she/he Board Certified: Yes No
Highest Degree Cooperating Teacher Eamed: B.S. M.Ed. Ed.S. Ph.D.
Class: Females Males
Racial Composition: African American Asian Caucasian
Time Allocated• Minutes
Instructional Strategies
• Read the Book & Answer Questions
• Define Vocabulary Words
• Hands-on Activity from Book
• Hands-on Activity not from Book
• Inquiry Lesson
• Whole Group Discussion/Activity
• Cooperative Leaming Group Activity
• Individualized ActivityTechnology Use• Intemet Use• Power Point• Inspiration• Educational Software
Monday Tuesday Wednesday Thursday Friday
This is due each week.
Comments:

Vol. 30, No 2, 2006 26
Appendix B
Spring Social Studies Instructional Time
Week
12345678910111213SumWeekAvg.DailyAvg.
KTotal2201232532510032526002401254512560
2162166.31
33.26
1stNo. 190105125020301250000013563048.46
9.69
1stNo. 21405011718040200155410511512000
122694.31
18.86
1stTotal230155242ISO60230280410511512001351856142.77
28.55
2ndNo. 115012015060120901500012009030108083.08
16.62
2ndNo. 211550603085100600600013560546.54
9.31
2ndNo. 330901801952401850000007599576.54
15.31
2ndNo. 47545856520020010560001549037.69
7.54
2ndTotal370305475350465285170601052400902553170243.85
48.77
3rd No.119011519512024016517075601054500
1480113.85
22.77
3rdNo. 2135105040157040040800036327.92
5.58
3rdTota!2031202051702801802401156014512500
1843141.77
28.35
Appendix B Continued
Spring Social Studies Instructional Time
Week
12345678910111213SumWeekAvg.DailyAvg.
4thNo. 1- 160., 12013090601209030030003086066.15
13.23
4thNo. 23569812324123939040453060088468.00
13.60
4th No.32030027800264270000002241356104.31
20.86
4thTotal
215426506213301407453120407530602543100238.46
47.69
5thNo. 1904559354905545450038729.77
5.95
5th No.2140105150120120105120456000090105581.15
16.23
5th No.3018093267 .225090090045450
103579.62
15.92
5th No.4758520022030145903706025045101277.85
15.57
5th No.585220180120601501209012012000601325101.92
20.38
5thTotal390635628820440449420177275225115451954814370.31
74.06

Vol, 30, No 2, 2006 27
Appendix C
Fall Social Studies Instructional Time
Week
1234567891011121314SumWeekAvg.DailyAvg.
KNo. 18085105125125150355180300150403000
1725123.21
24.64
KNo. 2502001050500 .0115309024024060100071.43
14.29
KNo. 3461126013012515012020035013580195150751928137.71
27.54
KNo. 445707510014010010080000008079056.43
11.29
KTotal2212872404603904505754607653152104653902155443388.79
77.76
1stNo. 1150175
. 30016518513080110185190130017065
2035145.36
29.07
1stNo. 2013010070500150307065401302572551.79
10.36
1st -No. 30180000115145000000044031.43
6.29
1stNo. 4857010500000000151053041029.29
5.86
1stNo. 530037537537537537515037500001501503000214.29
42.86
1stNo. 600000000150609021030054038.57
7.71
IstTotal5359308806106106203904853653202852655852707150510.71
102.14
Appendix C Continued
Fall Social Studies Instructional Time
Week
1234567891011121314SumWeekAvg.DailyAvg.
2ndNo. 1150755060120125206095300201054595568.21
13.64
2ndNo. 2000000000100601251005043531.07
6.21
2nd Total
1507550601201252060951306014520595139099.29
19.86
3rd No. 1
2803403403008103104202704806303303603602405470390.71
78.14
3rd No. 2
70200125200135953550500060950
111579.64
15.93
3rd No. 3
040100105120750000045803059542.50
8.50
3rd Total
35058056560510654804553205306303304655352707180512.86
102.57

Vol. 30, No 2, 2006 28
Appendix C Continued
Fall Social Studies Instructional Time
Week
123456789
1011121314
SumWeekAvg.DailyAvg.
4*No, 1
8512011021013012060115145115150407560
1535109,64
21,93
4thNo, 2
155280210235200145601601151901106000
1920137,14
27,43
4thTotal
2404003204453302651202752603052601007560
3455246.79
49.36
5thNo. 1100125701009060303000
25000
63045,00
9,00
5thNo, 2
0100200250
010050100100200200100200
01600
114,29
22,86
5thNo, 3
701201151106590153095
21030754545
111579,64
15,93
5thNo, 4
105958030100105150601701053003025
108577,50
15,50
5thNo, 5
3512024015060120300000000
75553,93
10,79
5th Total
31056070564031547527522036551528517527570
5185370.36
74.07
Appendix D
Table 1 Spring Social Studies Instructional Strategies
Instructional Strategies
Read Book & Answer Questions
Defme Vocabulary WordsHands-on Activity from BookHands-on Activity not from BookInquiry LessonWhole Group Discussion/ActivityCooperative Leaming Group ActivityIndividualized Activity
K30
23184416124
11
44
6844364
225
224
296353
24
32
385180
2441
419
101
622918
535
22112819421631
Total112
150AA
88391825082
Table 2 Fall Social Studies Instructional Strategies
Instructional StrategiesRead Book & Answer QuestionsDefine Vocabulary WordsHands-on Activity from BookHands-on Activity not from BookInquiry LessonWhole Group Discussion/ActivityCooperative Leaming Group ActivityIndividualized Activity
K800709045
132134
268
75118
215709236810
33660102820332325
42818083-191
12
544171
230
341423
Total16311515
10133
2896183

Appendix E
Table 3 Spring Social Studies Technology Use
Vol. 30, No 2, 2006 29
Technology useInternetPower PointInspirationEducational SoftwareTotal
K11002
114005
224118
3560011
404004
521008
20
Total11291950
Table 4 Fall Social Studies Technology Use
Technology useInternetPower PointInspirationEducational SoftwareTotal
K01001
100000
210012
3360514
400000
500000
Total470617