
Vol 1 - Department of Veterans' Affairs and... · Web view... (1985). The report of the Royal...
325
Australian participants in British nuclear tests in Australia Vol 1: Dosimetry May 2006
Transcript of Vol 1 - Department of Veterans' Affairs and... · Web view... (1985). The report of the Royal...

Australian participants in British nuclear tests in Australia
Vol 1: Dosimetry
May 2006
Michael Carter, Francis (Rob) Robotham, Keith Wise, Geoffrey Williams and Philip Crouch

© Commonwealth of Australia 2006
ISBN 1 920720 38 3
This work is copyright. Apart from any use as permitted under the Copyright Act 1968, no part may be reproduced by any process without prior written permission from the Commonwealth. Requests and inquiries concerning reproduction and rights should be addressed to the Commonwealth Copyright Administration, Attorney General’s Department, Robert Garran Offices, National Circuit, Barton ACT 2600 or posted at http://www.ag.gov.au/cca
Published by the Department of Veterans’ Affairs, Canberra, 2006.
Production by Biotext Pty Ltd, Canberra
2 June 2006
Mr Bruce Billson MPMinister for Veterans’ AffairsParliament HouseCANBERRA ACT 2600
Dear MinisterI have pleasure in submitting the final reports of the Australian Participants in British Nuclear Tests in Australia, Dosimetry and Mortality and Cancer Incidence Study, which have been prepared on behalf of the Repatriation Commission by the Department of Public Health at the University of Adelaide and members of the Dosimetry Subcommittee. I would personally like to thank all the researchers for their hard work on this study.On 16 July 1999, the former Minister for Veterans’ Affairs, the Hon Bruce Scott MP, announced that a cancer and mortality study of Australian nuclear test participants in British tests in Australia would be conducted. The aim of the study was to examine whether there is an increased rate of death and cancer among male nuclear test participants compared to the general Australian community.The study has taken a significant time to complete. This was due to the need to develop a nominal roll of Australian participants in the tests, which was required as the starting point for the study, and the complexity of reconstructing radiation dosage estimates received by participants at the test sites. The Scientific Advisory Committee had the role of reviewing and advising on the methodology of the study, and supervised the report’s preparation. The membership of the Committee is set out at Appendix 3 of the Dosimetry Report. In addition, an Exposure Panel was established to reconstruct ionising radiation dose estimates for participants of the tests, and its membership is outlined at Appendix 4 of the Dosimetry Report.I would like to take this opportunity to thank the members of the Consultative Forum for their contribution during the conduct of the study. Due to the length of time over which the study was conducted, a number of changes in membership took place. A full list of members, and the organisations they represented, can be found at Appendix 2 of the Dosimetry Report.Finally, I would like to thank all the departmental staff who worked on this study.Yours sincerely
Simon HarringtonCOMMISSIONER

Rear Admiral C S H Harrington AM RAN (Retd)Repatriation CommissionerPO Box 21Woden ACT 2606
Dear Rear Admiral HarringtonI am writing to you as Chair of and representing the Scientific Advisory Committee to the studies of dosimetry and mortality and cancer incidence in Australian participants in the British nuclear tests in Australia. I am pleased to report that the members of the Committee, with one exception, consider that the studies have been conducted and analysed to a high level of scientific quality and that the final reports of them entitled Australian Participants in British Nuclear Tests in Australia, Dosimetry and Mortality and Cancer Incidence Study, prepared for the Repatriation Commission by the Department of Public Health at the University of Adelaide and members of the Dosimetry Subcommittee, accurately represent and soundly interpret the studies’ findings.Towards the end of the Committee’s consideration of the reports, there was contention over the content and wording of some parts of them; particularly the section entitled Main Findings. Most of the Committee members present at the time considered the matters under contention to be matters of presentation not of science. However, the contention was not resolved and Ms Ann Munslow-Davies, the Consultative Forum representative on the Committee, felt, in consequence, that she could not endorse the reports. Yours sincerely
Bruce Armstrong
cc Mr Barry TelfordChairConsultative ForumAustralian Participants in British Nuclear Tests in Australia StudyPO Box 21WODEN ACT 2606

Main f indings
The study to investigate the health effects of participation in the British nuclear tests in Australia is reported in two volumes. Volume 1, the radiation dosimetry study, used data from the tests and modelling to estimate the radiation exposure of participants in the tests. Volume 2 includes: the mortality study, which compared the number of deaths in test participants with that of the general population from the time of the nuclear tests to the end of 2001; and the cancer study, which compared the number of cases of cancer, whether fatal or not, in test participants, with that in the general population from 1982 to the end of 2001, and compared radiation exposure of participants with and without leukaemia.
The overall death rate in test participants was similar to that of the general population. There were 4233 deaths observed in participants, compared with 4150 expected from the general population.
The most common cause of death in test participants was cancer, and death from cancer was 18% greater in test participants than would be expected in the general population. Deaths from causes other than cancer were generally fewer than expected in test participants compared with the general population, with the number of deaths from heart disease, cerebrovascular disease (mostly strokes), and external causes (suicide, accidents, poisonings, etc) fewer than expected. The number of deaths from respiratory diseases in test participants was about the same as expected from the general population.
The cancer incidence study showed an overall increase in the number of cancers in test participants, similar to that found in the mortality study. The number of cancer cases found among participants was 2456, which was 23% higher than expected. A significant increase in both the number of deaths and the number of cases was found for (figures in brackets show increase in mortality and incidence):
all cancers (18% and 23%)
cancers of the lip, oral cavity and pharynx (50% and 41%)
lung cancer (20% and 28%)
colorectal cancer (24% and 16%)
prostate cancer (26% and 22%).
The number of cancer cases (but not the number of deaths) was also significantly greater in test participants for the following cancers (figures in brackets show increase in incidence):
oesophageal cancer (48%)
melanoma (40%)
all leukaemias (43%)
all leukaemias except chronic lymphatic leukaemia (61%).
v

Other findings included:
of the 26 mesothelioma cases in test participants, 16 occurred in RAN personnel, which was nearly three times the number expected
in RAAF personnel, there was nearly double the expected number of deaths from melanoma, and cases of melanoma were increased by two–thirds.
The increases in cancer rates do not appear to have been caused by exposure to radiation. No relationship could be found between overall cancer incidence or mortality and exposure to radiation. None of the above cancers occurring in excess showed any association with radiation exposure in this study. In particular, there was no link between radiation exposure and leukaemia, excluding chronic lymphatic leukaemia (non-CLL leukaemia), which is commonly found to be increased in groups exposed to radiation. These findings are consistent with the low levels of radiation exposure found in this study. Only 4% of the study population had an estimated radiation exposure greater than 20 millisieverts (mSv) from test participation, and 79% had an estimated exposure of less than 1 mSv. The estimated mean radiation exposure of the study population due to participation in the tests was 2.8 mSv, only slightly greater than the background exposure received by every Australian every year.
In the absence of a correlation with radiation exposure, the excess of non-CLL leukaemia is unexplained. Other than radiation, the best established cause of leukaemia is exposure to benzene, but there is no information available about benzene exposure in test participants.
Mesothelioma is a cancer that is nearly always associated with past exposure to asbestos, and the excess mesothelioma in RAN personnel is most likely due to asbestos in naval vessels. The asbestos exposure need not necessarily have occurred at the time of the nuclear tests.
Lung cancer is strongly related to smoking, and the excess could be due to a higher smoking prevalence in test participants. Oesophageal cancer and cancers of the lip, oral cavity and pharynx are also known to be strongly smoking-related. Together, the excesses of these cancers indicate that there was probably a higher smoking prevalence in participants than in the general population.
However, some contribution to the lung cancer excess is also likely from asbestos in RAN personnel, and possibly in civilian participants also. The occurrence of mesothelioma in RAN and civilian subjects is a definite indication of asbestos exposure, and occurrence of other asbestos-related diseases would therefore not be surprising. The occurrence of lung cancer cases is also highest in RAN and civilian subjects. Many of the civilian subjects in the cohort were in the construction industry, where asbestos was commonly used, at a time when less caution was exercised than in recent years. Whether any of these subjects were exposed to asbestos during the nuclear tests is not known.
Asbestos exposure is also a possible contributing factor to the excess of colorectal cancer. The incidence of this cancer was also highest in RAN and civilian personnel.
vi

Contents
Main findings......................................................................................................... v
Executive summary.............................................................................................xv
1 Introduction.............................................................................................. 1
1.1 Objective....................................................................................1
1.2 Study organisation and administration.......................................11.2.1 Australian Government Department of Veterans’ Affairs. 21.2.2 Consultative Forum...........................................................21.2.3 Scientific Advisory Committee..........................................21.2.4 Dosimetry Subcommittee..................................................21.2.5 Exposure Panel..................................................................2
1.3 Study protocol............................................................................2
1.4 Methodology..............................................................................2
1.5 List of major tests.......................................................................31.5.1 Operation Hurricane..........................................................51.5.2 Operation Totem................................................................61.5.3 Operation Mosaic...............................................................61.5.4 Operation Buffalo..............................................................61.5.5 Operation Antler................................................................6
1.6 List of minor trials......................................................................61.6.1 Kittens................................................................................71.6.2 Tims...................................................................................71.6.3 Rats....................................................................................71.6.4 Vixens (A and B)...............................................................7
1.7 Personnel involvement and tasks...............................................7
1.8 Basis of the report.......................................................................8
1.9 Structure of the report.................................................................8
1.10 Reference....................................................................................9
2 Ionising radiation — sources, effects and controls..............................11
Summary..............................................................................................11
2.1 Ionising radiation......................................................................11
vii

2.2 Types of ionising radiation.......................................................12
2.3 Quantities and units used for radiation.....................................12
2.4 Types of radiation exposure.....................................................132.4.1 External exposure............................................................132.4.2 Internal exposure.............................................................13
2.5 Radiation exposure pathways and their control.......................142.5.1 External exposure............................................................142.5.2 Internal exposure.............................................................15
2.6 Biological effects of radiation exposure...................................152.6.1 Early history....................................................................162.6.2 Current knowledge...........................................................17
2.7 Radiation dose limits................................................................18
2.8 References................................................................................19
3 Radiation hazards associated with nuclear weapons testing...............21
Summary..............................................................................................21
3.1 Introduction..............................................................................21
3.2 Types of nuclear weapons........................................................21
3.3 Exposure pathways...................................................................223.3.1 Pre-test.............................................................................223.3.2 Prompt exposure..............................................................223.3.3 Delayed exposure sources................................................243.3.4 Fallout..............................................................................253.3.5 Delayed exposure pathways.............................................263.3.6 Minor trials......................................................................28
4 Radiation safety regulations and health physics procedures..............29
Summary..............................................................................................29
4.1 Introduction..............................................................................29
4.2 Radiation safety recommendations/regulations........................304.2.1 Operation Hurricane (1952).............................................314.2.2 Operation Totem (1953)..................................................334.2.3 Operation Mosaic (1956).................................................384.2.4 Operation Buffalo (1956).................................................464.2.5 Operation Antler (1957)...................................................514.2.6 Minor trials......................................................................544.2.7 Post-operational activities................................................55
viii
4.3 Conclusions..............................................................................56
4.4 References................................................................................58
5 Historical data reviewed in the study....................................................59
Summary..............................................................................................59
5.1 Sources of historical data.........................................................595.1.1 Documents at ARPANSA................................................595.1.2 Personal collections.........................................................615.1.3 Other Australian sources..................................................615.1.4 Interviews with Australian nuclear test participants and
others with specific information......................................625.1.5 UK sources......................................................................635.1.6 Other international sources..............................................63
5.2 Specific relevant data...............................................................63
5.3 Consequences of a lack of information....................................65
5.4 References................................................................................66
6 Methods for dose reconstruction...........................................................67
Summary..............................................................................................67
6.1 Introduction..............................................................................68
6.2 Source terms.............................................................................69
6.3 Pathways...................................................................................71
6.4 Assessment of external dose rates and doses...........................736.4.1 Prompt radiation..............................................................736.4.2 Ground deposit.................................................................746.4.3 External exposure to airborne radionuclides....................77
6.5 Assessment of internal doses....................................................786.5.1 Inhalation.........................................................................786.5.2 Ingestion..........................................................................806.5.3 Absorption through cuts and skin....................................816.5.4 Relative contributions to the dose....................................81
6.6 Examples of calculations to determine exposure doses...........846.6.1 Exposure to initial flash...................................................846.6.2 General tasks....................................................................856.6.3 Travel in yellow vehicles.................................................896.6.4 Marching through contaminated areas.............................906.6.5 Clean up task at Taranaki.................................................916.6.6 Dose from the fallout plume............................................93
Contents ix
6.7 Reliability of the estimates.......................................................946.7.1 Factors affecting fallout composition..............................946.7.2 External dose...................................................................956.7.3 Inhalation dose.................................................................956.7.4 Ingestion dose..................................................................96
6.8 References................................................................................97
7 Results.................................................................................................... 101
Summary............................................................................................101
7.1 Introduction............................................................................102
7.2 Operation Hurricane...............................................................1037.2.1 Groups potentially exposed...........................................1037.2.2 Operations and major tasks............................................1047.2.3 Dosimetry outcomes......................................................105
7.3 Operation Totem.....................................................................1097.3.1 Groups potentially exposed...........................................1097.3.2 Operations and major tasks............................................1107.3.3 Dosimetry outcomes......................................................110
7.4 Operation Mosaic...................................................................1117.4.1 Groups potentially exposed...........................................1117.4.2 Operations and major tasks............................................1127.4.3 Dosimetry outcomes......................................................113
7.5 Operation Buffalo...................................................................1147.5.1 Groups potentially exposed...........................................1147.5.2 Operations and major tasks............................................1157.5.3 Dosimetry outcomes......................................................119
7.6 Operation Antler.....................................................................1217.6.1 Groups potentially exposed...........................................1217.6.2 Operations and major tasks............................................1217.6.3 Dosimetry outcomes......................................................124
7.7 Minor trials and post-Antler activities....................................1267.7.1 Groups potentially exposed...........................................1267.7.2 Dosimetry outcomes......................................................128
7.8 RAAF.....................................................................................1297.8.1 Introduction....................................................................1297.8.2 Hurricane.......................................................................1307.8.3 Totem.............................................................................1317.8.4 Mosaic...........................................................................1337.8.5 Buffalo...........................................................................1347.8.6 Antler.............................................................................1367.8.7 Potential sources of exposure for RAAF personnel.......136
x Australian participants in British nuclear tests in Australia — Vol 1: Dosimetry

7.8.8 Dosimetry outcomes......................................................136
7.9 Overall exposures...................................................................1397.9.1 Work groups..................................................................1397.9.2 Exposure statistics.........................................................1427.9.3 Comparison with a United Kingdom study....................143
7.10 Case control study..................................................................144
7.11 Conclusions............................................................................145
7.12 References..............................................................................145
Glossary and common acronyms.....................................................................147
Appendix 1 Project staff...............................................................................159
Appendix 2 Membership of the Consultative Forum................................161
Appendix 3 Membership of the Scientific Advisory Committee...............163
Appendix 4 Membership of the Dosimetry Sub-Committee, and Exposure Panel 165
Appendix 5 Mortality and cancer incidence study of Australian participants in British nuclear tests in Australia...............................167
Appendix 6 Some brief notes on radiation quantities and units...............173
Appendix 7 Radiation safety instrumentation used during the British nuclear weapons tests...........................................................................177
Addendum Calculating the activities and dose-rates for fallout mixtures.. . .183
Tables
Table 1 Standardised Mortality Ratios (SMRs) for main causes of death......xix
Table 2 Standardised Mortality Ratios (SMRs) and Standardised Incidence Ratios (SIRs) for selected cancers.....................................................xix
Table 1.1 Nuclear weapons tests in Australia.......................................................3
Table 1.2 The minor trials conducted in Australia...............................................7
Table 4.1 Recommended protection for participants in YELLOW, RED and BLUE control areas during Operation Buffalo...................................50
Contents xi

Table 6.1 Radiation dose assignment categories...............................................69
Table 6.2 Potential irradiation pathways for major trials...................................73
Table 6.3 Factors used to derive activities, dose rate or integrated dose at different times following an explosion (the table allows for fission products from 239Pu, activation products induced in 238U tamper and unburnt 239Pu fissile material).............................................................76
Table 6.4 Factors for deriving effective dosesa from inhaling or ingesting a mixture of fission products, unburnt 239Pu and induced nuclides from the 238U tamper....................................................................................78
Table 6.5 Decrease over time of external and inhalation doses from a ground deposit................................................................................................ 79
Table 6.6 Estimates of the dose from the initial flash for Marcoo in the Buffalo series................................................................................................... 85
Table 6.7 Worksheet showing the calculation of estimated daily doses from three pathways for land-based tests....................................................87
Table 6.8 Worksheet showing the calculation of estimated daily doses at three different times from three pathways for land-based tests (all doses in mSv)................................................................................................... 88
Table 6.9 Worksheet showing calculation of external dose from driving a contaminated vehicle..........................................................................90
Table 6.10 Worksheet for estimation of dose received marching through a contaminated area...............................................................................91
Table 6.11 Worksheet for the calculation of doses from sweeping operations at Taranaki.............................................................................................. 92
Table 6.12 Worksheet showing the external dose estimation for the assumed deposit................................................................................................ 93
Table 6.13 Worksheet to estimate the external dose to Australian Radiation Detection Unit (ARDU) members from fallout boundary search tasks during Operation Antler.....................................................................94
Table 7.1 General time line for Operation Hurricane.......................................104
Table 7.2 Potential irradiation pathways considered for Operation Hurricane.105
Table 7.3 Operation Hurricane: estimated external exposures.........................106
Table 7.4 Operation Hurricane: estimated internal exposures..........................108
Table 7.5 Film badge readings for the Joint Services Training Unit (JSTU) during exercises and sample collections associated with Operation Hurricane..........................................................................................109
Table 7.6 Potential irradiation pathways for Operation Totem........................110
Table 7.7 Operation Totem: estimated combined internal and external exposures111
Table 7.8 Naval vessels used for the Mosaic series..........................................112
Table 7.9 Potential irradiation pathways considered for Operation Mosaic.....113
Table 7.10 Operation Mosaic: estimated combined internal and external exposures..........................................................................................114
xii Australian participants in British nuclear tests in Australia — Vol 1: Dosimetry

Table 7.11 The Indoctrinee Force at Operation Buffalo.....................................116
Table 7.12 Potential irradiation pathways for Operation Buffalo.......................119
Table 7.13 Operation Buffalo: estimated combined internal and external exposures..........................................................................................120
Table 7.14 Distances from ground zero (GZ) to 20 mSv/h line for each test.....122
Table 7.15 Potential irradiation pathways for Operation Antler.........................124
Table 7.16 Operation Antler: estimated combined external and internal exposures125
Table 7.17 Program for the Minor Trials...........................................................127
Table 7.18 Radiological and non-radiological hazards at the Minor Trials........128
Table 7.19 Post-Antler activities and Minor Trials: estimated combined internal and external exposures.....................................................................129
Table 7.20 Summary information on Totem air sampling flights by Lincoln aircraft (adapted from Gale 1954)....................................................133
Table 7.21 Mean external γ doses and estimated internal doses from cloud sampling during Operation Buffalo (adapted from Holmes 1958)...135
Table 7.22 Potential irradiation pathways for Royal Australian Air Force operations.........................................................................................136
Table 7.23 Royal Australian Air Force (RAAF) operations: estimated external exposures..........................................................................................137
Table 7.24 Royal Australian Air Force (RAAF) operations: estimated internal exposures..........................................................................................138
Table 7.26 Summary of main exposure outcomes..............................................141
Table 7.27 Numbers exposed in each category..................................................142
Table 7.28 Summary of doses estimated for British participants in weapons tests in Australia.......................................................................................143
Table A2.1 Decimal numbers and their corresponding abbreviations.................176
Table A3.1 Some survey (dose rate) monitoring instruments used during the British nuclear tests in Australia.......................................................181
Table A3.2 Some contamination monitors used during the British nuclear tests in Australia...........................................................................................182
Table A.1 Activities of the more important radionuclides at 1 h and at times of 0.5 d to 10 d post-fission..................................................................188
Table A.2 Activities of the more important radionuclides at times of 20 d to 2 y post-fission.......................................................................................189
Table A.3 Dose rates for the more important radionuclides as Sv per hour for a total deposit of 1 MBq/m2 at 1 h and at times 1 h and 0.5 d to 10 d post-fission.......................................................................................190
Table A.4 Dose rates for the more important radionuclides as Sv per hour for a total deposit of 1 MBq/m2 at times of 20 d to 2 y post-fission.........191
Table A.5 Main radionuclides contributing to the inhalation dose per 10-h working day at times 1 h and 0.5 d and 20 d post-fission.................192
Contents xiii

Table A.6 Main radionuclides contributing to the inhalation dose per 10-h working day at times 20 d and 2 y post-fission................................193
Figures
Figure 1.1 Map of Australia showing nuclear test sites.........................................4
Figure 1.2 Maralinga.............................................................................................5
Figure 3.1 Absorbed dose in air as a function of distance for the nuclear weapons used in Japan (Radiation Effects Research Foundation)....................23
Figure 4.1 The layout of Health Physics caravans as used during Operations Buffalo and Antler (MacDougall 1958).............................................49
Figure 6.1 Measurements of the variation of the prompt dose (Sv) with distance (km) per unit yield (kT) for the Hurricane (H), Totem (T), Mosaic (M), Buffalo (B) and Antler explosions (A).......................................74
Figure 6.2 The relative contributions to the total dose as a function of time after fission.................................................................................................83
Figure 6.3 The relative contributions to the total dose as a function of time after fission for inhaled 239Pu (heavy line) and for all other sources excluding inhaled 239Pu (light line).....................................................84
Figure A.1 Decay scheme for radionuclides with mass number 95....................184
xiv Australian participants in British nuclear tests in Australia — Vol 1: Dosimetry
Executive summary
Between 1952 and 1957, the United Kingdom conducted 12 major nuclear weapons tests in Australia. The tests were carried out in five major operations: two at Monte Bello Islands, Western Australia (1952 and 1956); one at Emu Field, South Australia (1953); and two at the Maralinga Range, South Australia (1956 and 1957). Scientific studies on weapons components, known as minor trials, were undertaken in parallel between 1953 and 1963 at both Emu Field and the Maralinga Range.
Over 16,000 Australians, both military and civilians, participated in the tests. The range of tasks performed by Australian personnel increased steadily during the various series. The first three series (Hurricane, Totem, Mosaic) had limited Australian involvement. However, by the final two series (Buffalo, Antler), Australian participation was quite extensive, including responsibility for the Maralinga Range between and following the major tests.
The health effects of nuclear weapons tests on the British participants have been investigated, and three reports have been issued. In 1999, the Commonwealth Government resolved that a nominal roll would be compiled of Australian participants in the tests, and that this would form the basis for a mortality and cancer study.
There are two reports from this study:
Volume 1: a report on radiation exposures received by participants
Volume 2: a report on mortality and cancer incidence of participants, and a case-control study on the occurrence of leukaemia in relation to radiation exposure.
Study population
The study population was based on the nominal roll of test participants compiled by the Australian Government Department of Veterans’ Affairs (DVA). The study population comprised 10 983 male subjects, of whom 7116 were military participants and 3867 were civilians.
Subjects were followed to a cut-off date of 31 December 2001, when 5494 subjects (50%) were confirmed living, and 4427 subjects (40%) were confirmed deceased. A further 23 participants were known by DVA to be deceased, but corroborating evidence for the death could not be found. Less than 1% of participants (105 participants) were known to be living overseas or to have died overseas. The vital status of 934 subjects (8.5%) on the cut-off date was unknown.
Cancer incidence was studied from 1982 to 2001. Because cancer rates in the study population were compared with national rates, which are only available from 1982 onwards, this study excluded test participants who died before 1982. This limitation probably does not greatly affect the study findings, because cancers caused by external factors do not usually develop until many years after initial exposure.
xv

Study methods
Mortality rates and cancer incidence rates in participants were compared with national rates, compiled by the Australian Institute of Health and Welfare.
Because of the substantial number of subjects lost to follow-up, two methods of analysis were used. Results are presented for the method representing the estimate that is likely to be closest to the true rate.
Mortality is expressed as a standardised mortality ratio (SMR), with a confidence interval. The SMR is the ratio of the actual number of deaths in the participants to the number expected if the death rate was the same as in the general Australian population. An SMR greater than 1.0 indicates that the mortality is greater than in the general population, and an SMR less than 1.0 indicates that it is less. However, the SMR calculated using the study data is only an estimate of the true SMR. The confidence interval is a statistical estimate of the likely range within which the true SMR lies. If the lower boundary of the confidence interval exceeds 1.0, we can be reasonably confident that the true SMR exceeds 1.0, in which case the SMR is said to be ‘significantly increased’ — that is, the mortality rate is considered to be higher than in the general population. Conversely, if the upper boundary of the confidence interval is less than 1.0, the SMR is said to be ‘significantly reduced’, and the mortality rate is considered to be lower than in the general population.
Only statistically significant findings are shown in this summary. A ‘significant’ increase in SMR does not necessarily mean that it is a large increase.
Cancer incidence refers to the rate of occurrence of new cancers, regardless of whether the outcome is fatal. The standardised incidence ratio (SIR) is the ratio of the actual number of cancers in the participants to the number expected if the cancer rate was the same as in the general Australian population. Like the SMR, if the SIR is greater than 1.0, then the test participants have a greater than expected number of cancers.
Radiation dosimetry
A panel of health physicists (the Dosimetry Panel) was convened to develop estimates of the radiation doses received by participants. These estimates were used to investigate any relationship between radiation and health outcomes. The panel drew on extensive, but not complete, sets of historical and primary documents, kept at organisations such as the Australian Radiation Protection and Nuclear Safety Agency and the National Archives of Australia. Documents relating to the tests held by individuals were also reviewed, and some participants were interviewed to obtain an understanding of the tasks undertaken by work groups at the tests.
One of the main sources of information on participants’ exposure to external radiation is the record of film badges worn during the tests. Although the records are by no means complete, and it is apparent that not all the badges worn were actually processed, there are sufficient numbers to provide a basis for dose estimation. These film badge records have been supplemented by estimates based on measured radiation levels in contaminated areas and the estimated time that participants spent there. Computer calculations have also been used to estimate the dose rates that would arise from ground contamination, and how these would change with time. For internal exposure, such as that resulting from
xvi

inhalation of radioactive dusts, virtually no monitoring data were available and only computer modelling could be used.
Each participant was assigned an estimated accumulated dose for each test series from the dose rate estimates, the work groups they were in (e.g. military formations, ships’ companies) and the activities of each work group during that series. On the basis of these estimates, participants were grouped into one of five exposure categories, A to E, which represent effective doses of:
A less than 1 millisievert (mSv)
B 1 to less than 5 mSv
C 5 to less than 20 mSv
D 20 to 50 mSv
E over 50 mSv.
For some individuals, there is insufficient information on which to base an estimate of the dose; these are assigned to category F: ‘unknown’ exposure. If an individual attended several test series, the doses were combined.
Results
Radiation dosimetry
The radiological hazards that the participants faced arose mainly from nuclear weapons debris, including fallout, when it was distributed throughout their working environment. Those in areas contaminated by radioactive materials could be exposed to external radiation directly or to internal radiation from inhaled or ingested radioactive material, or to both.
The radiation doses received by Australian participants were generally small. Approximately 79% of the participants were assessed as receiving doses less than 1 mSv — that is, approximately half the annual dose received from natural background radiation. Only 4% received more than 20 mSv, the current internationally accepted annual limit for a radiation worker recommended by the International Commission on Radiological Protection. The average accumulated dose to participants was 2.8 mSv, approximately equal to the annual dose from natural background radiation. Although many participants have expressed concerns about the radiation dose they may have received from the actual flash of a detonation, exposures from this source were negligible, except in a group of military ‘Indoctrinees’ who participated in Operation Buffalo at Maralinga in 1956.
Some groups did receive significant exposures. The main groups who were exposed at the level of category C (5 to less than 20 mSv) or higher were:
some RAAF aircrew who flew through the contaminated clouds in RAAF or RAF aircraft after nuclear explosions
Executive summary xvii

crew members from HMAS Hawkesbury who assisted in records recovery and participated in Joint Services Training Unit (JSTU) exercises during Operation Hurricane
crew and divers from HMAS Koala who recovered a landing craft during Operation Hurricane
members of the JSTU who undertook radiation monitoring training during Operation Hurricane
members of the Radiation Hazards group at Operation Totem
Peace Officers who patrolled contaminated areas
Indoctrinee Force members at Operation Buffalo
elements of the Maralinga Range Support Unit who provided a range of engineering and support duties in forward areas from Operation Buffalo through to post Operation Antler activities
drivers and passengers in contaminated vehicles travelling over contaminated ground
members of the Australian Health Physics Group (AHPG) who conducted radiation surveillance
members of the AHPG team who collected Cobalt-60 (60Co) pellets after Operation Antler
a team that decontaminated and dismantled the DC 12 building in Maralinga Village at the end of the minor trials.
This dosimetry study was made independently of a similar UK study that estimated the doses received by British participants in the tests in Australia. The UK dose estimates are broadly similar to those presented here for the Australian participants.
Death rates
The commonest causes of death in the study group were cancer (1497 deaths) and ischaemic heart disease (coronary artery disease, 1148 deaths). Other leading causes of death were stroke (254); respiratory disease (338); and external causes, including accidents, poisoning and suicide (281).
The overall death rate was not significantly different from that in the general Australian male population. There were 4233 deaths observed in participants, compared with 4150 expected from the general population.
In RAN personnel, mortality was significantly higher than in the general population. In RAAF personnel, mortality was significantly lower than in the general population.
Cancer mortality was 18% higher than in the general male population. Mortality rates for diseases other than cancer were not elevated. Mortality from ischaemic heart disease was significantly lower than in the general population. Mortality from respiratory diseases was close to population rates. The death rate from external causes (suicide, poisonings, injury) was lower than in the general population. The suicide rate was 65% less than the rate in the general population.
SMRs by major cause are shown in Table 1.
xviii Australian participants in British nuclear tests in Australia — Vol 1: Dosimetry
Table 1 Standardised Mortality Ratios (SMRs) for main causes of death
Cause of death SMRAll causes 1.02All cancers 1.18*Heart disease 0.90*Stroke 0.86*Respiratory disease 1.05External causes (e.g. accidents, poisoning) 0.88*Suicide 0.35*
SMR greater than 1 means that mortality rate is greater than in the general male population.SMR less than 1 means that mortality rate is less than in the general male population.* means that mortality rate is statistically significantly different from in the general population.
Cancer mortality and incidence
A total of 2456 cancers occurred from 1982 to 2001.
The death rate from cancer was 18% above the population rate, and the cancer incidence rate was 23% above the population rate. Mortality and incidence rates were significantly greater than in the general population for a number of cancers, as shown in Table 2.
Table 2 Standardised Mortality Ratios (SMRs) and Standardised Incidence Ratios (SIRs) for selected cancers
Cancer type SMR SIR CommentAll cancers 1.18* 1.23*Lip, oral cavity and pharynx 1.50* 1.41*Oesophagus 1.15 1.48*Lung 1.20* 1.28* Highest rate in RANMesothelioma na 1.46 Significant increase in RANColorectal 1.24* 1.16*Melanoma 1.22 1.40* Highest rate in RAAFProstate 1.26* 1.22*All leukaemias 1.18 1.43*All leukaemias except chronic lymphatic
1.25 1.61*
SMR/SIR greater than 1 means that mortality/incidence rate is greater than in the general male population.SMR/SIR less than 1 means that mortality/incidence rate is less than in the general male population.* means mortality/incidence rate is statistically significantly higher than in the general population.
Cancer mortality and incidence by service category
Of the 26 mesothelioma cases in the cohort, 16 occurred in RAN personnel, and there was a significant 180% mesothelioma excess compared with the general population. Naval personnel showed a significant excess of both deaths from and incidence of all cancers (16% and 31% respectively), and lung cancer (48% and 50%). They also had a significantly raised incidence of cancers of the lip, oral cavity and pharynx (48%); melanoma (32%); prostate cancer (27%); and leukaemias other than chronic lymphatic leukaemia (non-CLL leukaemia, 87%). There was excess mortality from colorectal cancer.
In army personnel, the only incident cancer in significant excess was pancreatic cancer.
Executive summary xix
In RAAF personnel, both mortality and incidence of melanoma were significantly elevated, with a doubling of the mortality rate. There was a significant excess incidence of prostate cancer (30%), all leukaemias (64%) and non-CLL leukaemia (78%).
In civilian participants, the all-cause mortality and cancer incidence were elevated (21% and 19%). There was an excess of both mortality from and incidence of lung cancer (30% and 36%). There were also excesses of cancers of the lip, oral cavity and pharynx (41%) and colorectal cancer (23%).
Radiation and cancer
For all cancers combined and for specific cancers with a possible association with radiation, the cancer death rates were compared between the different exposure categories. Category A, the lowest exposure category, was used as the baseline group for comparison. If an association with radiation exposure was present in this cohort, a trend to increasing death rates with categories of increasing exposure would be expected.
Neither all cancers combined nor any cancer known to have an association with radiation showed any increase in mortality or incidence with increasing radiation exposure in this cohort.
The lack of association between cancer and radiation is not surprising, given the estimated low radiation exposure of most cohort members, and the relatively small proportion of subjects with any significant exposure. The average exposure in the test participants was only slightly above the background exposure experienced by all people in a single year, and about 100 times less than the dose received by the people who survived the Japanese atomic bombs, in whom excess cancers were found.
The number of excess cancers and cancer deaths to be expected from these exposure levels can be estimated by applying radiation levels to the known risk levels from other studies. It is estimated that up to six of the 2456 total cancers could be expected to have occurred from the exposures incurred in the study cohort.
Specific cancers
Leukaemia
Leukaemia is a cancer of particular interest because of its well-established association with ionising radiation exposure, but no association was found between the level of radiation exposure and death from non-CLL leukaemia. To search further for any such association, a case-control study was carried out, where the radiation exposure of participants with non-CLL leukaemia (cases) was compared with that of a sample of participants who did not have non-CLL leukaemia (controls). For this study, the panel was able to make a more detailed examination of likely radiation exposures of the 54 leukaemia cases and 216 controls included in this study. The panel examined each subject’s activities at the test sites, using documents such as service records, radiation film badge readings, and in some cases responses to a questionnaire administered in the 1980s. This study confirmed the findings from the mortality and cancer incidence studies of an absence of an association between leukaemia and radiation exposure.
The lack of association between non-CLL leukaemia and radiation in this cohort is not surprising given the low exposures. The findings are similar to those of the study
xx Australian participants in British nuclear tests in Australia — Vol 1: Dosimetry

conducted in the UK of British participants in the nuclear tests, where non-CLL leukaemia incidence was raised relative to comparison subjects. The UK study also found no association between leukaemia and radiation exposure, although it did not include retrospective exposure assessments, such as were made in the current study.
The overall excess of non-CLL leukaemias is unexplained. Other known causes of leukaemia include benzene, but estimating the extent of any exposure to benzene at the nuclear test sites is beyond the scope of this study. Viral infection is associated with one type of leukaemia (adult T-cell leukaemia), but there were no known cases of this type in participants.
Mesothelioma
Of 26 incident cases of mesothelioma, 16 occurred in RAN personnel. This is more than 2½ times the rate in the general population. Mesothelioma is nearly always associated with past exposure to asbestos, and asbestos in naval vessels is the likely source of exposure in most of these cases. It is likely that repeated asbestos exposure occurred, which need not necessarily have occurred at the time of the nuclear tests.
Of the other 10 cases of mesothelioma, 8 occurred in civilians. Because the cases could not be individually linked to other study records (due to privacy laws), the occupations of these civilians is unknown. However, many of the civilian subjects in the cohort were in the construction industry, where asbestos was commonly used, at a time when less caution was exercised than in recent years. Whether any of these subjects were exposed to asbestos during the nuclear tests is not known.
Lung cancer
An excess of lung cancer always suggests a higher smoking prevalence than in the general population.
However, some contribution from asbestos is also likely because lung cancer has a known association with asbestos. The occurrence of mesothelioma in RAN and civilian subjects is a definite indication of asbestos exposure, and occurrence of other asbestos-related diseases would therefore not be surprising. RAN and civilian participants also had the highest rates of lung cancer.
No association was found between lung cancer incidence and radiation exposure in this cohort. Although previous research has shown an association between lung cancer and ionising radiation, this result is not surprising given the generally low average radiation exposure found in this study
Melanoma
A significant excess of melanoma occurred in RAAF personnel. The occurrence of excess melanoma has been noted elsewhere in aircrew, and occupational exposure to cosmic radiation has been considered as a possible cause. Because of privacy constraints, it was not possible to identify which of the 71 cases in RAAF personnel were aircrew. However, only 4 of the 22 melanoma deaths in RAAF personnel were known to be aircrew. (The occupation of 5 decedents was not known.) It is probable that the excess melanoma incidence in RAAF personnel is not confined to aircrew.
There was no significant trend in melanoma incidence with increasing radiation exposure.
Executive summary xxi

Colorectal cancer
Although colon cancer has been cited as a radiogenic cancer, no association was found between mortality or incidence of colorectal cancer and radiation exposure. Asbestos exposure is a possible contributing factor to the excess of colorectal cancer mortality. Colorectal cancer mortality was significantly elevated in RAN personnel, who also had the highest mortality from lung cancer and most of the cases of mesothelioma, diseases known to be associated with asbestos exposure.
Head and neck cancer (cancers of the lip, oral cavity and pharynx)
Both mortality and incidence of these cancers occurred in significant excess. Head and neck cancers are strongly smoking-related and are also related to alcohol intake. The excess lung cancer rate suggests a higher smoking prevalence in this cohort than in the general population. However, the absence of an excess incidence of liver cancer or of death from cirrhosis of the liver suggests that alcohol consumption is not excessive in this cohort.
Prostate cancer
A possible contributing factor to the excess of prostate cancer in this cohort is increased intensity of diagnosis in the military participants. The reported incidence of prostate cancer has risen in recent years following the introduction of PSA (prostate specific antigen) testing. It is plausible that ex-service personnel would undergo more intensive medical surveillance and care than the general population, so that diagnosis of the cancer would be more likely.
‘Radiogenic’ cancers
‘Radiogenic’ cancers are a group of cancers shown in the Life Span Study of Japanese atomic bomb survivors to be causally associated with radiation. They are cancers of the thyroid, stomach, colon, liver, lung, breast, ovary, bladder; leukaemia (excluding chronic lymphatic leukaemia); and non-melanoma skin cancer. Both mortality and incidence of this combined group of cancers was significantly elevated in the study cohort. However, no association was found with radiation exposures. Of the cancers classified as ‘radiogenic’, more than 75% were lung or colorectal cancers, and it is possible that the excess of this group of cancers is due to other factors associated with these particular cancers.
xxii Australian participants in British nuclear tests in Australia — Vol 1: Dosimetry
1 Introduction
The Department of Veterans’ Affairs (DVA) is reporting on four studies relating to the mortality and cancer incidence of Australian military and civilian participants in the British nuclear weapons tests in Australia, conducted between 1952 and 1963. These studies were initiated because of the health concerns expressed by Australians involved in the nuclear tests.
The study reported here (Volume 1) estimates Australian participants’ exposure to ionising radiation.1 This report provides radiation dose estimates for use in the other three studies.
The other three studies examine the mortality — particularly mortality from cancer— and cancer incidence in Australian participants, compared to the general Australian population and in relation to estimated ionising radiation exposure levels of the participants. One of them is a case-control study nested within the cancer incidence study, which examines the association between leukaemia and ionising radiation doses. These three studies are reported in Volume 2.
1.1 Objective
The objective of this dosimetry study is to broadly categorise the exposure to ionising radiation incurred by various groups of Australian participants in the British nuclear weapons tests and associated ‘minor trials’2 conducted in Australia between 1952 and 1963. This study is concerned only with exposures to ionising radiation. In line with the main study protocol, no attempt has been made to investigate possible exposures to other toxic materials that may have been used in, or in conjunction with, the atomic weapons trials.
There is currently limited information regarding each participant’s tasks and activities, time of service at a test site, and specific ionising radiation doses. This lack of information has made it difficult to accurately categorise ionising radiation exposure levels for each individual involved in the tests. Therefore, the categorisation of individuals into different exposure levels is based upon the activities of their work group, and the ionising radiation doses that may have been recorded for other individuals within that group.
1.2 Study organisation and administration
The conduct of this study was the responsibility of DVA on behalf of the Repatriation Commission. The study’s Scientific Advisory Committee (SAC) proposed that an expert subcommittee and panel be established to produce the dosimetry report. The study was planned in consultation with a Consultative Forum, obtained appropriate ethics approvals, and was given scientific and technical guidance by the SAC.
1 Scientific and technical terms in bold are explained in the glossary.2 The British program included both the detonation of 12 nuclear fission devices and a wide range of ‘minor trials’; that is, tests of weapons components, safety tests of weapons and tests of neutron initiators. In this report ‘major’ or ‘weapons tests’ refers to the explosion of nuclear weapons, ‘minor trials’ to the other experimental programs.
1

1.2.1 Australian Government Department of Veterans’ Affairs
The conduct of this study was a responsibility of DVA on behalf of the Repatriation Commission. The DVA project staff are listed in Appendix 1.
1.2.2 Consultative Forum
A Consultative Forum, with representatives from Australian ex-Service organisations; DVA; Department of Defence; Department of Education, Science and Training; and Comcare was established to provide advice on the conduct of the study. The forum provided a means for discussion on issues relating to the study methodology and for feedback from test participants. Representatives from the Consultative Forum also provided invaluable information concerning the conduct of the nuclear tests and the surrounding contextual issues. The membership of the forum is shown in Appendix 2.
1.2.3 Scientific Advisory Committee
The SAC consisted of respected academics and practitioners with expertise relevant to the study. Its role was to review and advise on the methodology of the study. The SAC proposed that an expert subcommittee and panel be established to undertake the dosimetry study. The members of the SAC are listed in Appendix 3.
1.2.4 Dosimetry Subcommittee
The Dosimetry Subcommittee was established to undertake the research for, and the writing of, this report. The members of this subcommittee were invited to take part in the study based on their expertise in health physics. The members of the subcommittee are shown in Appendix 4.
1.2.5 Exposure Panel
The Exposure Panel was established to review the ionising radiation doses assessed by the Dosimetry Subcommittee and to assign exposure categories to those Australian participants included in the mortality and cancer incidence studies. These dose assignments are reported within this study and will be used in the mortality and cancer incidence studies. The Exposure Panel members were selected from the Dosimetry Subcommittee by virtue of their specific expertise and experience in ionising radiation dose reconstructions.
1.3 Study protocol
A protocol for the study was developed and agreed upon by the SAC and the Dosimetry Subcommittee. The study protocol is included as Appendix 5.
1.4 Methodology
The approach adopted in this study has been to use the list of participants prepared by DVA, known as the ‘Study Roll’, coupled with an extensive review of the available
2
documentation to assess possible radiation exposures. The Study Roll is drawn from a preliminary nominal roll of Australian participants in the British atomic tests in Australia. Wherever possible, records of film badge results have been used. In other cases, radiation exposures have been derived by computation. Chapter 6 sets out in detail the methods used to derive possible exposure categories. The Dosimetry Subcommittee was unaware of participants’ names, other than those mentioned in primary historical sources and major secondary sources.
1.5 List of major tests
The United Kingdom conducted 12 major nuclear weapons tests in Australia between 1952 and 1957. These explosions were carried out in five separate operations (see Table 1.1). The tests occurred at the Monte Bello Islands, off the northwest coast of Western Australia, and at Emu Field and Maralinga, in the western desert region of South Australia (see Figures 1.1 and 1.2).
Table 1.1 Nuclear weapons tests in Australia
Local date and timea Site Explosion typeHeight
(m)Measured yield (kT)b
Hurricane Test at Monte Bello Islands, WA3 Oct 1952 (0800) Off Main Beach,
Trimouille IslandUnderwater -2.7 m 25c
Totem Series at Emu Field, SA15 Oct 1953 (0700) T1 Near surface: Tower 31 9.1c
27 Oct 1953 (0700) T2 Near surface: Tower 31 7.1c
Mosaic Series at Monte Bello Islands, WA16 May 1956 (1150) G1: Trimouille
IslandNear surface: Tower 31 13.5c or 16d
19 Jun 1956 (1014) G2: Alpha Island Near surface: Tower 31 56c or 98d
Buffalo Series at Maralinga, SA27 Sept 1956 (1700) One Tree Near surface: Tower 31 12.9c
4 Oct 1956 (1630) Marcoo Surface 0.2 1.4c
11 Oct 1956 (1427) Kite Air drop 150 2.9c
22 Oct 1956 (0005) Breakaway Near surface: Tower 31 10.8c
Antler Series at Maralinga, SA14 Sept 1957 (1435) Tadje Near surface: Tower 31 0.93c
25 Sept 1957 (1000) Biak Near surface: Tower 31 5.7c
9 Oct 1957 (1615) Taranaki Airburst: balloon support 300 26.6c
aOther reports may provide the UK date and time of tests.bMeasured yield (kT) as reported by the UK (see notes c and d for sources)cUK Ministry of Defence Tabulation SFS/A/26 (W.N. Saxby, 14.3.84) referencing Atomic Weapons Research Establishment (AWRE) Classified Reports T1/77 and T2/80dUK Atomic Weapons Research Establishment (AWRE) Report T23/57 ‘Operation Mosaic’, p. 11 (1957); the higher yields were considered in the dose assignments reported here.
Introduction 3

Figure 1.1 Map of Australia showing nuclear test sites
4 Australian participants in British nuclear tests in Australia — Vol 1: Dosimetry

Figure 1.2 Maralinga
1.5.1 Operation Hurricane
The first major test, entitled Operation Hurricane, consisted of one device exploded on 3 October 1952 at 0800 Western Standard Time (WST) in the Monte Bello Archipelago off the northwest coast of Western Australia.
Introduction 5

1.5.2 Operation Totem
Operation Totem was the second British nuclear test series in Australia, consisting of two explosions. The first occurred on 15 October 1953 and the second on 27 October 1953. Both detonations occurred at 0700 Central Standard Time (CST). Operation Totem was conducted at Emu Field, which is situated in the western desert region of South Australia.
1.5.3 Operation Mosaic
The third test series was Operation Mosaic. It involved two detonations, both carried out on the Monte Bello Islands. The first detonation occurred on 16 May 1956 at 1150 (WST) and the second on 19 June 1956 at 1014 (WST).
1.5.4 Operation Buffalo
Operation Buffalo was the fourth series of tests and it consisted of four detonations at Maralinga, the permanent testing site established 190 km south of Emu Field. The first detonation occurred on 27 September 1956 at 1700 (CST), the second on 4 October 1956 at 1630 (CST), the third on 11 October 1956 at 1427 (CST), and the fourth on 22 October 1956 at 1205 (CST).
1.5.5 Operation Antler
Operation Antler was the final series of tests, consisting of three detonations, all of which occurred at Maralinga. The first detonation occurred on 14 September 1957 at 1435 (CST), the second on 25 September 1957 at 1000 (CST), and the third on 9 October 1957 at 1615 (CST).
1.6 List of minor trials
In addition to the major tests, approximately 600 minor trials, in several series, were carried out between 1953 and 1963. Five different types of trials were conducted (see Table 1.2).
Primarily, these minor trials aimed to examine aspects of weapon design and safety, and generally did not involve significant levels of nuclear fission. However, some series, in particular some of the Kittens and especially the Vixen B experiments, did generate relatively large quantities of radioactive contamination. The early trials (Kittens, Tims and Rats) tested individual components of the nuclear weapon, while Vixen A investigated the dispersal of radioactive material and Vixen B assessed the effect of various types of potential accidents on the weapons.
6 Australian participants in British nuclear tests in Australia — Vol 1: Dosimetry

Table 1.2 The minor trials conducted in Australia
Name Locationa Period No. trials PurposeKittens Emu Field and
Naya1953–1961
99 Tests of weapons components: neutron initiator development (polonium-210 [210Po], beryllium and uranium)b,c,d
Tims Naya and Kuli 1955–1963
321 Tests of weapons components: tamper development (uranium and beryllium at Kuli) and studies of plutonium compression under explosive force (at TM100/101 at Naya)
Rats Naya and Dobo 1956–1960
125 Tests of weapons components: developmental experiments involving internal radiography and explosive dispersal of uranium
Vixen A Wewak 1959–1961
31 Dispersal of various radioactive materials by fire and explosion (including uranium and plutonium)
Vixen B Taranaki 1960–1963
12 Effect of accidental detonation and ongoing weapons development (explosive dispersal of uranium and plutonium)
aTrials were carried out at Maralinga, with the exception of some Kittens experiments conducted at Emu Field, 190 km north of Maralinga.bUranium can refer to natural uranium (predominantly 238U at 99.3%) or enriched uranium (where the percentage of 235U has been increased above 0.7%).cIt should be noted that beryllium, although chemically toxic, is not radioactive and is not considered in this report.dNatural uranium was used as a tamper during the major explosions. It is of low specific activity (half-life 4.5x10⁹ years). The radioactive materials produced by neutron capture in uranium during fission (activation products) are of much greater radiological concern and are considered in Chapter 6, Section 6.4.1.
1.6.1 Kittens
The first series, Kittens, consisted of 99 trials conducted at both Emu Field and Maralinga (Naya) between 1953 and 1961.
1.6.2 Tims
Tims included 321 trials conducted at two Maralinga sites (Naya and Kuli) between 1955 and 1963.
1.6.3 Rats
The Rats series included 125 trials conducted at two Maralinga sites (Naya and Dobo) between 1956 and 1960.
1.6.4 Vixens (A and B)
All 31 Vixen A trials took place at Maralinga (Wewak) between 1959 and 1961. The Vixen B series involved 12 trials carried out at Maralinga (Taranaki) between 1960 and 1963.
1.7 Personnel involvement and tasks
Over 16 000 Australians, members of the Defence Forces and civilians, were involved directly and indirectly in various tests and trials. Included were 3300 members of the Royal Australian Navy (RAN), 1650 members of the Australian Army, and 3200 Royal
Introduction 7

Australian Air Force (RAAF) personnel. The Australian military personnel were involved primarily in preparing test sites, monitoring and observing the tests, and cleaning up the sites.
In addition to working in the test areas, some Australian military personnel carried out tasks at sites remote from the tests that may have led to some ionising radiation exposures. This group was primarily aircraft maintenance personnel who were involved in the decontamination and servicing of aircraft that had flown through the mushroom clouds.
The 8600 Australian civilian participants were employees of firms contracted to construct, maintain and/or support the testing facilities, as well as Australian public servants and employees of semi-government organisations involved with the conduct of the testing program.
Most individual participants were present for only one major trial series, approximately 10% attended two series, and less than 3% attended three or more series.
1.8 Basis of the report
The work reported here is based on the study protocol (Appendix 5) approved by the SAC, and is concerned only with the reconstruction of possible ionising radiation exposures of Australian participants in the British nuclear test program conducted in Australia between 1952 and 1963.
1.9 Structure of the report
Each chapter in this report consists of two parts. The first is a summary of the contents of the chapter, written in nontechnical language. This is followed by the substance of the chapter, in more technical language.
Scientific, technical and mathematical terms used are highlighted in bold on their first occurrence in the text, and their meanings are explained in the Glossary.
The basic principles of ionising radiation are discussed in Chapter 2, with particular emphasis on those concepts that apply to exposure from nuclear weapons. Chapter 2 also includes information on radiation units. The variety of radiation units used are described in more detail in Appendix 6.
Chapter 3 discusses the various mechanisms and pathways by which participants in nuclear weapons testing can be exposed to ionising radiation.
Throughout the test series, there were various health physics procedures and requirements in place, which were intended to minimise the radiation exposure of participants. These are described in Chapter 4.
Information on which the participants’ radiation exposures were estimated was gathered from a number of sources. These sources are described in Chapter 5.
Chapter 6 describes the ways in which radiation doses were calculated for the participants. It includes information on how radiation doses changed with time, and how
8 Australian participants in British nuclear tests in Australia — Vol 1: Dosimetry

internal and external doses were calculated and combined. It also includes examples of how these results could be applied to particular situations.
Chapter 7 takes the results of Chapter 6 and applies them to the particular workgroups and activities at the test series. From this procedure, the dose assignments for those groups are derived. The chapter concludes with a discussion of the results.
1.10 Reference
Commonwealth of Australia (1985). The report of the Royal Commission into British Nuclear Tests in Australia Vol 1 and 2, Australian Government Publishing Service, Canberra.
Introduction 9

2 Ionising radiat ion — sources, ef fects and controls
Summary
This chapter summarises the basic concepts of radiation and radiation protection. It deals mainly with principles, not with specific situations that may have occurred during the British nuclear weapons tests and minor trials programs.
The four types of ionising radiation experienced at the tests were alpha, beta, gamma and neutron radiations. The two main units used are the becquerel (Bq)3 for the amount of radioactive substance (radioactivity), and the sievert (Sv) for the dose of radiation received by a person. One sievert is a very large dose and doses in this report are generally in millisieverts (mSv): one thousandth of a sievert, and in some cases microsieverts (μSv): one millionth of a sievert.
Radiation exposure can arise from sources outside the body (external exposure) or from radioactive material inside the body (internal exposure). The most significant way in which radioactive material can enter the body (exposure pathway) is by breathing it in (inhalation).
Radiation exposure can be reduced in a number of ways. For external exposure, these include: staying further from the source, spending less time in the region of the source, or using radiation shields. For internal exposure, the main method to reduce exposure is to reduce the intake of radioactive material — for instance, the amount of radioactive dust inhaled. This can be done by reducing the amount of dust generated, reducing the time spent in dusty areas, or by using respiratory protection, such as dust masks and respirators.
The health effects of radiation are now well known. Very high doses from external radiation can cause radiation burns, radiation sickness or death within a short time (e.g. within a month). At lower doses, radiation exposure can result in an increased risk of developing cancer.
2.1 Ionising radiation
Ionising radiation is defined as radiation that has enough energy to ionise matter through which it passes. This may be described as the stripping off of one or more electrons within an atom. Electrons carry a negative charge, leaving the nucleus positively charged. The resultant positively charged part is called an ion, and radiation that has enough energy to strip electrons in this manner is called ‘ionising radiation’. The health effects that arise from exposure to ionising radiation are understood to derive from ionisation taking place in living cells. This chapter describes the main types of ionising radiation, ways in which radiation exposure can occur, the effects of ionising radiation, and the ways in which people can be protected from the potentially adverse effects of exposure to ionising radiation.
3Appendix 2 explains the plethora of radiation units used both at the time of the tests and currently. Where appropriate, the historical units are converted into the Systeme Internationale d’Units (SI) units adopted in 1980.
11

The chapter deals with radiation and radiation protection generally, and not with the specific situations that may have been encountered during the British nuclear weapons programs in Australia.
2.2 Types of ionising radiation
Ionising radiation is of two types: subatomic particles and electromagnetic radiation.
The subatomic particles of interest in this study are alpha particles, beta particles and neutrons.
Alpha particles — These consist of two protons and two neutrons (i.e. the nucleus of a helium atom). Alpha particles are relatively heavy and slow moving, and, because they lose their energy very quickly, they have very short ranges — around 3 cm of air. They cannot penetrate a sheet of paper, and cannot, therefore, penetrate the outer dead layers of the skin.
Beta particles — These are high-energy electrons. They can be moderately penetrating, up to 1 m or so of air, or a few millimetres of aluminum, and a short distance into animal tissue.
Neutrons — High-energy neutrons can penetrate several centimetres in concrete. Neutrons, unlike alpha and beta particles, can make objects that they irradiate radioactive.4 They, like gamma and X-rays, can pass right through the body.
Types of electromagnetic radiation include X-rays and gamma rays.
X-rays are able to penetrate a centimetre or so of steel, and if sufficiently energetic can pass right through the human body, hence their use in diagnostic and therapeutic radiology.
Gamma rays are generally more energetic and, therefore, more penetrating than X-rays. X-rays and gamma rays are physically identical, the different names denoting the different methods of generation: gamma rays come from transformations within the nucleus of an atom, whilst X-rays come from changes in the orbits of electrons.
2.3 Quantities and units used for radiation
There are two major quantities used in the measurement of radiation, the measurement of radioactivity5 and the measurement of radiation dose.6
The radioactivity is the ‘amount’ or quantity of a radioactive substance, measured by the rate at which it is undergoing radioactive decay. The unit is the becquerel (Bq), which has replaced the curie (Ci, also written as c up to about 1956), the unit used at the time of the British nuclear tests.
The radiation dose is the amount of radiation being absorbed by an object. The unit mostly used in this document is the sievert (Sv). It is strictly a measure of what is called the effective dose to a person. The sievert is a complex unit that allows for the
4Under experimental conditions, very high-energy alpha particles can also induce radioactivity in materials they irradiate. Such conditions were not experienced during the nuclear test program.5The term ‘radioactivity’ is often shortened to ‘activity’.6The term ‘radiation dose’ is frequently shortened to ‘dose’.
12

energy deposited in the organs being irradiated, the radiosensitivity of the exposed organ and the radiological effectiveness of the radiations involved (alpha, beta and gamma). It has replaced a unit called the rem.
These quantities and units, including those in use at the time of the British nuclear tests, are discussed in more detail in Appendix 6.
2.4 Types of radiation exposure
There are two general ways in which a person can be exposed to radiation — externally and internally.
2.4.1 External exposure
External exposure comes from radiation sources outside the body, such as X-ray machines or from standing on ground contaminated by radioactive material.
External exposure can only arise from radiation that has sufficient range and energy to penetrate any gap or shielding between the source of radiation and the person, and then pass through clothes and the outer dead layers of the skin. Hence, alpha particles cannot contribute to external dose, nor can low-energy beta particles.
External exposure to people ceases as soon as the source is removed or they move away from the source, although where clothes or equipment are contaminated a person may take radioactive material with them.
External radiation is relatively easy to assess. Instruments such as a Geiger-Müller counter (see Appendix 7 for information on radiation-measuring instruments used at the time of the tests) can measure the radiation level (dose rate) in an area. The total radiation dose a person has received can then be calculated from the time spent in that area. The total dose received in millisieverts is the dose rate in millisieverts per hour multiplied by the number of hours of exposure.
There are several instruments that can measure total external dose directly, the most common at the time of the tests being the film badge. Quartz fibre electroscopes (QFEs) were also used to measure external radiation exposures. However, QFEs had limitations in that they did not provide a permanent record and the apparent dose could be affected by dropping or banging the dosimeter.
2.4.2 Internal exposure
Internal radiation exposure is the accumulation of radiation dose from radioactive materials within the body. Most commonly, this arises from such materials that have entered the body by inhalation or ingestion (swallowing). Other possible internal pathways are absorption of radioactive material through the skin, or via the contamination of wounds. All forms of radiation can produce internal exposure.
It is considerably more difficult to assess internal exposure than external exposure. The intake of radioactive material — for example, by inhalation — can be estimated from the radioactive content of the air being breathed, the breathing rate and the time spent in the area. However, in order to estimate the radiation dose arising from this intake, it is
Ionising radiation — sources, effects and controls 13

necessary to have information on such matters as the particle size of the material (to determine where in the respiratory tract it will deposit), the chemical form (to determine the rate at which it will be taken up by lung fluids), circulation in the body, retention in organs, radioactive half-life and excretion rate of the relevant radionuclides (biological half-life). These values can be obtained from tables published by bodies such as the International Commission on Radiological Protection (ICRP), if sufficient is known about the materials inhaled or ingested.
Internal exposure will continue until the radioactive material in the body has either decayed away radioactively or been excreted. Thus, exposure can continue for many years after an initial intake. In the method of estimating internal dose outlined above, allowance is made for this extended exposure. The entire radiation dose that will be accumulated in the years following an intake of radioactive materials is calculated, and this dose is recorded as having occurred in the year of the intake. If doses are received in subsequent years, the same procedure is followed and the doses added.
Assessment of internal radiation exposure can be made by measuring the radioactive content of an exposed person’s urine or, in some cases, faeces.
Whole body monitoring is where the subject is placed in a specially shielded unit containing sensitive radiation detectors, in order to measure the radiation emitted by the radioactive materials inside the body. This procedure is only suitable for gamma-emitting radionuclides. Whole body monitoring was at an early stage of development at the time of the nuclear tests discussed here.
2.5 Radiation exposure pathways and their control
In this section, the general principles of control for both internal and external exposures are discussed.
2.5.1 External exposure
There are three general methods for the control of external exposures:
Time — external exposures can be reduced by decreasing the time spent near radiation sources or in contaminated areas.
Distance — external exposures can be reduced by increasing the distance from the source of radiation. The reduction generally follows the inverse square law — the dose is reduced by the square of the increase in distance. Thus, doubling the distance will reduce the dose to a quarter of what it would be at the original distance, increasing the distance three times reduces the dose to one ninth, and increasing distance by a factor of ten reduces the dose to one hundredth. Strictly, this law only applies to point sources, but it can be applied to large sources when the distance from a source is much greater than its lineal size. It is not applicable when close to large area sources, such as areas of contaminated soil.
Shielding — placing some radiation-absorbing material (shielding) between the source and the potentially exposed person can reduce the resulting external radiation dose. The amount and nature of the shielding required depends on the type of radiation involved. Heavy elements, such as lead, are very effective for shielding X- and gamma radiations. At high radiation energies, all materials are approximately
14 Australian participants in British nuclear tests in Australia — Vol 1: Dosimetry

equivalent, and the shielding depends on the density of the shield. Personal shielding, such as a lead-rubber apron, is only practical against low energy X- and gamma radiation, and rapidly becomes totally impracticable at higher energies.
Millimetre thin layers of metal, or a centimetre or so of plastic, are effective for shielding beta radiation. Neutrons are quite penetrating in heavy elements. They are more effectively shielded by materials containing light elements such as water, wax or polythene.
2.5.2 Internal exposure
The procedures for protection against internal exposure are not as simple as those for external exposure, given that there are numerous possible exposure pathways. Protection focuses on limiting intakes, and some general principles can be stated.
Isolation from sources — keeping people away from potential sources of exposure, such as contaminated areas, means that the intake of radioactive materials will be reduced. Ventilation, which removes contaminated air and provides fresh air for breathing, is another way of reducing exposure.
Reduction of sources — activities that produce potential exposure pathways should be minimised; for example, dust generation should be reduced where practicable by wetting down dusty materials.
Personal protection — the most common form of personal protection is respiratory protection, which removes contaminants from inhaled air. This can range from a relatively simple respirator to a complete ‘air suit’ with its own air supply. Generally, standard particulate filters are quite satisfactory for radioactive materials, although there may be specific situations where some form of vapour-absorbing cartridge may be required.
Personal hygiene — this is important for reducing ingestion, particularly via hand-to-mouth transfer. Removal of contaminated clothing and showering after leaving a contaminated area can reduce the spread of radioactive material to uncontaminated work or living areas. It should be noted that ‘radiation protective clothing’ does not protect against external radiation exposure, except for low-energy beta radiation, but it is an aid to decontamination after working in contaminated areas.
2.6 Biological effects of radiation exposure
By the time of the British nuclear weapons tests, a good deal of knowledge had been gained about the adverse biological effects of exposure to ionising radiation, and more accumulated during the decade of the tests. Further knowledge has been gained since then, so our current understanding is much more comprehensive than in the 1950s.
Broadly, the effects are divided into ‘somatic’ and ‘genetic’ effects — that is, those that appear in the person irradiated and those that may be induced in their offspring, respectively.
Ionising radiation — sources, effects and controls 15

2.6.1 Early history
Knowledge of the damaging effects of ionising radiation dates back to 1895 when Roentgen announced the discovery of X-rays. By 1897, over 20 cases of X-ray dermatitis had been reported and symptoms such as sickness and diarrhoea were recognised as being associated with radiation exposure. The first known death from X-rays occurred in 1914: an Italian radiologist who had worked with X-rays for 14 years.
Not long after the discovery of radium, it was realised that radiation from radioactive materials could also cause harm. Marie Curie described in her biography how her husband Pierre had:
…voluntarily exposed his arm to the action of radium during several hours. This resulted in a lesion resembling a burn that developed progressively and required several months to heal.
Increasingly, evidence accumulated that exposure to high levels of ionising radiation is harmful. This evidence came from a range of activities, including medical and occupational exposures.
In the 1920s, steps were taken to introduce some controls on levels of exposure to ionising radiation. The second International Congress on Radiology (ICR) issued their first recommendations in 1928. They were very generalised, along the lines of:
The dangers of over-exposure to X-rays and radium can be avoided by the provision of adequate protection and suitable working conditions.
By 1934, the measurement of ionising radiation had become formalised in a unit called the roentgen (R or r),7 and an exposure limit (tolerance dose)8 of 0.2 R per day (2 mSv/day)9 was proposed for work with X-rays. The ICR noted that: ‘no similar tolerance dose is at present available in the case of gamma rays’.
By the early 1940s, additional health concerns were being raised:
some geneticists were expressing concerns that the ‘tolerance dose’ of 1 R per week (10 mSv/week)10 was too high when considering possible genetic effects
evidence from the study of radium dial painters, who had ingested radium when painting luminous dials, was showing that ingested radioactive materials could be just as hazardous as external radiation exposures.
In 1950, the ICRP was established. The commission issued its first set of recommendations in 1951 and has continued to do so on a regular basis. The maximum permissible doses published in 1951 (i.e. those applicable at the time of the tests) are summarised in Chapter 4.
7Throughout this chapter, historical units are quoted. Where the current units are relevant, they are given in parentheses. See Appendix 2 for a fuller explanation of the units used in radiation protection both at the time of the nuclear weapons programs and currently. At the time of the tests, R and r were used somewhat indiscriminately.8The concept of ‘tolerance dose’ was still in use at the time of the British nuclear tests.9The conversion from roentgen to sievert is only approximate.10Note that the currently recommended occupational exposure limit is 100 mSv over 5 years; effectively 20 mSv per year.
16 Australian participants in British nuclear tests in Australia — Vol 1: Dosimetry

2.6.2 Current knowledge
There is now a large amount of information available on the effects of exposure to radiation of all types and at all dose levels. Detailed studies of the victims of the Hiroshima and Nagasaki bombs, combined with studies of people exposed medically and occupationally, particularly uranium miners, have led to a better understanding of the effects of radiation on the human body as a whole. Developments in genetics and radiobiology have added to a greater understanding of the interaction of ionising radiation with human cells.
The health effects of ionising radiation are divided into two broad classes. The possible outcomes of a large dose of radiation received in a relatively short time are called deterministic effects. The possible longer-term effects of lower radiation doses delivered over a longer time period are traditionally called stochastic effects.
Deterministic effects
Deterministic effects from exposure to ionising radiation arise from the killing of cells by radiation. Low doses of radiation do not produce immediate clinical effects because of the relatively small number of cells killed. However, at high doses, enough cells may be killed to cause breakdown in tissue structure or function. One of the most common effects, skin burn, is commonly observed following localised high-intensity X-ray exposure. When the whole body is irradiated, high doses of radiation can break down the lining of the gastrointestinal tract, leading to radiation sickness, and the breakdown of other body functions, leading to death.
Deterministic effects are so called because the effect follows an elevated radiation exposure and it is ‘determined’ by the size of the exposure. There is a threshold below which deterministic effects do not occur. For the average individual, no immediate deterministic effects are observed at doses less than 1 Sv (100 rem). Above this dose, nausea, vomiting and diarrhoea from radiation sickness may occur within a few hours or so. As the dose increases, effects will be seen sooner, be more severe and persist longer. A dose of approximately 3 to 5 Sv is sufficient to cause the death of approximately 50% of those exposed within 60 days, known as the lethal dose (LD 50(60)). Medical attention may improve the outcomes. A dose of 15 Sv received within a short period of time will cause unconsciousness within a few minutes and death within a few days.
For comparison, the current accepted limit for occupational exposure is 20 mSv per year, (i.e. 2% of the dose that may induce radiation sickness), if received over a short time period, and at less than 0.5% of the LD 50(60).
There is no biological evidence that doses less than 50 mSv cause deterministic effects in humans.
Other deterministic effects that may result from radiation exposure include cataracts, or temporary or permanent sterility. Opacities have not been seen at doses below approximately 0.5 Sv and are only severe enough to affect vision at doses above approximately 5 Sv. Temporary sterility in males can occur following single doses above approximately 0.15 Sv, but fertility returns after a month or so (ICRP 1991).
Ionising radiation — sources, effects and controls 17
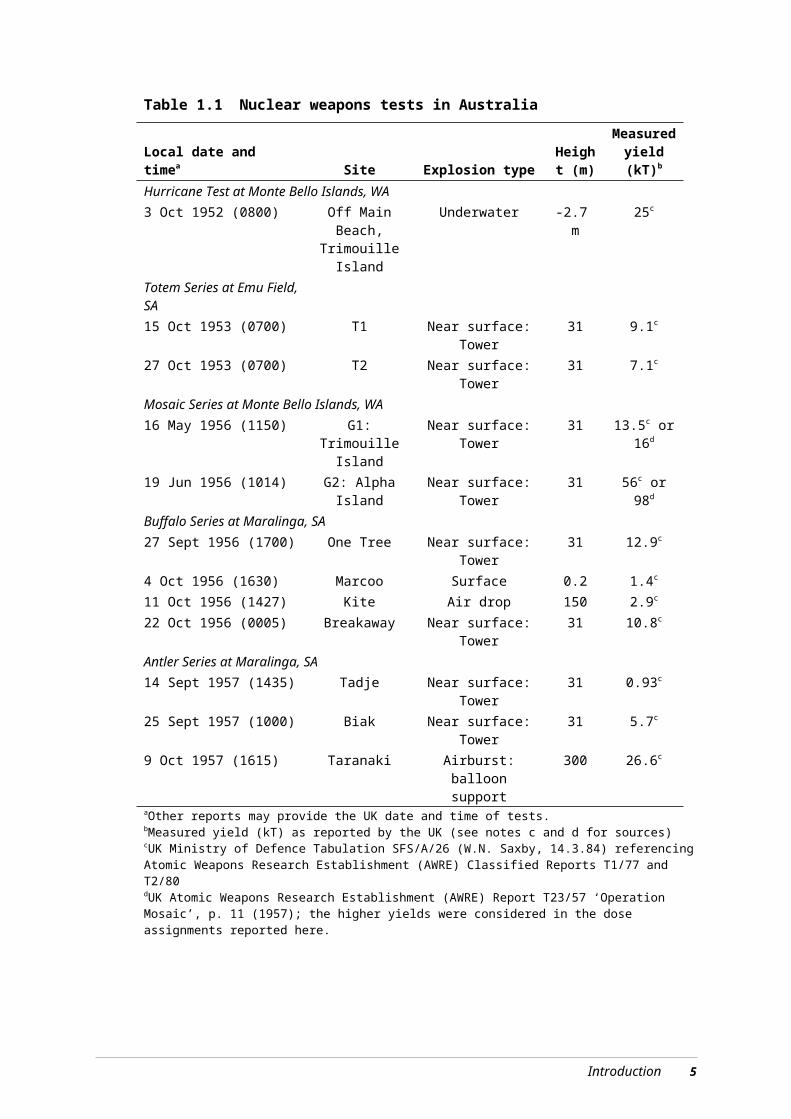
Stochastic effects
Ionising radiation is capable of not only killing cells, but also damaging cells by initiating changes in the DNA of the cell nucleus. If the damage is not repaired and the cell remains viable and able to reproduce, this event may initiate the development of a cancer. If the damaged cell is in the genetic line (egg, sperm or sperm-generating cell) then the damage may result in genetic disease in the offspring. This effect has been seen in animal studies, but there is only limited evidence from studies of humans. These effects — the initiation of cancer or genetic disease — are called stochastic effects.
The name ‘stochastic’ means that the effect is governed by probability. There is a certain probability that the cell damage will occur, a probability that it will not be repaired naturally, and a probability that a cancer, for example, will develop as a result. The effect is not ‘determined’ by the exposure as for deterministic effects. An increase in the magnitude of the dose will increase the probability of the effect, but not the severity of the effect. Stochastic effects do not generally become apparent for many years after exposure, and there is no way of distinguishing a particular cancer or genetic effect that might have been caused by radiation from one arising from other origins. There are, however, some forms of cancer that do not seem to be caused by radiation exposure.
The ICRP, based on all the available data, has estimated the probability of radiation-induced fatal cancer to be 5% per sievert (ICRP 1991). Stochastic effects, in particular cancer, have only been clearly demonstrated in humans following moderate or high exposures of the order of 0.1 Sv and above, and there is no direct evidence that these effects can arise at the significantly lower doses characteristic of present day occupational exposures. Nevertheless, the ICRP takes the precautionary approach that all exposures, no matter how low, may carry some risk of inducing stochastic effects. Thus, using the risk value of 5% per sievert of exposure, for a group of 2000 people, each exposed to 0.01 Sv, one cancer death due to the radiation exposure could be expected in addition to the approximately 600 deaths due to other causes.
A large study of exposure and health data on radiation workers has recently been completed, with results consistent with the ICRP risk values (Cardis et al 2005). Such a large sample (407 391 individuals, with 5 192 710 person years of exposure) with good exposure data is very difficult to get, so this is probably the best study of low-level radiation effects that will ever be done. The study conclusion states: ‘We have provided radiation risk estimates from the largest study of nuclear industry workers conducted so far. These estimates are higher than, but statistically compatible with, the current bases for radiation protection standards’.
Radiation exposure has been shown to cause an increase in genetic disease in animals. No similar increase has been demonstrated in human populations, even amongst the children of Japanese atomic bomb survivors, but it is presumed that it occurs. The overall risk of ‘severe hereditary disorders’ is estimated to be approximately 1% per sievert of exposure (ICRP 1991).
2.7 Radiation dose limits
In this section, the current radiation dose limits are discussed briefly. These limits were not in place at the time of the British nuclear tests; neither were the concepts behind them generally accepted. However, this background information is provided so that some comparison can be made between the dose estimates presented in Chapter 7 for the test
18 Australian participants in British nuclear tests in Australia — Vol 1: Dosimetry
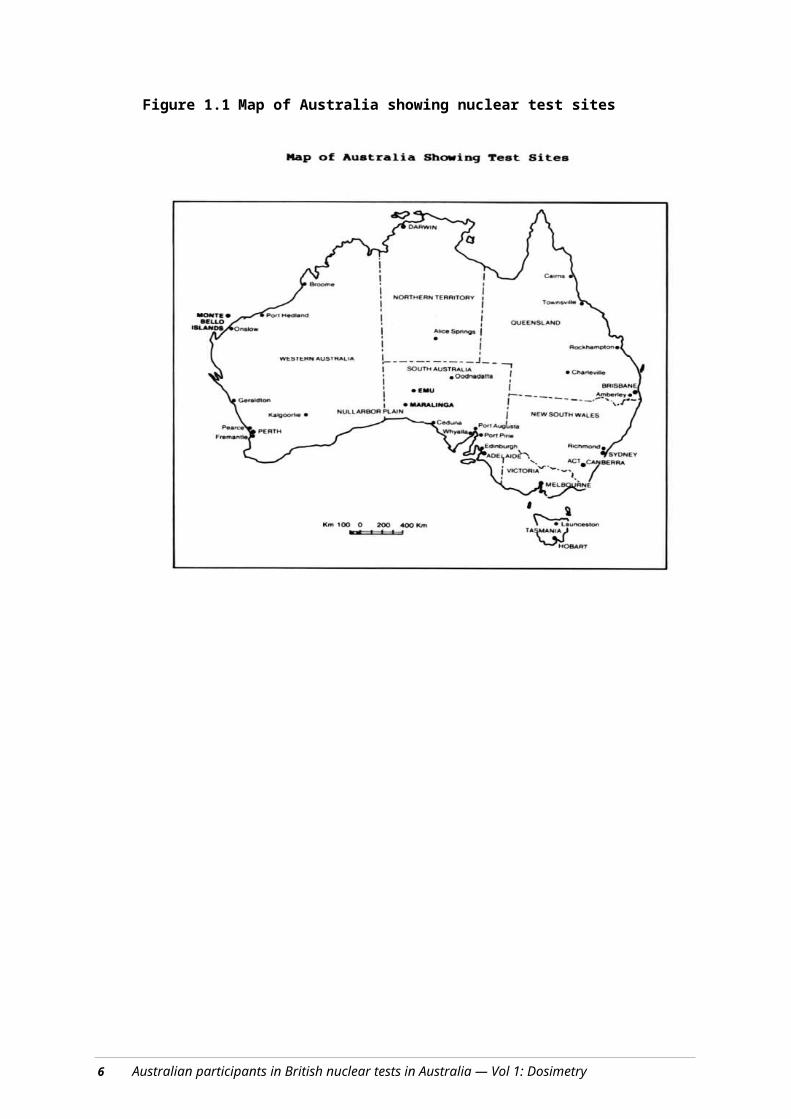
participants and current legislative standards for radiation exposure. Information on the standards applied at the tests is provided in Chapter 4.
The radiation dose limits used in Australia (ARPANSA 2002) are derived from the recommendations of the ICRP, most directly from ICRP publication No. 60, released in 1991 (ICRP 1991). This publication recommends a ‘system of dose limitation’, with three elements:
Justification — the radiation practice must produce sufficient benefit to offset the detriment arising from any radiation exposure. In the context of atomic weapons tests, this would imply that it was considered that the national security benefits of developing nuclear weapons outweighed the radiation risks to the participants, although it is perhaps unlikely that any such an analysis would be made formally.
Optimisation — radiation protection measures should be implemented until the cost of additional protection is not commensurate with the resulting improved protection (i.e. the cost in time, effort and money outweighs any additional improvements in radiation safety). This is often expressed as the ALARA principle — radiation doses should be As Low As Reasonably Achievable, with economic and social factors taken into account.
Limitation — individuals should not be exposed to radiation doses above specified dose limits. The currently recommended annual dose limit for workers is 20 mSv and for members of the general public is 1 mSv.
It should be recognised that this does not mean that it is automatically acceptable to expose workers to annual doses approaching 20 mSv. This would only be acceptable if it can be demonstrated that the cost of further radiation protection measures is not commensurate with the dose reduction achieved. In practice, in Australia there are few radiation-related occupations where workers receive more than a small fraction of the legislated limits.
It should be emphasised that in the era of the weapons tests, whilst some concepts of radiation protection had been developed, neither the current limits nor the concepts of justification or optimisation were fully developed. Moreover, facilities to implement best practices for radiation protection were not always available at the test sites.
2.8 References
A general text book on radiation protection, such as Martin A and Harbison SA (1987), An Introduction to Radiation Protection, Chapman and Hall, London, can be consulted for more information on some of the topics covered in this chapter.
ARPANSA (Australian Radiation Protection and Nuclear Safety Agency) (2002). Recommendations for limiting exposure to ionizing radiation. Radiation Protection Series No. 1, ARPANSA, Melbourne.
Cardis et al (2005). Risk of cancer after low doses of ionising radiation: retrospective cohort study in 15 countries. British Medical Journal 331:77.
ICRP (International Commission on Radiological Protection) (1991). ICRP Publication 60: 1990 Recommendations of the International Commission on Radiological Protection, 60, Pergammon Press, Oxford.
Ionising radiation — sources, effects and controls 19

20 Australian participants in British nuclear tests in Australia — Vol 1: Dosimetry
3 Radiat ion hazards associated with nuclear weapons test ing
Summary
This chapter describes the characteristics of atomic weapons and the ways that the British nuclear tests in Australia could have exposed people to ionising radiation.
The main sources of radiation exposure associated with nuclear weapons tests are:
the prompt flash of radiation at the moment of detonation
delayed exposure from radioactive materials formed or deposited near the site of the explosion
radioactive materials in the mushroom cloud that have fallen to earth (fallout).
Most of the radioactivity resulting from an atomic explosion decays quite quickly, but some remains for a very long time, most importantly plutonium left over from the explosive material.
The most important source of external exposure is from being in, or moving over, ground or water contaminated with radioactive material. Internal exposures can result from breathing in dust stirred up by working in contaminated areas, eating contaminated foodstuffs or drinking contaminated water.
As well as the major nuclear explosions, there were a large number of other experiments called minor trials. These continued for some years after the completion of the major test series. Some of them released large quantities of radioactive material to the environment.
3.1 Introduction
This chapter applies the information on radiation and radiation exposure pathways provided in Chapter 2 to the radiation exposure situations that might be experienced generally in the testing of nuclear weapons. These pathways include both prompt and delayed exposure, and the latter can be further subdivided into external and internal exposures.
3.2 Types of nuclear weapons
The most common basic design of an atom bomb is a hollow sphere of plutonium, surrounded by a shell of conventional chemical explosive, all contained in a steel casing. The nuclear explosion is initiated by detonating the conventional explosive so that the resulting shockwave compresses the plutonium into a small volume. An ‘initiator’ generates a burst of neutrons to ‘kick-start’ the nuclear chain reaction. The neutrons may be generated by a mixture of beryllium and radioactive polonium, or by an electronic device. In many designs, there is a massive ‘tamper’ between the explosive and the plutonium: this is usually of uranium, but other heavy metals can be used. The tamper
21

enhances the compression of the plutonium and also acts as a neutron reflector to reduce the loss of neutrons from the nuclear reaction. In addition, if the tamper is made of uranium, some of it will undergo fission and so contribute to the yield of the weapon.
The British exploded a range of nuclear weapons in Australia. Some were experimental devices, some were operational weapons and some tests were apparently part of a program to develop thermonuclear weapons. All were predominantly fission weapons, but at least one was ‘boosted’ by the addition of small amounts of deuterium (2H) and tritium (3H) or lithium (6Li) to increase the efficiency of the fission process. One test device (Tadje) contained large amounts, of the order of 1700 GBq,11 of the strong gamma emitter cobalt-60 (60Co), used as a diagnostic tool.
The minor trials included experiments aimed at improving the efficiency of the initiators, developing tampers and studying the compression of the fissile material by the use of conventional explosives.
3.3 Exposure pathways
This section outlines the ways in which Australians involved in the British nuclear weapons tests in Australia could have been exposed to radiation. Individual participants may have been exposed via several pathways for which the resulting doses are summed.
3.3.1 Pre-test
Prior to the explosion of an atomic device, components must be transported to the firing site, final assembly completed and the device positioned (e.g. hoisted onto a tower or attached to a balloon). Final ‘arming’ of the device, including removal of any safety devices from the weapon, may also be necessary. These operations may be rehearsed several times and repeated after aborted countdowns.
The radiation exposures from these operations on a standard nuclear weapon are expected to be quite small. The nuclear fuel (plutonium or uranium) is a very weak gamma emitter, and, after assembly, it is contained within a metal casing such that there would be minimal external gamma radiation exposure. However, for one test (Tadje) where 60Co was used, significant external exposures could have arisen if appropriate procedures and controls had not been used during the attachment of the cobalt sources to the bomb.
It is not anticipated that there would have been any internal radiation hazard from assembly of the weapons in the field.
3.3.2 Prompt exposure
Prompt exposure is from the immediate flash of radiation in the first minute after detonation. A nuclear explosion produces a burst of gamma rays and neutrons, which results in external exposure to those in the vicinity. For the type of nuclear weapons tested in Australia, the absorbed dose from neutrons is approximately a factor of one hundred smaller than that from the gamma rays. The dose falls rapidly with distance from the point of detonation, due to the combined effects of the inverse square law and absorption in the atmosphere. Figure 3.1 shows the absorbed dose as a function of distance for the
111 GBq = 1 gigabecquerel (109 Bq); decimal multiples are explained in Appendix 2.
22

weapons used in Japan, according to the Radiation Effects Research Foundation.12 This figure is indicative for weapons tested in Australia, which were of a similar size or smaller, with the exception of one Mosaic series bomb that was substantially larger. Note that the unit of dose used in the figure is the gray (Gy).13 (see Appendix 6 for further information on units).
Figure 3.1 Absorbed dose in air as a function of distance for the nuclear weapons used in Japan (Radiation Effects Research Foundation)
Figure 3.1 shows that for both Japanese bombs, the neutron doses were substantially smaller than the absorbed gamma doses. At a distance of 2500 m, the gamma doses were approximately 10–20 mGy (10–20 mSv for gamma rays). With the specific exception of the Indoctrinee Force at Operation Buffalo, Australian participants were at distances greater than 10 000 m for each explosion.
Gamma
Any people within a few kilometres of the bomb ground zero (GZ) would have received a prompt dose of gamma radiation at the moment of detonation. For the average test in Australia, within approximately 1.2 km of the explosion, the radiation doses would have been greater than 5 Sv. Doses of this magnitude are sufficient to produce the deterministic effects discussed in Chapter 2 — in particular, radiation sickness and/or death. However, unprotected people in this area would probably have also received severe injuries from thermal burns, blast and flying debris.
12Further information on observed health effects from the two Japanese nuclear bombs can be found at: http://www.rerf.or.jp/top/healthe.htm13The gray (Gy) measures the amount of energy absorbed by materials being irradiated. To assess any potential biological effect in people, the dose in Gy is multiplied by factors that allow for the radiosensitivity of the organs being irradiated, and the biological effectiveness of the radiation, deriving a potential radiation dose in sievert (Sv).
Radiation hazards associated with nuclear weapons testing 23

At 2.5 km, the dose is reduced to approximately 20 mGy (approx 20 mSv), and at a distance of 3.5 km, it is reduced to approximately 1 mGy (1 mSv) — that is, less than the annual natural radiation background. Beyond 5 km, it is effectively zero. Trenches, particularly those with overhead cover, or armoured vehicles provide significant shielding to people within them.
Neutron
The dose from neutrons emitted at the moment of detonation drops off more rapidly than that of gamma rays, and is already insignificant at 2 km. Again, trenches or armoured vehicles provide additional protection.
3.3.3 Delayed exposure sources
Radioactive material resulting from a nuclear explosion has the potential to produce radiation exposures for some time after the explosion. The three main types of radioactive material of concern are activation products, fission products and unconsumed nuclear fuel. In addition, uranium-238 (238U) was used as a tamper in the Australian nuclear tests and, in one test, 60Co was used as a diagnostic tool.
Activation products
Activation products result from neutrons, produced in the explosion, being absorbed by stable nonradioactive atoms in the ground, the bomb casing, any supporting tower and other test components, which then become radioactive. Explosions over or under the sea will result in activation products being formed from the sodium and chlorine in salt. Activation products are generally beta and gamma emitters. For weapons of the size tested in Australia, significant doses from activation of the ground, including target response items, are only expected within a kilometre or so of GZ.
Activation products have a wide range of half-lives, ranging from seconds to tens of years. The overall decay is rapid, at least over the first few days. If someone remained on the site indefinitely, 80% of their total dose from activation products in the soil would be received on the first day, a further 10% on days 2–5, and the final 10% over the remaining period of years.
With the exception of those activation products produced from the bomb casing and other material close enough to the weapon to be vaporised (considered as fallout; see Section 3.3.4), the activation products are fixed in place around GZ.
Fission products
Fission products are the radionuclides produced when atoms of the nuclear explosive (plutonium or uranium) split into two in the nuclear fission reaction. There are hundreds of different radionuclides produced in the fission process, with most of them being beta and gamma emitters. They are all created at the heart of the nuclear explosion. Most will rise with the mushroom cloud, from where they are dispersed as fallout, but some may be distributed around the detonation point by the immediate blast of the explosion. As with activation products, there is a wide range of half-lives involved, ranging from less than a second to millions of years. A general approximation to the overall radioactive decay is the ‘rule of seven’ — every seven-fold increase in time results in a 10-fold decrease in activity. Thus, after 7 hours the level of radioactivity would be approximately one-tenth
24 Australian participants in British nuclear tests in Australia — Vol 1: Dosimetry

of that at 1 hour. This is discussed further in Section 3.3.4. This rule of thumb has not been used in estimating radiation doses in the present report.
Unconsumed nuclear fuel
Nuclear explosions are never completely efficient, and 80% or more of the nuclear explosive (plutonium or uranium or both) may remain. These have very long half-lives of more than 1000 years. As with the fission products discussed above, this may be dispersed as a component of fallout, or explosively impacted around the explosion point.
Other components
The 60Co (used at Tadje only) and tamper material would be expected to behave and be distributed in a manner similar to other weapon materials. However, discrete particles of 60Co from the Tadje explosion were discovered in an explosively deposited plume.
Glazing
The thermal radiation from a near surface nuclear explosion is sufficiently intense to melt the surface soil, which then cools to form a glassy substance. This glazing can extend several hundred metres from GZ. Radioactive material deposited in this area before the glazing solidifies is incorporated into the matrix and is thus unavailable for inhalation or ingestion.
3.3.4 Fallout
Radioactive material from a nuclear explosion may rise high into the air before eventually falling to earth as fallout. Fallout may include fission products, activation products from the bomb casing and surrounding material, and residual plutonium and uranium not consumed in the explosion. The height to which the radioactive debris rises in the atmosphere depends largely on the size of the explosion: the bigger the bomb, the higher the debris rises, although this will be affected by prevailing atmospheric conditions. The subsequent dispersion depends on wind velocities at different levels of the atmosphere. The pattern of dispersion and deposition can be complex and may have unexpected features due to wind changes and temperature inversions at various heights. Rainfall can be important in ‘washing’ the radioactive material out of the atmosphere and onto the ground. In the short term, the contribution from fission products dominates the external dose rate.
The general pattern of local fallout from the Australian tests was measured by limited ground and air surveys immediately following the tests, and later by surveys in conjunction with cleanup activities.
The fallout radionuclides were initially vaporised in the explosion and subsequently condensed into solid particles. When a nuclear explosion takes place high in the air, such that the fireball does not touch the ground, there is little material to condense other than the bomb components, and the aerosol particles formed are thus very small. These will tend to remain aloft, be widely dispersed, and the resulting fallout will be relatively light and spread over a large area. In contrast, when an explosion takes place on or near the ground, the fireball touches the ground, large quantities of soil are sucked into the mushroom cloud and the condensing radionuclides attach themselves to soil particles. These particles will be relatively large and heavy and fall to earth more rapidly. This fallout is relatively localised and heavy.
Radiation hazards associated with nuclear weapons testing 25
In addition, different elements will condense at different temperatures as the fireball cools. Refractory elements that condense at higher temperatures (including plutonium) will condense earlier, when there are still large particles present, and so will generally fall out quickly near GZ. The more volatile elements like caesium will condense later when the fireball has cooled further to lower temperatures; by this time the larger particles will have already fallen out and the remaining fine particles will remain aloft for much longer and drift further from GZ. This process is called fractionation and results in a mix of radionuclides in the fallout that varies along the plume.
As noted above, fission products decay according to the ‘rule of seven’. Given that these dominate the fallout, this rule can be applied to fallout generally over the first few months. Thus, as a rule of thumb, starting 1 hour after detonation or production, the activity will fall to one-tenth after 7 hours, one hundredth after two days (or 49 hours) and one thousandth after a fortnight. Decay continues, but the rule rather overestimates the amount remaining beyond six months. However, measurements indicated that some fallout at Maralinga might have persisted longer than expected.
3.3.5 Delayed exposure pathways
The pattern of contamination following a nuclear explosion consists essentially of a roughly circular area of contamination around GZ, together with one or more fallout plumes. Ground zero and the fallout plumes contain activation products, fission products and unconsumed nuclear explosive in varying proportions, with most activation products found around GZ. This contamination can lead to delayed radiation exposure in the following ways.
External exposure
The principal source of delayed external radiation exposure is from gamma or beta radiation received whilst an individual is moving over contaminated areas. The contamination may arise from in situ activation products, from fallout containing fission products and from a usually small proportion of activation products from weapon debris. Unexploded plutonium and uranium are not significant gamma emitters and do not contribute to external exposure.
Factors determining the external dose include the level of contamination, the radionuclides present (determined from the age of the products; i.e. time since the explosion) and the time spent in the area. The metal of vehicles, particularly armoured vehicles, provides some shielding against external radiation for those within.
External exposure can also be received from a cloud of fission or activation products passing overhead, from flying in aircraft through the cloud or from sailing in ships passing through contaminated waters.
External exposure generally stops as soon as personnel leave the contaminated area. However, ships may take up contaminated water into their salt-water systems, where it may accumulate in bilges. Ships’ desalination systems may also accumulate fallout. This process may result in external radiation doses continuing after the ship has left the contaminated zone. Similarly, land vehicles and aircraft can become contaminated both inside and out, and their occupants may receive external doses even after leaving the contaminated zone or fallout cloud. Contaminated clothing can also contribute to external radiation exposures after personnel have left radioactive areas. In addition, vehicles and
26 Australian participants in British nuclear tests in Australia — Vol 1: Dosimetry

equipment from close to the detonation can become radioactive as a result of neutron activation. Decontamination procedures cannot readily remove neutron activation products; radiation levels from these are only reduced by radioactive decay.
Immediately following an explosion, in the most heavily contaminated areas, doses sufficient to cause deterministic effects could be accumulated after several hours’ exposure.
Internal exposure (inhalation)
Inhalation of dust containing activation or fission products, or the unconsumed nuclear explosive (uranium or plutonium), leads to the intake of radioactive material and consequent internal exposure. The material may be inhaled directly from the fallout cloud, or more commonly in the test situation as the result of resuspension14 of material already deposited. The magnitude of the intake would depend on the contamination level in the area, the amount of dust raised, the radionuclides present, the particle size and the exposure time. The contamination from fallout would be entirely on the surface, while in situ activation products would be distributed through the near-surface soil layer. Fallout is, therefore, likely to be resuspended and become the primary source of inhalation exposure.
Clothing and equipment can become impregnated with radioactive dust that could be released and inhaled at a later time.
Initially, the dose from the inhalation of fission and activation products is much greater than that from the unfissioned nuclear explosive. However, activation and fission products decay much more rapidly than the long half-life plutonium and uranium isotopes. Consequently the relative contribution to internal dose from unburnt fissile material increases with time. For plutonium, the contribution to inhaled dose is approximately equal to the external dose from fission products at approximately 9 to 12 months. Figure 6.3 (Chapter 6) shows how the relative contributions to internal radiation dose change with time. For uranium, the time interval is considerably longer, although the contribution to internal dose is considerably smaller than that from fission products and plutonium.
Inhalation of radionuclides can be reduced by use of respiratory protection. Where worn under field conditions, the types of respiratory protection in use at the time of the tests could possibly have reduced intakes by a factor of between two and five.
Internal exposure (ingestion)
Virtually all food consumed at the trials was imported from outside the test areas, and levels of contamination would have been very low, in line with those in a normal Australian diet. Fish were reportedly caught and consumed in the Monte Bello area, and it is possible that rabbits or kangaroos were caught and eaten at Emu or Maralinga. However, the quantities consumed would have been small and would not have caused significant exposures.
Drinking water may have become contaminated in two main ways: directly by fallout contamination of drinking water sources, or less directly by inefficient desalination of contaminated seawater. For example, during the Monte Bello tests, ships produced fresh
14The resuspension factor is important when estimating radiation doses arising from the inhalation of radioactive materials. This is discussed in some detail in Chapter 6.
Radiation hazards associated with nuclear weapons testing 27

water from distillation of seawater and on one occasion all ships were advised to shut down their distillation systems for at least 8 hours because of the levels of radioactive contamination detected.
Ingestion of radioactivity can also occur with hand-to-mouth transfer, particularly when eating, drinking or smoking, and from hands that have become contaminated whilst working in contaminated areas or with contaminated equipment. The use of contaminated drinking or eating utensils (usually contaminated by dust), or direct dust deposition on food during meals, can also contribute to exposure via ingestion. Although this reportedly occurred in several instances, the resulting intake would not have been significant when compared with other sources of exposure.
To estimate the prospective radiation exposure from either inhalation or ingestion of radioactive materials ‘dose conversion factors’ are used. The dose conversion factors used in this report are based on those published by the International Commission on Radiological Protection (ICRP).
Wound contamination
Radioactive material can enter the bloodstream via cuts or wounds. This is a minor source of potential exposure, except where concentrated radioactive materials are involved. Wound contamination is only possible in contaminated areas or due to the handling of contaminated objects or equipment. However, in such situations, external radiation or inhalation doses are expected to be the dominant sources of contamination.
3.3.6 Minor trials
There were a wide range of activities undertaken in conjunction with the nuclear weapons tests in Australia under the general name of minor trials. A number of radioactive materials were used, including plutonium, polonium and uranium. The most significant tests radiologically were the Vixen B trials. These simulated the accidental detonation of chemical explosives present in a bomb and spread large quantities of plutonium into the environment. Other trials included the burning of plutonium in air and explosive tests on uranium, plutonium and other samples.
The toxic element beryllium, used in some of the minor trials, is not radioactive and is outside the scope of this study.
The most significant exposure pathway was probably from the inhalation of dust, principally contaminated by plutonium and uranium. This would have included dust clouds generated by the actual trials and resuspended dust generated subsequently whilst working in areas contaminated by earlier trials. Without specific monitoring results, it is difficult to estimate the extent of the inhalation hazard.
28 Australian participants in British nuclear tests in Australia — Vol 1: Dosimetry

4 Radiat ion safety regulat ions and health physics procedures
Summary
This chapter describes the radiation safety regulations and procedures that were in place during the various test series in Australia.
At the time of the tests, it was known that exposure to high levels of radiation was harmful, and procedures for protecting participants from this harm were in place at all test series. Radiation safety regulations and designated radiation protection staff to implement the regulations were in place. The radiation safety requirements were generally in line with the standards of the day. No evidence was found that participants were deliberately exposed to radiation without appropriate protection measures being applied, although some of these measures would not meet present day standards.
The Dosimetry Subcommittee did not take the existence of safety regulations and procedures as a guarantee that they were always followed.
4.1 Introduction
The hazards arising from ionising radiation and an outline of the methods adopted to control or minimise those hazards are discussed in Chapter 2. To institute the appropriate protective procedures in any particular situation, it is necessary to have some understanding of the type and potential severity of the radiation hazard. This in turn requires the measurement of both ambient radiation fields and levels of surface, airborne and waterborne radioactive contamination. To ensure that health risks are minimised, radiation exposures received by people have to be assessed to determine if control procedures have been effective.
By the time the first British nuclear test took place at Monte Bello in 1952, a variety of instruments had been developed for measuring both radiation and radioactivity,15 each with strengths and weaknesses. Some minor improvements in health instrumentation took place during the period of major tests and minor trials; however, the fundamental techniques did not change. The monitoring instruments commonly used during the test programs are listed in Appendix 7.
This chapter outlines the various regulations developed to control and minimise radiation exposures.
A brief overview of each test series is given, and the relevant radiation safety recommendations or regulations are summarised, as are the radiation control procedures
15The measurement of radiation fields and the measurement of levels of contamination require different types of instruments; in health physics terminology, these are described as radiation monitors and contamination monitors, respectively. Radiation monitors are usually calibrated in mGy/h or Gy/h, contamination monitors in counts per s or per min. Under some circumstances, contamination monitors can be used to get a very approximate indication of radiation dose rates.
29
instituted. The involvement of Royal Australian Air Force (RAAF) air and ground crew are commented on separately, given the specific hazards to which they were exposed.
Chapter 2 provides a brief history of the genesis of radiation protection recommendations and standards.
4.2 Radiation safety recommendations/regulations
To ensure that levels of acceptable radiation exposure are not exceeded, there has to be some form of control, either in the form of recommendations or, preferably, regulations, coupled with a supervisory program to ensure that they are implemented. The safety program normally includes teams of people with training in radiation control procedures, who are supplied with the equipment and authority needed to enable them to minimise radiological hazards. The generic title given to this radiological management is health physics and the practitioners are called health physicists.
For each of the major trials series, recommendations (later regulations) governing radiation safety were prepared. The UK Trials Directorate interpreted international recommendations as considered appropriate for the particular conditions of nuclear weapons tests.
The radiological control recommendations and their implementation changed as experience was gained during the tests and as international standards were refined. The limits were also applied to minor trials once they started.
In 1951, the year before the first British nuclear test in Australia, the International Commission on Radiological Protection (ICRP) issued its first formal set of recommendations (in summary):
For whole body exposure to external radiation:
1. X- or gamma radiation of energy below 3 MeV (million electron volts) (over an indefinite period): 0.5 R (at the surface of the body) in any one week (5 mSv/w).
2. High-energy beta radiation: energy absorption equivalent to 1.5 R of energetic gamma rays to the basal layer of the epidermis in any one week (approximately 15 mSv/w).
3. In the case of exposure of the hands and forearms: 1.5 R in any one week (approximately 15 mSv/w) or its energy equivalent, at the basal layer of the epidermis.
4. For any critical tissue (except the skin), for example, the blood-forming organs, assumed to lie at a depth of 5 cm: 0.3 R (3 mSv) in any one week.
These limits were referred to as ‘tolerance doses’, although by the end of the 1950s this inappropriate term had been removed from the ICRP recommendations.
The ICRP also introduced a limitation on internal radiation. A quantity called the maximum permissible body burden (mpbb) was introduced. The implication was that a person with 1 mpbb of a particular radionuclide in their body would receive a radiation dose equivalent to the then current external radiation dose limit.
30

4.2.1 Operation Hurricane (1952)
Overview
This operation consisted of one nuclear explosion in a Royal Navy vessel, HMS Plym, moored adjacent to Main Beach, Trimouille Island, part of the Monte Bello Archipelago off the northwest coast of Western Australia.
The overall general impression from the documents examined by the Dosimetry Subcommittee is that the UK Trials Directorate took appropriate measures to ensure radiation safety for the trials. Although the various radiation and contamination limits adopted were higher than currently considered acceptable, they were in line with the standards of the day. From the evidence within the documents, there does not appear to have been a deliberate program of exposing people to radioactive weapons debris without the then-accepted protection measures being adopted. Where post-explosion entry into potentially hazardous areas was necessary for sample collection, it appears to have been carried out principally by Atomic Weapons Research Establishment (AWRE) and Admiralty Research Laboratory scientific staff.
Australian participation
Australians were involved in a number of major tasks during Operation Hurricane:
ferrying UK scientists to and from the islands
patrolling the perimeter of the exclusion zone
providing general logistical support
making aerial measurements of atmospheric contamination
recovering contaminated mooring buoys and a contaminated landing craft.
In addition, five weeks after the explosion, an Australian Joint Services Training Unit (JSTU) used a contaminated location on Trimouille Island for training in radiation and contamination monitoring. These particular exercises gave rise to the highest radiation exposures for Australian personnel involved in Operation Hurricane.
Radiation safety recommendations
During the planning stage for Operation Hurricane, the Commander of the UK Naval Task Force, Admiral Torlesse, sought advice from the Trials Scientific Director, Dr Penney. Torlesse wrote: ‘Radiological safety must be one of the chief concerns of the Naval Commander but, equally evidently, some degree of risk must be run by some people if we are to achieve the full purpose of the trial’. Penney in turn obtained advice from, amongst others, the UK Medical Research Council.
After various revisions, Penney submitted a set of recommendations in July 1952 to the relevant British Ministries. After some minor changes, they were approved and forwarded to the Task Force Commander. They read in part:
Three dosage levels will be applied under various conditions, viz:
1) Normal Working Rate
Radiation safety regulations and health physics procedures 31
An intermittent or continuous dosage up to 0.3 rep (nearest modern equivalent 3 mSv)16 per day of which the gamma ray component is not to exceed 0.1 R per day (1 mSv/d).
This is the normal working limit that will be applied generally and it is estimated that it will be possible to carry out the greater part of the operation under these conditions.
2) Lower Integrated Dose
The integrated dose, received in one or a few exposures, of up to 15 rep (150 mSv) of which the gamma ray component is not to exceed 3 R (30 mSv).
This dose will be applied only with the express permission of the Radiation Safety Officer, which will be given only where he regards it as necessary for the smooth running of the operation. Except as provided for under (3) below personnel who have received this dose will not be subjected to further exposure during the remainder of the operation.
3) Higher Integrated Dose
An integrated dose of up to 50 rep (500 mSv) of which the gamma ray component is not to exceed 10 R (100 mSv).
This dose will only be applied in cases of extreme urgency in order to recover vital records that might otherwise be lost, and will require the express permission of the Commander of the Operation who will have expert medical and radiological advice at hand. Personnel receiving this dose will not be subjected to further exposure for a minimum period of 12 months…
The effects of beta and gamma radiations were to be considered as additive and as whole-body irradiation.
It is interesting to note that considerable concern was expressed regarding external exposures to beta radiation, whereas current radiation safety practice places much greater emphasis on control of external gamma and X-ray exposures.
Internal exposure
Penney also wrote:
Apart from accidental injuries the problem of internal radiation will not arise, since gas-masks will be worn for all operations which involve exposure to any airborne hazard. They will be worn invariably in the first instance until such time as measurements may prove that their general use is unnecessary.
The recommendations required that personal ionisation chambers (quartz fibre electroscopes) and film badges were to be worn by all personnel entering the radiation area, so that individual exposures would be recorded. Where it was necessary to subject the hands to high exposure, wrist films were to be worn. The maximum permissible exposure to the hands was set at 1.5 R (15 mSv) or its energy equivalent per week. It was stated that: ‘Radiation workers for whom regular exposure records are maintained elsewhere will have their Operation Hurricane exposure entered subsequently in their permanent records’.
16The relationship between the rep and sievert is only approximate.
32 Australian participants in British nuclear tests in Australia — Vol 1: Dosimetry
The recommendations also stated:
If possible, a proportion of those exposed should wear more than one monitoring film, on different parts of the body e.g. Chest (standard), lower leg, cuff or wrist, and lower abdomen. This comparison of recorded doses would be of value.
Any officer who is likely to be subject to any of these levels should undergo a pre-operational medical examination and no person would be allowed to accept the radiation exposure until the Medical Officer has approved him as fit for such work. In the medical examination there should be, if possible, three blood counts done on any officer whose duties are likely to involve exposure to the higher dosage rates.
Health physics procedures
Following detonation, access to and egress from the contaminated areas were via HMS Tracker, the designated ‘Health Ship’. On board were radiation and contamination measuring instruments of various types and a health control section. There were facilities for correctly dressing men going into potentially contaminated areas and for monitoring them on their return. There were showering facilities for the decontamination of contaminated personnel.
HMS Tracker was stationed in the Parting Pool south of Trimouille Island when acting as the health control point, but returned to ‘clear water’ overnight.
Royal Australian Air Force (RAAF)
The most notable exception to the overall control of radiation exposures was the exposure of RAAF personnel, aircrew and ground staff, to both an external and an internal hazard, during sampling of the radioactive cloud using unpressurised aircraft, and subsequent decontamination of the aircraft. No radiation protection procedures were put in place, largely because Dr Marley, Head of the Health Physics Division at the UK Atomic Energy Research Establishment (Harwell) had expressed the view that ‘the radioactive hazard to aircrews flying through this cloud is negligible and there is no fear of the aircraft becoming contaminated’. These events have been commented on in both the Symonds’ History (Symonds 1985) and Royal Commission report (Commonwealth of Australia 1985).
4.2.2 Operation Totem (1953)
Overview
The two Totem tests were the first on the Australian mainland, so some thought was given to the potential exposure of members of the Australian population. As with Operation Hurricane, Totem was primarily a British military and scientific program, with limited Australian involvement.
Australian participation
Australians were involved in several tasks:
assisting with radiation monitoring and decontamination at the Health Control Point
cloud sampling
aircraft decontamination
Radiation safety regulations and health physics procedures 33

meteorological forecasting
police and security duties
senior official and Service Officer inspection of target response items after the first explosion of Totem 1.
Planning
In the official Totem Operations Report, it was noted: ‘In a trial so hurriedly prepared as was Totem and planned necessarily from the technical on the one hand, and engineering and logistic aspects on the other hand by different groups 12 000 miles apart, it must be clear that full mutual understanding was next to impossible’ (Cooper 1954). Nevertheless, considerable praise was given to the Australian efforts in developing the camp and test sites.
Radiation safety recommendations
There were no changes in international radiation protection standards between the Hurricane test in October 1952 and the issuance of the six-part Totem Radiological Safety Orders in October 1953. Nor were there any changes in the views of the UK Medical Research Council. Accordingly, the previous exposure limits, developed for Operation Hurricane, were continued.
Substantially the same radiological control procedures instituted at Hurricane were applied, with two exceptions:
Operation Hotbox, wherein a specially prepared Canberra aircraft was flown by Royal Air Force (RAF) personnel directly through the fallout cloud within 10 minutes of detonation
initial decontamination of RAAF aircraft that was carried out at Woomera and Richmond by RAAF ground staff with few, if any, radiation protection procedures in place.17
However, some additions were made to the Trial Orders initially developed for Hurricane. These related principally to external and internal contamination. In addition, some consideration was given to the potential exposure of the mainland Australian population.
In the Totem Radiological Safety Orders: Part II Radiation Exposure Levels, the Scientific Superintendent CA Adams wrote, somewhat enigmatically, that:
4. The inhalation and ingestion of radioactive materials must not exceed the levels permitted at the Establishment [presumably AWRE Aldermaston]. For fission products the maximum permissible level is time dependent. The relationship is well known and will be applied.
5. … As a general guide in order to avoid unnecessary attrition, respirators will only be worn prior to dust sampling if the dose rate exceeds 25 mR/h (0.25 mGy/h) or there is visible airborne dust.
17This was an unnecessary occurrence because during Operation Hurricane, Australian aircraft became contaminated during cloud sampling. Given the presence of British health physicists, the initial failure to establish aircraft decontamination procedures indicates a significant lack of consultation between the British and Australian groups.
34 Australian participants in British nuclear tests in Australia — Vol 1: Dosimetry

6. Skin contamination when it occurs will be removed by washing and special [unspecified] treatment, if necessary, until the residual activity is below the normal laboratory levels at the Establishment. These are:
Beta/Gamma activity 1 × 10⁻⁵c/cm2 (0.37 Bq/cm2)Alpha activity 5 × 10⁻⁷c/cm2 (1.8 × 10⁻² Bq/cm2)
Both limits to apply to areas not greater than 300 cm2
The measurement of the intake of radioactive materials is not an easy task, particularly under the type of conditions prevailing at a nuclear test site, and no measurements of radioactivity in urine or faeces were made to confirm that the requirements of paragraph 4 were being implemented.
In the Radiological Safety Orders: Part III Protection of Personnel, the first mentions of contamination control procedures appear.
1. Smoking, eating and drinking in a contaminated area is forbidden.
Personal radiation measurement requirements were set out as follows:
4. There will be two separate kinds of issue of film badges issued to personnel. These are:
(a) All personnel at the site will be issued with and wear at all times a film badge after the beginning of the Standby period.
(b) All personnel working in a contaminated area will wear a fresh film badge on each occasion. The issue under (a) above will be worn at all other times.
5. Quartz fibre dosimeters will be carried by all personnel working in a contaminated area.
6. Detailed records will be kept for individual exposures.
Two further paragraphs confirmed the ‘complete and over-riding’ authority of the Health Escorts in terms of control of radiation exposures.
The urgency provisions
An important part of the Totem series was the target-response study, which examined the effect of a nuclear blast on a wide variety of materials placed near ground zero (GZ). Other work included ground surveys of the activity near GZ. Thus, entry into the forward area was required from F + 30 min (30 min after firing) to obtain scientific data and equipment. Three urgency provisions were in place to control the doses from the recovery work:
Urgency 1: Delay would result in serious deterioration of the record or equipment, and exposure to the Higher Integrated Dose is considered justifiable.
Urgency 2: Similar to 1, but exposure up to the limit of the lower integrated dose only is justified.
Urgency 3: Those in which no time factor is involved and which can be left until the dosage likely to be received does not exceed or not greatly exceed the normal working rate.
Radiation safety regulations and health physics procedures 35
Criteria for safe firing
Because the Totem series was on the Australian mainland, the firing of the nuclear devices was dependent on weather conditions, such that the Australian public in inhabited areas outside the range would not be exposed to levels of fallout likely to cause harm.
Two risk levels were defined, and maximum fallout contamination levels, at differing times after detonation, were derived for each. The levels were:
‘zero risk’, such that the quantity of fission products would cause no measurable effect on the body
‘slight risk’, such that the quantity of fission products may cause some slight temporary sickness to a small number of people who have a low threshold sensitivity to radiation.
Nine potential exposure pathways were considered, including external radiation from fission product contamination on the ground, ingestion of contaminated food and water, inhalation of contaminated air and injection of fission products via cuts and abrasions.
Health physics procedures
Operation Hurricane had provided practical field experience in the measurement and control of radiological hazards. The UK Radiation Protection Group had confidence that the operational procedures that had been developed would, with a few exceptions such as those based on the ‘urgency provisions’, ensure that at Operation Totem the ‘tolerance’ levels were not exceeded.
Health physics control was based at Emu Village and entries into and departures from the Forward Area were through a Health Control facility. This contained a ‘clean’ section where the appropriate protective clothing was donned before entering the Forward Area. On return, participants entered the ‘dirty’ section, which was equipped with contamination monitoring equipment and specialised undressing and showering facilities. When free of radioactive contamination, people exited through the clean area.
Those entering the Forward Area were informed of the radiological conditions prevailing there, issued with protective clothing and provided with personal monitoring devices, including a quartz fibre dosimeter. Personnel receiving more than the specified dose limits were withdrawn from further radiation work. On return to the Health Control point, personnel, their papers and any recovered equipment were decontaminated in a unit operated by 10 Australian servicemen.
Three Land Rovers were used for movement in the Forward Areas. These were parked separately from other vehicles. There does not appear to have been any attempt to decontaminate them before they were later used by Australian Peace Officers — very poor radiation protection practice.
Clothing with low levels of contamination was transported to Woomera for laundering.
RAAF
With the specific exception of preparations for Operation Hotbox, the RAAF was completely unprepared to deal with the contamination of its aircraft and personnel that occurred during Totem 1. Health physics control procedures were non-existent during the
36 Australian participants in British nuclear tests in Australia — Vol 1: Dosimetry

initial decontamination of the aircraft that had been used in the sampling of the radioactive cloud.
The RAF Canberra aircraft, which was used to fly directly through the cloud, was decontaminated at Woomera by six RAAF ground crew. They wore special overalls, overshoes and masks and had received some previous briefing from the Radiation Hazards Group at Emu (RAAF Official Report 1953, R137.001).
It was not anticipated that Australian aircraft would be contaminated and they were initially washed down by personnel without protective clothing or monitoring equipment. This was the outcome of an apparent breakdown in communication when AWRE and the RAF failed to adequately advise the RAAF that there were known to be radiation hazards to both air and ground crew from contaminated aircraft. Consequently, the RAAF made little initial provision to decontaminate their aeroplanes.
The radiological consequences of this lack of communication are discussed in Chapter 7, Section 7.8.
It is to the credit of the RAAF that they responded well to coping with an unexpected hazard. Following advice from AWRE scientific staff, an RAF Radiological Advisor and the crew of the two US B29s,18 who included officers who were well versed in cloud sampling and decontamination procedures, the RAAF established effective contamination control procedures starting with Totem 2.
The radiation control measures at Woomera, established five days after the Totem 1 detonation, were (Austin 1955):
restricting access to aircraft
issuing protective clothing to personnel working outside the aircraft (including head covering, and monitoring) and forbidding personnel to eat, drink or smoke until free of any contamination; if clothing was contaminated above a pre-determined level (15 cps on a 1021 monitor: see Appendix 7), the clothing was sent for laundering
disallowing personnel working inside the aircraft to eat, drink or smoke until being monitored after leaving the aircraft; these personnel were not issued with protective clothing
segregating the equipment from the aircraft until checked and, if necessary, decontaminating this equipment.
Similar measures were also put in place at the RAAF Richmond Base.
The experience gained during the Totem weapons trials contributed to the effectiveness of the permanent decontamination centre opened at RAAF Amberley in 1956 and used during the later test series. It also resulted in the belated production of Air Board Order No. A125 — Radiological Safety in Relation to the Results of Atomic Explosions, dated 8 November 1954, as well as investigations into the health of Lincoln aircrews involved in cloud sampling.
18Two US Air Force B29s based at Richmond carried out long-range cloud sampling after the Totem firings. The crews had received experience at the US Nevada test site and had some understanding of contamination control procedures. They were present by agreement with the British authorities. They were ostensibly in attendance for meteorological duties, but were equipped with sophisticated radiation monitoring equipment and the crews wore both dosimeters and film badges.
Radiation safety regulations and health physics procedures 37

Minor trials
The first five of what were designated ‘minor trials’ were carried out at Emu in 1953. These were called ‘Kittens’ and were tests of neutron sources used to initiate the nuclear chain reaction.
By the end of the minor trials, later called the Maralinga Experimental Program, nearly 600 tests of various types had been conducted, including 99 Kittens. Almost all of this experimentation took place at Maralinga, and continued until 1963, five years after the last major detonation. The radiological consequences of the minor trials are discussed in Section 7.7 of this report.
4.2.3 Operation Mosaic (1956)
Overview
This operation consisted of two explosions at separate sites on the Monte Bello Islands. They were expected to produce greater explosive yield than the Hurricane and Totem explosions. The UK authorities formed the view that test results were needed before the permanent testing ground at Maralinga would become available, and that the Australian Government would not approve the testing of such relatively high-yield weapons on the mainland.
As with the two previous programs, UK personnel exercised strict management of access to the Forward Areas. Because of the relatively limited involvement of Australian personnel, overall radiation exposures of Australian participants were less than in later series.
From a radiation safety perspective, Operation Mosaic is perhaps most notable for the introduction of Radiation Safety Regulations providing more authority to radiation control procedures than the recommendations produced for previous tests.
With the formation of the Australian Atomic Weapons Tests Safety Committee (AWTSC) in May 1955, there was the first opportunity for some Australian control of firing conditions as there would be a potential effect on the general public outside the test site boundaries.
Australian participation
As with Operation Hurricane, RAN ships provided logistical and other support to the Royal Navy in what was primarily a UK military exercise. An RAAF Canberra aircrew carried out cloud sampling in an RAF Canberra aircraft during both detonations. RAAF ground crew were involved in the decontamination of RAF Canberra aircraft at RAAF Amberley, where an aircraft decontamination facility had been constructed. There was also some minor involvement in re-entry and recovery tasks.
Planning
Both the Australian and UK authorities understood that the dates proposed for the tests in April and May were far from ideal. At that time of the year, for a considerable percentage of the time, prevailing winds would direct the fallout over the mainland. It was accepted that there might be no tests at all if weather conditions were likely to compromise radiological safety on the islands and the mainland. Consequently, considerable effort
38 Australian participants in British nuclear tests in Australia — Vol 1: Dosimetry

was put into collecting suitable meteorological data, and LJ Dwyer, Director of the Australian Bureau of Meteorology, was coopted to the AWTSC where he played a key role.
Some thought went into monitoring programs to assess possible doses to the Australian public. A program of air sampling at ground level was developed and some ‘sticky paper’ samplers, developed at the Nevada test site in the USA, were obtained for local use.
Regulations
Three considerations led AWRE Health Physics Group to develop a set of detailed regulations, the Radiological Safety Regulations, Maralinga Range, as follows:
1. In 1954, the ICRP had issued a formal set of recommendations that, inter alia, reduced the occupational radiation exposure limit from 0.5 R/week to 0.3 rem/week19 (3 mSv/week).
2. The planned series of trials on the Australian mainland would involve large numbers of military personnel, both British and Australian, as well as some civilians.
3. Sufficient experience had been gained in the control of radiological hazards at both Hurricane and Totem that it could now be formalised in comprehensive regulations.
Although initially drafted for the forthcoming Buffalo series, the Maralinga Range Regulations RSRM/56(5) were adopted for both the Mosaic tests and the later Antler program.
The important sections are quoted extensively below due to their key role in establishing radiation protection and control for the remainder of the major and minor trials.
1 INTRODUCTION
1.1 Radiation that may be encountered on the range may be particles, particles, rays and neutrons. Under properly controlled conditions work involving exposure to these radiations can be carried on in perfect safety.
Excessive exposure however may result in serious damage to the human body.
The danger is particularly insidious because the effects are not immediately felt and damage may only become apparent after a period of years. Damage may arise not only from external exposure but from irradiation of internal organs as a result of ingestion, inhalation, injection into the bloodstream through cuts and abrasions, or even by absorption through an intact skin.
1.2 The object of these regulations is to ensure complete protection both of workers on the range and of the general public, whilst imposing the minimum interference with work.
1.3 In order to assist in the implementation and interpretation of these and other Radiation Safety regulations a Health Physics Advisor to the Trials Superintendent,
19By 1954, the International Commission on Radiological Units had introduced two new units; one (rad) to measure the energy deposited in tissue and another (rem) to allow for the different radiosensitivities of differing body organs and the relative radiobiological effectiveness of different radiations. See Appendix 2 for a fuller explanation.
Radiation safety regulations and health physics procedures 39

nominated by SH/PR AWRE will be appointed for each trial. In the period between trials a Health Physics Representative appointed by the Australian Authorities will be present at the Range.
2. MAXIMUM PERMISSIBLE LEVELS
2.1.1.1 The maximum permissible levels of the various radiations and radioactive substances are based on the recommendations of the International Commission on Radiological Protection and of the International Commission on Radiological Units, and have been approved by the Minister of Supply and other Authorities concerned. These are the levels to be used throughout the Range.
2.1.1.2 It is emphasized that these are maxima and every endeavour must be made to keep the average exposure as low as possible.
2.2 EXTERNAL RADIATIONS
For external radiation the maximum permissible levels will be:
(i) and Radiation (Beta and Gamma)
(a) A normal working rate of 0.6 rep/week (6 mGy/WEEK) of which the radiation component must not exceed 0.3 R/week (3 mGy/WEEK).
(b) A lower integrated dose of 15 rep (150 Gy) of which the radiation component must not exceed 3 R (30 mGy).
No further exposure will be permitted during the operation except as under (c) below. Authority to work at this level will be given by the Health Physics Advisor.
(c) A Higher Integrated Dose of 50 rep (500 mGy) of which the radiation component must not exceed 10 R (100 mGy). Authority to work at this level will be given by the Trials Superintendent after consultation with the Health Physics Advisor and Medical Officer.
(d) A special Higher Integrated Dose of up to 75 rep (750 mGy) of which the radiation component must not exceed 25 R (250 mGy). Permission is required as for a Higher Integrated Dose and in addition for Australian personnel, agreement by the AWTSC. [No further exposure was permitted during a period of three years.]
(ii) Neutron radiation
The dose to the tissue 2 cm below the skin surface must be less than 30 millirads per week (0.3 mGy/week).
[A table of the neutron fluxes that equated to these dose limits was provided as an attachment to the Regulations.]
(iv) radiation (alpha)
particles present no external hazard as they are unable to penetrate the outer layers of undamaged skin.
2.3 INTERNAL RADIATIONS
2.3.1 The maximum permissible levels will be:–
(a) For individual isotopes, or mixtures of isotopes except weapon debris
40 Australian participants in British nuclear tests in Australia — Vol 1: Dosimetry
The concentrations shall be those laid down in Appendix 1 for the materials concerned.
(b) For weapon debris
(i) In water 10-7c/cc (microcuries/cc) (3.7 × 10⁻³ Bq/cm3) (becquerel/cc).
(ii) In air
(a) emitters
The concentration shall be that laid down in Appendix 1 (of the Range orders) for the most hazardous material likely to be found
(b) – emitters
The concentrations shall be those given by the expression 3.0 × 10⁶/T c/cc (0.11/T) Bq/cm3.
Where T is the time after the explosion in hours for times between T = 0.25 and T = 5040 (210 days).
For times after 210 days the value given for Sr90 shall be used, namely 6 × 10⁻¹⁰ c/cc (2.2 × 10⁻⁵ Bq/cm3).
The maximum permissible levels applicable to inhalation hazards are based on a regular exposure of 56 hours/week. If these hours are not applicable the levels should be modified proportionately.
2.4 CONTAMINATION LEVELS
Radioactive contamination can be fixed or loose.
2.4.2 The maximum permissible levels of fixed surface contamination will be as follows:
Permissible contamination level Cia/cm2 Bq/cm2
Beta–Gamma () contamination6000 dpmb on both sides of one hand 1 × 10⁻⁵ 0.37400 dpm/cm2 on clothing, benches equipment etc 2 × 10⁻⁴ 7.4400 dpm/cm2 in fume cupboards 2 × 10⁻⁴ 7.4Alpha () contamination600 dpm/on both sides of one hand 10-6 3.7 × 10⁻²
20 dpm/cm2 on clothing, benches equipment etc 10-5 0.37400 dpm/cm2 in fume cupboards 2 × 10⁻⁴ 7.4aCi replaced c as the symbol for curie, although both continued to be used.bdpm = disintegrations per minute; the actual count rate would depend on the sensitivity and geometry of the monitoring instrument used.
Radiation safety regulations and health physics procedures 41

2.4.3 The maximum permissible levels for loose contamination will be:
(–) 20 dpm/‘smear’20 (6 × 10⁻⁸ Ci/cm2) [2.2 × 10⁻³ Bq/cm2]
() 5 dpm/‘smear’ (1.5 × 10⁻⁸ Ci/cm2) [5 × 10⁻⁴ Bq/cm2]
3 CLASSIFICATION OF AREAS
3.1 All parts of the Range will be classified according to the nature of the work which may be done in that particular part.
3.2 The system of classification and nomenclature which will be used is as follows:–
3.2.1 NON-ACTIVE Areas
A NON-ACTIVE area is one in which the maximum radiation levels must be less than 1/10 of those laid down in paragraph 2 for activity and where there is no detectable loose activity. No special radiation precautions will be necessary.
3.2.2 ACTIVE Areas
Those in which there may be some radiation risk and where precautions appropriate to the degree of risk must be taken. There will be three categories:
(a) BLUE Area — Risk of penetrating radiation but not of inhalation, ingestion or injection. No special clothing.
(b) RED Area — Risk of penetrating radiation and of slight inhalation, ingestion, and injection. Protective clothing will be worn in accordance with Health Physics recommendations for the particular area.
(c) YELLOW Area — Risk of a serious inhalation, ingestion, injection or penetrating radiation hazard. Fully protective clothing must be worn.
3.2.3 The classification of an Area will be laid down by the Health Physics Advisor who must be informed prior to any proposed change in the work which might affect the classification. The Health Physics Advisor will review the classifications periodically.
3.2.4 Signs showing the classification and having a patch of the appropriate colour will be displayed at all entrances to any ACTIVE area.
All areas not classified in this way will be NON-ACTIVE areas and these will not have any special marking.
3.3.1 No person will be allowed to enter RED or BLUE areas without permission of the Scientist, or other Officer, in charge of the Area concerned. No person will be allowed to enter a YELLOW Area without permission of the Health Control Officer in charge.
When it is necessary to carry out any building, engineering or other maintenance work in any ACTIVE Area, a Permit to Work Certificate must first be raised through the trials H.O., who will consult the Health Physics Advisor, or Representative, where necessary.
20‘Smear’ is the term used for the check made for loose radioactive contamination. By wiping a measured area suspected of being contaminated (preferably with a damp filter paper) and checking the paper with a contamination monitor, an indication of the level of removable contamination can be obtained.
42 Australian participants in British nuclear tests in Australia — Vol 1: Dosimetry
4. FILM BADGES
All personnel will wear a Personal Monitoring Film at all times.
5. PROTECTIVE CLOTHING
5.1 (a) All radiation protective clothing will be white, and will be distinguished by red epaulettes or a red triangle as appropriate.
(b) The wearing of the approved protective clothing with film badges and dosimeters as specified in the appropriate parts of the regulations is compulsory.
(c) To assist the rigid enforcement of these rules under no circumstances will radiation protective clothing be issued for other purposes.
5.2 Degree of Protection
(a) Workers in BLUE areas — No special protective clothing necessary.
(b) Workers in RED areas — approved Lab. Coats or overalls, shoes or overshoes. (White rubber boots were supplied later) The above is general for all RED Areas but in certain special cases additional clothing will be specified by the Health Physics Advisor. When worn in ACTIVE areas Lab. Coats and overalls must be kept fastened at all times.
[The Health Physics Advisor was only given authority to increase the level of protective clothing to be worn, not decrease it on his own initiative.]
(c) Workers in YELLOW areas — complete changes of all clothing into the fully protective items provided.
12 STORAGE AND USE OF PERSONAL EFFECTS
Eating, smoking, drinking and the storing of food, drink and tobacco anywhere in ACTIVE areas, other than BLUE areas is forbidden.
The regulations continued with sections on:
laundering and disposal of protective clothing
use, storage and transit of radioactive materials
monitoring of equipment, active areas, and active waste
medical surveillance
accidents and first aid
the responsibilities of individuals such as an Officer in Charge of a location, Health Physics Advisor, Trials Superintendent, and the Australian Health Physics Representative (AHPR) during the inter-trial period.
In an appendix, formulae were given for determining maximum permissible concentrations (mpc) in air of mixtures of radionuclides and weapon debris at differing times after detonation.
Radiation safety regulations and health physics procedures 43
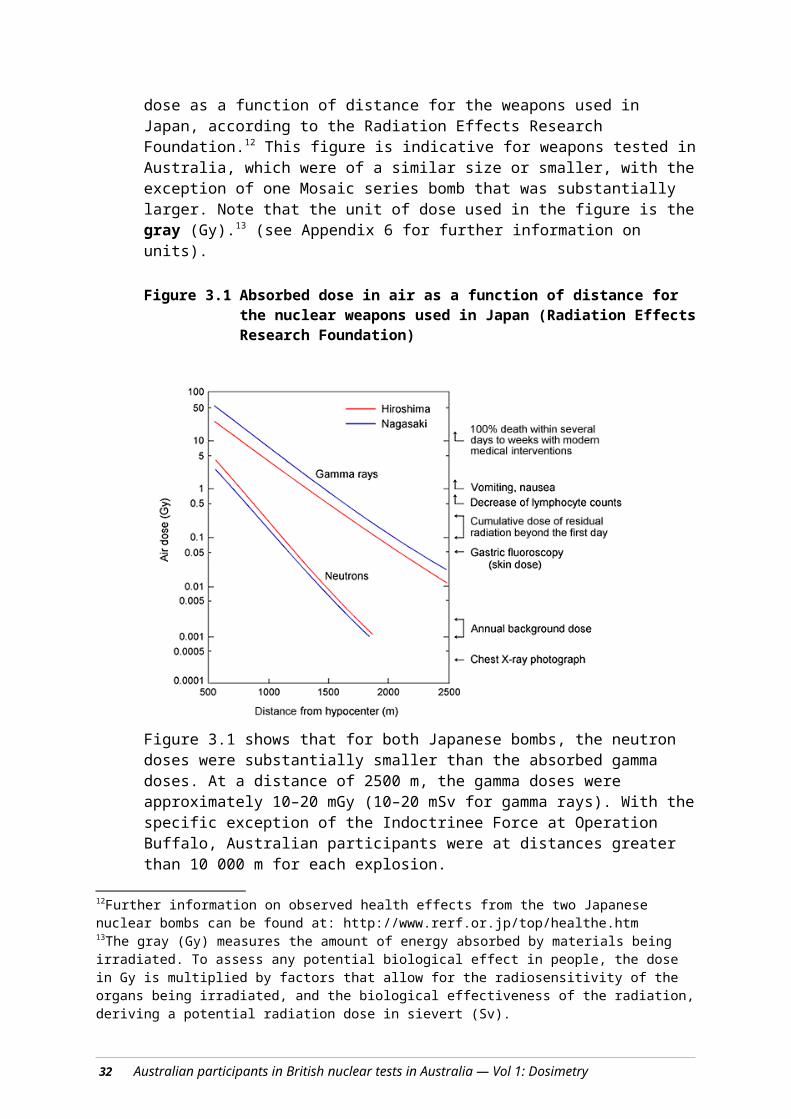
The appendix noted:
The concentrations shown below, shall be the maximum permissible levels for the various isotopes mentioned, when found at the Maralinga Range. The values are based on recommendations of the International Commission on Radiological Protection and of the International Commission on Radiological Units.
When using these levels it must be remembered that the inhalation levels are based on a working week of 56 hours spent in the Active areas. For differing exposure times the levels will be inversely proportional to the exposure times e.g. for a 24-hour daily exposure the level in air for Sr90 will be 2 × 10⁻¹⁰c/cc, instead of 6 × 10¹⁰c/cc.
Criteria for safe firing
Coupling the revised limits with experience gained during Totem, two public exposure levels for inhabited areas of the Australian mainland outside the range were developed (Dale 1955). These were used to establish criteria for safe firing during Operation Mosaic. The two levels were:
Level A: That level which will not give rise to any observable effect on the body (corresponding to 3 R of γ radiation plus, depending on energy, 6 rep to 15 rep of β radiation).
Level B: That level which could cause a small observable effect such as slight temporary sickness in a few people if they had a low sensitivity to radiation (corresponding to 25 R of total dose). The proportion of such people in a population would be a fraction of one per cent.
Dale also considered the fission product dose to grazing animals and concluded: ‘…that the level of fallout over which animals may safely graze is limited by the concentration of the iodine content in the thyroid. The value derived on this criterion is 6 × 10⁴ c/m2 (2.4 × 10⁹ Bq/m2) of 1 hr fission products’.
In an appendix written some six months after the main report, Dale reworked his tables to make allowance for ‘unclothed people living in primitive conditions’. In the revision, Level A for deposition on the body surface at 24 hours was reduced by a factor of approximately 15 (from 1.25 × 10⁵ Ci/m2 to 8.05 × 10³ Ci/m2, approximately equivalent to 4.6 × 10⁷Bq/m2 to 3 × 10⁶ Bq/m2).
Atomic Weapons Test Safety Committee
The AWTSC made its first appearance during the preparations for Operation Mosaic. The Chairman was Professor LH Martin, Defence Science Advisor to the Australian Government.
The AWTSC had the following functions.
(a) To examine information and other data supplied by the United Kingdom Government relating to atomic weapons tests from time to time proposed to be carried out in Australia for the purpose of determining whether the safety measures proposed to be taken in relation to such tests are adequate for the prevention of injury to persons or damage to livestock and other property as a result of such tests.
(b) To advise the Prime Minister, though the Minister for Supply, of the conclusions arrived at by the Committee as a result of such examination and in particular as to
44 Australian participants in British nuclear tests in Australia — Vol 1: Dosimetry

whether and if so what additional, alternative or more extensive safety measures are considered necessary or desirable.
As well as having the power of veto over the firing of the devices, the AWTSC was also responsible for the management of 29 sites around Australia at which fallout deposit and radioactivity in air were monitored daily. Supporting measurements were made of radioactivity in the thyroids in grazing animals, principally iodine-131, and of some water samples.
Health physics procedures
Operation Mosaic involved two island-based tests at the Monte Bello Islands. G1 was on the northwest of Trimouille Island, G2 on the northeast of Alpha Island. AWRE staff managed radiological control.
Before G1, a radiation survey was made of residual contamination on Trimouille, and a rudimentary health control point was established on the island. It consisted of a small tent with a large tarpaulin spread out alongside. It was divided into two sections by wooden benches so that one half was used for clean dressing and the other half for undressing when re-entry personnel returned. A pump fixed to a landing craft provided a showering facility. All those participating in the operation were issued with a film badge, which was to be worn for the entire operation. All personnel who entered an active area were issued with a sortie film badge and a pocket dosimeter.
After G2, only two re-entries took place and ‘little contamination was found and the exposure risk was negligible’ (Hole 1957). An additional visit was made to the island in order to put warning signs in place. Fencing was not used, as this would have required the men to be in protective clothing for too long.
HMS Narvik acted as the control ship, and personnel on board made several measurements of radioactive contamination both before and after G1 and G2. The measurements included:
an ‘almost continuous watch on air activity levels by Monitors Type 1021 installed fore and aft in the ship’
daily checks on drinking water supply
periodic checks on air contamination and activity levels in condensers in the ship’s boiler room
spot checks on the troops’ living quarters.
Hole reported that: ‘Apart from slightly higher counts on the deck Geiger counters due to the proximity of contaminated water after G1 and some low level activity in the condenser traps arising from sea-weed, all activity levels were insignificant’.
RAAF
The RAAF contribution to Operation Mosaic was a Wing Commander, a fully trained Canberra crew and a Neptune detachment operating from Onslow. The Canberra crew, in an RAF aircraft, entered the cloud of both explosions. Otherwise, the main RAAF involvement was decontaminating RAF aircraft that had been cloud sampling. The RAF Canberras were based at Pearce Field in Western Australia, but were flown to Amberley for decontamination. With minor exceptions, the evidence indicates that adequate
Radiation safety regulations and health physics procedures 45
contamination control procedures were in place at Amberley, learning from the mistakes made during Operation Totem.
4.2.4 Operation Buffalo (1956)
Overview
After the ad hoc arrangements made for Operations Hurricane and Totem, the UK Government wanted to have a more permanent site. There were several criteria thought desirable (Arnold 1987):
100-mile (160-km) radius free of human habituation
road and rail communications to a port
an adjacent airstrip
reasonably flat country
a tolerable climate for permanent staff and visiting scientists
not too much rainfall
predictable meteorological conditions with prevailing winds that would carry fallout away from the firing areas
a good water supply.
Nowhere in the British Commonwealth fitted all these criteria exactly, but a site 50 miles (80 km) north of the Australian transcontinental railway matched a sufficient number of the criteria for the UK authorities to decide to seek Australian approval to establish their permanent nuclear testing ground at what became known as Maralinga.
Sites for major tests as well as minor trials were cleared. A village with a hospital, mess facilities, scientific laboratories, laundry facilities and covered accommodation was built.
The first experiments at Maralinga, a series of minor trials (‘Kittens’), were conducted in May 1955.
Operation Buffalo was a series of four explosions conducted at the permanent nuclear weapons proving ground that had been established at Maralinga. The evidence indicates that the radiological control procedures instituted were relatively well developed. There is some evidence that they were not always completely implemented, at least with respect to the delineation of active areas.
Australians started to undertake increasingly more tasks during Operation Buffalo and, by the third round (Kite), almost all entries into and out of the controlled areas were under the direct supervision of the Australian Health Physics teams. A military member of the Australian Health Physics team present at Operation Buffalo confirmed at interview that the operational controls for access to active areas were effective and were followed, although the AHPR later reported to the AWTSC that only a proportion of the film badges issued during Operation Buffalo had been processed (minutes of AWTSC meeting, 1 August 1957).
One noteworthy feature of the first two Buffalo explosions (One Tree and Marcoo) was the assembling of an ‘Indoctrinee Force’ designed to give British Commonwealth military
46 Australian participants in British nuclear tests in Australia — Vol 1: Dosimetry

personnel the opportunity to gain operational experience of the effects of nuclear weapons. Three Australian ‘Indoctrinees’ were in field shelters 1800 m south of the Marcoo explosion and aproximately 100 others were taken into active areas shortly after detonation (see Table 7.11). They wore protective clothing and were accompanied by a ‘Health Escort’ (i.e. a person with some training in health physics control procedures). The Health Escort carried a quartz fibre electroscope and a radiation monitor, usually a Survey Meter type 1324.
The radiological implications of the tasks carried out by this group are discussed in Chapter 7.
Australian involvement
With the establishment of what was expected to be a permanent testing site on the Australian mainland, considerable Australian resources were devoted to the ongoing British nuclear weapons program.
Australian construction companies built the Maralinga village and most of the infrastructure, marked the test sites, constructed access roads, graded lanes for telemetry cable runs and so on. Personnel from the Postmaster General’s (PMG) Department ran telemetry cables and established communications networks.
Many Australian Army officers and personnel carried out a wide range of tasks including health physics and monitoring services, construction of target bunkers, provision of transport services, canteen operation and some immediate re-entry and recovery tasks. RAN personnel operated the reticulated water and related systems for the village.
Australian Commonwealth Police acted as Peace Officers responsible for providing security on the range and endeavoring to prevent inadvertent access by Aborigines. Staff from the Meteorological Office undertook weather forecasting, an increasingly important task for tests on the mainland.
Between the two major trials series, and afterwards, an Australian Health Physics team had responsibility for the radiation safety of the whole range. An Australian Radiation Detection Unit (ARDU) based at Emu carried out off-range fallout surveys. Australians were also included in the Indoctrinee Force.
Radiation safety regulations
The Maralinga Safety Regulations for Operations Buffalo and Antler have been discussed above.
Criteria for safe firing
The firing criteria were those derived by Dale (1955); however, the Royal Commission (1985) noted that the criteria for safe firing had not been present prior to Rounds 1, 2 and 4. Round 3 led to the contamination of Maralinga Village and should not have been fired under the conditions prevailing at the time. The Royal Commission concluded that:
Following Round 1 (One Tree) contamination exceeded level A at locations beyond Cooper Pedy.
Round 2 (Marcoo) violated the criterion that there should be no forecast of rain. Rain fell within 160 kilometres of Ground Zero.
Radiation safety regulations and health physics procedures 47

Round 3 (Kite) contaminated Maralinga Village.
Round 4 (Breakaway) was fired under conditions when the predicted fallout exceeded level A beyond 160 kilometres.
Health physics control in test areas
Evidence, both written and anecdotal, indicates that the radiological controls implemented for the Buffalo series were the most thorough for any part of the total test program, even though there were some cases of less than best practice. (See Note 4 in Table 4.1 below.) Health physics management was carried out initially by AWRE personnel with the support of an Australian Health Physics team. By round 3, control of access to the test area was managed directly by Australians.
Australians served as members of the Radiation Measurement, Health Physics and Decontamination groups. A team of 15 Australians formed the ARDU, who worked under the direction of the UK Health Physics Group Leader.
The two groups of importance for the control of radiation exposures were HP3, which was responsible for health control in contaminated areas, and HP5, which maintained film badges and personal dose records.
Access to Forward Areas was through semi-permanent control points. These were nine health control caravans and one large central control health physics van nicknamed ‘Queen Mary’. The whole group was known as the ‘Health Physics Circus’.
Each van was fitted out for particular tasks, such as dressing before entering a Forward Area or for monitoring and showering for personnel leaving contaminated areas. The caravans withdrew to a location approximately 20 km away (Roadside) before each weapons test and took approximately one hour to be in operation after each firing in the configuration shown in Figure 4.1.
Table 4.1 summarises the protective measures that were intended to ensure the radiological health of participants in the controlled areas.
48 Australian participants in British nuclear tests in Australia — Vol 1: Dosimetry

Figure 4.1 The layout of Health Physics caravans as used during Operations Buffalo and Antler (MacDougall 1958)
Radiation safety regulations and health physics procedures 49

Table 4.1 Recommended protection for participants in YELLOW, RED and BLUE control areas during Operation Buffalo
Measure YELLOW RED BLUEProtective clothing Full, cloth coveralls, rubber
boots, cotton glovesApproved laboratory coats, shoes or overshoes (later rubber boots)
No special clothing
Respirators Worn on firing days and later carried for wearing in dusty conditions
Nil Nil
Personal dosimeter (quartz fibre electroscope) usually issued to health escort
Issued at control point One per party Nil
Film badge Once-only ‘sortie’ badge issued at control point
Issued at control point Personal range film badge
Health escort One member with previous trials experience nominated
Nil Nil
Survey instrument Carried by Health Physics escort
Usually none Nil
Vehicles Yellow vehicles used in this area and only in this area
Clean vehicle Own vehicle
Leaving area Showered then monitored and put on own clean clothing; contaminated clothing left for laundering
Washed hands then monitored; contaminated clothing left behind
Monitored
There is no evidence that RED or BLUE areas were ever clearly marked or defined, other than in the general terms given in Section 3.2.2 of the Maralinga Range Regulations.
Control points for the issue of overalls, overshoes and sortie film badges, and subsequent monitoring and decontamination, do not appear to have been set up for RED areas.
The YELLOW area included the Decontamination Centre area near the village and access between the two along the ‘dirty track’. The YELLOW boundary on the south side of the YELLOW area was only put in place after Department of Works personnel threatened to strike if a boundary was not physically marked between their worksites being set up for Antler and the Buffalo craters. There is later evidence that the Range Commander and the AHPR were dissatisfied with the level of workplace contamination and arranged for an AWRE Representative to be flown out from the UK to accept responsibility for the work to continue, without protection, in a place containing loose contamination (i.e. an ACTIVE area).
ACTIVE areas (RED and YELLOW areas) were required by the Range Safety Regulations to be signposted at all entrances; however, boundaries at the edge of the ACTIVE areas were not marked until after the completion of the series.
1. NON-ACTIVE area — maximum radiation levels do not exceed 1/10 of those laid down in Section 2 of the Radiation Safety Regulations for active areas, and there is no detectable loose activity. No special precautions were required.
2. BLUE area — risk of penetrating radiation, but not of inhalation, ingestion or injection. No special clothing was required other than rubber boots and cotton gloves.
50 Australian participants in British nuclear tests in Australia — Vol 1: Dosimetry
3. RED area —risk of penetrating radiation and of slight inhalation, ingestion and injection. Protective clothing was to be worn in accordance with health physics recommendations for the particular area. The clothing specified was laboratory coats or overalls, rubber boots and cotton gloves, unless more was the specified by the health physics team.
4. YELLOW area —risk of serious inhalation, ingestion, injection or penetrating radiation hazard. It was mandated that full protective clothing must be worn.
Any work carried out in ACTIVE areas required a Permit to Work Certificate, which was raised through the Group Leader Range Facilities after consultation with the Health Physics Representative.
RED and BLUE areas were not well documented during Operation Buffalo. The infrastructure for RED areas did not exist, and boundaries for any of the active areas were not clearly marked until after the operation.
In practice, the combination of one Police Check Point and one Health Physics Control Point, neither of which was located on the ‘dirty track’, combined with no marked ACTIVE area boundaries, resulted in a far-from-perfect system of control. The off-road location of work places added to the confusion, particularly when few roads contained warning signs. It should be noted that the requirement in the Range Safety Regulations to erect warning signs did not select the location, specify manufacture of the sign, nor ensure erection was before a critical time. These actions required coordination by different groups and were all essential tasks for effective range control.
RAAF
The only RAAF involvement in cloud sampling during Operation Buffalo was through an Australian crew flying an RAF Canberra. RAF personnel decontaminated RAF aircraft at RAAF Edinburgh.
4.2.5 Operation Antler (1957)
Overview
Operation Antler consisted of three detonations on prepared sites at Maralinga. Many of the same comments made about Operation Buffalo apply to Operation Antler, although there is some evidence that the UK nuclear authorities were becoming increasingly preoccupied with their Operation Grapple fusion bomb tests being conducted in the Pacific.
There were three unfortunate events during the Antler series:
1. The first round test (Tadje) included 45 curies (1700 GBq) of 60Co as a tracer. Health Physics and the Australian participants were not advised by the AWTSC of the presence of this particularly energetic gamma-emitting radionuclide. It was not until the AHPR team carried out surveys, after the completion of the tests, that the presence of pellets of 60Co was discovered.
2. Later still, residual plutonium-239 (239Pu) contamination from the Tadje test was detected by staff of the Australian Radiation Laboratory.
Radiation safety regulations and health physics procedures 51

3. The second round (Biak) produced a larger than projected plume that contaminated the area containing weapon sheds, generators, balloon tethering gear and other equipment prepared for the third test (Taranaki). This necessitated an expedient and less than thorough cleanup before the site could be used. Areas between Biak and Taranaki and around Taranaki, containing instrument shelters and part of the instrument lane, were not decontaminated, and work continued in those areas without protective clothing.
Australian involvement
There was an extensive commitment of Australian resources to the Antler program. Infrastructure preparations for the Antler detonations fell largely to the Australian Military Engineers and associated groups.
Between the Buffalo and Antler series, radiological control of the Maralinga Range was the responsibility of a mainly civilian Australian Health Physics Group. This team undertook a wide range of tasks from routine monitoring and delineation of RED and YELLOW boundaries to experiments on resuspension of radioactive dust under differing conditions. This group had no responsibility for the areas in which minor trials were continuing between major tests, or for the decontamination of aircraft at RAAF Edinburgh. The officer in charge of the group was designated the Australian Health Physics Representative (AHPR).
Peace Officers patrolled the range as both a security measure and to prevent as far as possible anybody, but particularly Aborigines, straying into contaminated areas.
For the Antler series, the ARDU consisted of 26 men who carried out radiation surveys towards the north, largely in the Alice Road area. Provision of meteorological services was now also solely an Australian task. Australians too were involved in immediate re-entry and recovery tasks.
The RAAF provided a Wing Commander, a fully trained Canberra crew, five Operations Officers, six air traffic controllers and ground personnel to the Maralinga Range Support Unit (MARSU).
Planning
The original program for Antler envisaged six explosions, but the increasing demands of Operation Grapple in the Pacific meant that UK resources were very stretched and only three tests took place in 1957. The minor trials continued, with minimal Australian involvement.
Regulations
Substantially the same regulations developed for Mosaic and Buffalo were applied to Operation Antler, with one change, for population exposure, made after Round 2.
In mid-1957, the AWTSC recommended to the newly formed National Radiation Advisory Council (NRAC) that the Level A exposure limit for the Australian population be reduced to 0.5 R (5 mSv) for the trial series. This was approved by the NRAC, the body now charged with considering population radiation exposures from all sources Australia wide.
52 Australian participants in British nuclear tests in Australia — Vol 1: Dosimetry
Criteria for safe firing
Given Dale’s (1955) revision of the contamination limit for the Aboriginal population in the region, four levels were defined:
A and A′ for those adopting a western lifestyle in which shielding would be provided by footwear and clothing
B and B′ for those living a nomadic lifestyle in which footwear and clothing would not provide additional protection.
Health physics control in test areas
Task Group HP4 was responsible for health control within the test area. Active areas were required by the Radiological Safety Regulations Maralinga (RSRM) to be signposted at all entrances. The entry and exit procedures were substantially the same as those developed for Operation Buffalo. The Health Physics ‘Circus’ caravans were used as the control point.
Verbal briefings were specified for all personnel going into Forward Areas, although one participant interviewed did not receive any such briefing. Instructions included information on accessible areas and the correct route to be taken to and from the work site. In the control caravans, there were maps indicating the RED and YELLOW control areas.
The Australian-controlled area did not include the minor trials areas (Kittens and Tims), which were under British control.
There is some evidence that radiological control was not as thorough at Antler as at Operation Buffalo. For example, at least one meal was served in the Taranaki Forward Area. Although such an action would not in itself present a significant radiological hazard, it does indicate some laxity in health physics procedures.
Australian Health Physics control of the range was assumed on 15 August 1957 with the control centre being put into operation at HP1, located one mile south of Mina (see map in Figure 1.2). The YELLOW Area at that time was bounded by and included Central Street, Fifth Avenue, East Street and Nawa–Kite Road, with an extension to the southwest to include Breakaway and Apu (MacDougall1958).
MacDougall reported that, prior to the Antler series, gamma dose-rates above 7.5 mR/h (75 µGy/h) existed only in the vicinity of One Tree, Marcoo and Breakaway craters and no airborne hazard was present (MacDougall 1958).
4.2.6 Minor trials
Overview
The series of experiments referred to collectively as minor trials involved a wide range of, at times, quite hazardous activities. Some of them were amongst the most secret of the British test program. They involved trials of initiators, studies of weapon assemblies
Radiation safety regulations and health physics procedures 53

using conventional explosives and experiments on weapon safety. They took place over a period of 10 years from 1953 to 1963. Sites at Emu as well as at the Maralinga range were used.
Each series of the program was identified by a code name.
Tims
The program was primarily to determine the material properties of uranium, plutonium and beryllium under shock explosive conditions, using both electronic and photographic observations.
The radioactive and toxic materials used were uranium, plutonium and beryllium.
Kittens
Designed to test and improve the initiator neutron sources.
The toxic and radioactive materials used were beryllium, uranium, and polonium.
Rats
Designed to determine material compression by measuring the attenuation of gamma radiation from radioactive sources.
The radioactive materials used were uranium, scandium, radioactive lead and thorium.
Vixen A
Designed to provide specific information on the spread of radioactive and toxic materials from an accident that produced a fire and/or an explosion.
The toxic and radioactive materials used were beryllium, uranium, plutonium, polonium, yttrium and actinium.
Vixen B
Used to determine the nuclear safety characteristics of warheads (i.e. the effects of accidents), including the accidental detonation of the high explosive, during fabrication, storage and transportation of the weapons. The number of fissions produced was limited, but the experiments did disperse significant quantities of 239Pu into the environment.
The toxic and radioactive materials used were beryllium, uranium and plutonium.
Included under the generic title of the Maralinga Experimental Programme (MEP), the Vixen series of tests were designed to check the physical safety weapons under accident conditions. The first series, codenamed Vixen A, was carried out on the Maralinga Range in 1959. The Vixen B series continued into 1963.
Some Vixen series experiments involved the burning of 239Pu in petrol fires and left considerable stretches of the area contaminated. Over 750 GBq (20 Ci) of 239Pu were left in an arc extending for more than 20 km out from Taranaki.
54 Australian participants in British nuclear tests in Australia — Vol 1: Dosimetry

The AHPR was not advised of this surface contamination. It represented a potential hazard to personnel working on and around the Maralinga Range after the completion of the program. These were principally Commonwealth Peace Officers and the Australian Health Physics team.
Australian participation
The minor trials were executed under very careful UK control. The Australian involvement was limited to general support tasks such as generator hand, cook, general duties, Peace Officers, crane driver and plant operator.
Regulations
The prevailing standards were applied to the radiological control of the trials, although the Vixen series caused extensive contamination of parts of the range.
Radiological outcomes
The radiological consequences of the minor trials are discussed in Chapter 7.
4.2.7 Post-operational activities
Overview
On the completion of the major trials in 1957, the AHPR and his team, employees of the Commonwealth X-Ray and Radium Laboratory (CXRL), had responsibility for radiation safety on the range other than in the minor trials areas.
Their tasks involved:
routine radiation and contamination monitoring and establishing any changes in the boundaries of the restricted areas as the contamination decayed
air and water sampling
reviewing and revising RED and YELLOW control boundaries
conducting experimental programs (e.g. measuring the resuspension of dust under differing conditions, calculating the decay rates of the fission products on the ground)
assisting AWRE staff with decontamination and associated tasks.
These responsibilities continued until the end of the final Vixen B series in 1963.
The AHPR provided monthly reports to the Director of CXRL.
Operation Ayres: clean up of the Decontamination Centre area
The Decontamination Centre was between the airfield and Maralinga village. Building DC 12 contained a hotbox used to dispense Lead-212 (212Pb: half-life 10.6 hours) for use in the Rats trials. The short-lived lead radionuclide was eluted from Thorium-228 (228Th: half-life 1.9 years). In the process, the hotbox became highly contaminated, and careless procedures led to contamination of the laboratory. Members of the Australian Health Physics team were involved in the clean up of DC 12 and the removal and burial of the hotbox. The operators wore supplied-air breathing sets and appropriate dosimeters. The
Radiation safety regulations and health physics procedures 55

crane driver raising the hotbox was masked and sealed into his cabin by polythene sheeting.
4.3 Conclusions
From the start of the British nuclear test program, the UK authorities understood that some risk was involved. Before HMS Plym set sail for the Monte Bello Islands, the Task Force Commander, Torlesse, sought advice from the Trials Director, Penney, on the matter, and Penney in turn obtained advice from the UK Medical Research Council. Some exposure limits were established and control procedures instituted. These changed over the 11-year span of the tests.
The Dosimetry Subcommittee concluded that although there were instances where radiological procedures and controls failed, the regulations were generally in line with the standards of the time.
There were, however, four situations where Australians were needlessly exposed to radiological hazards:
The first was during Operation Hurricane because of the mistaken belief, based on northern hemisphere experience of long-range sampling, that the cloud sampling program in Australia would not lead to the contamination of the aircraft.
The second similar error at Operation Totem is less understandable when again RAAF personnel were unnecessarily exposed to a radiological hazard because of a failure of communication between the RAF and AWRE on the one hand, and the RAAF on the other.
No advice was presented about the presence of 60Co or 239Pu in the first round of the Antler series (Tadje).
The UK’s perceived need to absolutely control information gleaned from the minor trials program, particularly the Vixen B experiments, meant that no information was provided to the AHPR about the relatively widespread residual 239Pu contamination.
There were, in addition, other documented circumstances in which radiation protection procedures had not been specified (aspects of Operation Hurricane), or were either not fully implemented or not completely followed. These circumstances could have led, but did not necessarily lead, to needless exposures and radiation risks.
The exposures and radiation risks included the following:
After Operation Hurricane, the Australian JSTU used a contaminated location on Trimouille Island for training in radiation and contamination monitoring. The Dosimetry Panel considered that these particular exercises gave rise to the highest radiation exposures for Australian personnel involved in Operation Hurricane.
RAN divers recovered a contaminated landing craft with no apparent radiological controls present.
During Operation Totem, three Land Rovers were used for movement in the Forward Areas. Although these were parked separately from other vehicles, there does not appear to have been any attempt to decontaminate them before they were later used by Australian Peace Officers.
56 Australian participants in British nuclear tests in Australia — Vol 1: Dosimetry

RAAF ground crew washed down contaminated aircraft after Totem 1 with, initially, no protective clothing or health physics control procedures in place.
As part of Operation Mosaic, an RAAF Wing Commander and fully trained Canberra crew, flying an RAF Canberra aircraft, entered the cloud of both explosions.
Members of the Indoctrinee Force (Operation Buffalo) were taken into active areas shortly after detonation.
Round 3 of Operation Buffalo (Kite) contaminated Maralinga Village.
There is no evidence that, during Operation Buffalo, RED or BLUE areas were ever clearly marked or defined, and control points for the issue of overalls, overshoes and sortie film badges, and subsequent monitoring and decontamination do not appear to have been set up for RED areas.
The YELLOW boundary on the south side of the YELLOW area was only put in place after Department of Works personnel threatened to strike if a boundary was not physically marked between worksites being set up for Antler and the Buffalo craters. There is later evidence that the Range Commander and the AHPR were dissatisfied with the level of workplace contamination and arranged for an AWRE Representative to be flown out from the UK to accept responsibility for the work to continue, without protection, in a place containing loose contamination (i.e. an ACTIVE area).
In practice, the combination of one Police Check Point and one Health Physics Control Point, neither of which was located on the ‘dirty track’ (which was inside the YELLOW area), combined with no marked ACTIVE area boundaries, resulted in a far from perfect system of control. The off-road location of work places added to the confusion of this system, particularly where there were few roads containing warning signs.
Active areas (RED and YELLOW areas) were required by the Range Safety Regulations to be signposted at all entrances; however, boundaries at the edge of the ACTIVE areas were not marked until after the completion of the series.
The second Antler round (Biak) produced a larger than projected plume that contaminated the area containing weapon sheds, generators, balloon tethering gear and other equipment prepared for the third test (Taranaki). This necessitated an expedient and less than thorough clean up before the site could be used. Areas between Biak and Taranaki and around Taranaki, containing instrument shelters, and part of the instrument lane, were not decontaminated, and work continued in those areas without protective clothing.
There is some evidence that radiological control was not as thorough at Antler as at Operation Buffalo. For example, at least one meal was served in the Taranaki Forward Area. Although such an action would not in itself present a significant radiological hazard, it does indicate some laxity in health physics procedures.
The radiation exposures that were or may have been received by Australian participants in the UK nuclear weapons test program are the only remaining indicators of the effectiveness of the health control procedure instituted during the test period.
The methods used to determine those exposures and the results are discussed in Chapters 6 and 7.
Radiation safety regulations and health physics procedures 57

4.4 References
Arnold L (1987). A Very Special Relationship: British atomic weapon trails in Australia, HMSO Publications Centre, London.
Austin J (1955). The Prevention and Removal of Radio-active Contamination Part 6: Decontamination of aircraft and health control at Woomera and Amberley, AWRE Report T106/54, Atomic Weapons Research Establishment, Aldermaston.
Cooper PF (1954). Totem Operations Report, AWRE Report T/54, Atomic Weapons Research Establishment, Aldermaston.
Commonwealth of Australia (1985). Report of the Royal Commission into British Nuclear Tests in Australia, Vol. 1 and 2, Australian Government Publishing Service, Canberra.
Dale GC (1955). Safety Levels for Contamination From Fallout From Atomic Weapon Trials, AWRE Report O-41/55, Atomic Weapons Research Establishment, Aldermaston.
Barnes D E, Dale G C, Siddons R A and Woodcock E R (1953). Airborne Contamination at the Totem Trial. High Explosives Research (HER) Report No. A 32, UK Ministry of Supply, Fort Halstead, Kent.
Hole JA (1957). Operation MOSAIC: Radiological Group Report, AWRE Report T21/57, Atomic Weapons Research Establishment, Aldermaston.
McDougall WG, Rexford-Welch S C and Douglas K (1958). Operation ANTLER: Health Physics Services, UKAEA Report T45/58, Atomic Weapons Research Establishment, Aldermaston.
Symonds JL (1985). A History of British Atomic Tests in Australia, Australian Government Publishing Service, Canberra.
Royal Australian Air Force (1980). Air Operations in Support of Atomic Explosions at Emu Field, South Australia, 15 and 27 October 1953, Royal Commission No. R.137.001. Report compiled on 2 April 1980 from a number of reports of the time classified ‘Secret’. Copy obtained from Dept of Resources and Energy (Canberra) April 1983.
58 Australian participants in British nuclear tests in Australia — Vol 1: Dosimetry
5 Histor ical data reviewed in the study
Summary
This chapter discusses the information that was available for this study. A large amount of information on the tests is available, held by the National Archives of Australia (NAA), the Australian Government Department of Defence, the Australian Radiation Protection and Nuclear Safety Agency (ARPANSA), other Australian Government sources, and private collections. A number of people who were present at the tests were interviewed and provided important information.
There is limited information available on the results of radiation monitoring and on the details of activities carried out at the trials — who was doing what, where and when. Although interviews with people who were there can fill some of the gaps, estimates have been necessary in many cases. Where in doubt, a policy of ensuring that radiation exposures were not underestimated was followed.
5.1 Sources of historical data
Section 4 of the Epidemiological Studies (Confidentiality) Act 1981 has the following prohibition affecting this study:
…a person who has assisted, or is assisting, in the conduct of a prescribed study shall not, either directly or indirectly, except for the purpose of the conduct of that study, make a record of, or divulge or communicate to any person, any information concerning the affairs of another person acquired by him by reason of his having assisted, or assisting, in the conduct of that study.
Accordingly, a number of test participants referred to below cannot be identified.
5.1.1 Documents at ARPANSA
The documents available at ARPANSA21, previously the Australian Radiation Laboratory (ARL) (at the time of the tests, the Commonwealth X-Ray and Radium Laboratory [CXRL]), consisted of five main collections.
1. Working papers and selected reports from John Moroney (collection held at ARPANSA).
Between August 1957 and November 1967, John Moroney was the joint Scientific Secretary of the Atomic Weapons Tests Safety Committee (AWTSC), reconstituted in March 1957, and the National Radiation Advisory Council (NRAC) following its formation in April 1957. In both of these capacities, he played a key role in implementing the policies developed by those committees. For example, during this time he was responsible for developing and implementing the committees’ scientific programs, including those related to safety aspects and public health from the British nuclear tests in Australia. He also conducted research into the environmental transport of fallout
21Available from http://www.arpansa.gov.au
59
radionuclides in Australia. Neither committee had any responsibility for either safety or the monitoring of fallout within the boundaries of the Maralinga Range during the major trials. Moroney’s participation in the Antler safety procedures was that of observer, not as an active participant.
Following the nuclear tests at Maralinga, the AWTSC had direct responsibility for developing and directing the Australian programs for monitoring fallout from overseas nuclear tests and for the determination of the levels of fallout radionuclides in the environmental pathways to the Australian population. Data on fallout deposits throughout Australia, corrected for sampling inefficiencies, for all the UK atomic tests in Australia from the Mosaic series onwards, are to be found in an ARL technical report published in 1992: Public Health Impact of Fallout from British Nuclear Weapons Tests in Australia, 1952–1957, ARL/TR105 by KN Wise and JR Moroney.
In 1979, all original records held by Moroney and by JF Richardson of ARL relating to Health Physics operations at Maralinga, and to the AWTSC and the NRAC, were sent to the NAA and to various other government agencies.
The collection of archival and confidential literature retained by John Moroney at ARPANSA contains considerable detail relevant to dose reconstruction for RAAF air-sampling operations. The records include information on aircraft contamination, activities on air intake filters from the aircraft, aircrew lists and anecdotes on flight experiences, descriptions of flight paths for long-range sampling, and information on decontamination of Lincolns at Amberley. Moroney’s records also contain extensive notes on the estimation of external doses to aircrew and internal doses to ground staff, based on the published filter activities for the aircraft.
2. Reports by the Australian Health Physics Representative OH Turner, and AP Wood who acted as his deputy.
Report numbers 1–51 cover the period November 1956 to January 1962. Reports held originally by the ARL have been augmented by some held by Ms A Munslow-Davies, a member of the Consultative Forum and the Dosimetry Subcommittee, who made them available for this study.
3. Transcripts of court proceedings from two litigation cases in which John Moroney was involved as Scientific Advisor to the lawyers for the Commonwealth of Australia.
In both litigation cases, nuclear veterans were seeking compensation from the Commonwealth of Australia. Specifically, these were Daryl Richard Johnstone v Commonwealth of Australia and Wesley Thomas Dingwall v Commonwealth of Australia.
4. Six boxes of UK AWRE technical reports directly related to the tests.
5. ARPANSA/ARL reports from the past 20 years, detailing levels of radioactive contamination remaining after Operation Brumby, the 1967 cleanup operation. These reports provide dose and health-risk assessments for both residual contamination and fallout, and studies performed during the Maralinga Technical Advisory Group (TAG) and Maralinga Technical Assessment Committee (MARTAC) programs. Of particular value were:
60
Wise KN and Moroney JR (1992). Public Health Impact of Fallout from British Nuclear Weapons Tests in Australia, 1952–1957, ARL/TR105, Australian Radiation Protection and Nuclear Safety Agency, Yallambie.
Williams GA, Martin LJ and Long SA (2002). Inhalation Dose Assessment for Remediated Land at Maralinga, Australian Radiation Protection and Nuclear Safety Agency, Yallambie.
5.1.2 Personal collections
The documents held by Ms Ann Munslow-Davies were extensively reviewed by the principal researcher appointed to the Dosimetry Subcommittee, Rob Robotham. This large collection includes material obtained by Ms Munslow-Davies from various sources. Much of the collection is understood to have originated from one of the Maralinga Health Physics teams. Ms Munslow-Davies’ other sources include journalists, academics and nuclear test participants. The collection contains primary source documents, court-case transcripts, AWRE technical, operational and scientific reports, and sundry media materials.
The comprehensive collection of documents assembled by Alan Batchelor MBE, Major (Retired), is a result of more than five years of work studying the NAA collection in Canberra. That collection22 spans all major tests from Operation Hurricane until the end of minor trials at Maralinga. It comprises copies of primary sources such as trial orders, work programs and names of personnel and work-groups. Also included are film badge records, transcripts provided as evidence to the Royal Commission into British Nuclear Tests in Australia, and submissions to relevant court cases.
Major Batchelor also provided listings of work schedules and an ‘Antler activities template’ to assist the Exposure Panel in determining who was doing what, where, and for how long.
5.1.3 Other Australian sources
Other sources of documents that have been reviewed in this study, include:
NAA collections in both Canberra and Melbourne
Australian Government Department of Veterans’ Affairs records (nominal rolls, military records)
the Australian War Memorial database
Australian Protective Service (APS) records.
Thirty of John Moroney’s records held by the NAA in Melbourne were reviewed. These included files on administrative matters, coordination of the Australia-wide fallout sampling program, and the proposed (but cancelled) Operation Lighthouse. The list of the documents held by NAA is designated ‘VA 1980/493’.
An ex-Peace Officer, whose service included both the Commonwealth Police and the APS, provided a list of names of Peace/Commonwealth Police/APS officers and
22For a list of records relating to Maralinga and the Royal Commission into British Nuclear Tests in Australia, see http://www.naa.gov.au/Publications/fact_sheets/FS129.html
Glossary and common acronyms 61

Department of Administrative Services Fleet mechanics who served at Maralinga from the time of the atomic weapons tests up until the withdrawal of the APS presence. This followed the remediation of the site in August 2001. An RAAF serviceman also provided a box of documents relating to the Peace Officers, which included a number of Peace Officer rosters, duties for the Peace Officers at various sites, and so on. Major Batchelor also provided a list of names of Peace Officers and some dates of tours of duty for them.
Whilst the cut-off date for this study is 30 April 1965 — two years after the last Vixen B minor trial — a number of Federal Police/APS officers continued patrols of the Maralinga Range until well after that date, including during the 1967 British cleanup, Operation Brumby.
Series A6450 at the NAA (Statements received from Australian witnesses), which includes personal statements made to the Royal Commission into British Nuclear Tests in Australia by test participants, has also been examined. The subcommittee’s researcher read some 74 such statements, which were provided by the Department of Veterans’ Affairs.
5.1.4 Interviews with Australian nuclear test participants and others with specific information
The panel has conducted individual interviews with the following participants in the various aspects of the British nuclear weapons test program and the Royal Commission into British Nuclear Tests in Australia. They include the following ex-Service members:
an RAE (Engineer) officer who served with MARSU during the inter-trial period following operation Buffalo, and during operation Antler
John Harries (scientific adviser to the Royal Commission into British Nuclear Tests in Australia)
an RAAF Leading Aircraftsman, who was at Maralinga from August 1960 to Christmas 1961, working as a driver assisting in the construction of the steelwork for the Vixen B tests, as a crane driver, on general transport duties, and in the erection of the ‘feather beds’ used for minor trials; subsequently, he was a water tanker driver and later a fuel tanker driver and also worked in the vehicle workshops
an officer of the Health Physics team at Operation Buffalo who was trained in Health Physics procedures at CXRL in Melbourne
an Army sergeant with experience at Totem
a member of the Health Physics team known as the Australian Radiation Detection Unit (ARDU), initially as a serving soldier and later as a civilian, during both Buffalo and Antler (he trained in Health Physics at CXRL in Melbourne and was an active member of the team that dismantled the very highly contaminated 228Th hotbox in building DC12 in the DC/RB area, and played a prominent role in the subsequent decontamination of that building)
a National Serviceman who served in the RAN at Operation Hurricane
John Symonds, who was Chief Scientist (Power & Energy) of the Australian Atomic Energy Commission Research Establishment, and had prime responsibility for the exhumation of plutonium from the Airfield Cemetery at Maralinga in 1979, prior to its return to the UK
62 Australian participants in British nuclear tests in Australia — Vol 1: Dosimetry

a general-purpose truck driver at Emu Field.
5.1.5 UK sources
Information from UK sources used in this study came from the British Public Records Office, and documents obtained by the Australian Royal Commission into British Nuclear Tests in Australia.
5.1.6 Other international sources
Little useful additional information has been found from international sources. However, the results and reports of the joint US/UK Roller Coaster series of environmental plutonium contamination studies have provided some supporting information on the effects of the Vixen B trials at Maralinga.
5.2 Specific relevant data
Personal external exposure records: film badges, quartz fibre electroscopes for beta and gamma radiations
The main data sources used to obtain data on personal external exposure were:
The UK Government’s Listing of persons at UK overseas defence nuclear experimental programmes, citizens of Australia, colloquially known as ‘The Blue Book’ (UK Ministry of Defence 1982)
Australian Health Physics listing of radiation exposures at Maralinga, prepared by the Department of National Development and Energy during 1981
Radiological health during Operation Hurricane (Monte Bello Is. October/November 1952) and Operation Totem (Emu Claypan, SA October/November 1953), a minute to Director General Medical Services (RAAF) from Squadron Leader AD Thomas, Scientific Advisor to the Chief of the Air Staff, 1 December 1953
ARL document Personal Monitor Records From Exposure To Beta And Gamma Radiation During Engagement In The Program Of British Nuclear Weapons Tests In Australia, 10 December 1984.
Air-sampler data: cascade impactor results for airborne contamination levels and aerosol particle size, for alpha, beta and gamma activities
Limited data sources were available providing air-sampler information:
Data scattered throughout contemporaneous reports by Turner, McDougall, Drake-Seager and others.
Measurements of airborne activity and ground contamination at 15 and 200 miles (24 and 320 km) from ground zero (GZ), including some cascade impactor results and some resuspension factors, were obtained from Carter (1957).
Surface contamination levels: resuspension data for alpha and gamma activities
The main data sources used to obtain data on surface contamination were:
Glossary and common acronyms 63

Health Physics reports, ARL technical reports and from the Maralinga TAG aerial survey of 1987.
– Williams GA (ed) (1990). Inhalation Hazard Assessment at Maralinga and Emu, Technical Report ARL/TR087, Australian Radiation Protection and Nuclear Safety Agency, Yallambie
– Lokan KH (ed) (1985). Residual Radioactive Contamination at Maralinga and Emu, Technical Report ARL/TR070, Australian Radiation Protection and Nuclear Safety Agency, Yallambie
– EG&G Energy Measurements (1988). An Aerial Radiological Survey of Maralinga and Emu, South Australia, EG&G Energy Measurements Report No. AMO-8807, EG&G Energy Measurements, Nevada
Some resuspension data for Maralinga were available in one of Turner’s Health Physics reports (April 1964) and in various ARL technical reports.
– Williams GA (ed) (1990). Inhalation hazard assessment at Maralinga and Emu, Technical Report ARL/TR087, Australian Radiation Protection and Nuclear Safety Agency, Yallambie
– Williams GA, Martin LJ and Long SA (2002). Inhalation Dose Assessment for Remediated Land at Maralinga, Environmental & Radiation Health Branch, ARPANSA, Australian Radiation Protection and Nuclear Safety Agency, Yallambie
– Johnston PN et al (1993). Plutonium resuspension and airborne dust loadings in the desert environment of Maralinga, South Australia. Journal of Environmental Radioactivity 20:117–131
– unpublished results by J Shinn of Lawrence Livermore National Laboratory, including the draft report Studies of Plutonium Aerosol Resuspension at the Time of the Maralinga Cleanup
Data on alpha () and beta () contamination and resuspension factors were found in The Dust Hazard during Operation Totem (Carter 1956).
Data on contaminated foodstuffs and drinking water
No useful information on radioactive contamination of foodstuffs was discovered. Records of sampling of fish at the Monte Bello Islands provided no useful data.
Turner and others made periodic measurements of contamination in drinking water at Maralinga. They found only that the water contained naturally occurring radionuclides. Some measurements of drinking water distilled from seawater were made during Operations Hurricane and Mosaic, finding levels at approximately background.
Results of any biological analyses: urine, faeces or blood
No useful data were discovered from biological analyses.
Work tasks, locations and times
Data on work tasks, locations and times were assessed, based on relevant information gleaned from:
NAA documents
64 Australian participants in British nuclear tests in Australia — Vol 1: Dosimetry

Department of Defence records, including ship lists and records of proceedings for the Australian ships involved, Routine Orders for the army units known to have been involved and those RAAF squadrons and squadron members concerned with various aspects of the sampling and other programs
personnel records of private firms engaged for the purposes of conducting and supporting the tests
the Report of the Royal Commission into British Nuclear Tests in Australia (1985)
records of issue of Maralinga Security Cards
other documents provided by various associations of military participants
comprehensive work programs covering the activities of the Australian Army Engineering Troops prior to, during and following Operation Antler.
5.3 Consequences of a lack of information
The major deficiencies in information required for estimation of dosimetry are in the lack of personal monitoring data — other than some film badge records — that would provide reliable indications of personal exposures from all possible exposure pathways.
Overall, only 4% of the participants had some recorded monitoring. This could be seen as of some concern for the study; however, there were a number of work groups for which significant exposure was highly unlikely, and thus the lack of monitoring is not of concern.
Most RAN personnel were at Hurricane or Mosaic, where they spent most of the trial period(s) on their ship; thus, their whereabouts and likely resulting exposures are well known. Many of the unmonitored RAAF personnel were on bases where contaminated aircraft were serviced, but they had no involvement with them. Large numbers of civilians were employed in service functions in and around the camps, and so were not monitored. For the Army, the proportion with monitoring records is 16%. This group includes many of the most exposed engineers and infantry, who regularly entered contaminated areas.
In the absence of empirical evidence, the Exposure Panel has estimated doses for specific work groups, based on estimates of who was doing what, where, when, and for how long. In general, the information to reliably determine such scenarios with absolute certainty is not available.
As discussed earlier in Section 5.3, members of the Dosimetry Subcommittee are of the opinion that there was sufficient information available, in reports, official papers and sundry other documents, to overcome the relatively small number of film badge records.
This lack of definite data has been compensated for to some extent by the listings of work schedules and activity profiles extracted from NAA documents and others, and from information gleaned from personal interviews and statements of participants, including those made to the Royal Commission into British Nuclear Tests in Australia. Where data are absent or deficient, the panel has used its collective experience and knowledge of health physics practices at the time of the tests to make informed judgements about the UK atomic testing program. At all times, where there are doubts regarding the data, the panel opted for overestimation rather than underestimation. This approach may have overestimated the actual individual exposure doses incurred.
Glossary and common acronyms 65
The Dosimetry Subcommittee formed the view that there was sufficient information available, in reports and sundry documents, to overcome the paucity of film badge records, and to enable adequate estimates to be made of external radiation exposures.
Elsewhere (Section 6.7), the reliability of the Dosimetry Subcommittee’s exposure estimations and methods of calculation are discussed. It must be understood, however, that some of the biggest uncertainties, which are not easy to quantify, are in the lack of detailed knowledge of what various participants in the UK atomic testing program were actually doing, where and for how long.
5.4 References
Carter PA (1956). Operation Totem: The dust hazard during Operation Totem, AWRE report T1/56, Atomic Weapons Research Establishment, Aldermaston.
Carter PA (1957). Operation Buffalo: Measurements of airborne radioactivity and ground contamination at 15 and 200 miles from Ground Zero, AWRE report T52/57, Atomic Weapons Research Establishment, Aldermaston.
Commonwealth of Australia (1985). The report of the Royal Commission into British Nuclear Tests in Australia, Vol 1 and 2, Australian Government Publishing Service, Canberra.
Symonds JL (1985). A history of British atomic tests in Australia, Australian Government Publishing Service, Canberra.
UK Ministry of Defence (1982). Listing of Persons at UK Overseas Defence Nuclear Experimental Programmes — Citizens of Australia (Provisional Issue), UK Medical Staff in Confidence, UK Ministry of Defence (Procurement Executive), Atomic Weapons Research Establishment, Aldermaston.
Wise KN and Moroney JR (1992). Public health impact of fallout from British nuclear weapons tests in Australia, 1952—1957, ARL Report ARL/TR105, Australian Radiation Protection and Nuclear Safety Agency, Yallambie.
66 Australian participants in British nuclear tests in Australia — Vol 1: Dosimetry

6 Methods for dose reconstruct ion
Summary
This chapter describes the methods used to estimate the radiation doses received by Australian test participants.
The two most important factors are the source terms and the exposure pathways.
‘Source terms’ refers to levels of radioactive material in the local environment. An example is the amount of fallout on the ground in a working area.
‘Exposure pathways’ refers to ways in which this radioactive material can result in radiation exposure. For example, two possible pathways are external exposure to gamma radiation given off by the fallout and internal exposure from inhaling radioactive dust produced from disturbing the fallout.
The source terms and pathways for a number of different exposure situations are identified, and the conclusions reached are set out below.
Prompt exposure from the initial flash of radiation does not extend much beyond 2 km from the point of detonation. The only participants within this distance were some of the Indoctrinee Force during Operation Buffalo and these are the only individuals who received any significant exposure from this source.
The external exposure, mostly due to short-lived radionuclides, decreased quite quickly.
The internal hazard also fell fairly rapidly at first, due to the decay of short-lived radionuclides, but then remained almost constant due to the presence of very long-lived radionuclides such as plutonium. Thus, after one month, the external dose had reduced to less than the internal dose, which then remained almost constant.
The most important potential source of exposure for participants was external gamma exposure from fallout and other radioactive contaminants on the ground (or on ships). The level of exposure fell quite rapidly as time passed, especially in the first few weeks after the test.
Compared with external exposure, internal exposure from inhalation of dust was not an important source of exposure during the first month or so after an explosion.
After one month, the dose from inhalation of plutonium in dust became more significant relative to external radiation.
Doses from other pathways such as ingestion (swallowing) of radioactive matter or contamination of wounds were considered to be very small.
This chapter also includes some examples showing how these general principles were applied to particular groups or the activities being undertaken. These include working in contaminated areas, traveling in contaminated vehicles, or marching through fallout plumes.
67

The chapter concludes with a discussion of how the lack of information or uncertainties in regard to some of the factors used in the calculations is likely to affect the outcomes. In general, where there is uncertainty, factors that could potentially overestimate the computed doses were chosen.
6.1 Introduction
The basic concepts concerning the types of ionising radiation and their biological effects are to be found in Chapter 2, whilst the various hazards associated with nuclear weapons tests and their aftermath have been described in Chapter 3. This chapter presents the steps followed to develop estimates of the radiation doses received by groups of Australian participants in the British nuclear tests in Australia. Doses have been derived for generic tasks undertaken at the trials, and in Chapter 7 these have been applied to specific work groups. For some tasks, there is insufficient information to allow the derivation of specific radiation exposures. The number of such exposures has been reduced by using historical records for known and comparable tasks and exposures.
The procedure for estimation of radiation exposures is set out below.
Primary records were searched for original data. These may have been in the form of film badge readings, measurements of surface contamination levels or of radioactivity in air or foodstuffs. Where appropriate, these were supplemented by mathematical modelling.
Exposure pathways by which radioactive materials could pose a hazard to the participants were then considered.
The radiation doses received from each pathway were assessed by analysing the tasks being undertaken by each of the groups of participants and applying the known or calculated radiation dose rate data to those tasks.
When no dosage records were available for a specific task but were available for a similar exposure situation, the latter were used, with appropriate modifications where necessary, to supplement the unknown data.
Where uncertainties existed, the overall approach has been to adopt and use those factors (length of exposure, particle size, breathing rate, radionuclide mixture, etc) that would generate higher, rather than lower, estimates of radiation exposure.
In addition, some indication is provided about the possible uncertainties inherent in the derived doses, based on the availability and reliability of the primary information used.
Finally, the dosimetric aspects of the tasks were examined to provide guidance on the estimated radiation doses received. These estimates were used to assign a broad exposure category to individuals or groups performing the task. The categories for a single exposure are given in Table 6.1(a). Some personnel received more than one radiation exposure during a test series or did various tasks at more than one test series. The category that was assigned to multiple exposures was obtained from the matrix shown in Table 6.1(b).
68
Table 6.1 Radiation dose assignment categories(a) One exposure onlyExposure category Radiation exposure range
(mSv)A 1B 1–<5C 5–<20D 20–50E 50 or moreF Unknown
(b) Multiple exposuresMost recent exposure Category from previous exposure(s)
A B C D EA A B C D EB B C C D EC C C D E ED D D E E EE E E E E E
Table 6.1(b) presents a matrix of possible exposures. Column 1 gives the category of the most recent exposure and columns 2 to 6 give the category of previously accumulated exposure. The category defined in one of columns 2 to 6 and in one of the ‘most recent exposure’ rows gives the total exposure category assigned (including the most recent exposure). For example, if the most recent exposure is in category B and the accumulated exposure is in category C, then the assigned category for exposures B + C is C. In symbols, the assignment could be written B + C = C. Similarly, C + D = E. This can be repeated for three or more exposures. For the special cases A + A + A + A and B + B + B + B, the assigned categories are B and D, respectively.
6.2 Source terms
External radiation doses are those received from radiation sources outside the body. These can include:
radiation emitted by weapons components handled prior to the test
gamma and neutron radiation from the device at the time of firing
gamma and beta radiations occurring after the test from fallout on ground surfaces and from induced radioactivity in the ground surface or other objects
gamma radiation received whilst sailing over contaminated seawater in the specific case of the two test series held in the Monte Bello Archipelago
gamma radiation received from immersion in a radioactive cloud or from the decontamination of aircraft that had been so immersed.
Almost all external radiation doses were received after detonation of the devices. They can be determined by direct measurement using one of the methods described in Chapter 4. Personal dose records from film badges and quartz fibre electroscopes (QFE) are available for a minority of participants. Where these are not available, doses can be estimated directly from the results of area monitoring, in conjunction with estimates of
Glossary and common acronyms 69

the times spent in the areas concerned. Indirect determinations are usually made from other measurements, such as the activities of fallout deposits, using suitable modelling methods. The prompt (initial) radiation dose to participants can be estimated from known measurements of the prompt dose at different distances from nuclear explosions.
Internal radiation doses arise from radioactive material that has entered the body by inhalation, ingestion or absorption through the skin via wounds. These doses can only be assessed indirectly from measurement data and from calculating the doses from breathing, ingesting or absorbing known amounts of radioactive materials. Measurements can include activity in air derived from air samplers including open face filter samplers and cascade impactors that can provide an indication of the particle sizes of the contaminant. Unfortunately, few air sample results were found, as air sampling was not common at the tests. A similar situation applied during the early US nuclear tests: ‘Concentrations of radionuclides in air generally were not measured at locations and times of exposure of atomic veterans’ (US National Research Council 2003).
Internal doses can also be estimated from contamination levels in food or water. With the exception of drinking water results for Maralinga village, few such measurements were available.
Inhalation of radioactive dust is usually the most important contributor to internal dose. Where monitoring data are not available, air concentrations can be estimated from surface contamination results, using the concept of a resuspension factor to calculate the radioactivity23 per cubic metre of air from the activity per square metre on the ground surface.
When a radioactively contaminated surface is disturbed, radioactive material may be raised into the air. The resuspension factor is the ratio of the level of radioactive material in the air above the surface to the level of contamination on the surface.
The unit is per metre; for example, if a surface is contaminated to a level of 100 000 Bq/m2 and, for the activity taking place, the resuspension factor is taken as 1/100 000 (10-5) per metre, the level of airborne contamination would be 1 Bq/m3.
Factors that can affect resuspension factors include:
the nature of the surface
weathering of the surface
particle size
severity of surface disturbance.
Reported resuspension factors range from 10-8/m (very low ratio) to 10-3/m (an extremely high ratio) (Turner 1963, Linsley 1978, Walsh 2002).
Turner measured resuspension factors at Maralinga of 2 × 10⁻⁸/m for ‘normal winds’ to 8 × 10⁻⁶/m following a ‘dragging experiment’.
The site chosen by Turner for his measurements was near the 10 Ci/m2 (3.7 × 10⁵ Bq/m2) contour based on the Vixen B3 map. He noted that ‘the average person would not tolerate living in the type of dust cloud engendered by the dragging operation’.
23The terms ‘radioactivity’ and ‘activity’ are both used to describe the decay of radioactive materials. Where the term ‘activity’ refers to physical endeavours, it should be clear from the context.
70 Australian participants in British nuclear tests in Australia — Vol 1: Dosimetry

In this work, a resuspension factor of 10-5/m2 has been used. It has been adopted to provide conservative24 estimates of possible inhalation hazards and to be comparable to Turner’s experimentally derived figure. It is possible that for short periods a resuspension factor level of 10-4/m may have occurred, but average long-term levels would have been close to10-6/m or less.
Another important parameter affecting inhalation doses is the size of the particles being inhaled. The important inhalable sizes are less than 10m activity median aerodynamic diameter (AMAD). In March 1957, Turner carried out some simple particle size analyses using a cascade impactor air sampler and found that the AMAD was of the order of 1.5m.
When levels of inhaled (or ingested) radioactivity have been determined, internal radiation doses can be estimated by using standard dose conversion factors (ICRP 1995, 1996, 1998).
The use of dose conversion factors is a key step in generating possible radiation doses from ingested and inhaled radioactive material. They can be used to derive an estimate of radiation dose from a measurement or estimate of radioactive material taken into the body, or from the concentration of radioactivity in the air or on the ground surface.
A dose conversion factor includes allowances for the half-life of the radionuclide, the radiations emitted and their energies. Account is taken of the particular organs the materials may concentrate in and the radiosensitivity of those organs. The rate of biological excretion is also taken into account. The conversion from activity to dose is based on 50 years following inhalation or ingestion.
Dose conversion factors for a radionuclide such as 239Pu, which has a long half-life and deposits in bone, is very different to 3H, which has a much shorter half-life and is excreted relatively rapidly.
In this study, those dose conversion factors that generate the largest internal dose have been used.
Examples of the use of dose conversion factors in estimating internal doses are given in Section 6.6. Another possible means of estimating internal doses is from the measurement of radioactivity in urine, faeces or blood and the use of biological models. Very few such measurements have been found for personnel in this study.
6.3 Pathways
To make estimates of personnel doses, information on the radioactive materials to which they may be exposed and the pathways in which those exposures may occur is essential.
Components in the fallout vary significantly with time after detonation and have a wide range of half-lives. The theoretical calculation of their growth and decay requires knowledge of the fissile materials used, the amount of each radionuclide produced, the half-lives of each radionuclide, their decay modes and the time that had elapsed since fission.
24In radiation protection, ‘conservative’ has a particular meaning. It means adopting reasonable worst case considerations to arrive at realistic upper estimates of radiation exposures.
Glossary and common acronyms 71

The ways in which personnel were exposed to external and internal radiation hazards during the test series arose from a limited number of pathways. These are summarised in Table 6.2. The radiological significance of each pathway for each test series and minor trials are considered in detail in Chapter 7. Usually, the exposure pathways occur in combination. For example, personnel who entered areas contaminated with fallout could have received radiation doses:
externally from deposit on the ground surface, from neutron activated material below the ground surface or from neutron activated objects
internally by inhalation of resuspended material
internally from ingestion of any radioactive material transferred to the hands and from the hands to the mouth by eating or other means
internally by absorption through cuts and wounds.
External exposures are dominated by gamma-emitting radionuclides, whilst, for internal exposures, alpha and to a lesser extent beta emitters are most important. A radiation dose is received from external radiation for as long as the individual is in the vicinity of the radiation field. An internal radiation dose can be received long after the inhalation or ingestion of radioactive materials. The internal dose estimates given here take into account the long-term retention of the radioactivity in the body and its radioactive decay.
Table 6.2 Potential irradiation pathways for major trialsPotential source of exposure External hazard Internal hazardPathways common to all testsInitial radiation from detonation /neutron burstTravel in contaminated areas and fallout zones
Induced activity near GZFallout material
Inhalation/ingestion of resuspended activity or personal contamination
Work in contaminated areas/fallout zones
γ & β radiation from contaminated surfaces Handling contaminated equipment
Dust producing activities, e.g. sandbagging of bunkers, cable laying, fencingWound contaminationIngestion of dust
Pathways specific to marine operationsSurface contamination Ships surfaces
Contaminated clothingContaminated equipment
Decontaminating shipsRecovery of contaminated equipment e.g. buoys, ground equipment
Contaminated seawater Sailing overDivers recovering materialSwimming
Swallowing seawaterInhalation of splashed water or spray
Contaminated food Eating contaminated fish and foodstuffs stored on ship
Ship-borne water Contaminated bilge waterShips’ boilers/evaporators
Drinking contaminated distilled water
Pathways related to cloud sampling operationsCloud sampling Immersion in the cloud
Contaminated aircraft surfacesInhalation in cloud Inhalation during decontamination of aircraft
72 Australian participants in British nuclear tests in Australia — Vol 1: Dosimetry
6.4 Assessment of external dose rates and doses
Exposure records of film badge or QFE readings are available, but cover only a minority of personnel. The procedure was for test participants to receive a film badge that was worn for a month. In some cases, it was worn for the duration of the test program. However, men entering areas that were significantly contaminated would be required to wear a separate badge, the ‘sortie’ badge, whilst they worked in these areas. The normal badge would be worn only outside the contaminated areas.
6.4.1 Prompt radiation
Some participants have expressed concerns about receiving significant radiation exposures from the initial flash from nuclear explosions. Measurements (Williams 1956, Carr 1957–1958, Hole 1957), from the test series are summarised in Figure 6.1. This figure shows how the prompt radiation dose decreases rapidly with increasing distance. The doses are given as sievert per kiloton (Sv/kT) of yield and the results from different test series show good consistency. Two factors contribute to the reduction of the dose with distance: the inverse square law and the rapid absorption of radiation by air. At 1 km from the test, the dose from the initial flash was approximately 0.6 Sv/kT of yield. Each additional kilometre reduces the dose by a factor of 0.05 due to absorption of radiation in air times the inverse square term. Thus at 2 km the dose was 7.5 mSv/kT, at 3 km 0.17 mSv/kT and beyond 5 km, less than 1 μSv/kT. Except for the Indoctrinee Force at Buffalo, most observers received doses of less than 1 μSv as they were too far from the test devices to receive large exposures.
Doses for personnel within structures such as tanks or slit trenches were further reduced by the shielding provided by these structures.
Figure 6.1 shows the reduction of radiation dose with distance for the five Australian series. D/Y is the measured radiation dose per kiloton yield for the weapons tested.
0.00001
0.0001
0.001
0.01
0.1
1
10
100
1000
0 0.5 1 1.5 2 2.5 3 3.5 4 4.5
Distance (km)
D/Y
(Sv
per k
T)
H T M B A
Glossary and common acronyms 73
Figure 6.1 Measurements of the variation of the prompt dose (Sv) with distance (km) per unit yield (kT) for the Hurricane (H), Totem (T), Mosaic (M), Buffalo (B) and Antler explosions (A)
6.4.2 Ground deposit
Where primary records for the external doses received are unavailable, estimates can be made from other information such as measurements of the levels of radioactive materials deposited on the ground. The calculations rely on computer modelling of the radionuclide composition of the fallout on the ground. This provides a way of estimating the dose to a person standing at the centre of a contaminated region of several metres or more in radius. A well-established computer code (Wise and Moroney 1992) was used to calculate the activities of the components of fallout at different times after fission. The model and the way it can be used is described in more detail in the Addendum, but the steps in the model are in the following sequence:
1. A list of the radionuclides produced in fission of 239Pu is generated; there are over 500 of these. They are derived from Crouch (1969), which gives the amounts of each radionuclide produced in fission of 239Pu (assumed to be the fuel for all tests). In addition, the unconsumed plutonium fuel is included, together with induced radionuclides from irradiation of the uranium tamper (Gaskell and Saxby 1956). The fraction of plutonium consumed is secret, but 12% has been adopted herein. The calculations assume that no fractionation occurs during the formation of the fallout particles.
2. The decay of each of the radionuclides is calculated. Each radionuclide has its own half-life (Meek and Rider 1974). These known half-lives are applied to each of the radionuclides, so that at any time after the detonation the proportions of each radionuclide in the mixture of fission products, unconsumed fuel and activation products are calculated. This calculation also includes the growth of radionuclides formed from the decay of other radionuclides.
3. Knowing the quantities of each of the radionuclides present at any given time enables estimates to be made of expected radiation dose rates where they have not been measured or personnel exposure records are not available. For each radionuclide, tables are available showing the radiations emitted, the energies of those radiations, and the resulting dose rate from a unit quantity. These are then applied to the mixture of radionuclides derived in 2 above to give the overall external dose rate.
The application of the model to estimations of the internal hazard is described in Section 6.5. The results of these calculations are shown in Table 6.3. They are based on a unit ground deposit of 1 MBq/m2, air concentrations of 1 kBq/m3 for inhalation, and an intake of 1 kBq for ingestion. These results can be scaled as required for other deposits or concentrations.
74 Australian participants in British nuclear tests in Australia — Vol 1: Dosimetry

Table 6.3 Factors used to derive activities, dose rate or integrated dose at different times following an explosion (the table allows for fission products from 239Pu, activation products induced in 238U tamper and unburnt 239Pu fissile material)
Time post fissionBq for 104 fissionsc
External effective dose rate (µSv/h)a Integrated doseb
(µSv) for 1 MBq/m2 at H + 1 h
1 MBq/m2 at H + t h
Initial deposit of 1 MBq/m2 at H + 1 hc
0.5 h 4.39 1.85 4.37 9.941 h 1.86 2.12 2.12 8.312 h 0.57 2.74 0.84 6.835 h 0.185 2.21 0.22 5.236 h 0.161 1.97 0.17 5.0412 h 0.097 1.45 0.076 4.30
1 d 0.057 1.19 0.037 3.622 d 0.0325 1.02 0.018 2.975 d 0.0124 1.01 0.0068 2.0810 d 0.00407 1.24 0.0027 1.5120 d 0.00116 1.54 0.00096 1.0750 d 0.000377 1.29 0.00026 0.63100 d 0.000166 1.08 9.6 10-5 0.41200 d 6.2 10-5 1.01 3.4 10-5 0.26
1 y 2.54 10-5 0.60 8.2 10-6 0.172 y 1.09 10-5 0.33 1.9 10-6 0.135 y 2.69 10-6 0.46 6.7 10-7 0.0910 y 1.32 10-6 0.63 4.5 10-7 0.07a Derived from Eckerman and Ryman (1993)b Integrated dose from time shown; this is the dose that would be received by an individual remaining indefinitely at a location contaminated with 1 MBq/m2 (measured at H + 1 h) from the time shown in column 1.c The notation 10-5 means 0.00001 and 104 is 10 000.
It is important to note that the activities and the dose rates associated with a contamination level of 1 MBq/m2 at H + 1 hour25 decrease steadily with increasing time. One rule of thumb indicates that the activity decreases by a factor of ten when time increases by a factor of seven so that, for example, the activity at the end of one week is ten times smaller than at the end of one day. Mathematically, this corresponds to the activity being proportional to t-1.2 where t is the time after the test in hours. The activities and dose rates in columns 2 and 4 of Table 6.3 behave similarly, with the trend lines being proportional to t-1.25 and t-1.3, respectively. These are in acceptable agreement with the ‘rule of seven’. However, careful analysis shows that individual values can be as much as 50% higher or lower than the trend line. This departure from the trend is due to the dominance of two radionuclides: 239U during times up to 2 hours after fission, and 239Np for up to 10 days afterwards.
The rule of seven is not used in this report.
Table 6.3 provides the basic data used for estimating radiation exposures for the scenarios described later in this chapter.
25Terms such as H + 1 hour and D + 1 day are taken from the original reports. They refer to times in hours (H) or days (D) from the moment of detonation. Sometimes a numerical subscript (1, 2, …) is included with the letter to show that the times were after the first, second, … explosions of a particular series.
Glossary and common acronyms 75

6.4.3 External exposure to airborne radionuclides
In addition to the external dose from deposition on the ground, there will be some contribution to external dose from radionuclides that have become airborne. However, with one exception, this additional dose can be ignored, as in general the external doses from airborne radionuclides are very much smaller than the internal dose received from inhaling these radioactive materials.
The exception was when fallout clouds were sampled during aircraft flights; the aircrew were exposed to external radiation from radioactive particles in the cloud.
The resulting doses are discussed in Chapter 7.
Factors used to derive activities, dose rate or integrated dose at different times following an explosion (Table 6.3)
The external dose rates and integrated doses given in Table 6.3 are for gamma radiation.
Column 1 lists time in hours, days or years after the explosion.
Column 2 gives the amount of radioactive material generated by the fission of 10 000 atoms of 239Pu, which remains at the time listed in column 1. The choice of 10 000 atoms as the ‘unit quantity’ of fission is arbitrary and used only as the basis of calculation. The amount of material calculated includes fission products, unburnt (unfissioned) 239Pu and the radioactivity induced in the weapon debris.
Column 3 gives the dose rate from a hypothetical constant surface contamination level of 1 MBq/m2. It has been produced to enable calculation of potential dose rates at different times after the explosion. Because the mixture of radionuclides changes with time, the dose rate also changes over time. In some instances, the dose rate increases at least temporarily. At 0.5 hours after the explosion, a level of 1 MBq/m2 would generate a dose rate of 1.85 Sv/h. Five hours after the explosion, the same level of surface fallout would give a dose rate of 2.21 Sv/h. Between 1 and 10 days after fission, a major contributor to the external dose rate is 239Np, which has a half-life of 2.36 days and emits beta particles (239Np decays into 239Pu). As the neptunium decays, so the relative contribution from gamma-emitting radionuclides increases. In practice, the total level of radioactivity is decaying and the dose rate falling accordingly.
Column 4 gives the dose rate from external radiation from an initial deposit, 1 hour after the test, of 1 MBq/m2. As this material undergoes radioactive decay, the dose rate falls at a similar, though slightly faster, rate than the decay shown in column 2.
Column 5 shows the theoretical total dose in µSv for an individual who remains at a location, from the times shown in column 1 until all activity has decayed away. This information can be used to calculate the external radiation dose over a time interval. For example, the radiation dose received over 10 hours, from 2 hours to 12 hours after fission, is: 6.83 – 4.30 = 2.53 µSv.
The values of 10 000 atoms of 239Pu and 1 MBq/m2 are purely notional, and have been used to indicate the methods of calculation.
76 Australian participants in British nuclear tests in Australia — Vol 1: Dosimetry

6.5 Assessment of internal doses
Internal radiation exposures cannot be determined directly, but must be calculated from estimates of radionuclide intakes. Where measurements of air concentrations or radionuclide concentrations in food or water are available, the estimation of intake is relatively straightforward, using standard breathing or consumption rates. However, such measurements are seldom available and estimates have to be made by other means, such as calculating the activity in a cubic metre of air from the activity in a square metre of ground surface. An assessment of internal doses requires information on the time spent performing specific tasks and the probable intakes of radioactivity during that time.
6.5.1 Inhalation
The doses from the inhalation of a unit quantity (1 kBq) of the fallout mixture have been calculated for differing times after fission and are listed in Table 6.4.
Table 6.4 Factors for deriving effective dosesa from inhaling or ingesting a mixture of fission products, unburnt 239Pu and induced nuclides from the 238U tamper
Time Bq for Effective dose for inhalationa Ingestionb
post fission 104 fissionsc µSv for 1 kBq/m3 over 10 hd µSv 1 m 5 m 10 m for 1 kBq
0.5 h 4.39 1.3 1.6 1.4 0.11 h 1.86 2.4 2.7 2.3 0.12 h 0.57 6.2 6.5 5.3 0.35 h 0.185 15 15 12 0.66 h 0.161 16 16 13 0.612 h 0.097 22 22 17 0.8
1 d 0.057 28 28 21 1.02 d 0.0325 33 34 26 1.15 d 0.0124 56 52 37 1.210 d 0.00407 89 77 54 1.620 d 0.00116 196 147 98 2.150 d 0.000377 452 307 188 1.5100 d 0.000166 882 588 356 1.5200 d 6.2 10-5 2130 1412 857 2.3
1 y 2.54 10-5 4831 3212 1964 3.62 y 1.09 10-5 10481 7031 4346 5.25 y 2.69 10-6 39 945 27 026 16 861 11.910 y 1.32 10-6 80 980 54 878 34 277 21.3a See the glossary for an explanation of committed dose.b Based on ICRP conversion factors (1995, 1996, 1998)c The notation 10-5 means 0.00001.d Based on a continuous breathing at a rate of 3 m3/h
The initial steps in the model described above in Section 6.4 are used.
Published tables have been used that show, for each radionuclide, the dose (strictly, the committed effective dose) resulting from the inhalation of a unit quantity of fission products (ICRP 1995, 1996, 1998).
Glossary and common acronyms 77

These tables include factors for the type and energy of radiation emitted by the radionuclide, the size of the particles inhaled, their solubility in lung fluid, the organs in which they may accumulate in the body, the radiosensitivity of those organs, and the length of time that they are retained. The tables allow for contributions from radionuclides that remain in the body for 50 years after intake. These factors are applied to each of the radionuclides present in the inhaled or ingested mixture.
By following the steps outlined above, the dose from ingestion of a unit quantity of the can also be calculated (see Section 6.5.2). Similar tables to those for inhalation are available for ingestion.
In order to calculate the internal doses from inhalation, it is necessary to know the particular mixture of radionuclides present. This is rarely available from monitoring data, and the approach that has been adopted is to use the results of the modelling described in Section 6.4.
Dose conversion factors include allowances for retention, excretion and decay of the inhaled radioactivity for 50 years after exposure. Table 6.4 shows the dose from the inhalation, for 10 h/day, of 1 kBq/m3 of fission products. The particle sizes used are one micron 1 m, 5 m and 10 m AMAD and the breathing rate used is that for an adult working heavily (3 m3/h).
In the following calculations, an AMAD of 5 µm had been adopted as being most representative of the particle sizes of close-in fallout. The fission product mixtures are assumed to be unfractionated (i.e. they are not affected by enhancement of volatile or refractory chemical elements in the fission product mixture). As a generality, internal doses depend on the chemical solubility, in body fluids, of the radionuclides involved. The solubility factor that generated the largest computed dose was used throughout these calculations.
The overall inhalation hazard decreases with time as the total quantity of radioactivity falls following the decay of the (mostly short half-life) fission products. However, after the first three months, the dose conversion factors increase markedly with time. This is largely due to the unburnt nuclear fuel. The very long half-life of 239Pu (24 000 years) means that its relative contribution to dose increases markedly as the fission products decay. This important point is discussed further in Section 6.5.4 and shown in Table 6.5.
Table 6.5 Decrease over time of external and inhalation doses from a ground deposit
Time since detonation
Activitya (MBq/m2)
External dosea (mSv/d)
Inhalation doseb (mSv/d)
Total dose (mSv/d)
Percentage of inhalation dose in total dose
1 d 84. 1.000 0.023 1.02 2%5 d 18. 0.18 0.010 0.19 5%20 d 1.71 0.026 0.003 0.028 9%50 d 0.56 0.007 0.002 0.009 20%200 d 0.09 0.001 0.001 0.002 58%a The entries in columns 2 and 3 are derived from Table 6.3.b Derived from Table 6.4, calculated on the basis of a 10-hour day exposure, assuming a resuspension factor of 10-5, and an AMAD of 5 microns
78 Australian participants in British nuclear tests in Australia — Vol 1: Dosimetry

Factors for deriving effective doses from inhaling or ingesting a mixture of fission products (Table 6.4)
Column 1 gives time in hours, days or years after the explosion.
Column 2 gives the amount of radioactive material, generated by the fission of 10 000 atoms of 239Pu, that remains at the stated time. This includes fission products, the unburnt 239Pu and the radioactivity induced in the weapon debris.
Columns 3–5 give the (committed) dose (in µSv) that would arise from inhalation of air containing 1 kBq/m3 for 10 hours, at each particular time. The dose is given for three values of dust particle diameter (AMAD) — 1, 5 and 10 microns. A diameter of 5 microns was used in this study (see Section 6.5.1). Note that this dose figure increases over time. This is because the figure is calculated for a fixed concentration of 1 kBq/m3. In practice, the concentration will decrease as the radioactivity decays, at a rate equivalent to the decrease shown in column 2. Consequently, the resulting dose will decrease with time.
Column 6 gives the (committed) dose resulting from ingesting 1 kBq of fallout at the time given in column 1. Again, this figure increases with time as it is calculated for a fixed intake of 1 kBq; in practice, the dose will reduce because the activity will be decaying away.
As in the earlier examples, the values of 10 000 atoms of 239Pu, 1 kBq/m3 air concentration and 1 kBq ingestion are purely notional, and used for the purposes of calculation.
6.5.2 Ingestion
Internal radiation doses following the ingestion of radioactive materials are calculated in much the same way as described for inhalation dose estimates.
Column 6 of Table 6.4 lists the doses that have been calculated following the ingestion of a ‘unit’ quantity of 1 kBq. As with the calculations of inhaled radiation exposures, the chemical form of the element that generates the largest dose was used.
The main pathway for ingestion has been taken to be the transfer of radioactive material from soil to hands, then from hands to mouth. Measurements of soil ingestion rates or adherence of dust to hands have been reported in the literature (LaGoy 1987, Holmes 1999). They indicate that the average soil ingestion rates are in the range of 25 to100 mg/day. The total amount of soil particulates that become suspended in air depends on the tasks being undertaken.
For the purpose of these calculations, it has been assumed that, during heavy work such as digging or filling sandbags, the mass of dust suspended in air is 10 mg/m3. It is also assumed that the adherence properties of fallout particles on the hands and the subsequent fraction transferred to the mouth and ingested are the same as those reported for ordinary soil.
Using the figures from LaGoy and Holmes referenced above, for adherence to hands and transference of between 25 and 100 mg/day, an average surface contamination of 1 MBq/m2 would lead, in very dusty conditions with an air concentration of 10 mg/m3,
Glossary and common acronyms 79

and a resuspension factor of 10-5/m, to an ingestion of between 0.025 and 0.1 kBq per day.
During the first 100 days after the explosion, the dose calculated for ingestion, for those participants working in very dusty conditions, is approximately 2% of the external radiation dose. From 100 days onwards, the ingestion dose increases relative to the external dose, but by then the inhalation dose has become increasingly the dominant contributor to radiation dose and ingestion remains a relatively small contributor to the overall exposure. The ingestion pathway can be ignored without affecting the overall dosimetry outcomes.
6.5.3 Absorption through cuts and skin
Another possible pathway by which radioactive materials may enter the body is via cuts and wounds. In radiation safety practice, this is usually considered a relatively low risk as experience has shown that any radiation dose from this source would be negligible. The calculation of any such dose is very difficult. One approach is to assume that all the activity stays in the wound and the surrounding tissue receives a radiation dose as the radioactive contamination decays. Recent research (Guilmette and Durbin 2003) has shown that retention of the radioactivity in the wound depends on the chemical properties of the different elements involved. Fission product radionuclides appear to be strongly or avidly retained in wounds. If contaminants less than a few weeks old are retained in a wound, then the dose to soft tissue from 1 cm2 of contamination is of the order of 0.5% of the external dose. For times of more than a year after the test, the plutonium component may become of more concern. The dose from 239Pu in the wound would be comparable to the dose from inhalation of contaminants over one 10-hour working day. The probability that contamination would enter the body via a wound is considerably smaller than via inhalation; therefore, the contribution of the wound pathway to the overall dose has been taken to be negligible and not included in the final dose assessments.
6.5.4 Relative contributions to the dose
As time increases after the nuclear explosion, radiation doses fall, but the relative importance of the different source terms alter and the significance of different pathways change. Each contribution to radiation exposures has to be computed by making allowance for the changing conditions.
The factors given in Table 6.4 can be used to convert a total activity concentration in air to an inhalation dose at a given time or to convert ingested radioactivity to an estimate of the ingestion dose. At any given location, the levels of radioactivity decrease with time and the mix of radioactive materials changes as the radionuclides decay. The inhalation and ingestion dose components at different times can be compared to the external dose by using the method and assumptions discussed in Section 6.6.2.
For example, assume a task is carried out over a 10-hour day on different days after fission and assume that a total of 100 units of dose are received on day D + 1. Figure 6.2 shows how, as a result of radioactive decay, dose components change relative one to another with increasing time after fission. Both the external and ingestion dose decrease with time, whilst the inhalation contribution declines less rapidly. At approximately one year, because of the increasing dominance of the contribution from 239Pu, the total dose rate from the contributions of external, inhalation and ingestion becomes almost constant
80 Australian participants in British nuclear tests in Australia — Vol 1: Dosimetry
at approximately 0.1% of that encountered at D + 1 day. The ingestion hazard is consistently a small component of the total dose.
Therefore, for time periods of less than D + 50 days, the inhalation and ingestion dose contributions can be neglected as the external dose dominates the total exposure. For time periods after D + 50 days, the inhalation dose component becomes increasingly more significant and has to be considered in any dose assessment.
The way the relative contributions from the various fallout components vary with time is shown in Table 6.5.
Table 6.5 illustrates how the doses from fallout received by an individual from a 10-hour exposure at a particular location will change over time. The first column shows how the activity at that point decays. The second column shows how, using data from Table 6.3, the external dose decreases from an initial value of 1 mSv per day, as the fission products decay.
The third column shows how, using data from Table 6.4, the dose from inhalation of fallout decreases with time. The activity is falling with time, but the dose per Bq increases as the fallout ages, mainly because of the increasing proportion of longer-lived radionuclides, particularly plutonium. The net result is that the dose from inhalation decreases, but more slowly than the external dose. Consequently, the percentage contribution from inhalation increases over time, and at 200 days is contributing 58% of the total.
However, it is important to note that by this stage the total dose is a small fraction of that received in the first few days after detonation; the (total) dose rate is approximately 0.2% of that on day one.
Figure 6.2 illustrates the figures derived in Table 6.5. The total activity inhaled contributes approximately 2% of the total dose at 1 day, approximately 6% at 10 days, approximately 35% at 100 days and approximately 58% at 200 days. At two years after fission, almost all the radiation dose is internal and received from inhaled activity.
Glossary and common acronyms 81

Figure 6.2 The relative contributions to the total dose as a function of time after fission
0.001
0.01
0.1
1
10
100
1000
0.1 1 10 100 1000 10000
Days post fission
Cont
ribut
ion
to d
ose
(rela
tive
units
)
External+Inhalation+Ingestion External External+Ingestion
Note: The external component (light line), external plus ingested components (dashed line), and all components including inhalation (heavy line) are shown. The values have been chosen to give a total of 100 at 1 day after fission. It can be seen that the external contribution is dominant up to approximately 20 days after fission whilst at one or more years after fission the inhalation component dominates.
It is important to note that, because of its long half-life, the contribution to the total dose from 239Pu via the inhalation pathway remains constant with time, whilst the contributions from most other radionuclides from all pathways decrease.
Figure 6.3 illustrates this phenomenon. At one day after a nuclear explosion, inhaled 239Pu contributes approximately 0.1% of the total dose, approximately 1% after 10 days, approximately 22% at 100 days and approximately 40% after 200 days. Two years after fission, almost all the radiation dose is internal and received from inhaled 239Pu.
82 Australian participants in British nuclear tests in Australia — Vol 1: Dosimetry

Figure 6.3 The relative contributions to the total dose as a function of time after fission for inhaled 239Pu (heavy line) and for all other sources excluding inhaled 239Pu (light line)
0.01
0.1
1
10
100
1000
0.1 1 10 100 1000 10000
Days post fission
Cont
ribut
ion
to d
ose
(rela
tive
units
)
Total excluding Pu-239 Inhalation Pu-239
Note: The values have been chosen to give a total of 100 at 1 day after fission. It can be seen that the contribution from the inhaled 239Pu remains constant while all other contributors decrease.
6.6 Examples of calculations to determine exposure doses
In this section, a number of examples are given to illustrate the methods used to estimate radiation doses. The examples are drawn from events or tasks that are known to have taken place during the major trials.
6.6.1 Exposure to initial flash
There were observers at all the major trials. With exception of the Indoctrinees (called I-Force) at the Marcoo test during Operation Buffalo, observers were all too far away to receive any radiation dose from the initial flash. The estimated radiation dose is less than one thousandth of a microsievert (0.001 μSv or 1 nSv; see Section 6.4).
For the Marcoo test, participants were positioned in a Centurion tank, and others in trenches with 0.9 m of soil cover, at 1.6 km from ground zero (GZ). Some Indoctrinees were in the open at 2.8 km from GZ.
The prompt radiation doses at these distances were derived from the data in Figure 6.1. Two Atomic Weapons Research Establishment (AWRE) documents were used to estimate the likely shielding factors for the men inside the Centurion tank (Janisch 1958) and those in covered trenches (Cave 1957). The results are shown in Table 6.6. The
Glossary and common acronyms 83

estimates obtained for the doses, including relevant shielding factors, are in agreement with the official estimates made at the time (see Table 7.11).
Table 6.6 Estimates of the dose from the initial flash for Marcoo in the Buffalo series
LocationYield(kT)
Distance(km)
Direct dose (mSv)
Shielding factor
Estimated dose(mSv)
Tank 1.5 1.6 63 5–20a 3–13Trench 1.5 1.6 63 100–150b 0.4–0.6Open 1.5 2.8 0.6 1 0.6a Estimated from data in Janisch (1958) for protection factors for men located at points C, D, F, G, J and K, as given in Figure 13 of the Janisch report, in tanks facing, broadside to and stern on to GZ.b Estimated from data in Cave (1957); the protection factor for an open trench is taken as 24 to 34 with a further protection factor of 4.5 provided by 0.9 m of cover giving the factor of 100 to 150 adopted.
I-Force members were placed in an army tank or a covered trench, and some were exposed in the open.
Column 5 shows the distance (in km) at which the exposure occurred and column 6 shows the dose (in mSv) that would have been received if there had been no shielding.
Column 7 gives the estimated shielding factors that were applied. The unshielded dose in column 6 was divided by the shielding factor in column 7 to give estimated doses in column 8.
6.6.2 General tasks
A number of engineering tasks were undertaken in and around contaminated areas, including cable laying, fence construction, installation and recovery of instrument bunkers, and sandbagging of equipment for its protection. These tasks were performed before and after major tests, and sometimes in areas contaminated by previous explosions.
The main pathways for exposure were external exposure, inhalation and ingestion. For the purpose of illustration, two situations are described:
long-term exposure in the RED area; in this scenario, it is presumed that, on average, the external dose rate was one tenth of the YELLOW area boundary rate (i.e. 0.01 mSv/h)
a single day’s work of 10 hours at the boundary of the RED and YELLOW areas (i.e. with external dose rate of 0.1 mSv/h).
The method of calculating daily doses is demonstrated in Table 6.7.
Doses have been derived for three different times after fission to show how the inhalation dose increases relative to the external gamma dose rate. It is assumed that the YELLOW area boundary was continuously being moved closer to GZ, as the external dose rate decayed. The work location moved steadily towards GZ such that participants worked in a constant external dose rate of 0.01 mSv/h. At D + 5, the dose contribution from inhalation is 0.005 mSv, whereas at D + 200 it is 0.14 mSv. This is because in these calculations a constant external dose rate has been adopted (i.e. the work location moved as the RED area boundary moved). This means that, while the external doses to the participants were constant throughout the period, the inhalation doses increased with
84 Australian participants in British nuclear tests in Australia — Vol 1: Dosimetry

time, as the relative contribution of plutonium to the dose became steadily more significant (see Section 6.5.4 and Figure 6.3 for a fuller explanation).
For the long-term scenario, the total dose derived from assuming 200 days’ work (from D + 1 to D + 200) in the RED area is obtained by adding the daily doses from each of the three pathways: external, inhalation and ingestion. The computed daily doses were then summed (integrated for the whole period).
The resulting total dose is approximately 40 mSv.
The assumptions made in this example are extreme as they are based on a person working in such an area for 2000 hours. It is considered very unlikely that any individual would have had this level of exposure.
For a single day’s exposure inside the YELLOW area, at a point where the external dose rate is ten times that in Table 6.7, the exposures from external and ingestion range from approximately 1 mSv to 0.02 mSv, while the inhalation dose ranges from approximately 0.05 mSv to 1.4 mSv per day depending on the length of time since the explosion.
Thus, a single day’s exposure ranges from approximately 1.07 mSv (on day D + 5) to 2.42 mSv (on day D + 200).
The higher dose estimate at D + 200 is due to the increased contribution from 239Pu relative to the external dose rate. It is important to recall that this increase is not an increase in the actual external dose rate at a fixed point — in fact, the dose rate at any point will be declining as the radionuclides decay.
The exposure in this example is the dose that would be received at a position where the external dose rate is 1 mSv per day. This point would have moved closer to GZ as time went by.
Glossary and common acronyms 85

Table 6.7 Worksheet showing the calculation of estimated daily doses from three pathways for land-based tests
External dosea
Dose rate adopted for RED area (one tenth of that at YELLOW boundary) 0.01 mSv/hTherefore, estimated external dose for 10-hour exposure per day 0.1 mSvInhalation doseApproximate dose rate for 1 MBq/m2 fission products, from Table 6.3 0.001 mSv/hTherefore, the approximate surface activity for 0.01 mSv/h 10 MBq/m2
Resuspension factor adopted 10-5/mTherefore, derived air concentration 0.1 kBq/m3
For a mixture of 5-day fission products plus unfissioned 239Pu and induced activityDose conversion factor µSv for 1 kBq/m3 for 10-hour exposureb 50Therefore, estimated inhalation dose for 10-hour exposure per day 0.005 mSvFor 100-day fission products plus unfissioned 239Pu and induced activityDose conversion factor µSv for 1 kBq/m3 for 10-hour exposure 590Therefore, estimated inhalation dose for 10-hour exposure per day 0.059 mSvFor 200-day fission products, plus unfissioned 239Pu and induced activityDose conversion factor µSv for 1 kBq/m3 for 10-hour exposure 1410Therefore, estimated inhalation dose for 10-hour exposure per day 0.14 mSvIngestion doseSurface activity in RED area as calculated above 10 MBq/m2
Activity ingested per MBq/m2 (Section 6.5.2) 0.1 kBqActivity ingested 1 kBqDose conversion factor for ingestion is less than 2 µSv/kBqEstimated ingestion dose per day 0.002 mSva It is assumed that the YELLOW area boundary was continuously being moved in closer to GZ, as the external dose rate decayed; thus the external doses to those involved would have remained constant as the boundaries changed.b For 5-day-old fission products with an AMAD of 5 µm from Table 6.4
The calculation of estimated daily doses from three pathways for land-based tests (Table 6.7)
The following notes are intended to guide the reader through the steps used to derive daily dose components.
Step 1. Estimation of airborne contamination level
In Table 6.3, surface contamination of 1 MBq/m2 generated a dose rate of 0.001 mSv/h.
Thus, a dose rate of 0.01 mSv/h is equivalent a contamination level of 10 MBq/m2 or 10 000 kBq/m2.
The resuspension factor adopted is 10-5 per metre.
Therefore, the airborne concentration would be 10-5 × 104 = 0.1 kBq/m3.
Step 2. Inhaled doses
For 5-day-old fission products, the dose conversion factor is 50 µSv for 1 kBq/m3 for a daily exposure of 10 hours, assuming an AMAD of 5 microns (column 4 of Table 6.4).
Therefore, for 0.1 kBq/m3, the inhalation dose would be 50 × 0.1 =5 µSv = 0.005 mSv/day.
For 100-day-old fission products, the dose conversion factor is 590.
86 Australian participants in British nuclear tests in Australia — Vol 1: Dosimetry

The inhalation dose would be 590 × 0.1 = 59 µSv = 0.059 mSv/day.
For 200-day-old fission products, the dose conversion factor is 1410.
The inhalation dose would be 1410 × 0.1 = 141 µSv = 0.141 mSv/day.
Step 3. Ingestion dose
Surface activity calculated in Step 1 is 10 MBq/m2.
Activity ingested per MBq/m2 (Section 6.5.2) is 0.1 kBq.
Therefore, activity ingested is 10 × 0.1 kBq = 1 kBq.
The dose conversion factor is less than 2 µSv/kBq.
Therefore, the estimated dose from ingestion is less than 0.002 mSv/day.
These calculations are based on a constant gamma dose rate from fission products. They show clearly the increasing relative contribution from the possible inhalation of plutonium.
Similar calculations are carried out in Tables 6.10 to 6.13.
Doses have been derived for three different times after fission to show how the contributions to inhalation dose increase relative to the external dose rate. It is assumed that the YELLOW area boundary was continuously being moved closer to GZ, as the external dose rate decayed. As the work location moved steadily towards GZ, it was possible that some participants worked in a constant external dose rate of 0.01 mSv/h.
From Table 6.7, it can be seen that at D + 5, the dose contribution from inhalation is 0.005 mSv, whereas at D + 200 it is 0.14 mSv. This means that while the external doses to those involved were constant throughout the period, the inhalation doses increased with time, as the relative contribution of plutonium to the dose became steadily more important (see Section 6.5.4 and Figure 6.3).
Table 6.8 shows how the dose components are summed to obtain a total exposure dose.
Table 6.8 Worksheet showing the calculation of estimated daily doses at three different times from three pathways for land-based tests (all doses in mSv)
Time post test External dose Inhaled dose Ingestion doseTotal dose (rounded)
5 d 0.1 0.005 0.002 0.11100 d 0.1 0.059 0.002 0.16200 d 0.1 0.140 0.002 0.24
For a long-term exposure, the total dose derived from assuming 200 days’ work (from D + 1 to D + 200) in the RED area (constant gamma dose rate of 0.01 mSv/h) is obtained by adding the daily doses from each of the three pathways above, and then summing (integrating) these over the whole period.
Glossary and common acronyms 87
If the worst case assumption is taken of a constant combined dose rate of 0.24 mSv/day, the resulting dose is approximately 50 mSv.
The assumptions made in this example are extreme, as they are based on a person working in such an area for 2000 hours, doing heavy work involving constant heavy breathing for 10 hours per day.
It is very difficult to envisage any individual having had this level of exposure.
For a single day’s exposure, where the external dose rate is ten times that derived in Table 6.7, the exposures from external and ingestion would be approximately 1 mSv and 0.02 mSv, while the inhalation dose would range from approximately 0.05 mSv to 1.4 mSv per day, depending on the time post explosion. Thus, a single day’s exposure in a constant dose rate of 0.01 mSv/h could range from approximately 1.07 mSv (on day D+ 5) to 2.42 mSv (on day D + 200).
The higher dose estimate at D + 200 is due to the increased contribution from 239Pu relative to the constant external dose rate.
6.6.3 Travel in yellow vehicles
There are some records of the levels of contamination of YELLOW active area vehicles. Measurements on the floor and cabins of the Land Rovers, using a 1320 counter,26 commonly showed readings of over 1000 cps (the upper limit of detection). It is assumed that the contamination entered the cabins of the vehicles on footwear and was in the form of discrete spots; therefore, the average level of contamination would be expected to be considerably less than the spot readings recorded. In addition, measurements on contaminated vehicles were made prior to any decontamination, thus representing worst-case conditions.
For this assessment, therefore, a mean reading of 250 cps has been assumed. Further, it was assumed that the vehicles were used for two hours per day over 200 days (i.e. for 400 hours). The corresponding external dose rate is based on a beta/gamma ratio of 4:1 (the 1320 monitor was most frequently used with the window open). Therefore, only 20% of the measured count rate is from gamma radiation.
In the calculations shown in Table 6.9, only gamma doses have been assessed to indicate the method of calculation. The beta dose would have been negligible given the distance between the location of the contamination and the drivers’ and passengers’ bodies.
The count rate to dose rate conversion factor, for a 1320 contamination monitor with the window closed, is that 100 cps equates to approximately 10 µSv/h at one metre above a 1 m2 surface contaminated with fresh fission products.27
Inhalation dose is calculated from the measured surface contamination in the vehicle. A measured count rate of 250 cps is approximately equivalent to 10 MBq/m2 on the surface. Using a resuspension factor of 10-5/m gives an air concentration of 100 Bq/m3. Using the figures in Table 6.3 for 20-day fallout, this equates to a dose rate from inhalation of 14 µSv/h, or approximately 0.5 mSv over the 400-hour exposure period considered. The 20-day age of fallout was used as the highest contamination levels were measured in this
26Information on the various instruments used during the UK program is given in Appendix 3.27Personal notes of JR Moroney entitled Turner’s measurements with 1320 and 1390, dated 17 June 1988.
88 Australian participants in British nuclear tests in Australia — Vol 1: Dosimetry

period. The concentration is probably an extreme overestimate, as the resuspension factors apply to large contaminated areas, whereas in this case the small area of the floor was contaminated. In addition, the ventilation in a moving vehicle would be extremely good, considerably reducing concentrations in the vehicle.
Table 6.9 Worksheet showing calculation of external dose from driving a contaminated vehicle
Mean cps for 1320 monitor, beta window open 250 cpsGamma cps per total cps, from γ : β = 1 : 4 0.2Therefore, mean cps from gamma radiation 50γ dose rate for 100 cps 10 µSv/hTherefore, derived dose rate is 5 µSv/hDose for 400 hours exposure 2 mSv
This calculation adopts the somewhat unrealistic scenario of the Land Rovers being contaminated to the same level each and every day of their use.
The records of contamination found in trucks were fewer than those for Land Rovers. However, where measurements were made, the floors of the Commer 3-ton trucks and the Morris 1-ton truck registered count-rates of 200 to 500 cps. Thus, the integrated doses would have been correspondingly lower than those estimated for travel in the Land Rovers (i.e. a range of 0.4 to 1 mSv).
The above calculation only includes radiation doses from contamination in the vehicle. When the vehicle is driven over contaminated areas, there will be additional dose contributions, internal and external, from the radioactivity on the ground and resuspended by the vehicle. These can be calculated using the methods described in Table 6.8.
In Section 6.6.2, it was calculated that, if an individual had worked for 2000 hours in an area with a contamination level that would result in a dose rate of 0.01 mSv/h at one metre above the ground, he/she might have received 50 mSv. For 400 hours of work in a similar area, the received dose would be one-fifth (i.e. 50 × 400/2000 mSv or 10 mSv). This would be a gross overestimate of any such exposure as it makes no allowance for any shielding provided by the vehicle or the distance above the ground of the driver or passengers.
During Antler, the vehicles were cleaned daily whenever possible and kept within the Health Control recommendations (Wells 1960). The estimates derived above for Buffalo conditions have been adopted.
There are limited data for contamination of YELLOW area vehicles at Operation Totem.
6.6.4 Marching through contaminated areas
A particular concern of participants has been the possible radiation dose from inhaling radioactive dust that was resuspended as a result of specific dust-raising actions. An example of this occurred with the Indoctrinee Force who, during Operation Buffalo, marched through an area contaminated with fallout. In this example, it is assumed that the men marched on day D1 + 3 through an area with an external dose rate of 3 mSv/h and that they marched for one hour over the contaminated ground.
Glossary and common acronyms 89

Table 6.10 shows the calculation of the external and internal dose components. As before, the external dose dominates the estimated inhalation and ingestion doses. The total calculated dose is 3.2 mSv.
Table 6.10 Worksheet for estimation of dose received marching through a contaminated area
Inhalation doseExternal dose rate assumed 3 mSv/h (0.3 R/h)a
Dose rate for 1 MBq/m2 of fission products deposit (Table 6.3)b 0.001 mSv/hEstimated ground deposit (1 MBq × 3 mSv/h/0.001 mSv/h) = 3 × 10⁹ Bq/m2 3000 MBq/m2
Resuspension factor 10-5/mAir concentration (3 × 10⁹ Bq/m2 × 10-5/m = 3 × 10⁴ Bq/m3 = 30 kBq/m3) 30 kBq/m3
Dose conversion factor in µSv for 1 kBq/m3 over 10 hours (3-day-old fission products) (Table 6.4 column 4)
40c
Dose for 10 hours of inhalation (assuming particles of 5 m AMAD) 40 × 30 = 1200 Sv
1.2 mSv
Derived inhalation dose on 1 h march 0.12 mSvIngestion doseEstimated ground deposit 3000 MBq/m2
Maximum activity ingested per MBq/m2 (Section 6.5.2) 0.1 kBqActivity ingested per day of 10 hours 300 kBqMaximum activity ingested on 1 h march 30 kBqDose factor for ingestion is approximately 1.2 µSv/kBqMaximum ingestion dose 0.04 mSvExternal dose3 mSv/h for 1 h 3 mSva In Table 7.11, an average dose of 3 mSv was derived for Indoctrinee Force members marching for one hour through the Forward Area 3 days after the One Tree test (i.e. a dose rate of 3 mSv/h).b The dose factors derived in Table 6.3, column 3 show that, post fission, a surface contamination level of 1 MBq/m2 corresponded to dose rates (mSv/d) of 1.02 at day 2 and 1.01 at day 5.c In Table 6.4, committed inhalation doses were derived for days 2 and 5 of 34 and 52 respectively for a 10-hour working day; for day 3, a dose of 40 Sv has been inferred.
Table 6.10 shows the basic data and the calculating steps followed for estimating each dose component. Basic data used have been described in the text or obtained from tables given in this chapter. Each calculation step involves either a multiplication or a division using data from earlier tables (as in previous examples). In the first three rows, the external dose rate of 3 mSv/h is divided by the dose rate for a deposit of one million Becquerel per square metre (106 Bq/m2), to give the corresponding radioactive deposit on the ground surface.
The estimated total dose from the three pathways is:
External 3 mSv + Inhalation 0.12 mSv + Ingestion 0.04 mSv = 3.2mSv.
It is clear from this example that external radiation exposures would have been the major contribution to any radiation exposures incurred by men marching over contaminated ground.
6.6.5 Clean up task at Taranaki
During the Antler series, the Taranaki site was contaminated by fallout from the Biak test. A decision was made to remove the contamination by the use of mechanical sweepers (rotating brooms attached to the back of a Land Rover). At least two different people
90 Australian participants in British nuclear tests in Australia — Vol 1: Dosimetry
were used each day. Airborne radioactive contamination was monitored during the operation. The available data show that the maximum activity concentration from the sweeping occurred two days after the Biak test. This measurement allows the calculation of an upper limit for the inhalation dose.
A maximum film badge reading of 1.8 mSv was reported (McDougall 1958) and this figure can be used to estimate the average ground deposit in the area.
The following calculation shows that, as in the previous examples, for exposures to relatively fresh fission products, the inhalation dose and the ingestion doses are considerably less than the external radiation dose.
Table 6.11 Worksheet for the calculation of doses from sweeping operations at Taranaki
Inhalation doseMaximum air concentration on D2 + 2 2.2 kBq/m3a
Dose conversion factor µSv for 1 kBq/m3 over 10 hb 34Assume 12 h/day, giving a dose of (2.2 × 34 × 12/10 = 90) 90 µSvProtection factor from respiratorc 1Dose estimate 90 µSvIngestion doseResuspension factor 10-5/mEstimated deposit 220 MBq/m2
Activity ingested per MBq/m2 (Section 6.5.2) 0.1 kBqActivity ingested per day 22 kBqDose factor for ingestion is 1.1 µSv/kBqEstimated ingestion dose is 24 µSvExternal doseMaximum whole body dose from film badges approx. 0.18 r 1.8 mSva Derived from an air sample measurementb Table 6.4, column 4c In this calculation (i.e. it is assumed that the respirator provided no respiratory protection)
The calculation of doses from sweeping operations at Taranaki (Table 6.11)
Table 6.11 shows the basic data and calculating steps used to estimate each dose component. The basic data have been described in the text or obtained from tables given elsewhere in this chapter. As in earlier examples, each calculation step involves either a multiplication or a division. The first two rows of the table give the maximum activity concentration in air and the inhalation dose over 10 hours in Sv for 1 kBq/m3. Multiplication of these values and adjustment to 12 hours of exposure gives the prospective inhalation dose.
Working backwards from the measured external radiation dose using an appropriate dose conversion factor from Table 6.3, a surface contamination of 180 MBq/m2 was derived. This is in acceptable agreement with the 220 MBqm2 calculated from the maximum air concentration.
Total dose for sweeping operations at Taranaki is estimated to be:
External 1.8 mSv + Inhalation 0.1 mSv + Ingestion 0.02 mSv = 1.9 mSv
Glossary and common acronyms 91

6.6.6 Dose from the fallout plume
Some groups were exposed to the fallout plume outside the principal operational areas. In one instance, there was possible exposure to the fallout on the mainland near Onslow after G1, the first Mosaic test at the Monte Bello Islands.
A more complex example is the estimation of doses to members of Australian Health Physics teams who, during Operation Antler, located fallout boundaries by placing fallout samplers and cascade impactors in the field. This was done both before and during the time the fallout was expected.
Fallout at Onslow
Fallout deposit was measured at Onslow using the ‘sticky paper’ method. Estimates of fallout after G1 to 2100 hours on the day of collection, corrected for sticky paper using experimentally derived efficiencies, were 926 kBq/m2, that is, approximately 1 MBq/m2 on 17 May 1956 (i.e. D1 + 1) and 156 kBq/m2 on 18 May 1956 (D1 + 2) (Wise and Moroney 1992). Fallout deposits monitored at Onslow after G2 were relatively insignificant. To calculate the radiation dose, a level of 1 MBq/m2 was taken as the surface contamination at Onslow at D + 1 day. Measured air concentrations were small (< 30 Bq/m3 at 2100 hours on the day of collection) and therefore it can be assumed that the dose was dominated by external radiation. Note that no shielding factor, from buildings or other objects, is included in the calculations shown in Table 6.12.
Table 6.12 Worksheet showing the external dose estimation for the assumed deposit
External doseBq for 10 000 fissions at H + 1 h (taken from Table 6.3, column 2) 1.86 BqBq for 10 000 fissions at D + 1 d (taken from Table 6.3, column 2) 0.057 BqFallout deposit at D + 1 d (17 May 1956) 1 MBq/m2
Fallout deposit at D + 1 d, corrected to H + 1 ha 32.6 MBq/m2
Dose from H + 24 h, in µSv for 1 MBq/m2 at H + 1 h (from Table 6.3 row 7) 3.62Integrated dose from H + 24 h to infinity for deposit corrected to H + 1 hb 120 µSvExternal dose estimate 0.1 mSva From the first two rows, a division (of row 1 by row 2) shows that the ratio of activity at H + 1 h to that at D + 1 d (i.e. H + 24) is 1.86/0.057 = 32.6.b The dose from a unit of activity at H + 1 h (in microsievert) given in Table 6.3 is 3.62; thus multiplying that figure by the estimated activity at H + 1 h (i.e. 3.6 × 32.6) gives an estimate of the integrated dose (i.e. 120 Sv).
Table 6.12 shows the basic data and calculating steps for estimating each dose component. The basic data have been described in the text or obtained from tables given elsewhere in this chapter.
Dose to Australian Radiation Detection Unit (ARDU) members
An estimate has been made of the dose to ARDU members who entered the fallout plume at various times to define the extent of fallout, many miles from the range, during Operation Antler (Table 6.13). The maximum values of fallout deposit, corrected to H + 1 h, were:
Tadje — maximum concentration along Emu–Mabel Creek Road 444 MBq/m2
Biak — maximum fallout 16 km north of Ingomar 174 MBq/m2
Taranaki — maximum fallout on North–South Road 255 MBq/m2
92 Australian participants in British nuclear tests in Australia — Vol 1: Dosimetry

Table 6.13 Worksheet to estimate the external dose to Australian Radiation Detection Unit (ARDU) members from fallout boundary search tasks during Operation Antler
External doseActivity in deposit, corrected to H + 1 h (mean of the three locations) 300 MBq/m2
Dose rate at H + 12 h from 1 MBq/m2at measured at H + 1 h 0.076 µSv/hDose rate at H + 12 h for deposit 22.8 µSv/hDose for 8-h exposure from H + 8 h for 1 MBq/m2 180 µSvTherefore, three tests gives 0.5 mSv
Table 6.13 shows the basic data and calculating steps for estimating the external radiation dose. Earlier examples have shown that the largest radiation dose is from the external pathway.
Row 2 gives the dose rate at the middle of the exposure period for a million Becquerel per square metre of deposit at H + 1 h. Multiplying this by the deposit in row 1 gives the dose rate at the middle of the exposure period.
6.7 Reliability of the estimates
The methods outlined in this chapter provide guidance on the doses that may have been encountered by Australian participants in the British nuclear weapons test program. Whilst methods that would provide upper estimates of radiation doses have been preferred, additional work is required to find the possible range of values under various assumptions. This in turn provides an indication of the reliability of the derived results. Two methods that can be applied are:
sensitivity analysis, which examines the range of estimates when model parameter values are varied
uncertainty analysis, which uses the rules of error propagation to find the uncertainty of a particular estimate.
The emphasis in this section is on sensitivity analysis to identify those parameters that may strongly affect the estimates.
6.7.1 Factors affecting fallout composition
Information on the radioactive components in the fallout is essential for estimating the radiation doses from all sources and pathways. The radionuclides in fallout vary significantly with time after detonation and have a wide range of half-lives. The theoretical calculation of their growth and decay requires knowledge of the fissile materials used, the amount of each radionuclide produced, the half-lives of each radionuclide, their decay modes and time elapsed since fission. The composition of actual fallout is subject to a variety of physical parameters, such as the melting point of the chemical species, additional material drawn into the radioactive cloud, the size range of the particles produced and the distance of the fallout deposit from GZ, whether it has occurred at close-in, intermediate or global distances. Freiling et al (1965) and companion papers have reviewed the various mechanisms.
This report has used a computer program described more fully in Wise and Moroney (1992) and summarised in the Addendum. The primary data sources for the program are
Glossary and common acronyms 93
now at least three decades old; nevertheless, more modern data would not have any significant effect on the computed outcomes as the basic data on the decay behaviour of fission products were well established by the 1970s. However, the original program did not include an allowance for fissile material remaining after detonation. The Dosimetry Subcommittee does not have information on the precise efficiencies (percentage of fissile material consumed) of the weapons that were tested. A single reported value for the ratio of 103Ru to 239Pu in Mosaic fallout (Ellis et al 1957) gave an estimate of 12% efficiency for the Mosaic tests. The conversion factors presented in Tables 6.3 and 6.4 assume, therefore, that 88% of the initial weapon 239Pu was deposited with fallout. As shown in Table 6.4 and Figure 6.3, after 200 days the 239Pu becomes the major contributor to possible internal doses.
It is also assumed that all devices contained a 238U tamper. During fission, neutron capture by 238U produces 239U (half-life 24 minutes), which decays into 239Np28 (half-life 2.4 days). This in turn decays to 239Pu (half-life 24 000 years). The ratios of induced radionuclides to fission products were determined from measurement data obtained during the Totem series (Gaskell and Saxby 1956). The calculations in this report assume that the fallout debris is unfractionated.
6.7.2 External dose
The estimates of external dose rates assume that fallout rests on the soil surface. The dose rates were obtained by summing the products of the decay rates for individual radionuclides and applying published dose-rate conversion factors (Eckerman and Ryman 1993). The dose outcomes do not allow for the effects of surface roughness of the soil or for shielding by structures such as vehicle cabins or bunker walls that would reduce the dose rates. Longer-term changes, such as the binding of the radioactivity to soil particles or burial by wind driven soil, are also not included. Inclusion of these factors, if they could be determined, would reduce the estimated radiation exposures.
These calculations have assumed that 238U tampers were used in all tests and would have resulted in significant quantities of the neutron-induced radionuclides 239U and 239Np in the consequent fallout. These radionuclides emit relatively low-energy gamma radiation or have relatively low specific activity.
Some unpublished work by Moroney and Wise investigated the effect of fractionation on external dose rates and concluded that the effect was not great. Increases in or reductions of radionuclide proportions lead to corresponding changes in activities and dose rates from the radionuclides so that the dose rate per unit of deposited activity is not significantly affected by fractionation.
6.7.3 Inhalation dose
As shown in the examples given in Section 6.6, the estimated dose for inhalation of fallout debris is normally based on the activity of deposit on the ground surface. The concentration of radioactivity in air, in Bq/m3, is calculated by multiplying the resuspension factor, expressed per m, by the quantity of radioactive deposit, in Bq/m2. The amount of radioactive material inhaled is then obtained by multiplying the calculated air concentration by the volume of air inhaled in cubic metres.
28Neptunium-239.
94 Australian participants in British nuclear tests in Australia — Vol 1: Dosimetry

Determination of the radiation dose then requires the application of a dose conversion factor for each radionuclide (ICRP 1995, 1996, 1998). These in turn are dependent on the assumed AMAD and the solubility of the material. Where several values are given by ICRP for the dose conversion factor for a particular radionuclide, or combination of radionuclides, the factor generating the largest dose outcome was usually chosen. This will generally ensure that upper, rather than necessarily ‘best’, estimates of the dose have been derived.
The estimates of inhalation dose depend on the composition of the debris. In the examples used in this report, it has been assumed that unfissioned 239Pu is distributed with the fallout. For 12% fission efficiency, the figure derived by the UK authorities for one of the Mosaic bombs, the relative activity of 239Pu increases from approximately 0.001% at 5 days to approximately 6% at 10 years after the test. This relative increase in importance of 239Pu follows from the decay of the other radioactive elements. If the weapon efficiencies were higher, say 25%, the plutonium contribution to the inhalation dose would be approximately 20% lower. The source term that has the largest influence on the inhalation dose estimates is the resuspension factor. Throughout this report, a resuspension factor of 10-5/m has been used. This represents an upper limit for very dusty conditions caused by mechanical disturbances. This value is considerably higher than for uplift of contamination by simple wind action. Walsh (2002) has reviewed the literature on the use of resuspension factors for inhalation dose calculations. He reports that, empirically, the resuspension by wind of contamination falling on soil is time-dependent. Initially, the resuspension factor falls in proportion to the number of days since deposition and at longer times is less than 10-7/m (i.e. less than 1% of the figure used throughout the calculations presented here). The resuspension factor used has a very significant effect on calculated doses and their uncertainty. By adopting a resuspension factor of 10-5/m, some inhalation dose outcomes could be overestimated one-hundredfold.
In this report, it has been assumed that all exposures to contaminants raised by mechanical means were from activities such as digging, bulldozing or sweeping. It is also assumed that these extreme working conditions were maintained for the duration of the task. Lower dose estimates would be obtained for those situations where the contaminants are made airborne by other less extreme mechanisms.
The breathing rate of 3 m3/h adopted in this report corresponds to the internationally accepted rate for someone undertaking heavy exercise (ICRP 1995). In practice, it is unlikely that this breathing rate could be maintained for long periods. A more representative value for longer work periods, especially in the conditions prevailing in the test area, might be similar to that for light exercise (i.e. 1.5 m3/h), which would reduce the dose estimates for inhaled radionuclides by a factor of two.
The effect of changing the AMAD and the composition of the debris is approximately ±20% (see Table 6.4, columns 3, 4 and 5).
6.7.4 Ingestion dose
The methods used to estimate the ingestion doses can only offer a guide to their likely magnitude. For a range of occupations, the observed burdens of soil on the hands is less than 1 mg/cm2 (Holmes et al 1999), whilst the average mass of dust ingested by construction workers can range from 25 to 100 mg/d (LaGoy 1987). In this report, the higher value has been used for the average mass of soil ingested. Adoption of any lower value would lead to dose estimates up to four times lower. There are no data on whether
Glossary and common acronyms 95

fallout particles adhere on the hands more readily than soil dust or if fallout can be more easily transferred from hands to mouth, but there does not appear to be any logical reason why this would be so.
6.8 References
Carr JA (1957). Gamma radiation measurements, AWRE Report T38/57, Atomic Weapons Research Establishment, Aldermaston.
Carr JA (1958). Gamma dose-distance measurements, AWRE Report T34/58, Atomic Weapons Research Establishment, Aldermaston.
Cave L (1957). Measurement of the protection against gamma radiation afforded by slit trenches at Operation Totem, AWRE Report T6/67, Atomic Weapons Research Establishment, Aldermaston.
Crouch EAC (1969). Calculated independent yields in the thermal fission of 233U, 235U, 239Pu, 241Pu and in the fission of 232Th, 238U and 240Pu, Atomic Energy Research Establishment Report AERE-6056, Atomic Energy Research Establishment, Harwell, UK.
Eckerman KF and Ryman JC (1993). External exposure to radionuclides in air, water and soil, Federal Guidance Report 12, United States Environmental Protection Agency, Washington.
Ellis SC, Morgan DTG and Thomas DMC (1957). Operation Mosaic: final report on naval measurements, Admiralty Research Laboratory Report ARL/R4/C791, Admiralty Research Laboratory, Teddington (UK).
Freiling EC, Crocker GR and Adams CE (1965). Nuclear Debris Formation. In: Radioactive Fallout from Nuclear Weapons Tests, Proceedings of the Second Conference, Germantown, Maryland, November 3–6, 1964, Atomic Energy Council Symposium Series 5, Oak Ridge, Tennessee.
Gaskell WTM and Saxby WN (1956). The survey of residual contamination from Operation Totem, AWRE Report T4/55, Atomic Weapons Research Establishment, Aldermaston.
Guilmette RA and Durbin PW (2003). Scientific basis for the development of biokinetic models of radionuclides-contaminated wounds. Radiation Protection Dosimetry 105:213–217.
Hole JA (1957). Radiological Group report, AWRE Report T21/57, Atomic Weapons Research Establishment, Aldermaston.
Holmes KK Jr, Shirai JH, Richter KY and Kissel JC (1999). Field measurement of dermal soil loadings in occupational and recreational activities. Environmental Research A80:148–157.
96 Australian participants in British nuclear tests in Australia — Vol 1: Dosimetry

ICRP (International Commission on Radiological Protection) (1995). Age-dependent doses to members of the public from intake of radionuclides: Part 4, Inhalation dose coefficients. ICRP Publication 71, Annals of the ICRP 25:3–4, Pergamon, Oxford.
ICRP (International Commission on Radiological Protection) (1996). Age-dependent Doses to Members of the Public from Intake of radionuclides: Part 5, Compilation of Ingestion and Inhalation Dose Coefficients. ICRP Publication 72, Annals of the ICRP 26:1, Elsevier Science, Oxford.
ICRP (International Commission on Radiological Protection) (1998). The ICRP Database of Dose Coefficients: Workers and Members of the Public, CD-ROM software version 1.0, October 1998, Elsevier Science, Oxford.
Janisch DBB (1958). The shielding afforded from initial radiation by fieldworks and AFVs, AWRE Report T3/57, Atomic Weapons Research Establishment, Aldermaston.
LaGoy PK (1987). Estimated soil ingestion rates used for risk assessment. Risk Analysis 7(3):355–359.
Linsley GS (1978). Resuspension of the transuranium elements — a review of the existing data, NRPB report NRPB-75, National Radiological Protection Board, Didcot.
McDougall WG, Rexford-Welch SC and Douglas K (1958). Operation Antler: Health Physics Services, UKAEA Report T45/58, Atomic Weapons Research Establishment, Aldermaston.
Meek ME and Rider BF (1974). Compilation of fission product yields, Vallecitos Nuclear Center Report NEDO-12154-1, General Electric Company, Vallecitos Nuclear Center, Pleasanton, California (unpublished).
National Research Council (1995). Radiation dose reconstruction for epidemiological uses. Committee on an assessment of CDC radiation studies, National Academy of Sciences, Washington DC.
National Research Council (2003). A review of the dose reconstruction program of the Defence Threat Reduction Agency. Committee to review the dose reconstruction program of the Defence Threat Reduction Agency, National Academy of Sciences, Washington DC.
National Council on Radiation Protection and Measurements (1998). Evaluating the reliability of biokinetic and dosimetric models and parameters used to assess individual doses for risk assessment purpose. NCRP Commentary 15, National Council on Radiation Protection and Measurements, Bethesda.
Turner OH (1963). October Health Physics Report, Maralinga 1963.
Walsh C (2002). Calculation of resuspension doses for emergency response, NRPB report NRPB-W1, National Radiological Protection Board, Didcot.
Glossary and common acronyms 97

Wells H, Sinclair K and Shore J (1960). Operation Antler: Decontamination group report, AWRE report T7/60, Atomic Weapons Research Establishment, Aldermaston.
Williams GA, Martin LJ and Long SA (2002). Inhalation dose assessment for remediated land at Maralinga. Unpublished Australian Radiation Protection and Nuclear Safety Agency (ARPANSA) report, ARPANSA, Melbourne.
Williams JH (1956). Naval radiological measurements on Operation Totem, Final Report, Part III. The response of fluorescent glass flash dosimeters, AWRE report T9/56, Atomic Weapons Research Establishment, Aldermaston.
Wise KN and Moroney JR (1992). Public health impact of fallout from British nuclear weapons tests in Australia, 1952–1957, Australian Radiation Laboratory Report ARL/TR105, Australian Radiation Laboratory, Melbourne.
98 Australian participants in British nuclear tests in Australia — Vol 1: Dosimetry

7 Results
Summary
This chapter takes the information and procedures discussed in previous chapters and applies them to actual Australian work groups and their tasks at the tests, in order to estimate the radiation doses that they could have received. Calculations have been done for each of the five major test series, the minor trials and other activities carried out after the major trials finished. The RAAF involvement in cloud sampling and aircraft decontamination is assessed in a separate section.
Radiation doses were assigned in five categories, A to E, with A receiving very low or no dose, and E the highest. Where there was not enough information to decide on a dose category, F was assigned; see Table 6.1(a). A table determined by the Exposure Panel that sets out exposure categories by work group for study participants is in Appendix 1.
For Operation Hurricane (Monte Bello Islands), most Australians received doses in the lowest categories A or B. The major groups receiving higher doses were members of the Joint Services Training Unit (JSTU) who entered contaminated areas (categories C to E) and crews from HMAS Koala and HMAS Hawkesbury (category C).
For operation Totem (Emu), the most exposed group was the Radiation Hazards Group (category D). Others, including Peace Officers, who entered contaminated areas or traveled extensively in contaminated vehicles over contaminated ground, may have received doses that placed them in category C.
For the Mosaic tests (Monte Bello Islands), all doses received by Australians were considered to be in the A or B categories.
With the exception of a small number of RAAF aircrew, the most highly exposed groups at Buffalo (Maralinga) included elements of the Maralinga Range Support Unit (MARSU) and the Indoctrinee Force at One Tree (category C). Australian Indoctrinee Force members at Marcoo received lower doses (category A).
Peace Officers who worked on the Maralinga Range from Operation Buffalo through to the shut-down of the range could have received radiation exposures in category D.
For the final major trial series, Antler (Maralinga), the most highly exposed ground-based groups were members of MARSU engineering and recovery teams with doses in the C category.
For the minor trials and other activities after Antler, a number of groups involved in radiation monitoring and decontamination and some members of MARSU received doses in categories C and D.
Some RAAF aircrews that flew through the radioactive clouds in RAF Canberra aircraft could have received doses in the D and E categories. Ground crews involved in decontaminating those aircraft are estimated to have received doses in category B.
99

In all cases, where individuals were present for several series, or were exposed doing several tasks at one series, the doses were combined to give a total exposure category; see Table 6.1(b).
Overall, the doses received by participants were small. Seventy-nine per cent of participants received exposures in the lowest dose category. Only 4% of participants received more than the current Australian annual dose limit for occupationally exposed persons (20 mSv).
These results were compared with those from an independent study of doses to British participants in the tests in Australia (Muirhead et al 2003). There is good general agreement in the doses received, although some British participants appear to have received somewhat higher doses than the most highly exposed Australians (UK 210 mSv vs Australia 133 mSv).
7.1 Introduction
This chapter addresses the tasks carried out by Australian participants and assesses those activities that could possibly have led to radiation exposures in category B and above. The tasks varied with each test series, and the potentially exposed participants also changed from series to series.
The tasks performed at each test series are reviewed, and the radiation doses received by the participants performing those tasks are estimated. The doses are derived from contemporary monitoring results where available, and, particularly for internal exposures, on the results of the modelling described in Chapter 6. This review included an assignment of estimated radiation exposures into the six exposure categories listed in Table 6.1(a).
As experience was gained in the conduct of the atomic tests up to and including Operation Buffalo, the management of the tests and the control of radiation exposures improved. However, there is some evidence that for Operation Antler the implementation of safety procedures was less effective, as, by 1957, UK attention was increasingly focused on Operation Grapple, the thermonuclear weapons tests carried out on Malden and Christmas Islands in the Pacific Ocean.
The sampling of radioactive clouds by aircraft and the subsequent decontamination of those aircraft resulted in exposure situations, to both air and ground crews, that were markedly different from the other exposure situations in the various test series. For this reason, they are considered separately in Section 7.8.
This chapter considers exposures during each of the major test series followed by an assessment of the impact of the minor trials. In each section, the groups likely to be of interest are discussed, followed by consideration of the tasks performed by those different groups. This analysis provided indications of situations where significant radiation exposures could have occurred.
Finally, the dosimetric aspects of the tasks were examined to provide guidance on the estimated radiation doses received. The exposure categories are discussed in Chapter 6. More than four decades have elapsed since the completion of the major tests and minor trials. This has meant that in some cases insufficient information could be found to enable any dose estimates. Those tasks have been designated as category F (exposure unknown).
100

Wherever possible, the number of missing exposure estimates was reduced by drawing on historical records of exposures for individuals or groups known to have performed similar tasks and assessing doses by analogy.
7.2 Operation Hurricane
7.2.1 Groups potentially exposed
As Hurricane was primarily a military operation, the Australian participants were drawn from the Royal Australian Navy, the Australian Army and Royal Australian Air Force.
Some civilians were present, but with the exception of Professor EW Titterton,29 they were either associated with meteorological forecasting or acted as observers and were not exposed to either an internal or external radiation hazard.
Operation Hurricane time line
A time line to assist the understanding of where Australian groups were at Operation Hurricane is given in Table 7.1.
29Professor of Physics at the Australian National University and also later chairman of the Atomic Weapons Tests Safety Committee.
Glossary and common acronyms 101

Table 7.1 General time line for Operation HurricaneDate Days post-test EventPre-test Ships were anchored beyond the imposed 16 km limit or taking up
position on the perimeter of the 160 km exclusion zone3 Oct 1952 at 0800ha
0 25 kT submarine atomic weapons test at a point off the west coast of Trimouille Island
Pre- and post-test
Patrols by HMAS Culgoa, HMAS Macquarie, HMAS Sydney, HMAS Shoalhaven, HMAS Tobruk, HMAS Warreen, HMAS Reserve and HMAS Murchison
3 Oct 1952 0 HMAS Koala entered lagoon3 Oct 1952 H + 16.5 h Five aircraft begin searching for the cloud; the cloud was sampled, at
3000 m at 0100h on 4 Oct; landed at Broome 4 Oct at approx 0700h5 Oct 1952 H + 43 h Three Lincoln aircraft sampling at 1500 m; two aircraft obtained active
samples5-6 Oct 1952 H + 55 h Townsville group — aircraft sampling at 3000 m11-17 Oct 1952 8–14 HMAS Hawkesbury; records recovery12 Oct 1952 9 Bad weather; landing craft (LCA) sunk at Daisy Island23 Oct 1952 20 Completion of UK re-entry activities; two Australians involved27 Oct 1952 24 Joint Services Training Unit (JSTU) in residence on South East Island30 Oct 1952 27 LCA salvage by HMAS Koala — taken out to sea and dumped; HMAS
Koala’s cables and interior contaminated31 Oct 1952 28 Contamination survey of HMAS Koala by RAAF Officer who had had
training in radiation safety31 Oct 1952 28 HMS Campania escorts UK naval squadron from Monte Bello Islands;
HMAS Hawkesbury remained for security duties2 Nov 1952 30 Completion of decontamination of HMAS KoalaNov 1952 30+ HMAS Hawkesbury patrolled prohibited areas6 Nov 1952 to 16 Dec 1952
34–74 JSTU begins training exercises, monitoring of sea moorings for radioactive contamination and collect samples on Trimouille Islandb
18-20 Nov 1952 46–48 11 crew from HMAS Hawkesbury land on SE Island and later visit Trimouille Island; decontamination exercise on return to ship
15 Jan 1953 90 Termination of security duties of HMAS HawkesburyNov 1953 Approx.400 Contamination of HMAS Karangi following the recovery of Jeep9-15 Nov 1953 405–411 HMAS Fremantle, HMAS Junee and HMAS Karangi arrive with
scientific party; HMAS Karangi monitored radiation levels and recovered mooring gear
Oct 1954 700 Visit by HMAS Karangia All times listed are Western Standard Time (WST).b See Table 7.5 for probable dates.
7.2.2 Operations and major tasks
Potential sources of exposure
Table 7.2 lists the potential exposure sources and pathways that were considered relevant for assessing the data.
102 Australian participants in British nuclear tests in Australia — Vol 1: Dosimetry

Table 7.2 Potential irradiation pathways considered for Operation Hurricane
Source External hazard Internal hazardGamma flash Initial neutron burstIsland re-entry Fallout material Resuspension of falloutCloud sampling Immersion in cloud
Contaminated aircraft surfacesInhalation of active particles
Surface contamination Ship surfacesAircraft surfaceContaminated clothing
Decontaminating shipsContamination from Landing Craft (LCA) salvage Recovery of contaminated buoysDecontaminating aircraftContaminated clothing
Contaminated seawater
Sailing overDivers recovering materialSwimming
Divers swallowing contaminated waterSwimmers ingesting splashed water or spray
Ship-borne water Ships boilers Contaminated water from distillersSalt-water circulation systems and desalinators
Consumption of contaminated water
Contaminated food Eating contaminated fish
7.2.3 Dosimetry outcomes
Outcomes
The radiation dose estimates derived for Operation Hurricane are provided in Tables 7.3 and 7.4. Those estimates were used by the Exposure Panel to assign the exposure categories defined in Chapter 6.
Major Australian re-entry exercise
The dates of visits to the island and recorded doses for the Exercise Director of the JSTU are given in Table 7.5.
Glossary and common acronyms 103
Table 7.3 Operation Hurricane: estimated external exposures
Task/exposure Work group Evidence/dataaExposure category
External gamma/neutron flash
All Australians Too far away A
External beta/gamma ( from sea water
All ships prior to D+ 4
Measurements in the Parting Pool and Lagoon at D + 4 gave approx 40 and 10 Sv/h, respectively. For possible exposure times for RAN ships of 25 to 100 h, maximum accumulated dose would have been 4 mSv. (By D + 14, radioactivity in the Parting Pool was 1 Sv/h.) No data have been seen for the Bunsen Channel.
B
External from contaminated sea water taken into boilers and evaporators
All ships operating within the Monte Bello Archipelagoup to D+ 16b
HMS Tracker at withdrawal position; maximum reading 2.5 Sv/h at the Evaporators and 2.0 Sv/h in the Main Circulators at D + 8c
HMS Campania at D + 11, max reading 6 Sv/h at Evaporators and 10 Sv/h in Main Circulators
HMS Zeebrugge at North Sandy Island: sea reading not recorded, at D + 16 max reading recorded of 6 Sv/h in Main Evaporator; assume worst case of continuous exposure at 10 Sv/h = 4 mSv.
B
External from sea water
Small boats providing a ferry service for UK scientists
As row 2 above B
Re-entry to Trimouille Island
Joint Services Training Unit
Highest recorded accumulated gamma dose: 52 mSv over a period of 36 d. Film badge records available for 11 of 13 participants and these indicated categories E (2), D (1) and C (10).
C–E
Recovery of landing craft (LCA), Oct 1952
Divers from HMAS Koala
No readings sighted; however, mooring gear recovered in Nov 1953 gave readings of up to 80 Sv/h (RC 137/004) corresponding to approx 2 mSv/h. At Oct 1952, no data on length of time the operation took.
D
Recovery of mooring buoys, Nov 1953
Divers and crew from HMAS Karangi
Mooring buoy in the lagoon read 20 Sv/h,
another up to 80 Sv/h. No data on exposure time. Assume 20 h, radiation dose max 1.6 mSv.
B
Swimming All personnel Given sea readings of 10 Sv/h (see above) or less, a swimmer would have to have spent up to 10 h in contaminated water to reach exposure level B.
A
Working parties on the island including recovery of body of deceased soldier
Personnel from HMAS Junee and HMAS Fremantle, Nov 1953
One film badge reading of 0.2 mSv B
Practical decontamination on Trimouille Island
11 Ratings from HMAS Hawkesbury
Three days training 17–19 Nov with visit to Trimouille on last day. On 21 Nov, a JSTU member received 300 Sv (see Table 7.5).
B
104 Australian participants in British nuclear tests in Australia — Vol 1: Dosimetry

Task/exposure Work group Evidence/dataaExposure category
Transport of contaminated Jeep to Fremantle
Crew of HMAS Karangi
Reported levels of contamination were low. Highest level recorded 2000 cps (full scale deflection on 1021, approx equal to 200 Sv/h) on left front brake drum. General levels in accessible areas, 25 to 150 cps, approx equal to10 Sv/h. For, say, a total transport time of 100 h = 1 mSv.
B
Driving contaminated jeep
Western Command Workshops
Jeep decontaminated at Western Command workshop and HMAS Leeuwin
A
Observation Meteorological Officers and Observers
No participants exposed in the explosion aftermath (other than a scientist from the Australian National University)
A
a The original measurements were in roentgen per hour (R/h) or counts per second (cps) or counts per minute (cpm); they have been changed to SI units using the following relationships: 1 R/h is approx equal to 10 mSv/h, thus a reading quoted above of 1 Sv/h was originally measured as 0.1 mR/ h; 1000 cps on a model 1021 contamination monitor very approximately equals 10 mR/ h or100 Sv/ h.bOn 13 Oct, all ships were ordered to close down distillers for 8.5 h; HMAS Hawkesbury evaporators closed down for 3 d during 11–17 Oct.c At 1600h on day D + 10, the Health Physicist on HMS Tracker measured 2.5 Sv/h (0.25 mR/h), which was the maximum recorded at the ‘Anchorage position’ between days D + 8 and D + 12; the fresh water reading was 25 cpm and the seawater count 979 cpm; the fresh water count rates measured between days D + 8 and D + 12 ranged from 15 to 71 cpm (tinned beer read 80 cpm).
Glossary and common acronyms 105

Table 7.4 Operation Hurricane: estimated internal exposures
Task/exposure Work group Evidence/dataExposure category
Swimming in contaminated water
All personnel Levels of radioactive contamination away from the lagoon not excessive: ‘It was evident that the bulk of the activity deposited in the lagoon was rapidly dispersed…so that the water-borne activity soon degenerated into a negligible hazard’ (Operation Directors Report); D + 4 approx. 150 Bq/cm (); swallowing, say, 25 cc of water is approx equal to 3.75 kBq is equivalent to a dose of 5.6 µSv (No measurements).
A
Water spray/splashing
All personnel Low levels of contamination A
Eating contaminated food, particularly fish
All personnel Food stored on deck could possibly have been exposed to fallout. Contamination would have been completely removed by washing and peeling vegetables. Fallout would not penetrate tinned foods and meats would have been stored in refrigerated containers. Some fish were caught and monitored. Most activity could be washed off.
A
Contamination of deck and cabins following recovery of the landing craft (LCA)
Crew of HMAS Koala
No data on the levels of contamination transferred to the deck and cabins; however, experience suggests that both inhalation and ingestion from such contamination would be relatively low.
A
Recovering the LCA
Divers and crew from HMAS Koala
The method of diving to attach the lifting cables not sighted. Protective diving gear would have limited the intake of contaminated water. However, no special contamination control precautions appear to have been taken in undressing or in checking levels of contamination. Comparison with swimming in contaminated waters (row 1 above) indicates any radiation dose would have been low.
A
Recovering mooring buoys in Oct 1953
Divers and others, from HMAS Karangi
Lower levels of contamination 12 months after the detonation.
A
Assisting in recovery of mooring buoys in Oct 1953
Crew from HMAS Karangi
See above A
Transporting contaminated Jeep
Crew of HMAS Karangi
The contamination was mainly in the dirt, grease and rust covered components. Therefore, little risk of accidental inhalation or ingestion.
A
Decontaminating Jeep
HMAS Leeuwin and Western Command Workshops
Primarily wet methods of decontamination, hosing and use of detergents minimised the risk of ingestion and inhalation. There is a reference to scrubbing with a ‘wire brush’.
A
Re-entry to Trimouille Island
Joint Services Training Unit
This was primarily a Health Physics training exercise and it appears that good contamination control was maintained throughout. Some anecdotal evidence that respirators were not worn at all times, but exact work locations and contamination levels not sighted.
A
Practical decontamination on Trimouille Island
11 crew from HMAS Hawkesbury
Practical exercise in sampling and decontamination. A
Table 7.5 Film badge readings for the JSTU during exercises and sample collections associated with Operation Hurricane
106 Australian participants in British nuclear tests in Australia — Vol 1: Dosimetry

Date (in 1952)Days post test Event
Dosea
(mSv)9 Nov 37 Team exercise 1.810 Nov 38 Plotting exercise 0.512 Nov 40 Plotting exercise 2.521 Nov 49 Monitoring exercise 0.34 Dec 62 Sample collection 0.15 Dec 63 Stores recovery 4.07 Dec 65 Sample collection 1.08 Dec 66 Sample collection 20.09 Dec 67 Sample collection 20.011 Dec 69 Sample collection 2.012 Dec 70 Sample collection 10.415 Dec 73 Placing of signs 2.213–15 Dec 71–73 Decontamination 14.0a From the dose records of the Exercise Director, originally quoted in roentgens
7.3 Operation Totem
7.3.1 Groups potentially exposed
The Totem series was mainly a scientific operation under the control of the UK Department of Supply. The operation appears to have been hurriedly organised, and owing to limited road transport and water, conducted in a very difficult environment. It would appear that the operation lacked the same level of radiological control exercised during the Hurricane series, and the rather better integrated management of the later series conducted at Maralinga.
The main groups of potentially exposed Australian personnel were:
individuals forming part of the Radiation Hazards Group, who carried out surveys of surface contamination around each ground zero (GZ) following both tests (T1 and T2), and entered Forward Areas to collect target response items
aircrew involved in cloud sampling, and ground crew involved in aircraft decontamination (see Section 7.8.3)
Peace Officers employed during and after the Totem series to guard the test sites
senior officials and officers inspecting the Totem 1 site at T1 + 5 days
Aircraft Research and Development Unit personnel.
Smaller groups that were considered included a team of three RAAF plant operators constructing a road for the Woomera missile range after T1.
7.3.2 Operations and major tasks
Ground surveys
Four Australian personnel were involved in carrying out ground surveys of dose rates near GZ soon after each explosion. These personnel were part of a team of five full-time and five part-time Health Physics Surveyors. The full-time surveyors made between 10
Glossary and common acronyms 107

and 15 surveys each; the part-time surveyers made three to five surveys. Permission was obtained from the Trials Director for all full-time surveyors to receive the Higher Integrated Dose (100 mSv gamma dose, total 500 mSv beta/gamma).
Gaskell and Saxby (1956) estimated that the mean gamma doses to the full-time and part-time Health Physics Surveyors were 49 mSv and 22.5 mSv, respectively, with beta doses of 60 mSv and 18 mSv, respectively. An approximate guide to the dose per person per survey at entry times ranging up to D + 3 days is, therefore, approximately 4 mSv gamma with a beta dose of approximately 5 mSv.
Surveys of the T1 and T2 craters were undertaken at D + 5 days and D + 630 days. It is not known if Australian personnel were involved in these surveys; however, two scientific advisers participated in target response studies.
Potential sources of exposure
Table 7.6 lists the potential exposure sources and pathways used for assessing the data.
Table 7.6 Potential irradiation pathways for Operation TotemSource External hazard Internal hazardGamma flash Initial neutron burstEntry into Forward Areas and fallout zones
Induced activity near GZFallout material
Inhalation/ingestion/injection of resuspended activity or personal contamination
Cloud sampling Immersion in the cloud Contaminated aircraft surfaces
Inhalation of active particles
Surface contamination Contaminated aircraft surfacesContaminated clothingContaminated vehicles
Contaminated equipment and recordsContaminated vehiclesContaminated aircraftContaminated clothing
7.3.3 Dosimetry outcomes
Table 7.7 lists the estimated radiation dose assignment categories for participants in Operation Totem.
108 Australian participants in British nuclear tests in Australia — Vol 1: Dosimetry

Table 7.7 Operation Totem: estimated combined internal and external exposures
Task/exposure Work group Evidence/dataExposure category
Radiological surveys near GZ
Radiation Hazards Group
Gaskell and Saxby (1956) D
Inspection of Totem 1 site at D + 5 d
Officers and senior officials
Assume 4 mSv for entry at D + 3 d; then at D + 5 d, estimated dose using standard decay law is 4 (3/5)1.3 = 2 mSv
B
Decontamination of records and equipment recovered from Forward Area
Australian decontamination unit
Low levels of activity not generating significant inhalation or ingestion hazards
A
Security for test sites
Peace Officers See note for radiation doses estimated for travel in vehicles used during Operation Buffalo (Table 7.13)
C
Transport in contaminated vehicles moving through contaminated areas
Various personnel Doses derived by comparison with Operation Buffalo, using contamination levels from Atomic Weapons Research Establishment (AWRE) T22/57 (Stevenson 1957) and based on 400 h exposure, are 2 mSv external and 8 mSv from driving over contaminated ground; see Table 6.7 and Section 6.6.3 for further explanation. The Land Rovers were the most highly contaminated vehicles with levels above 1000 cps detected in up to 35% of vehicles.
C
Recover Target Response tanks and move overland to Puckapunyal
Various personnel (see Commonwealth of Australia 1985, pp 226–228)
Average level of activity as measured by the Commonwealth X-Ray and Radium Laboratory (CXRL) was 300 cpm or 5 cps. If the conversion 100 cps is equivalent to 10 µSv/h (1 mR/h) is used and the exposure was for 10 h/day over 20 d, the estimated unshielded dose is 0.1 mSv.
A
7.4 Operation Mosaic
7.4.1 Groups potentially exposed
The Mosaic series of two tests, G1 and G2, was mainly a scientific operation under the control of the United Kingdom Atomic Energy Authority (UKAEA) and the Ministry of Supply and was the second of the two series at the Monte Bello Islands.
Because of the setting, the operation was largely controlled by the Royal Navy and the RAF, with support from both the RAN and the RAAF.
The complement of personnel during Mosaic was mainly UK scientists and the military. The scientific work for the Mosaic trials was under the control of AWRE and, apart from members of the Atomic Weapons Tests Safety Committee (AWTSC) who were on HMS Narvik (the Control Ship), there appears to have been no involvement of Australians in the scientific programs conducted on the islands. Re-entry operations were done under strict Health Physics control, which limited the number of men in contaminated areas.
The evidence indicates that very few Australians were involved close to the test zone. The exceptions include the Australians involved in cloud sampling and, away from the test
Glossary and common acronyms 109

zone, ground crew decontaminating aircraft at RAAF Pearce in Western Australia. In addition, at least one naval officer assisted with recovery of equipment to HMAS Karangi, and support staff at Onslow may have been exposed when the radioactive cloud crossed the Australian coast.
7.4.2 Operations and major tasks
Naval operations
Royal Navy and RAN ships, their function and their approximate location at the time of the G1 and G2 explosions are summarised in Table 7.8. One RN ship, HMS Narvik, was used as the control vessel for the two nuclear explosions. One Australian naval officer was present on HMS Diana when it was placed in the path of the fallout for decontamination trials at both tests.
Cloud sampling
As in the earlier Hurricane trials, RAF Canberra aircraft were used to sample the radioactive cloud shortly after detonation. Australian support included additional RAN ships for patrol and servicing duties and RAAF aircraft, principally Neptunes, for site patrols and transport. RAAF facilities at Pearce were used for RAF and RAAF aircraft, while a search and rescue base was established at Onslow. An RAAF Wing Commander and crew were provided to fly an RAF Canberra that sampled radioactive clouds from both tests. Some meteorological data were collected by an RAF Shackleton aircraft based in Darwin. Partial decontamination of aircraft was performed at Pearce (see Section 7.8.4).
Table 7.8 Naval vessels used for the Mosaic seriesTask Ship Function Location at testa
Group G1 G2308.1 HMS Narvikb Control 13 km S 19 km S
HMS Alertb 15 km S 19 km S308.2 HMAS Fremantle Support 19 km S Fremantle
HMAS Karangi Support Fremantle OnslowHMAS Junee Support 19 km S FremantleMRL 252 Lighter 25 km S 19 km SMWL 251 Lighter 25 km S 19 km S
308.4 HMS Dianab Contamination Trials 19 km N 160 km Na Approximate position; estimated from the Royal Commission report maps and recorded naval proceedingsb The numbers of Australian personnel on UK vessels were: four on HMS Narvik, nine on HMS Alert and one on HMS Diana; the weather ship was located at 20 deg S, 105 deg E from 9 Apr 1956; when not on duty ship would be located at Fremantle or, on at least one occasion, visiting the Monte Bello Islands.
Long-range fallout from the tests
Wise and Moroney (1992) calculated possible long-range fallout levels in Australia, including corrections for sampling inefficiencies.
Ground contamination was measured at Australian population centres both by radiation surveys and passive sticky paper samplers. High-volume air samplers were used to measure airborne contamination.
110 Australian participants in British nuclear tests in Australia — Vol 1: Dosimetry
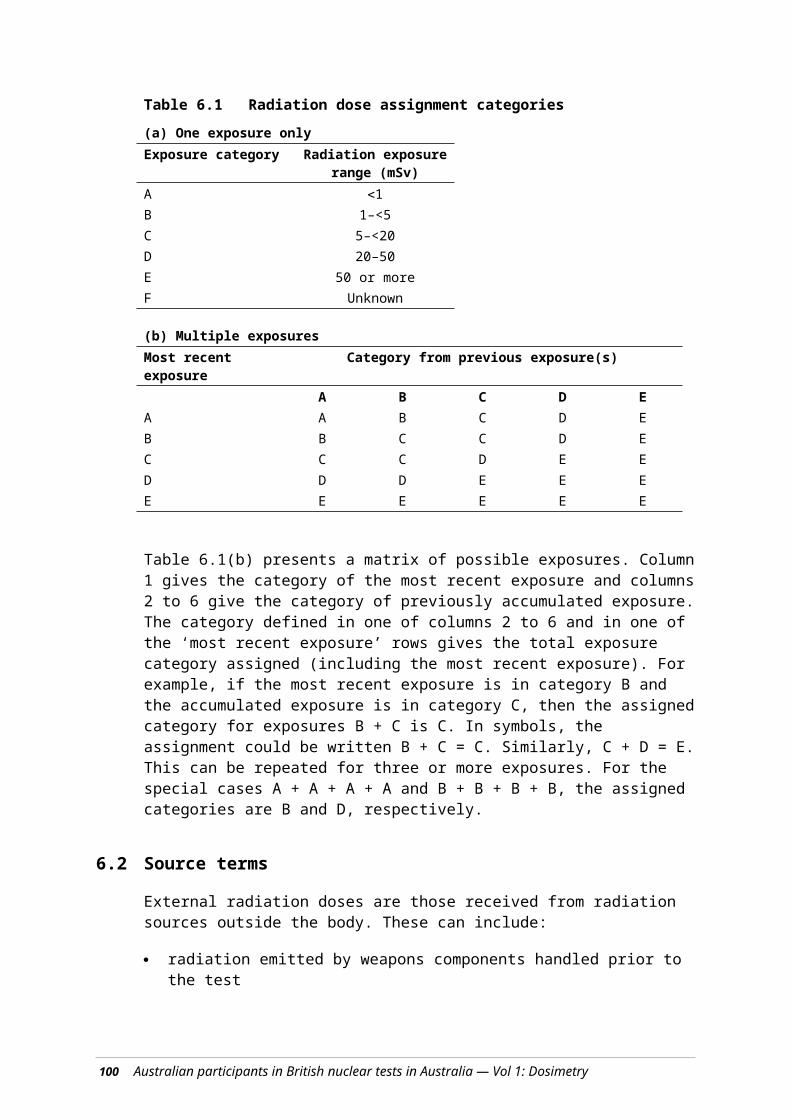
Potential sources of exposure
Table 7.9 lists the potential exposure sources and pathways used for assessing the data.
Table 7.9 Potential irradiation pathways considered for Operation MosaicSource External hazard Internal hazardGamma flash Initial neutron burstRe-entry to Forward Areas and to fallout zones
Induced activity near GZFallout material
Inhalation/ingestion/absorption through wounds of radioactive contamination
Entry into fallout plume Fallout cloud shineContaminated equipment
Inhalation of active particles
Cloud sampling Immersion in the cloudContaminated aircraft surfaces
Inhalation of active particles
Surface contamination Aircraft surfacesContaminated clothing
Recovery of contaminated equipment and recordsContaminated vehiclesDecontaminating aircraft
Buoys and moorings Contaminated surfaceContaminated food Eating contaminated fishContaminated salt water systems
External from contaminated sea water taken into boilers and evaporators
Drinking contaminated water
7.4.3 Dosimetry outcomes
Table 7.10 lists the estimated radiation dose assignment categories for participants in Operation Mosaic. The larger yields for both G1 and G2 (Table 1.1) have been considered in estimating these dose assignments.
Table 7.10 Operation Mosaic: estimated combined internal and external exposures
Task/exposure Work group Evidence/dataExposure category
Initial flash RAN ships and HMS Narvik and HMS Alert
Nil dose as ships too far away; film badge records indicate 0.2 mSv
A
Fallout contamination and decontamination
RAN members on HMS Diana
Possible exposure to contaminated salt water systems; see Table 7.3 (Operation Hurricane)
B
Hermite Island Work Group
Re-entry tasks The Royal Commission report (Vol. 1, paragraph 7.6.15) reports a sortie to the northern tip of Hermite Island and that this area was free of contamination.
A
Logistical support for G1
HMAS Fremantle and HMAS Junee
Possible exposure to contaminated salt water systems; see Table 7.3 (Operation Hurricane)
B
Logistical support and equipment recovery for G2
HMAS Karangi Maximum dose on UK film badge records of 1.7 mSv
B
Supply duties MRL252 and MWL251 Maximum dose on UK film badge records of 0.4 mSv
A
Fallout deposit Staff based at Onslow External dose was of order 0.1 mSv; see Section 6.6.6.
A
Glossary and common acronyms 111

7.5 Operation Buffalo
7.5.1 Groups potentially exposed
The Buffalo series was principally a scientific operation undertaken in conjunction with an assessment of the effects of a nuclear explosion on military personnel, equipment and biological specimens, as well as seismic studies, all carried out under the control of the UK. Buffalo was the first of two major series of trials at the newly constructed permanent site at Maralinga.
This series of tests provided an opportunity for military personnel to experience at first hand the effects of an atomic test at close range, observe the effects of the blast on equipment and structures and, thus, become a nucleus of knowledge on nuclear warfare for dissemination among the Services. Approximately 250 observers, known as the Indoctrinee Force (I-Force), were officers drawn from the armed services of the UK, Australia and New Zealand. The I-Force was intended to be self-sufficient. It had its own administrative organisation, built its own accommodation and had a separate field decontamination facility.
There was greater Australian involvement in Health Physics operations during Buffalo than in earlier series. Six Australians were selected to provide Health Physics support and three of these participants were given training in the UK. Before the operation, one of these, the Deputy Director of CXRL, trained a further 20 Australian service personnel who formed the nucleus of the Australian Radiation Detection Unit (ARDU). ARDU personnel were rotated between Maralinga and Emu, 190 km north of the Maralinga test site. A group known as the Australian Health Physics Team arrived at Maralinga in August 1956 where they were attached to the British Radiation Measurement, Health Physics and Decontamination Groups (Australian Archives AG11 and Royal Commission 7.5.4/5).
Sundry engineering telemetry and target response infrastructure tasks were also undertaken, which involved potential radiation exposures of Australians during and after each test. One example is the sandbagging of instrument bunkers to limit the entry of neutrons. Radiation exposures of Engineer Troop personnel could have resulted from neutron activation products in soil, or fallout, when they removed the bags after each test to allow access to the instruments.
Vehicle and plant recovery, decontamination and repair groups operated in the Decontamination Centre (DC) Area adjacent to the Maralinga Village, along the ‘dirty track’ and in the YELLOW area.30 A mobile vehicle decontamination unit operated inside the YELLOW boundary. Because of a lack of drainage facilities, it was necessary to move this unit as the ground beneath became both contaminated and muddy.
The Target Response Programme was divided into seven groups, each with its own team. Australia contributed representatives to each of these teams: Ordnance, Electronics, Aircraft, Materials, Explosives, Structures and Biological (Symonds 1985, p 304).
The highest level of induced contamination (neutron activation of various components) recorded for Target Response equipment was 70 to 80 µSv/h from a 25-pound gun and a Scout Car on day D1 + 2. At early times, post-test, copper alloys were found to be the most radioactive, with radiator cores and ammunition also moderately radioactive. Lead
30See extract from RSRM/56(5) in Section 4.2.3.
112 Australian participants in British nuclear tests in Australia — Vol 1: Dosimetry

acid accumulators were especially radioactive. Steel work was initially less radioactive, but after a few days became the principal activated material contributing to radiation doses (Stevenson 1957).
The Biological Group contained six Australians who assisted with experiments using live animals to investigate the ingestion and retention of radioactive fallout (Royal Commission report 7.0.10).
7.5.2 Operations and major tasks
Initial surveys near ground zero
The measurements of radioactivity on the ground are described in an AWRE report (Rae 1957). Prior to the tests, a grid for the local survey program was established based on the main roads and secondary tracks, with all tracks and roads sign posted. The initial survey used teams dressed in full protective clothing to confirm that the site chosen for the mobile Health Control centre was free of fallout and to place warning signs at the 20 mSv/h contour. Hard-topped Land Rovers were used in this preliminary survey. Entry into the survey areas was within 10 minutes of firing.
These early surveys were carried out by UK personnel, but radiation surveys after the Breakaway test (round 4) were made by a Canadian Radiation Detection Unit, working under military conditions, using their own Victoreen No. 592 γ survey meters.
For the Kite test (round 3), a rapid reconnaissance, made within 2 hours of firing, was carried out to check contamination levels at the Health Control site, and in the instrument lanes and the camera towers.
For all except the Kite round, four teams of three Health Physics Surveyors were used to survey the roads and tracks from days D + 1 to D + 5. The survey of all except the central area containing the craters was completed by day D + 5. The crater surveys were made on foot at 10 days after the One Tree and Breakaway firings by three teams of two Surveyors drawn from the British Army and ARDU, respectively.
The Indoctrinee Force
The scientific program included extensive Target Response (TR) studies at the One Tree test. As part of their training, the I-Force observed these during a 3-day period starting 1 day after the One Tree explosion. Approximately half the group toured the target response sites on D1 + 1 and the remainder on D1 + 2. The involvement of I-Force at One Tree was regarded as being very successful and steps were taken for part of the original I-Force to observe the Marcoo test at close range from a Centurion tank, from slit trenches and from the ground surface. The placement of members of I-Force during the One Tree and Marcoo tests is summarised in Table 7.11. There were no post-detonation tours after the Marcoo test.
Glossary and common acronyms 113

Table 7.11 The Indoctrinee Force at Operation BuffaloTest and site Location Personnela Radiation doseb Internal
exposurec
Prompt radiation dosesb
One Tree North Base 7.2 km S of GZ and
upwind177 UK, 100 Australian, 5 New Zealand
Nil Nil
Marcoo 1800 m S of GZ 4 UK 2.5 mSv Nil Centurion tankMarcoo 1800 m S of GZ 20 UK 0.3 mSv Nil Field shelters 3 Australian (0.9 m cover) 1 New ZealandMarcoo 3000 m S of GZ 53 UK 0.03 mSv Nil Mina Stand 27 Australian in open 2 New ZealandTotal radiation dosesd
One Tree Vicinity of GZ Examined Target
Response100 Australian <4 – 7.6 mSv 0.01 mSve
for 2.5 h over next 4 d 177 UK5 New Zealand
mean <5 mSv
Forward Area Marching as trial of service clothing
24 volunteers 3 mSvf 0.16 mSvf
a These numbers include civilian as well as military personnel.b It is not known if these estimates of prompt radiation doses were calculated or recorded by film badge (quoted in letter to Hon Barry Cohen from Emeritus Prof A M Clark AM, dated 2 August 1984); alternative estimates are to be found in Section 6.6.1.c Indoctrinees were fitted out with the appropriate levels of protective clothing, and entered and exited Forward Areas through a Health Physics control point.d Total radiation doses quoted in letter to Hon Barry Cohen from Emeritus Prof A M Clark AM, dated 2 August 1984; see also dose list in Australian Archives from Australian Military Forces (IFA/44/1/2, dated 12 October 1956).e Estimated internal dose for I-force members based on average external exposure over 2.5 h Target Response inspection of 5 mSv at D + 1 d; the calculation assumes resuspension of fission products from the surface (in practice, the external radiation was from induced activity in the soil and only a very small fraction of this would be resuspended).f See Table 6.6
One of the I-Force tasks was an investigation of the contamination of service clothing. This involved 18 volunteers from I-Force and six members of the TR team on day D1 + 3. The personnel were divided into three groups and moved into a fallout area, where the dose rate ranged from 1 to 10 mSv/h. Some wore respirators of the AWRE pattern and the remainder wore a standard service respirator. Group One drove to and fro over a 1-mile course in an open truck, dragging sacks to create as much dust as possible, and the second group marched over the same course for 3 km whilst the truck passed at frequent intervals. The third group marched across the country for 2 km, brushing against trees, while stirring up as much dust as possible and also crawling through the undergrowth for 100 m. After the trial, the men returned to a separate field decontamination centre where they were monitored by members of the Decontamination Group using contamination Monitor Type 1320, with the β-window open (Janisch et al 1957).
External radiation doses, estimated from film badge readings, are available for participants in I-Force. Several participants from I-Force at Mina Stand recorded doses in the region of 6 mSv. As the radiation doses from the initial flash for these participants were negligible, because they were too far from GZ, the bulk of the dose would have been obtained during examination of target response items at One Tree. Thus, 6 mSv is suggested as an estimate of those I-Force members for whom no dose records were found.
114 Australian participants in British nuclear tests in Australia — Vol 1: Dosimetry

Indoctrinee decontamination
This was carried out in a field facility set up and operated by Indoctrinees under Health Physics supervision.
The Australian Radiation Detection Unit and its functions
Subgroups of the Australian Radiation Detection Unit (not to be confused with the Aircraft Research and Development Unit) were rotated through the former Emu test site where they performed ground radiological surveys out to 200 miles (300 km) from GZ. Their work also included air sampling (including some cascade impactor sampling), water sampling and collection of animal thyroids and bones. During the passage of the fallout cloud, sticky paper collectors and cascade impactors were set up at locations across the predicted path of the cloud. After the cloud had passed, five teams of two men each carried out surveys using 1390 beta/gamma contamination monitors. Four teams operated along radial tracks from Emu and one team along the North-South Road.
For One Tree, test fallout was measured at approximately 320 km from GZ using AWRE predictions to guide the placement of samplers. The ARDU established sampling sites along the North–South road from Tarcoola to Coober Pedy and Welbourn Hill and northwest to Ernabella. At Coober Pedy, a total of 33 MBq/m2 of fallout (corrected to H + 1 hour) was collected over a 5-hour period from H + 3 hours. From Table 6.3, the conversion factor from the activity of ground deposit to dose rate at H + 5.5 hours is approximately 0.2 µSv/h for 1 MBq/m2 at H + 1 hour. The measured radioactivity at Cooper Pedy, therefore, corresponds to a dose-rate of 7 µSv/h at the middle of the collection period, giving a total dose for the operation of 35 µSv.
Given that Marcoo was a relatively small ground burst, it is unsurprising that fallout from this test was restricted mainly near the Maralinga Range. At distances of more than 80 km from GZ, the dose rate from the plume was less than 19 µSv/h.
The third test, Kite, was an airburst and as such generated only small quantities of intermediate fallout. However, some fallout fell on Maralinga village approximately 10 hours after the explosion. This amounted to 3.3 MBq/m2 (corrected to H + 1 hour) which, using a conversion factor from Table 6.3, corresponds to an integrated dose from H + 10 hours of approximately 16 µSv. The Royal Commission concluded (RC 8.3.29(c)) that this round ‘…should not have been fired under the conditions prevailing at the time’.
The final test in the Buffalo series, Breakaway, was similar to One Tree in yield and type of burst and could have been expected, therefore, to give similar fallout levels. The ground survey was carried out by the Canadian RDU to a distance of approximately 24 km from GZ using a helicopter to survey much of this area. This showed that the fallout cloud had moved east of GZ with the maximum dose-rate from fallout corresponding to approximately 2.5 mSv/h corrected to H + 24 hours.
Maralinga Range Support Unit (MARSU)
The MARSU was the generic name for a variety of groups responsible for the logistical, engineering and administrative support of the range. During the major trials periods, the Australian Range Commander was responsible to the Trials Superintendent through the UK Services Commander. The groups who were potentially exposed to external and internal radiation hazards were principally scientific and engineering teams. The majority of MARSU members who performed service functions in and near Maralinga Village would have received minimal radiation exposures.
Glossary and common acronyms 115

A number of important records of day-to-day activities could not be located — for example, Permit to Work in Active Areas Certificates (paragraph 3.3 RSRM/56(5)), Countdown Schedules, Re-entry and Recovery Schedules, Health Physics Entry to Active Area and Dosage Records, Construction Schedules and Hospital Treatment Records.
Vehicle decontamination
Vehicle decontamination was carried out by Decontamination Group DC2, in both the DC area near the Village and inside the YELLOW area using a mobile decontamination plant. Measured β and γ contamination levels for the MARSU YELLOW fleet (38 vehicles) at specific times after detonation are contained in Table 4 of AWRE T22/57 (Stevenson 1957).
Later work
Between the Buffalo and Antler series, the ‘Inter-Trial’ period, responsibility for Radiation Health Control on the Maralinga Range was passed to the Australian Health Physics Representative (AHPR). This occurred in stages from 30 October to 8 November 1956. The rapid exodus of UK personnel left the AHPR with several problems that became apparent only slowly.
At the end of the Buffalo series, the YELLOW area was described in the AHPR’s report of November 1956 as the boundary:
…along the north side of the Pom Pom–Kite–Nawa Road, east side of East street, north side of 5th Avenue until 1.7 miles west of central Street, due south to 0.5 miles west of Breakaway, then curving to the south of Breakaway until 0.2 miles from Breakaway on the Tanka road, and finally across to Pom Pom.
Turner, the AHPR, also described the Control Area boundary and stated that every access road to the YELLOW area (this may have been one or two roads, depending on the distance from Roadside) had a barrier at either the controlled boundary or at the junction of West Street. In his March 1957 Report, the AHPR reported the discovery of an ‘active area’ extending south of the marked YELLOW boundary into the proposed Antler work sites.
Turner’s report also stated that Breakaway fallout had swamped the whole of the One Tree area and inundated the area around Marcoo. These factors added to the difficulties of the crater surveys.
Potential sources of exposure
Table 7.12 lists the potential exposure sources and pathways considered relevant for assessing the data.
116 Australian participants in British nuclear tests in Australia — Vol 1: Dosimetry

Table 7.12 Potential irradiation pathways for Operation BuffaloSource External hazard Internal hazardGamma flash Initial neutron burstRe-entry to Forward Areas and to fallout zones
Induced activity near GZFallout material
Inhalation/ingestion/injection of resuspended activity or personal contamination
Entry into fallout plume (e.g. by the Australian Radiation Detection Unit during ground surveys)
Immersion in the cloudDriving vehiclesHandling contaminated equipment
Inhalation of active particles
Cloud sampling Immersion in the cloudContaminated aircraft surfaces
Inhalation of active particles
Surface contamination Aircraft surfacesContaminated clothingContaminated vehicles
Contaminated equipment and recordsContaminated vehiclesDecontaminating aircraftContaminated clothing
Work in Forward Areas/fallout zones
γ and β radiation from contaminated surfaces
Dust-producing activities, e.g. sandbagging of bunkers, cable laying, fencing
Patrolling the Maralinga Range
γ and β radiation from contaminated surfaces
Driving contaminated vehicles, walking through contaminated areas
7.5.3 Dosimetry outcomes
Table 7.13 lists the estimated radiation dose assignment categories for participants in Operation Buffalo.
Glossary and common acronyms 117

Table 7.13 Operation Buffalo: estimated combined internal and external exposures
118 Australian participants in British nuclear tests in Australia — Vol 1: Dosimetry

Task/exposure Work group Evidence/dataExposure category
General engineering supporta
Maralinga Range Support Unit (MARSU) Engineer Troop
Assume 10 h/d for 50 d in region with dose-rate 0.01 mSv/h; adopting the example in Section 6.6.2 gives external dose of 5 mSv, ingestion dose of 0.1 mSv and inhalation dose of 0.4 mSv for total of 5.5 mSv.
C
Hoisting of weapon to tower
Engineer Tower Party Low external dose-rate for short time. A
Install and recover camera, radar and British Insulated Callenders Cables Plc (BICC) towers
MARSU Engineer Troop Some data (see, for example, Table 7.5 and Section 7.3.2) indicate dose per entry is of the order of 4 mSv. If several entries are involved, then dose is of the order of 10–20 mSv.
C
Sandbag parties (post test)
MARSU Engineer Troop Assume 5 h for each task, two tasks per countdown and three countdowns for total of 30 h. Corresponds to three 10-h days. See Table 6.7; external dose per day of 0.1 mSv and internal dose per 10-h day (assume 100-day-old fallout) of 0.06 mSv. Total for three days of 0.5 mSv.
A
Immediate re-entry and recovery tasks that could not be delayed including target response items
MARSU Scientific and Engineering recovery teams
Some data (see, for example, Table 7.5 and Section 7.3.2) indicate dose per entry is of the order of 4 mSv. If several entries are involved, then dose is of the order of 10–20 mSv.
C
Examine target response items
Indoctrinee Force See Table 7.11 C
Indoctrinee decontamination
Health Physics Carried out in controlled environment by men trained in decontamination procedures. Appropriate monitoring equipment available at the control point.
A
Vehicle and plant recovery
MARSU Engineer Troop Some data (see, for example, Table 7.5 and Section 7.3.2) indicate dose per entry is of the order of 4 mSv. If several entries are involved, then dose is of the order of 10–20 mSv.
C
Define fallout boundary
Australian Radiation Detection Unit (ARDU)(>H + 8 h)
See Table 6.7 B
Vehicle decontamination
DC2 team (Decontamination)
See Table 6.7; derived vehicle contamination was 5 µSv/h. Assume 10 h/day for 20 d for dose of 1 mSv.
B
Radiation surveys ARDU(inter-trial period)
Estimated from similar exposures recorded in Australian Health Physics Representative (AHPR) post-Antler reports.
B
Glossary and common acronyms 119

Task/exposure Work group Evidence/dataExposure category
Transport in contaminated vehicles moving through contaminated areasb
Various personnel Doses derived for Operation Buffalo using contamination levels from Atomic Weapons Research Establishment (AWRE) T22/57 (Stevenson 1957) and based on 400 h exposure are 2 mSv external, 0.5 mSv internal and 8 mSv from driving over contaminated ground; see Table 6.9 and Section 6.6.3 for further explanation. Land Rovers were the most highly contaminated, with levels above 1000 cps detected in up to 35% of vehicles.
C
Security for test sites
Peace Officers See radiation doses estimated above for travel in vehicles.
C
a These tasks included: construction of instrument and rocket lanes and associated fencing, provision and removal of heat, blast and neutron protection, laying of cables prior to test, construction of instrument bunkers, preparation of lanes for Health Physics Surveyors, construction of BICC masts.b The estimated hours for driving YELLOW vehicles includes a period between Operations Buffalo and Antler.
7.6 Operation Antler
7.6.1 Groups potentially exposed
Antler was primarily a scientific operation executed mainly under the control of the UK. Six tests were originally planned for this series, but only three were carried out. The Australian participants were drawn almost exclusively from the armed services, with civilians being needed for the meteorological services and as support staff at the Maralinga facilities.
The airborne activities of the RAAF were similar to those in earlier tests. Australian personnel included a Wing Commander, an RAAF Canberra aircrew that flew several missions in an RAF Canberra and a variety of support staff. There was substantial RAAF involvement in ground-based roles. Some aircraft decontamination was carried out by RAAF ground crew under controlled conditions.
A large number of personnel were required for the Antler test series. As well as the many UK scientific teams, Australian support included the 28 Australians forming the ARDU, 11 Australians in the meteorological unit and as part of the 450 in the MARSU.
7.6.2 Operations and major tasks
Initial surveys near ground zero
The RAF Regiment Land Survey Team carried out the initial surveys near GZ. They used three Land Rovers with two men fully dressed in protective clothing for each of the three survey teams. Each team carried 1390 and 1301 beta-gamma contamination monitors and a 1324 dose-rate meter. Five minutes after each test, one team left Roadside to survey along the instrument lane up to a 20 mSv/h line. Concurrently, the second and third teams cleared sites to the east and west of the instrument lanes and then worked round to Second and Fifth Avenues to find the edges of the fallout. The maximum external dose received by any team on one survey was 10 mSv. In general, the teams had returned to the Health
120 Australian participants in British nuclear tests in Australia — Vol 1: Dosimetry
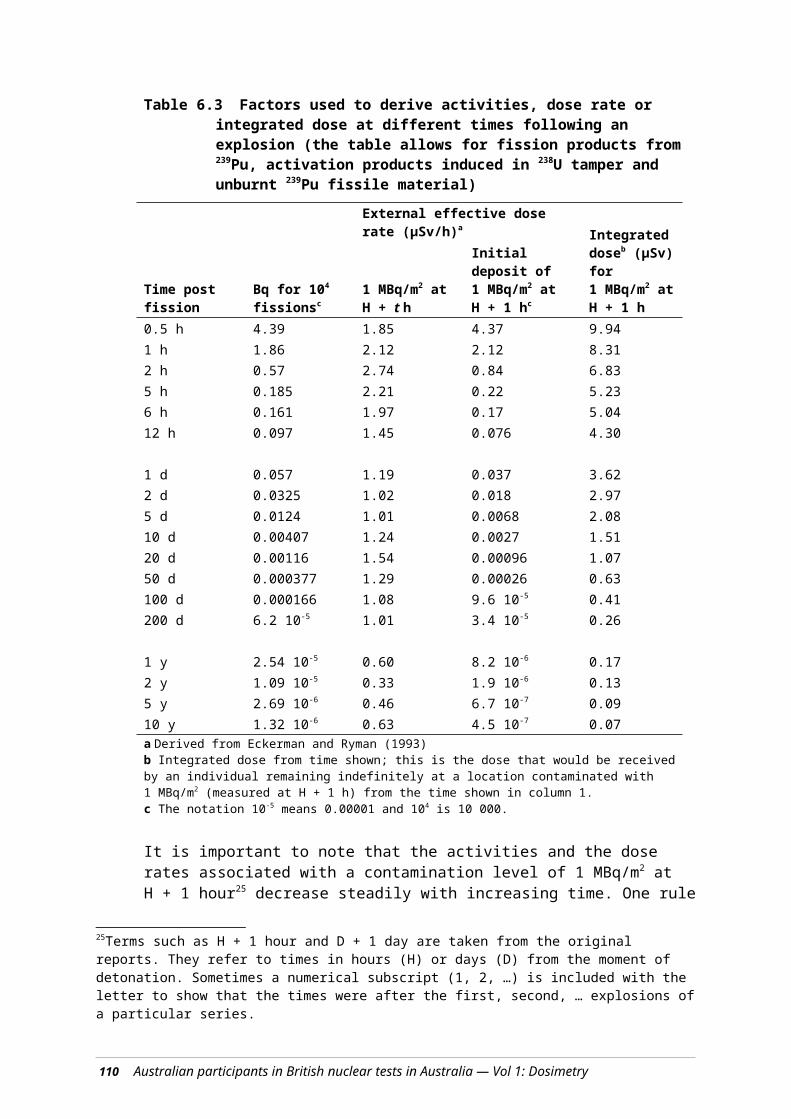
Physics control site by 90 min post-firing. Table 7.14 summarises the distances at which the 20 mSv/h (2 R/h) level was detected during the initial surveys.
Table 7.14 Distances from GZ to 20 mSv/h line for each test
Approximate distance from GZ (m)Approximate time after firing (min)
Tadje 460 33Biak 690 51Taranaki 530 50Source: McDougall et al 1958.
The Australian Radiation Detection Unit (ARDU) and its functions
The ARDU performed ground radiological surveys in the Alice Road (Stuart Highway) area. The ARDU used four specially equipped Land Rovers to sample and measure fallout on the road to Alice Springs. The Land Rovers were based at Mt Clarence and were directed by radio to the fallout area predicted by the Theoretical Predictions group. Sticky paper collectors and cascade impactors were set up at each of seven locations across the expected path of the cloud. The sticky papers and the filters were changed five times during the expected transit of the cloud. After the expected passage of the cloud, a ground survey was carried out using type 1390 gamma survey meters and type 1320 beta-gamma contamination monitors.
Fallout delineation for each test
The following is a summary of the work by ARDU during the Antler series (Commonwealth of Australia 1985).
For the Tadje test, the AWRE Theoretical Predictions group predicted the direction of the fallout incorrectly, which meant that the sticky paper collectors and the cascade impactors were in the wrong location. Hence, no measurements were possible using these devices. Instead, ground deposition was measured using 1390 meters and 1320 monitors. The maximum contamination along the Emu–Mabel Creek Road was 444 MBq/m2, corrected to H + 1 hour at 5 km east of Emu. An aerial survey showed the distance from GZ to the peak value of the fallout was approximately 13 km and the dose-rate, corrected to H + 24 hours and a height of 1 m, was less than 20 µGy/h.
For the Biak test, the predicted path for the fallout was between Mabel Creek and 48 km north of Ingomar. This was sufficiently close for fallout samples to be collected. The maximum fallout from the gamma dose survey occurred at approximately 8 hours, 16 km north of Ingomar. The level was approximately 174 MBq/m2, corrected to H + 1 hour. The aerial survey showed the fallout had an easterly path to the south of Coober Pedy. The distance from GZ to the peak value of the contamination was less than 1.5 km.
Taranaki was a balloon-supported airburst, and the theoretical prediction was that there would be no measurable medium or long-range fallout. Therefore, no air sampling was carried out. The ground survey showed the maximum fallout along the North–South road was 255 MBq/m2, corrected to H + 1 hour, at Ealbara, 35 km north of Tarcoola. The close-in fallout was much smaller than expected.
Glossary and common acronyms 121

Maralinga Range Support Unit
As with Operation Buffalo, MARSU was responsible for the logistical, engineering and administrative support of the range. During the major trial periods, the Australian Range Commander acted under the command of the UK Services Commander.
Clean up of the Taranaki test site
One unfortunate aspect of the Biak test was the contamination of the Taranaki site by weapon debris. This required decontamination of the site before the Taranaki test could proceed.
The cleanup was done by the UK Range Facilities (RF), Decontamination (DC) and Health Physics (HP) Groups starting on the first day after the Biak test (i.e. D2 + 1 day) with the assistance of two Australians who were involved in the decontamination. An assessment of their possible radiation doses has been given in Section 6.6.5.
Later work
After the completion of the Antler series, responsibility for Radiological Control was transferred to the AHPR, with effect from 22 October 1957. At handover, the YELLOW area was the same as at the end of the Buffalo series with additional areas around Tadje, Biak and east of Taranaki (MacDougall et al 1958).
60Co pellets at Tadje
About nine months after the handover to the AHPR and his team, one of the Australian Health Physics Surveyors discovered unexpectedly high radiation levels from small pellets near the Tadje GZ. Later analysis showed the pellets to be 60Co, with a single pellet having an activity of the order of 400 MBq. The concerns this contaminant caused are described fully in the Royal Commission report (Commonwealth of Australia 1985, Section 9.5). It is clear that the Australians in charge of the radiological management of the range had not been advised of the presence of 60Co prior to its discovery. The last report by the AHPR to AWRE in December 1958 noted that 180 pellets totalling 166 GBq had been recovered from an area of approximately 10 000 m2 north of the Tadje GZ and that the pellets were prone to fragmenting when pressure was applied to them.
Thus, it can be calculated that the pellets had an average activity of 0.9 GBq and a surface density of 0.018 m2, corresponding to approximately 17 MBq/m2 of 60Co averaged over the contaminated area. Given the relatively low pellet density, it is to be expected that the dose-rate at different locations would have varied considerably. Calculations show the mean dose rate in air was approximately 0.14 mGy/h, with a standard deviation of 0.13 mGy/h.
239Pu contamination at Tadje
Enhanced levels of 239Pu had been found in this area during the rehabilitation of the Maralinga lands. A major rehabilitation program, Operation Brumby, had been undertaken in 1967, which concentrated on the surroundings of each GZ and gave special attention to the area north of Tadje GZ (Cooper et al 1978). This special treatment included the removal of pellets, enriched in 60Co, for secure disposal. Whilst the area near each GZ was graded and ploughed to a diameter of several hundred metres, it is not clear whether this was done in the area where the pellets were found. Measurements of 12 soil samples from this area (Cooper et al 1978) showed that the 239Pu concentration in the soil
122 Australian participants in British nuclear tests in Australia — Vol 1: Dosimetry
ranged from 63 to 670 kBq/kg, with a median value of 170 kBq/kg. For those participating in activities raising ‘normal’ levels of dust, the median activity concentration corresponds to a dose-rate of around 0.03 mSv/h from inhalation of 239Pu. If, prior to Operation Brumby, work in this area raised dust to beyond ‘nuisance’ levels for exposure times in excess of 10 h, then the possible internal doses from the inhalation of 239Pu would have been significant.
Potential sources of exposure
Table 7.15 lists the potential exposure sources and pathways that were considered relevant for assessing the data.
Table 7.15 Potential irradiation pathways for Operation AntlerSource External hazard Internal hazardGamma flash Initial /neutron burstRe-entry to Forward Areas and to fallout zones
Induced activity near ground zeroFallout material
Inhalation/ingestion/injection of resuspended activity or personal contamination
Entry into fallout plume (e.g. by the Australian Radiation Detection Unit during ground surveys)
Immersion in the fallout cloudGround deposit
Inhalation of active particles
Cloud sampling Immersion in the cloudContaminated aircraft surfaces
Inhalation of active particles
Mechanically enhanced resuspension during cleanup of Biak sourced fallout at Taranaki
Fallout material Inhalation and/or ingestion
Surface contamination Aircraft surfacesContaminated clothing
Contaminated equipment and recordsContaminated vehiclesDecontaminating aircraft
Work in Forward Areas/fallout zones
γ radiation from contaminated surfaces
Dust producing activities (e.g. sandbagging of bunkers, cable laying, fencing)
7.6.3 Dosimetry outcomes
Table 7.16 lists the estimated radiation dose assignment categories for participants in Operation Antler.
Glossary and common acronyms 123

Table 7.16 Operation Antler: estimated combined external and internal exposures
Task/exposure Work group Evidence/data
Exposure category
General engineering supporta
Maralinga Range Support Unit (MARSU) Engineer Troopb
Assume work 11 d after Tadje, 14 d after Biak and 90 d after Taranaki at 10 h/d in the region with a dose-rate of 0.01 mSv/h. Total of 115 d. External dose of 11.5 mSv, ingestion dose of 0.24 mSv. Inhalation dose components are 16 µSv (Tadje), 28 µSv (Biak) and 2.0 mSv (Taranaki) for an inhalation dose of 0.6 mSv. Total dose = 13.5 mSv.
C
Hoisting of weapon to tower
Engineer Tower Party The Tadje test involved use of 60Co sources and dose contribution cannot be evaluated as distances and exposure times are not known.
F
Sandbag parties MARSU Engineer Troop (pre- and post-test)
Assume 5 h for each task, two tasks per countdown and five countdowns for a total of 50 h. Corresponds to five 10-h days. See Table 6.7; external dose per day of 0.1 mSv and internal dose per day of 0.06 mSv (assume 100-day-old fallout). Total = 0.8 mSv.
B
Immediate re-entry and recovery tasks that could not be delayed
MARSU Scientific and Engineering recovery teams
Some data indicate dose per entry is of the order of 4 mSv. If several entries are involved, then the dose is of the order of 10–20 mSv.
C
Collect rocket pods in Buffalo YELLOW areac
MARSU recovery teams
Assume these are collected over 10 h/test for a total of 30 h. From Section 6.6.2, dose estimate is 0.3 mSv.
A
Recovery of equipment for next test
MARSU recovery teams
Assume recovery was a week after test. The dose received would be approx 10 times smaller than for immediate re-entry (see above), say 0.4 mSv.
A
Define fallout boundary
Australian Radiation Detection Unit (ARDU)(>H + 8 h for each test)
For Tadje: maximum fallout 444 MBq/m2; from Table 6.13, dose estimate is 0.27 mSv. Similarly, for Biak: 255 MBq/m2 and 0.15 mSv and for Taranaki: 174 MBq/m2 and 0.1 mSv for total of 0.5 mSv.
A
Decontamination of Taranaki site
Engineer troop: two men per day, changed daily(D2 + 1 to D2 + 3 d)
Dose estimated as shown in Section 6.6.5, Table 6.11. The internal dose was <0.1 mSv and dominated by the external dose, which was up to 1.8 mSv.
B
Vehicle decontamination
DC2 team (Decontamination)
See Table 6.7; derived vehicle contamination was 5 µSv/h. Assume 10 h/d for 20 d for a dose of 1 mSv.
B
Transport in contaminated vehicles moving through contaminated areas
Various personnel Assume 2 h/day for 75 d for a total of 150 h. Use a similar approach to Section 6.6.3 based on 400 h exposure, giving a total dose of 10.5 mSv from driving over contaminated ground to get an estimate of 10.5 × 150/400 = 4 mSv.
B
Security for test sites including long-term post-Antler period
Peace Officers See note for radiation doses received by Peace Officers during Operation Buffalo (Table 7.13).
C
124 Australian participants in British nuclear tests in Australia — Vol 1: Dosimetry

a These tasks included: fence construction south of Buffalo YELLOW boundary from January to March 1957, laying of up to 50 miles of cable prior to Tadje, construction of rocket lanes, construction of instrument bunkers, preparation of lanes for Health Physics Surveyors, construction of BICC masts and dismantling of towers in the YELLOW area, road and track maintenance.b The MARSU Engineer doses may appear low in comparison with those for members of the Joint Services Training Unit (JSTU) at Hurricane (Tables 7.3 and 7.5) who similarly spent time in close-in fallout areas; the measured fallout levels and gamma dose rates from Hurricane fallout were much higher due to the nature of the Hurricane test, and JSTU deliberately sought out higher contamination areas for training purposes.c There were other entries of shorter duration by members of MARSU into YELLOW areas (e.g. indoctrination sorties of approx ½ day) and these personnel would have received correspondingly smaller doses
7.7 Minor trials and post-Antler activities
7.7.1 Groups potentially exposed
No Australians can be identified as participating directly in the minor trials. However, other activities continued after the Antler series and these are included in this section along with the background to the trials.
The minor trials, later known as the Maralinga Experimental Programme (MEP), were conducted in parallel with the major trials and extended into 1963. Their initial purpose was to support the development of components of the nuclear weapons, whereas later trials examined safety issues. The UK authorities planned, controlled and executed these trials with little Australian input beyond logistical and administrative support. Intense secrecy meant that the Australian Government had only sketchy details on the nature of the trials. The AWTSC had only an advisory role, with no power of veto over any proposed experiment. Table 7.17 outlines some features of these trials. The trials used conventional explosives, an assortment of hazardous materials such as beryllium, polonium and natural uranium and, importantly, in the Vixen series, plutonium. Some of the radioactive materials involved also had toxic properties; for example, uranium, while slightly radioactive, is a toxic heavy metal, and a few non-radioactive toxic materials were also used, such as beryllium. (Note: this study considers only radiological and not toxicological hazards.) A detailed list of the amounts of the hazardous materials used is given in Table 7.18 (Commonwealth of Australia 1985).
The Radiation Safety Regulations in use for the minor trials were those in force for the major tests. Additional Radiation Safety Orders were often written for the minor trials. During the trials, a senior British scientist assumed responsibility for radiological safety at the sites. On the completion of each series, the team leaders for the trials were required to take reasonable steps to make the experimental areas safe and to give the Scientific Superintendent of Operations a map showing contaminated areas.
In turn, the superintendent made checks and passed to the Range Commander a map showing any contaminated areas and buildings. A signed statement about levels of residual radioactivity and any precautions necessary was also provided. However, there is evidence that information on the radiological aspects of these minor trials was not readily supplied to the AHPR.
Summary values given for the residual contamination at the beginning of 1961 are shown in Table 7.18.
As there was minimal Australian involvement in the conduct of the minor trials, but significant contamination remained on some of the sites, potential exposures to
Glossary and common acronyms 125

Australians would mainly have occurred during management of the range both during the inter-trial periods and after the trials were completed.
The following Australian groups have been identified as being likely to have been exposed.
Members of the Australian Health Physics team. Film badge results for members of Australian Health Physics Team were included in the monthly reports to CXRL. Few data are available for possible internal doses.
Attendees at the Radiation Detection courses, whose dosimetry records are also available.
Members of the Australian Health Physics team and the attendees at the 1958 Radiation Detection Course collecting 60Co pellets resulting from the Tadje test (see Section 7.6.2).
Those assisting with the decontamination of the DC12 facility, which took place during March 1961. The exposures recorded are given in the Australian Health Physics report of March 1961.
Peace Officers who regularly checked sites including Taranaki, which was heavily contaminated by the minor trials.
Personnel involved in later cleanup operations at Maralinga.
Some areas of plutonium contamination presented a significant hazard. In very dusty conditions, surface plutonium contamination of the order of 40 kBq/m2 could have resulted in inhalation doses of up to 45 µSv/h of exposure. According to the Statement of Residual Radioactive and Toxic Contamination of 17 January 1961, prepared by R Pilgrim of AWRE, the contaminated area around Taranaki had been fenced.
Table 7.17 Program for the minor trials
Series name
Locationa Radiological hazard
Period No. trials Purpose
Kittens Emu Field and Naya
Unat, 210Po 1953–1961
99 Tests of weapons components: neutron initiator development (210P, beryllium and uranium)
Tims Naya and Kuli
Unat, 239Pu 1955–1963
321 Tests of weapons components: tamper development (uranium and beryllium at Kuli) and studies of plutonium compression under explosive force (at TM100/101 at Naya)
Rats Naya and Dobo
228Th, Unat 1956–1960
125 Tests of weapons components: developmental experiments involving internal radiography and explosive dispersal of uranium
Vixen A Wewak Unat, 239Pu 1959–1961
31 Dispersal of various radioactive materials by fire and explosion (including uranium and plutonium)
Vixen B Taranaki Unat, 235U, 239Pu
1960–1963
12 Effect of accidental detonation and ongoing weapons development (explosive dispersal of uranium and plutonium)
a All sites were at Maralinga, with the exception of some trials conducted at Emu Field, 190 km north of Maralinga.
126 Australian participants in British nuclear tests in Australia — Vol 1: Dosimetry

Table 7.18 Radiological and non-radiological hazards at the Minor Trials
Location Hazard Trial DatesAmounta (kg) Residual contaminationb
Emu Bec Kittens 1953 0.036Kuli Be Tims 1957–61 65.2 Areas >1 mg/m2
Unat Tims 1957–61 7500 <40 kBq/m2
Naya Be Kittens 1955–57 0.75Be Tims 1957 1.6239Pu Tims 1960–61 1.2 Areas of the order of 100 MBq/m2
Unat Rats 1955 151 Areas >4 kBq/m2
Unat Kittens 1955–57 120Unat Kittens 1957–62 60.4
Wewak Be Vixen A 1959–61 6 Areas >1 mg/m2
239Pu Vixen A 1959 0.98 Areas >4 kBq/m2
Unat Vixen A 1959 67.8 Areas >4 kBq/m2
Taranaki Be Vixen B 1960–63 17.6239Pu Vixen B 1961–63 22.2 Areas of the order of 100 MBq/m2
Unat Vixen B 1961–63 24.9235U Vixen B 1961–63 22.4
Dobo 228Th Rats 1959–60 Areas >4 kBq/m2
Unat Rats 1959–60 28a This refers to the amount of material used and is not necessarily the amount of material released.b From Statement of Residual Radioactive and Toxic Contamination, 17 Jan 1961c Not a radiological hazard
7.7.2 Dosimetry outcomes
Table 7.19 lists the estimated radiation dose assignment categories for participants in activities during the period following the Antler tests and in any of the minor trials.
Glossary and common acronyms 127

Table 7.19 Post-Antler activities and minor trials: estimated combined internal and external exposures
Task/exposure Work group Evidence/dataExposure category
Radiation surveys Australian Health Physics Group
The median cumulative dose to January 1962 was 14.7 mSv (Australian Health Physics Representative [AHPR] reports).
C
Collect 60Co pellets Radiation Detection Course (21 Aug 1958 to 19 Sept 1958)
Approx 110 pellets collected by 19 people. The total dose from film badges was 62.4 mSv (i.e. approx 3 mSv per person or approx 0.5 mSv per pellet (AHPR report Sep 1958).
B
Collect 60Co pellets Australian Health Physics Group (July to August 1958)
70 pellets were collected by seven people (i.e. an average of 10 pellets per person). At 0.5 mSv per pellet, the average dose is approx 5 mSv (AHPR reports July & Aug 1958).
C
Practical monitoring exercises
Radiation Detection course attendees Sep 1959 and Jun 1960
Recorded doses (AHPR reports): Sep 1959 course 0.2–0.6 mSv;Jun 1960 course 0 mSv.
A
Initial decontamination of DC12
Training Unit (TU) AHPR report (Feb 1960) gives details. Recorded doses ranged from 0.7 to 7 mSv.
C
Removed 1 TBq of waste activity from DC12 in five large crates, including two hotboxes. Operation monitored to ensure no inhalation hazard
Training Unit, Technical Services (TS), Health Physics (HP), Decontamination (DC) Groups and engineers
AHPR report (Mar 1961) gives details for personnel: summary range (mSv): 10–40, 0.7–4.3, 11–22, 3–18, <0.2–7.
TU group: DTS group: BHP group: DDC group: CEngineers: A-C
Range support Maralinga Range Support Unit (MARSU) Engineers
AHPR reports give details. Members recorded film badge readings of 0.2 to 1 mSv. The inhalation dose, calculated for 90 to 200 d post-fission, is almost the same as the external dose. The total dose is estimated to be 0.4 to 2 mSv.
B
Fencing contaminated areas where areas of 239Pu contamination may have existed
MARSU Engineers Assume 1 MBq/m2 of 239Pu, 60 h work at breathing rate of 3 m3/h = 7 mSv.
C
a TBq = Terabecquerel (i.e. 1012Bq)
7.8 RAAF
7.8.1 Introduction
A large number of RAAF personnel were involved at various stages of the test series. However, it was only air and ground crews participating in the sampling of radioactive clouds and subsequent decontamination of aircraft that faced potentially high exposures. Cloud sampling tasks were usually carried out within a few hours of the explosion. Initially ground crews were given little advice on the precautions necessary during the decontamination of aircraft that had flown through the clouds.
128 Australian participants in British nuclear tests in Australia — Vol 1: Dosimetry

A study of the hazards to personnel from contaminated aircraft made the following general observations (Kulp and Dick 1960):
for aircrew participating in cloud penetration flights, the exposure to external radiation is much higher than to internal radiation from ingestion or inhalation
for those servicing aircraft, the external radiation hazard is more important than the ingestion hazard even with fresh debris; three days after the nuclear explosion, the hazard from gamma radiation was 10 to 100 times more significant than the ingestion hazard
the level of external hazard from a contaminated aircraft can be measured with a calibrated gamma-survey meter
an indication of the inhalation/ingestion hazard can be obtained from a close (2.5 cm) beta survey meter; smear sampling is not particularly useful without suitably calibrated counting equipment.
In this section, the various hazards to RAAF personnel resulting from cloud sampling are considered. The changes in knowledge and therefore management of the radiological hazard to RAAF personnel are reviewed for each test series.
7.8.2 Hurricane
Both Symonds (1985) and the Royal Commission (1985) discuss in some detail the sampling of the radioactive cloud from the Hurricane test. This was appropriate given that film badges, dosimeters (QFEs) or gamma-ray detection equipment were not provided for the first sampling flights. The lack of equipment to assess radiation exposures of aircrew probably resulted from the views of Marley, the Head of Health Physics Division at the UK Atomic Energy Research Establishment (AERE), who considered that under defined circumstances flying through a cloud of nuclear weapons debris would give a negligible dose to the aircrew. Marley also indicated that avoiding flying through the visible cloud following an atomic bomb explosion was sufficient to guard against radiation injury. At later times, when the visible cloud had dispersed, Marley considered that there would be no danger to aircrews (Symonds 1985, p 43). Marley’s views would have been based on UK experience in flights over the Atlantic whilst sampling clouds from US nuclear tests. Cloud sampling in Australia was much closer to the explosion site. Ironically, the initial sampling of the radioactive cloud was somewhat delayed because of communication problems between HMS Campania and the Broome base. This, by default, implemented Marley’s criteria for the initial flights.
Doses to the aircrew were estimated to be no more than 10–20 µSv. The dose to the ground crew servicing the aircraft was stated in the Royal Commission report (Commonwealth of Australia 1985, paragraph 5.5.47) as being well within the approved lowest radiation dosage level. These estimates were based in part by comparing the Hurricane data to data gained later during the Totem series held in 1953. Doses to aircrew of the Dakota flight from Broome to Onslow were estimated to be small, given the gamma dose rate of 0.01 µSv/h measured in the aircraft on landing.
Glossary and common acronyms 129

7.8.3 Totem
Overview
One striking aspect of air operations during Totem is the apparent breakdown in communication when AWRE and the RAF failed to inform the RAAF of the radiation hazards. Both Symonds (1985) and the Royal Commission (1985) report that the RAAF were led to believe there was minimal hazard to RAAF personnel and aircraft associated with sampling radioactive clouds. The RAAF responded well to the unexpected hazard. With the support of AWRE, RAF and USAF experts, the RAAF learnt the basis of the control of aircraft contamination after sampling the T1 cloud and how to manage exposures for the smaller sampling program after the T2 test. The experience gained from control and decontamination procedures developed at Emu, Woomera and Amberley contributed to the success of control procedures used during the later test series.
Operation Hotbox
One potentially hazardous exercise, which had peripheral Australian involvement, was a research program, separate from the air sampling and survey programs, designed to assess the performance and safety of an aircraft flying near and in radioactive clouds. The need for this arose from a controversy over whether and when aircraft could be safely used in such an environment. An RAF Canberra was modified by sealing the aircraft against entry of contaminants, and it carried external filters to sample the radioactive cloud. The aircraft entered the cloud at 9 minutes after T1 exploded and took just over 9 seconds to transit the cloud. Further passages were made 100 ft (30 m) above and below the cloud. The aircraft was surveyed with a 1021 contamination monitor, isolated for 4 hours and then decontaminated by six trained RAAF officers wearing protective clothing, including masks (Commonwealth of Australia 1985 p 207). Sir William Penney vetoed a similar flight for T2 because of unnecessary risk.
Cloud sampling
Unpressurised Lincoln bombers were used to track and sample the radioactive clouds produced by the T1 and T2 tests. Table 7.20 summarises some features of these investigations (Gale 1954). The USAF also participated using a B29 based at Richmond. Their contribution is not discussed here, although two Australians may have joined the flights.
For T1, sampling was carried out at 600, 1200 and 2000 km from GZ using, respectively, the Woomera, Townsville and Richmond bases. The intercept distances correspond to times after fission of 11 hours, 25 hours and 44–51 hours, respectively. The RAAF were led to believe that cloud sampling at these ranges would not pose a hazard (see Section 7.8.2) and the crews flew with no means of determining their radiation doses or for limiting the personal radiation hazard; neither protective clothing nor film badges were issued. Contamination was evident in aircraft sampling at the 400 mile (644 km) point, and on their return to Woomera procedures were put in place to isolate and decontaminate the aircraft. Extensive discussions of this incident are to be found in Symonds (1985) history and the Royal Commission report (paragraphs 6.5.32 to 6.5.92).
For T2, only four Lincoln aircraft were flown from Woomera base, with two of the aircraft acting as couriers. The crew were provided with dosimeters, film badges and protective clothing. The two aircraft that flew through the cloud were heavily contaminated. Curiously, the aircrew in the cloud-intercepting flights were later shown to
130 Australian participants in British nuclear tests in Australia — Vol 1: Dosimetry
have received only small gamma doses. Inhalation of radioactive particles was limited by breathing a mixture of cabin air and oxygen through masks. The added oxygen increased from nil as the height above 3000 m increased.
Aircraft decontamination
It was not realised until two days after T1 that the air sampling aircraft were contaminated and it was not until five days after T1 that radiological control measures were instituted. Nine Lincoln aircraft operating from Woomera had various levels of contamination: three were highly contaminated, three were slightly contaminated and two had some areas just above the ‘tolerance level’ as it was then described. The remaining aircraft had contamination below the tolerance level. Two men known to have serviced the aircraft before control measures were put in place received estimated gamma doses of up to 5 mSv and beta doses of 53 to 58 mSv (Austin 1954; Commonwealth of Australia 1985, p 220). They were not permitted to do further work on contaminated aircraft. Austin’s narrative suggests that the men servicing the Lincoln aircraft were not issued with film badges.
The radiation control measures at Woomera, not established until five days after T1, were (Austin 1955):
restricting access to aircraft
issuing protective clothing to personnel working outside the aircraft, including head covering, and contamination monitoring; personnel were not permitted to eat, drink or smoke until declared free of any contamination; if clothing was contaminated above a pre-determined level, 15 cps on a 1021 monitor, it was left for laundering
disallowing personnel working inside the aircraft to eat, drink or smoke until monitored on leaving the aircraft; these personnel were not issued with protective clothing
segregating the equipment from the aircraft until checked and, if necessary, decontaminating this equipment.
Similar measures were also put in place at RAAF Richmond.
Glossary and common acronyms 131

Table 7.20 Summary information on Totem air sampling flights by Lincoln aircraft (adapted from Gale 1954)
Test AircraftBasea
Time in cloud (min)
Intercept time (h)
Max concentrationb (KBq/m3)
Filter β activity (Bq)
Corrected to day
Gamma dosec (MSv)
Residual dose-rated (µSv/h)
Sampling at 600 km from ground zero (GZ)T1 A73-47 W 10 H + 11 1100 108 D + 1 0.5 120
A73-52 W 45 H + 11 1100 3 x 10⁸ D + 1 1.2 250A73-53 W 55 H + 11 400 4 x 10⁷ D + 1 0.1 2A73-54 W 30 H + 11 400 108 D + 1 0.06 2A73-56 W 10 H + 11 1100 108 D + 1 0.45 100
T2 A73-41 W Aircraft withdrawn to avoid unnecessary cloud contactA73-47 W 45 H + 10.5 400 3 x 10⁷ D + 1 na naA73-52 W 60 H + 10.5 1100 6 x 10⁷ D + 1 na na
Sampling at 1200 km from GZT1 A73-25 T ~150 H + 25 ~40 ~3 x 10⁷ D + 4 ~0.5 ~20Sampling at 1800 km from GZT1 A73-21 R na H + 44 na 104 D + 4 <1 <1
A73-26 R na | na 2 x 10⁵ D + 4 <1 <1A73-27 R On
descentto na 103 D + 4 <1 <1
A73-37 R On ascent | na 105 D + 4 <1 <1A73-40 R On ascent H + 51 na 3 x 10⁵ D + 4 <1 <1
a W = Woomera, T = Townsville, R = Richmondb Maximum concentration encountered in cloud during flightc Integrated gamma dose to crew membersd Residual dose-rate on landingna = not available
Radiological surveys using aircraft
UK scientists equipped three Dakota aircraft to carry out radiation surveys of ground contamination. These aircraft operated from Woomera using a flight plan that included flying in arcs at nominated distances from GZ and also along the line of maximum fallout. Air or ground crews working with these aircraft would have received little, if any, additional radiation doses from the Dakota operations, as cloud interceptions were not involved.
7.8.4 Mosaic
Aircraft survey
RAF aircraft were used to assess ground deposits out to a distance of 600 km. The aerial surveys were carried out using type 1398 aerial survey equipment fitted to Vickers Varsity aircraft and Westland Whirlwind helicopters. A background survey was made over the length of Trimouille Island prior to G1 and over the crater area after G1. An aerial survey from Onslow to Broome using Varsity aircraft was undertaken on D1 + 1 day. Before and after G2, aerial surveys were carried out over a course from Onslow to Darwin via Port Hedland, Broome, Derby, Wyndham and return. Small areas of fallout of less than 2 µSv/h were located.
132 Australian participants in British nuclear tests in Australia — Vol 1: Dosimetry

Cloud sampling
Sampling was undertaken by an RAAF crew flying an RAF Canberra for both G1 and G2. The RAF crews were engaged in re-entry operations from RAAF Pearce. They were issued with a sortie badge and a QFE. Table 4 of Hole (1957) summarises doses in excess of 0.5 mSv for staff based at RAAF Pearce. The table indicates that the external radiation doses to RAF personnel fall into two groups:
for flight crews, 23 to 58 mSv
for ground crews, 0.7 to 3.5 mSv with one extreme reading of 8 mSv.
The larger values have been adopted for RAAF personnel, although it is not clear whether Australian aircrew flew similar sorties or were monitored in the same way as RAF and AWRE personnel.
Aircraft decontamination
The limited decontamination of aircraft carried out at Pearce Field involved only partial cleansing of the aeroplanes. Before the aircraft were moved to the Buffalo trials at Maralinga, a barrier paint was used to seal any remaining contamination.
7.8.5 Buffalo
Overview
As in earlier series, aircraft were used to sample the radioactive clouds shortly after a test, to track the clouds and to survey the ground surface at some distance from the test site. Aircraft were also used to search for people, mainly Aborigines, who may have lived in or moved through the test areas. By the Buffalo series, methods were in place to minimise the radiation hazard to the service personnel from contaminated aircraft. The Decontamination Group carried out aircraft decontamination principally at the Maralinga airfield. The decontamination centre was staffed by both RAF and RAAF personnel. Aircraft contaminated to a lesser degree were decontaminated at RAAF Edinburgh, South Australia, using personnel trained and supervised by a member of the British Decontamination Group.
Aircraft surveys
Mainly RAF aircraft were used to assess ground fallout deposits out to a distance of 600 km. The aerial surveys were carried out using plastic scintillator detectors fitted to Vickers Varsity aircraft and Westland Whirlwind helicopters. The Varsity aircraft were used to obtain background measurements of the firing area and out to approximately 600 km prior to each test. Type 1398A aerial survey equipment was used in these surveys. After each test, radiation contour measurements were made out to approximately 80 km from GZ and later out to approximately 600 km to establish the fallout pattern. The aircraft also carried type 1324 and 1392A dose rate meters. The helicopters were fitted with type 1398 aerial survey dose rate meters for the crater surveys.
Cloud sampling
During cloud sampling, the radiation dose rate in the aircraft cabin was monitored using a type 1324 survey meter, which used three scales ranging up to 3 mr/h (30 µSv/h) and a type 1392A survey meter that read logarithmically up to 100 mr/h (1 mSv/h).
Glossary and common acronyms 133

Measurements were also made of the total activity on filter samples taken from air entering the cabin of Canberra aircraft. Table 7.21 summarises estimates of the inhalation of fission products for four cloud-sampling operations (Holmes 1958), together with estimates of the internal doses based on present-day ICRP dose conversion factors.31 It is known that an Australian aircrew flew one of ten RAF Canberras32 that were involved in cloud sampling during Operation Buffalo, but it is not known which particular aircraft was used. There would have also been exposures to RAAF personnel involved in decontamination operations. A document dated 12 November 1956 from the Director-General Medical Services (Australian Army) shows that the radiation doses to RAAF personnel following the One Tree test were below 6 mSv and most were recorded as ‘less than 0.4 R’ (<4 mSv). These, however, are not consistent with the results in the first two rows of Table 7.21.
The program included two primary sampling aircraft for each explosion plus other samplers and trackers for penetrating the cloud at later times. Four Canberra aircraft were each contaminated on at least one major sampling sortie, and two Varsities were also contaminated to a moderate degree. The inter-round period was cut from ten to seven days, thus reducing the time available for dealing with the aircraft between shots. Because the aircraft had to be left for two to three days in order for the radioactivity to decay to a level at which prolonged working was possible, this meant that the decontamination treatments between explosions were perfunctory (Stevenson 1957).
Table 7.21 Mean external γ doses and estimated internal doses from cloud sampling during Operation Buffalo (adapted from Holmes 1958)
Round RAF Aircraft number
Time of cloud penetration
Duration of sample
Estimated intake (MBq)
Estimated internal dosea
(mSv)
Mean γ doseb (mSv)
1 WH 978 F + 22 min 30 s 79 3 301 WH 979 F + 2.75 h 75 min 14 3 72 WH 978 F + 33 min 41 min na na 33 WH 976 F + 1 h 2 min 21–79 2–7 304 WJ 754 F + 20 min 36 s 166 7 38a Estimated effective dose from inhalation of fission products based on the intake and International Commission on Radiological Protection dose conversion factors (ICRP 2001)b Mean γ dose to whole body during operation
Aircraft decontamination
All decontamination was carried out by Decontamination Group DC3 at Maralinga and Edinburgh fields using 1320, 1324, 1349A and NIS44 instruments to determine contamination levels. The RAF Task Force was transferred en bloc from Operation Mosaic to Operation Buffalo with aircraft that were still partially radioactive. At Operation Mosaic, all aircraft were painted with AWRE barrier paint prior to operational use. Contaminated aircraft were resprayed with this paint to seal in contamination after participation on active missions and, because of limited facilities, no final decontamination work could be attempted. Because of this continuing lack of facilities, these aircraft continued to fly with the ‘old and weathered barrier paint coating dating from 4 months earlier’ (Stevenson 1957).
31A caveat is that it is not clear in the original report how Holmes derived the intakes to the lungs for crew in unmodified aircraft by using air filter measurements made in modified aircraft.32 The RAF Canberra aircraft were involved in cloud sampling, cloud tracking and meteorological operations.
134 Australian participants in British nuclear tests in Australia — Vol 1: Dosimetry
Stevenson also noted that the decontamination facilities were designed to accommodate one or two aircraft only and were inadequate for the number involved in Operation Buffalo.
7.8.6 Antler
Aircraft surveys
Mainly RAF aircraft were used to assess ground deposit. After the cloud had passed, an aerial survey was done using improved type 1398A equipment fitted in Vickers Varsity aircraft and Westland Whirlwind helicopters. The radiation detectors were calibrated by comparing dose rates determined by the aircraft with the dose rates measured by a ground survey (see Section 7.6.2). Both surveys were made along a length of road that crossed the fallout pattern. As soon as the distant fallout had been deposited, the aircraft measured the fallout by flying across the pattern at various distances from GZ.
Cloud sampling
An RAAF crew was made available for air operations in one of ten RAF Canberra aircraft.33 These personnel may have flown on one or more of the sampling flights made during the three Antler firings. The sampling programs were designed to limit aircrew radiation doses to less than 30 mSv. Integrated doses of 47 mSv for Round 1, 12.5 to 34 mSv for Round 2 and 100 mSv for Round 3 were recorded for RAF crews (Eyre 1958).
Aircraft decontamination
This was now a British responsibility and no RAAF personnel were involved (RC800).
7.8.7 Potential sources of exposure for RAAF personnel
Table 7.22 lists the potential exposure sources and pathways that were considered relevant when assessing the data for all RAAF operations.
Table 7.22 Potential irradiation pathways for RAAF operationsSource External hazard Internal hazardCloud sampling Immersion in the cloud
Contaminated aircraft surfacesInhalation of active particles
Surface contamination Aircraft surfacesContaminated clothing
Decontaminating aircraft
7.8.8 Dosimetry outcomes
Tables 7.23 and 7.24 list the assigned exposure categories derived from estimated external and internal doses, respectively, resulting from RAAF operations during all major test series.
Table 7.23 RAAF operations: estimated external exposures33 RAF Canberras were used for cloud sampling, cloud tracking and meteorological operations.
Glossary and common acronyms 135

Task/exposure Work group Evidence/dataExposure category
Operation HurricaneFlying through contaminated cloud
Air crew in RAAF Lincolns
No badges or dosimeters were provided; doses could be estimated from activity on filters external to aircraft; Symonds’ report suggests a dose of no more than 20 µSv.
A
Servicing and decontaminating aircraft
Ground crew Doses estimated from exposure to contaminated aircraft surfaces are small — external dose rates from the surfaces of aircraft were of the order of 10 µSv/h from sampling at H + 24 h and 0.1 µSv/h from sampling at H + 55 h.
A
Operation TotemFlying through contaminated cloud
Air crew in RAAF Lincolns
Gale (1954) — see Table 7.20 B
Servicing and decontaminating aircraft
Ground crew Austin (1954); Commonwealth of Australia (1985), p. 220
B
Operation MosaicFlying through contaminated cloud
RAAF air crew in an RAF Canberra
Table 4 of Hole (1957) quotes RAF exposures of up to 58 mSv; see Section 7.8.4
E
Aerial survey Air crew No contact with radioactive cloud AServicing and decontaminating aircraft
RAAF ground crew servicing and decontaminating RAF aircraft
See Section 7.8.4. Contamination control procedures were only instituted after Totem 1; see Section 4.2.2 and Section 7.8.3.
B
Operation BuffaloFlying through contaminated cloud
RAAF air crew in an RAF Canberra
See Table 7.21 D
Aerial survey Air crew No contact with radioactive cloud AServicing and decontaminating aircraft
RAAF ground crew servicing and decontaminating RAF aircraft
By analogy with Totem and Mosaic B
Operation AntlerFlying through contaminated cloud
RAAF air crew in an RAF Canberra
For RAF aircrew the reported integrated doses were 47 mSv for Round 1, 12.5 to 34 mSv for Round 2 and 100 mSv for Round 3 (Eyre 1958). Thus, external dose could be as high as 180 mSv if an RAAF aircrew participated in all three flights and received similar doses.
E
Servicing and decontaminating aircraft
RAAF ground crew servicing and decontaminating RAF aircraft
By analogy with Totem and Mosaic B
Table 7.24 RAAF operations: estimated internal exposures
136 Australian participants in British nuclear tests in Australia — Vol 1: Dosimetry
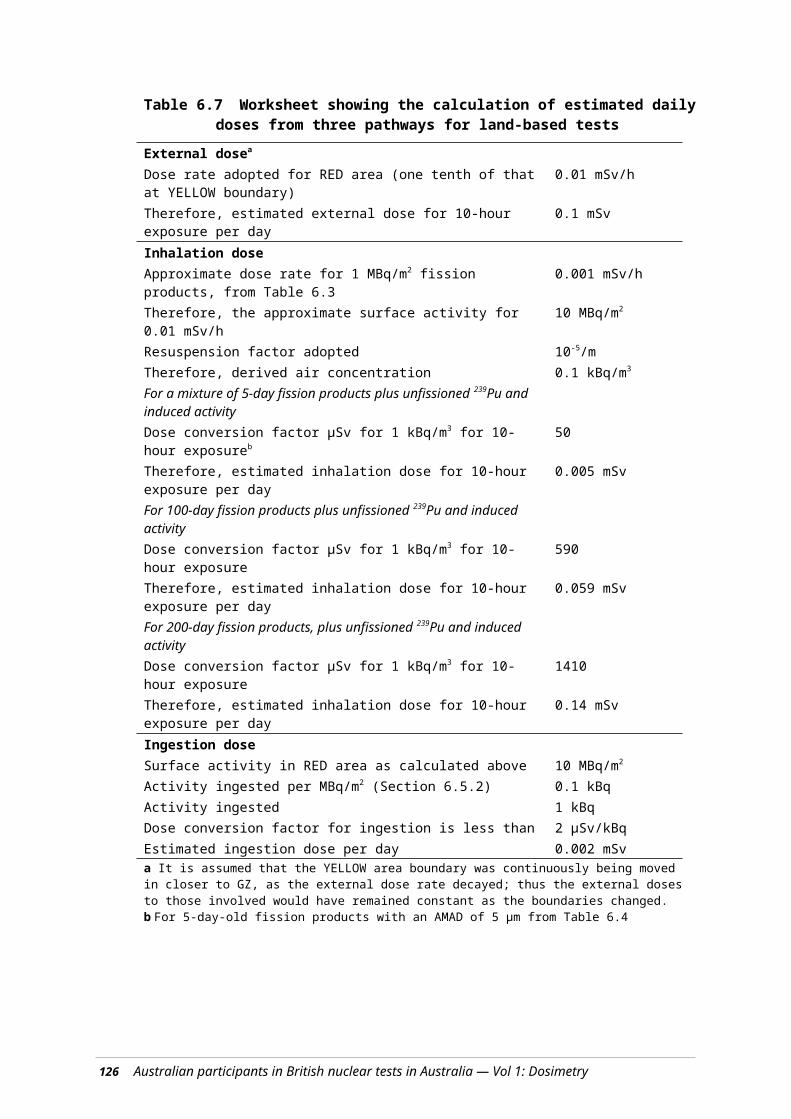
Task/exposure Work group Evidence/dataExposure category
Operation HurricaneFlying through contaminated cloud
Air crew in RAAF Lincolns
Atomic Weapons Research Establishment (AWRE) theoretical physics note indicates fission product particulates could give lung dose comparable to external dose (i.e. no more than 20 µSv).
A
Servicing and decontaminating aircraft
Ground crew Doses estimated from ingestion of all activity on hands are small — of the order of 1 µSv or less.
A
Operation TotemFlying through contaminated cloud
Air crew in RAAF Lincolns
Table 7.21, for Operation Buffalo, indicates internal dose is approx one-quarter of external dose. Max external dose for B category is 5 mSv, which suggests internal dose is approx 1.3 mSv.
B
Servicing and decontaminating aircraft
Ground crew There would have been little inhalation hazard as the contamination was generally ‘well held’ by oil and grease (Austin 1954).
A
Operation MosaicFlying through contaminated cloud
RAAF air crew in an RAF Canberra
Table 7.21 indicates internal dose is approx one-quarter of external dose. Max external dose for D category is 50 mSv, which suggests internal dose is approx 12 mSv.
C
Servicing and decontaminating aircraft
RAAF ground crew servicing and decontaminating RAF aircraft
External dose for ground crew from Hole (1957) is less than 5 mSv and one-quarter of this suggests an internal dose of approx 1.2 mSv.
B
Operation BuffaloFlying through contaminated cloud
RAAF air crew in an RAF Canberra
See Table 7.21 C
Aerial survey Air crew No contact with radioactive cloud AServicing and decontaminating aircraft
RAAF ground crew servicing and decontaminating RAF aircraft
External dose for ground crew from Hole (1957) is less than 5 mSv and one-quarter of this suggests an internal dose of approx 1.2 mSv.
B
Operation AntlerFlying through contaminated cloud
RAAF air crew in an RAF Canberra
Table 7.21 indicates internal dose is approx one-quarter of external dose. External doses, assuming air crew participated in three rounds, is approx 180 mSv, suggesting internal dose is approx 45 mSv for participants in all three rounds.
D
Servicing and decontaminating aircraft
RAAF ground crew servicing and decontaminating RAF aircraft
External dose for ground crew from Hole (1957) is less than 5 mSv and one-quarter of this indicates an internal dose of approx 1.2 mSv.
B
Glossary and common acronyms 137
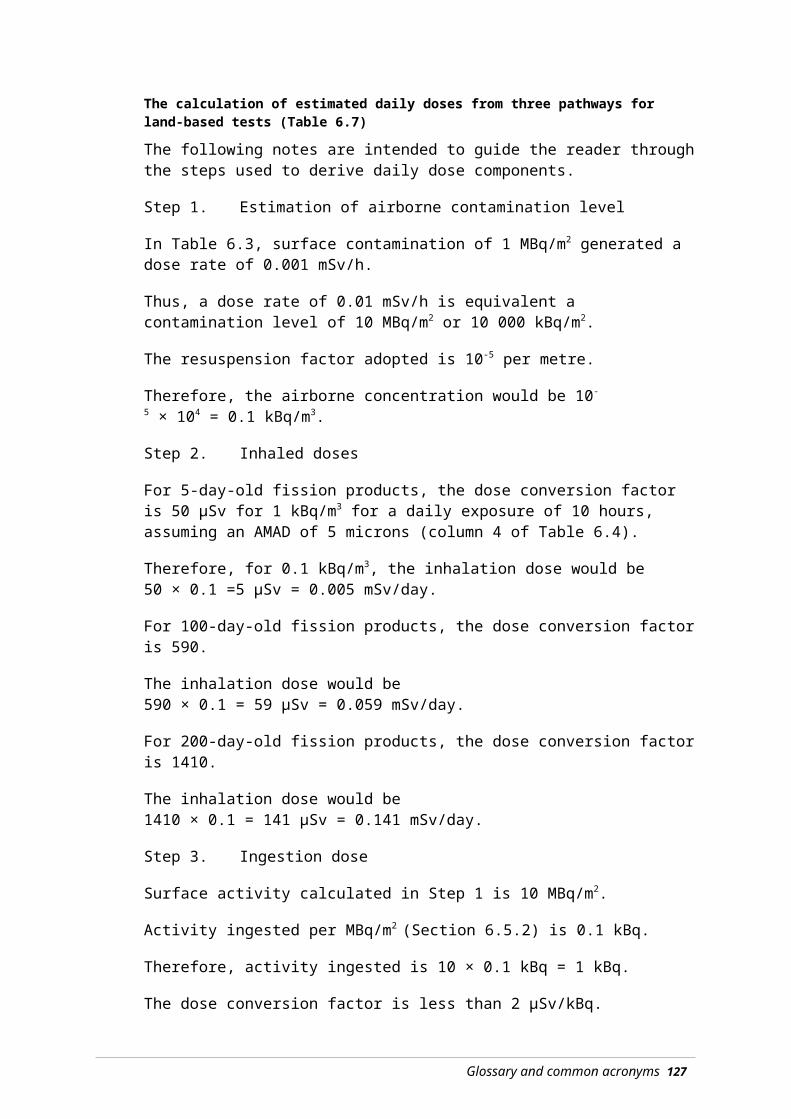
7.9 Overall exposures
7.9.1 Work groups
The tasks performed by individuals or groups were examined for each of the major tests. A summary of the principal findings is shown in Table 7.25.
Groups with exposures in category A (i.e. the lowest exposures) included:
most Australians at Operation Hurricane
most Australians at Operation Mosaic
most Australians at Operation Totem
the large number of military and civilian participants who were involved in infrastructure and support duties, including transport, supply of services, equipment maintenance, camp staff and others, who did not enter contaminated areas.
Those participants exposed in category B included:
crews and divers from ships operating in the Monte Bello Archipelago after Operations Hurricane and Mosaic
scientific and survey teams
engineering support teams
some RAAF air and ground crews.
The following main groups were exposed at the level of category C or higher.
The Australian aircrews who flew RAF Canberra aircraft through contaminated clouds during operations Mosaic, Buffalo and Antler. The external doses were either in category D (Buffalo) or in category E (Mosaic and Antler); the internal doses are estimated to have been in category C or D. The combination of estimated external with internal doses results in an overall category E assignment for these groups.
During the Hurricane test program, crews from HMAS Hawkesbury and HMAS Koala crew were category C and divers from HMAS Koala who recovered a landing craft were category D. Most members of the Joint Services Training Unit were category C; three individuals in JSTU received doses in the D or E category.
During the Totem series, those with category C exposures included the Peace Officers and those travelling extensively in contaminated vehicles over contaminated ground. Members of the Radiation Hazards Group who performed surveys near GZ probably incurred category D exposures.
During the Buffalo series, category C exposures were received by members of the Indoctrinee Force and by those engineers or scientists in the MARSU who recovered instruments, equipment containers and target response items. MARSU personnel who made several entries could have had category D exposures. MARSU continued to operate during the inter-trial period.
During the Antler series, personnel with exposures in category C were the MARSU Engineer Troop and the MARSU recovery teams. Those members of MARSU who
138 Australian participants in British nuclear tests in Australia — Vol 1: Dosimetry

worked at more than one round of this series or were involved in more than one task giving a dose of category C could have had category D exposures.
Peace Officers who continued to work in the post-Antler period and drove for lengthy periods in contaminated areas could have had category D exposures. Peace Officers/Commonwealth Police/Australian Protective Service (APS) continued to patrol the range until 1987. Williams (1990, p 135) estimated the inhalation dose for Australian Protective Service patrols at 0.55 mSv per 6-week period of duty per mg/m3 of inhalable dust. Williams derived the dose from the levels of inhalable plutonium and other radionuclides present in 1987. No allowance was made for either external or ingestion doses. Williams noted that the Peace Officer/APS patrols were unsupervised and members of the service were not adequately briefed on the risks and actions to be taken to minimise radiation doses.
Following the cessation of the major tests, the AHPG had radiation safety responsibilities for the range. Members of the AHPG group incurred category C or D doses conducting radiation surveys. Some AHPG members also received category C doses whilst collecting 60Co pellets scattered in the first Antler round (Tadje).
Following completion of the minor trials, Building DC12, the high-level radionuclide handling facility, was decontaminated. This required the removal of a highly contaminated ‘hotbox’ and five crates of radioactive waste. Participants received exposures in categories C or D.
The exposure groups are summarised in Table 7.26.
Glossary and common acronyms 139

Table 7.26 Summary of main exposure outcomes
140 Australian participants in British nuclear tests in Australia — Vol 1: Dosimetry

Test period
Dose category for taskA B C D E F
Hurricane Most participants RAAF air crewRAAF ground crew
Crews of ships operating in the Archipelago up to day D + 16Crews of small ferry boatsDivers recovering mooring buoysWorking parties on Trimouille island
Joint Services Training Unita
Crews from HMAS Hawkesbury and HMAS Koala
Divers from HMAS Koala
Totem Most participants
Members of Totem 1 site inspection teamRAAF and ground and aircrew
Peace OfficersDrivers and participants transported in contaminated vehiclesd
RAAF air crew
Radiation Hazards Group
RAAF ground crewb,c
Mosaic Most participantsRAAF ground crew
Crews of HMS Diana, HMAS Fremantle, Junee, Karangi RAAF ground crew
RAAF air crew flying RAF Canberras
Buffalo Most participantsRAAF ground crew
ARDU, DC 2 team
Indoctrinee ForceDrivers and participants transported in contaminated vehiclesd,e
Maralinga Range Support Unit (MARSU) Engineering and Scientific teamsf
Peace Officersg
RAAF air crew flying RAF Canberras
Inter-trial Most participants
Australian Radiation Detection Unit (ARDU)RAAF ground crew
MARSU Engineering and Scientific teamsf
Antler Most participants
Vehicle decontaminationTransport in contaminated vehiclesRAAF ground crew
MARSU Engineering and Scientific teamsf
Peace Officersg
RAAF air crew flying RAF Canberras
Post- Most Radiation Australian DC12
Glossary and common acronyms 141

Test period
Dose category for taskA B C D E F
Antler/Minor Trials
participants Detection Course(collection of 60Co)MARSU range support
Health Physics Group (AHPG) radiation surveyorsAHPG 60Co pellet collection
Decontamination Team including AHPGPeace Officersg
a Three individuals received doses in D or E category.b Except for those known to service the aircraft before control procedures were put in placec 92% of all participants in category F (unknown) are from the RAAF (see Table 7.26).d This includes drivers and passengers in vehicles travelling over contaminated ground.e Includes the inter-trial period between Operations Buffalo and Antlerf Those members of MARSU Engineer and Scientific teams who worked at more than one round or were involved in more than one task giving a dose in category C could have had exposures in category D.g From the end of Operation Buffalo to the closure of the range and beyond
7.9.2 Exposure statistics
The overall distribution of radiation exposures amongst the study cohort of Australian test participants is set out in this section.
Table 7.27 Numbers exposed in each category
Exposure category RAN Army RAAF Civilian Total %<1 mSv A 2274 747 2028 3616 8665 78.91 to 4.9 mSv B 622 45 19 12 698 6.45 to 19.9 mSv C 194 201 71 40 506 4.620 to 50 mSv D 2 232 3 163 400 3.6>50 mSv E 0 4 14 1 19 0.2Unknown F 5 16 639 35 695 6.3Total 3097 1245 2774 3867 10983Film badge 169 196 61 44 4.3RAN = Royal Australian Navy; RAAF = Royal Australian Air Force
Overall, 79% of the study cohort received doses less than 1 mSv. This dose level is equivalent to the current recommended annual dose limit for members of the Australian public and about half the dose received annually from natural background radiation. Approximately 4% received greater than 20 mSv, the current recommended annual dose limit for workers in Australia. The average dose to the participants was approximately 2.8 mSv.
The Army was the most heavily exposed group, with 35% being in category C or above.
The table also includes the numbers of participants for whom a film badge record is available. Overall, only 4% of the participants have some recorded monitoring, and this could be seen as of some concern for the study. However, as noted above there were a number of major work groups for which significant exposure was highly unlikely.
The Dosimetry Panel formed the view that the lack of comprehensive monitoring data has not affected the broad outcome of this study.
142 Australian participants in British nuclear tests in Australia — Vol 1: Dosimetry
Most RAN personnel were at Hurricane or Mosaic where they spent most of the trial period(s) on their ship, and the whereabouts and likely resulting exposures of these are well known.
Many of the unmonitored RAAF personnel were on bases where contaminated aircraft were serviced, but they had no involvement with them. Large numbers of the civilians were employed in service functions in and around the camps, and so were not monitored.
For the Army, the number with monitoring records is 16%. This group includes many of the most exposed Engineers and Infantry who regularly entered contaminated areas.
As discussed earlier in Section 5.3, the Dosimetry Subcommittee is of the opinion that there was sufficient information available, in reports, official papers and sundry other documents, to overcome the relatively small number of film badge records.
The following comparison with a major UK study supports the Dosimetry Subcommittee’s view.
7.9.3 Comparison with a United Kingdom study
An independent study, similar to the one reported here, has been undertaken for the British participants in nuclear weapons testing (Muirhead et al 2003). Table 7.28 summarises their results for the Australian tests. Only external doses were assessed in the British study (this Australian study includes internal and external radiation exposures); thus, the tabulated doses will be an underestimate of the total dose. Based on our results, the underestimation will be small, with the possible exception of those involved in some of the minor trials.
Table 7.28 Summary of doses estimated for British participants in weapons tests in Australia
SeriesNo. participants No. monitored No. >1 mSv
Max. individual dose (mSv)
Hurricane 1398 1340 179 48Totem 106 78 54 145Mosaic 1383 599 56 210Buffalo 1285 786 194 53Antler 1548 737 172 160Maralinga Experimental Program (Minor Trials)
555 510 61 54
Maralinga other 2555 253 10 36All series 8830 4303 726 210
Overall, the results are similar to those derived in this study for the Australian participants:
83% of the British would be placed in category A (compared with 79% of the all Australian participants)
the mean dose of the ‘non-zero’ categories was 7.1 mSv, which is lower than the mean dose for Australian ‘non-zero dose’ participants of approximately 15 mSv.
Glossary and common acronyms 143
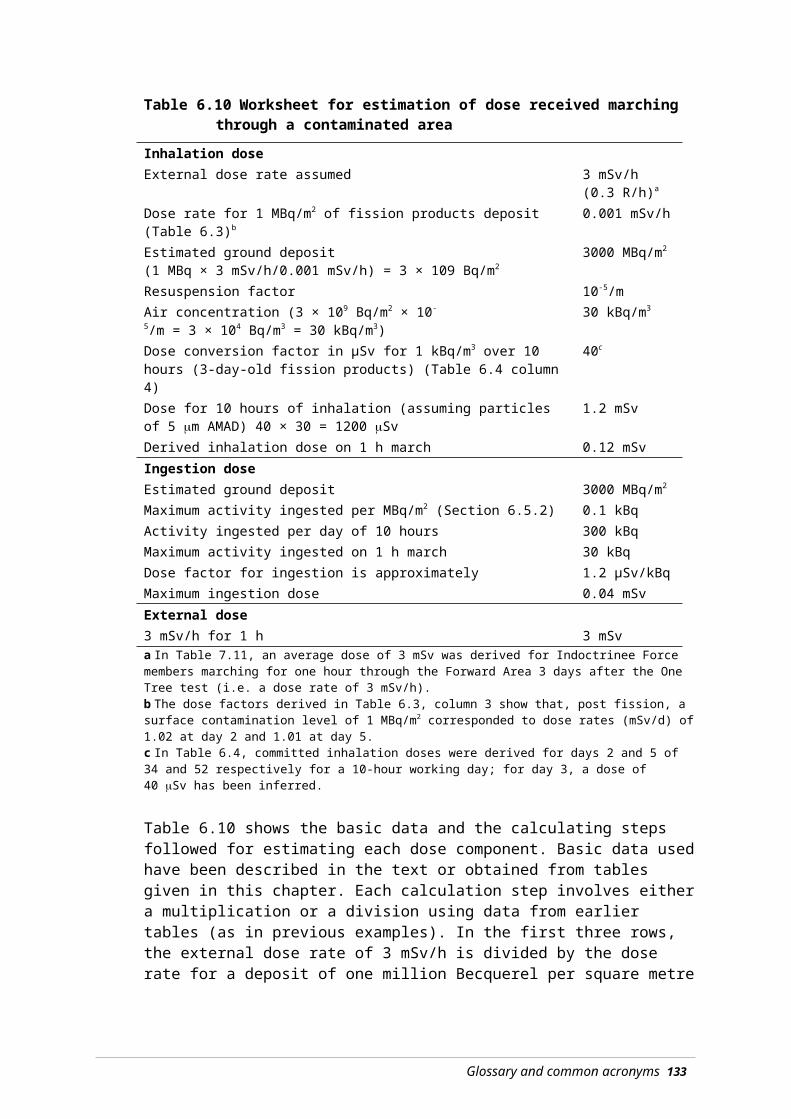
However, there are some differences in the higher dose categories. The highest known dose for the Australians was 133 mSv from film badge records. For the British participants, the highest dose during the Australian tests was 210 mSv, and RAF personnel received almost all of the doses above 100 mSv, presumably during cloud sampling. It is also reasonable to assume that British scientists were closely involved in some of the high dose-rate tasks, such as early recovery of instruments and samples after an explosion.
There is a significant difference between the numbers of British and Australians for whom monitoring records have been found. There are personal monitoring records for only 4 % of the Australians, compared with 49% for the British. To some extent, this is to be expected because, as noted above, British participants were more likely to have been closely involved in the actual tests, whilst many Australians were employed in support roles that did not bring them into significant contact with radiation. Nevertheless, the difference is striking, and may reflect different policies having been applied to the two groups. However, it is also noteworthy that of all the British participants monitored, 68% had external doses that were too low to be detected by the film badges used.
7.10 Case control study
Following the estimation of doses to work group categories, a total of 270 individual doses were estimated for the ‘case control’ study, and 32 individuals were re-assessed for quality control purposes.
For these assessments, all available information on the individuals was considered. This included the information gathered for the work group assessment, individual service records, Nominal Roll data, and information available from questionnaires submitted to the Donovan Study.
Some differences between the individual dose estimates and those assigned to the relevant work group were found. Some of these arose from better information on the actual duties performed, others from consideration of the actual times at which the individual was at the test site. However, there was reasonable agreement between the results. The major change was the re-assignment of all but one of the 25 subjects originally assigned to the unknown exposure category (Category F) to a known category, because of the better information available. Three subjects were re-categorised into Category F for the case-control study. Of the other 242 subjects in the case-control study, 212 received the same exposure category as in the cohort study, and a further 20 were re-categorised in the next category up or down. Only in 10 subjects did the exposure change by more than one category.
Further details are described in Section 11.3 of the Mortality and Cancer Incidence Report.
7.11 Conclusions
Overall, the doses received by Australian participants were small. Seventy-nine per cent of participants received exposures in the lowest dose category. Only 2% of participants received more than the current Australian annual dose limit for occupationally exposed persons (20 mSv).
144 Australian participants in British nuclear tests in Australia — Vol 1: Dosimetry

These results were compared with those from an independent study of doses to British participants in the tests in Australia (Muirhead et al 2003). There is good general agreement in the doses received, although some of the British participants appear to have received somewhat higher doses than the most highly exposed Australians (UK 210 mSv vs Australia 133 mSv) and the mean of British non-zero doses was about half the Australian figure.
While there are some significant gaps, it is believed that there is enough information available to make reasonable estimates of the radiation doses received by Australian participants, and that our methods have achieved this. It has also been noted that the estimates derived here are generally consistent with the estimates made for British participants.
The main function of this report is to support the epidemiological study of the mortality and cancer incidence amongst the Australian participants in the British nuclear tests in Australia. While it is obviously highly desirable that the doses derived are accurate, the most important requirement is that the ranking of participants according to dose should be valid. Even if there were substantial underestimations (or overestimations) of doses, provided that the more highly exposed participants have been correctly distinguished from those with smaller or zero doses, this would not invalidate the epidemiological study. We are confident that this requirement has been achieved.
7.12 References
Austin J (1955). The Prevention and Removal of Radio-active Contamination, Part 6: Decontamination of aircraft and health control at Woomera and Amberley, AWRE Report T106/54, Atomic Weapons Research Establishment, Aldermaston.
AWRE (Atomic Weapons Research Establishment) (1956). Radiological safety regulations Maralinga, 5th edn, AWRE Report RSRM/56 (5), Atomic Weapons Research Establishment, Aldermaston.
Commonwealth of Australia (1985). The report of the Royal Commission to British Nuclear Tests in Australia Vol 1 and 2, Australian Government Publishing Service, Canberra.
Cooper MB, Duggleby JC, Kotler LH and Wise KN (1978). Residual radioactive contamination of the Maralinga Range from nuclear weapons tests conducted in 1956 and 1957, Australian Radiation Laboratory Report ARL/TR005, Australian Radiation Laboratory, Melbourne.
Dale GC (1955). Safety levels for contamination from fallout from atomic weapon trials, AWRE Report O-41/55, Atomic Weapons Research Establishment, Aldermaston.
Eyre AW (1958). Airborne sampling of radioactivity, AWRE Report T24/58, Atomic Weapons Research Establishment, Aldermaston.
Gale HJ (1954). Radioactive sampling and analysis report, AWRE Report T6/54, Atomic Weapons Research Establishment, Aldermaston.
Glossary and common acronyms 145
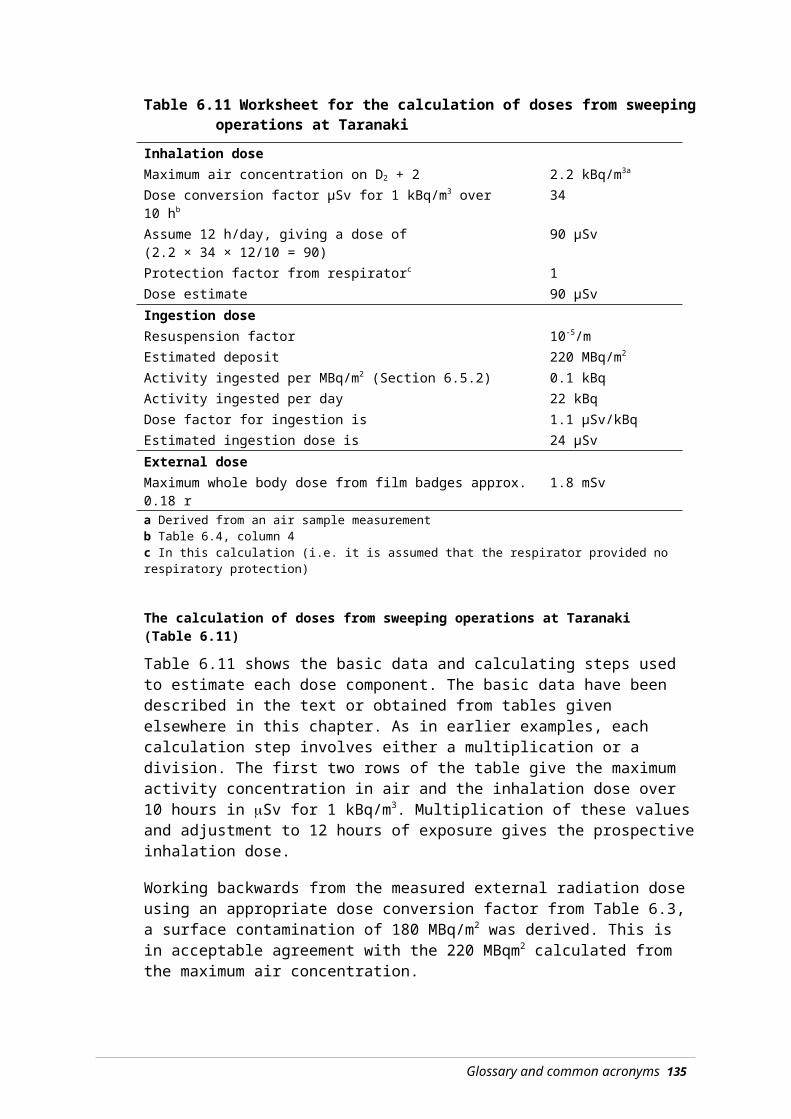
Gaskell WTM and Saxby WN (1956). The survey of residual contamination from Operation Totem, AWRE Report T4/55, Atomic Weapons Research Establishment, Aldermaston.
Hole JA (1957). OPERATION MOSAIC: Radiological Group report, AWRE Report T21/57, Atomic Weapons Research Establishment, Aldermaston.
Holmes RE (1958). The hazards to aircrew flying through atomic cloud, AWRE report T54/57, Atomic Weapons Research Establishment, Aldermaston.
ICRP (1990). Recommendations of International Commission on Radiological Protection, Pergamon Press, Oxford.
Janisch Maj DBB et al (1957). Target response tests: Field trials of radiac instruments in a radioactively contaminated area, AWRE report T2/57, Atomic Weapons Research Establishment, Aldermaston.
Kulp JL and Dick JL (1960). The radiation hazard from contaminated aircraft. Health Physics 4:133–156.
McDougall WG, Rexford-Welch SC and Douglas K (1958). Operation Antler: Health Physics Services, UKAEA Report T45/58, Atomic Weapons Research Establishment, Aldermaston.
Muirhead CR et al (2003). Mortality and Cancer Incidence 1952–1998 in UK participants in the UK Atmospheric Nuclear Weapons Tests and Experimental Programmes, National Radiation Protection Board Report NRPB–W27, National Radiation Protection Board, Chilton (ISBN 0-85951-499-4).
Rae JJ (1957). The radiation survey of ground deposited radioactivity, AWRE report T49/57, Atomic Weapons Research Establishment, Aldermaston.
Stevenson DG (1957). Decontamination group report, Parts 1–4, AWRE report T22/57, Atomic Weapons Research Establishment, Aldermaston.
Symonds JL (1985). A History of British Atomic Tests in Australia, Australian Government Publishing Service, Canberra.
Williams GA (1990). Inhalation Hazard Assessment at Maralinga and Emu, Australian Radiation Laboratory Report ARL/TR078, Australian Radiation Laboratory, Melbourne.
Wise KN and Moroney JR (1992). Public health impact of fallout from British nuclear weapons tests in Australia, 1952–1957, Australian Radiation Laboratory Report ARL/TR105, Australian Radiation Laboratory, Melbourne.
146 Australian participants in British nuclear tests in Australia — Vol 1: Dosimetry

Glossary and common acronyms
The definitions of some terms have been simplified to assist nontechnical readers
absorbed dose The energy absorbed in material from ionising radiation interacting with it. The current unit is the Gray (J/kg).
activation products (induced activity)
Radioactive substances formed when materials absorb neutrons — for example, from the detonation of a nuclear weapon.
AERE Atomic Energy Research Establishment, Harwell UK.
AHPR Australian Health Physics Representative.
airburst The detonation of a nuclear weapon at such a height that the expanding fireball does not contact the earth’s surface.
alpha particle (α) A form of ionising radiation: a particle made up of two neutrons and two protons. Alpha particles are emitted in the radioactive decay of many heavy elements such as uranium and plutonium. They can have substantial energy when emitted from the atom, but are easily stopped by paper or the outer layer the skin.
AMAD Activity Median Aerodynamic Diameter: a measure of the ‘size’ of radioactive dust particles. Generally expressed in microns, equal to one millionth of a metre.
APS Australian Protective Service.
ARDU Australian Radiation Detection Unit.
ARL Australian Radiation Laboratory (between 1973 and 1999), now ARPANSA. Formerly the Commonwealth X-ray and Radium Laboratory (CXRL).
ARPANSA Australian Radiation Protection and Nuclear Safety Agency, which was formed by the ARPANS Act 1998 by merging the ARL and the Nuclear Safety Bureau.
atomic bomb (or weapon) A weapon using nuclear fission to produce an explosion.
AWRE Atomic Weapons Research Establishment, Aldermaston UK.
AWTSC Atomic Weapons Tests Safety Committee.
147
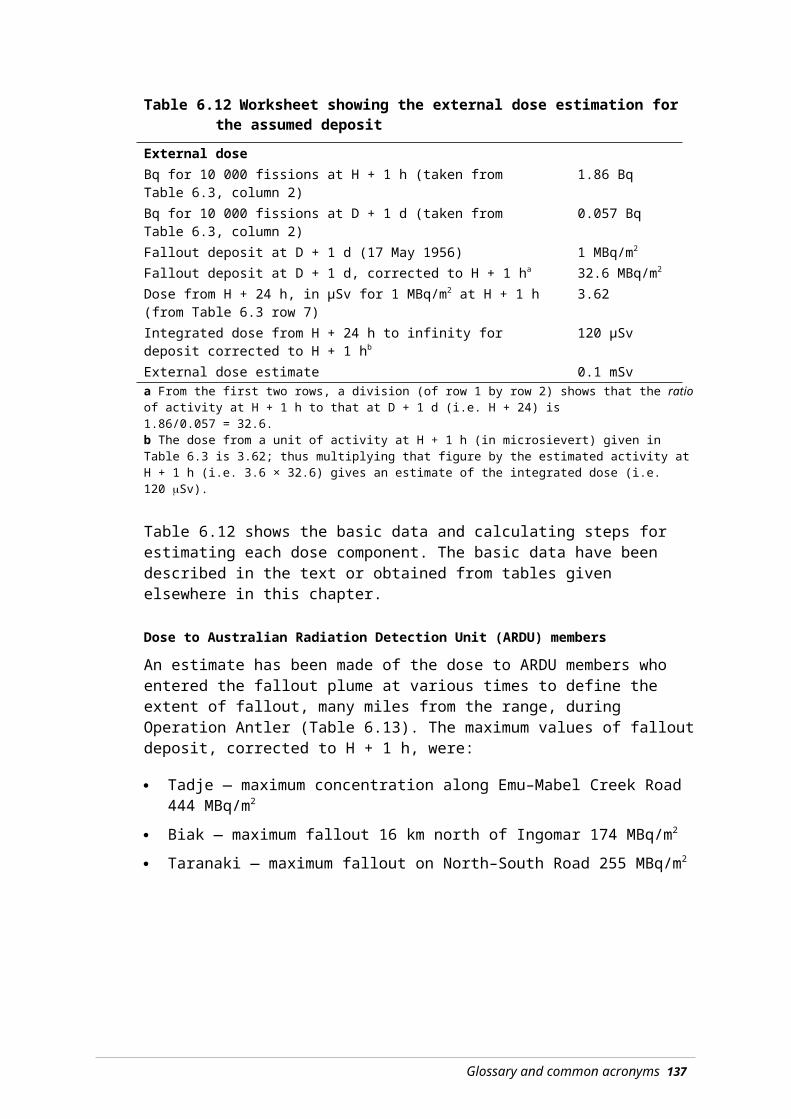
background radiation Ionising radiation in the everyday environment arising from natural sources: gamma radiation from the ground, radioactive gasses in the air, radiation from building materials and cosmic radiation from space. Typical background radiation doses in Australia are approximately 2 mSv per year.
Becquerel (Bq) The unit of the amount of radioactivity (activity) in a material. 1 Bq = 1 radioactive decay per second in the sample (1 dps).
beta particles (β) An electron or positron emitted by the nucleus during radioactive decay. Beta particles are more penetrating than alpha particles and large doses can cause skin burns.
biological half-life The time required for a radioactive material taken into the body, or present in a particular organ, to be reduced to half of its initial value as a result of natural, biological excretion processes.
case-control A type of observational epidemiological study. People with the disease in question (cases) are ‘matched’ with people of the same age, sex and so on, but who do not have the disease (controls). The two groups are then examined for possible causes of the differences (e.g. exposure to radiation, smoking, lifestyle).
chain reaction The process by which neutrons released from fission in a fissile material cause further fissions, which in turn release further neutrons. In a nuclear weapon, the aim is to build up the number of neutrons and thus fissions, as quickly as possible.
committed dose The total dose a person will receive during the remainder of his or her lifetime, as the result of an intake of radioactive material (by inhalation or ingestion). The committed dose may be received over a number of years, until the radioactive material decays away or is excreted. By convention, the whole dose is included in the assessed dose for the year of intake.
controlled area An area to which access is controlled, and people entering are required to follow radiation protection requirements.
cps Counts per second: not identical with disintegrations per second (dps) because of instrument efficiencies. For example, a count rate of 100 cps on a counter of 10% efficiency represents 1000 dps.
148

CST (Australian) Central Standard Time. The time zone applying to the Emu and Maralinga sites.
Curie (Ci or c) The unit of radioactivity used at the time of the UK nuclear tests. It is equal to 37 000 million disintegrations per second. The current unit is the Becquerel (Bq): 1 Ci = 37 000 million Bq.
CXRL Commonwealth X-ray and Radium Laboratory, Melbourne, the predecessor of ARL and ARPANSA.
decay or radioactive decay The spontaneous emission from atomic nuclei of either alpha or beta particles, often accompanied by gamma radiation, leading to the decrease in activity of the radioactive material over time.
decontamination The reduction or removal of radioactive contamination from a structure (buildings, etc), area, object (aircraft, vehicles, etc), clothing or person.
delayed fallout Part of the process of the descent of radioactive material from a radioactive cloud. Delayed fallout consists of smaller particles that remain aloft for a significant time, and can be transported a considerable distance, even globally, from the site of an atomic explosion.
deterministic effect An effect, caused by radiation, which only occurs above a radiation exposure threshold. The severity of the effect increases with increasing dose.
detriment A concept developed by ICRP to indicate the potential deleterious effects of exposure to ionising radiation. It includes allowances for the risk of fatal cancer, morbidity from non-fatal cancers, life shortening due to cancers in different organs and the risk of serious hereditary effects in all future generations descended from the person irradiated.
dose A generic term for the amount of radiation received. It may mean absorbed dose, equivalent dose or effective dose depending on context.
Glossary and common acronyms 149

dose conversion factor A numerical value used to convert a measurement or estimate of radioactive material taken into the body, or an activity concentration in the air or on the ground surface, to an estimate of radiation dose. The conversion factors include allowances for the half-life of the radionuclide, the radiations emitted and their energies. Account is taken of the particular organs the materials may concentrate in and the radiosensitivity of those organs. The rate of biological excretion is also taken into account. The conversion from activity to dose is worked out to 50 years after exposure. Thus conversion factors for a long-lived radionuclide such as 239Pu, which has a long half-life and deposits in bone, is very different to 3H, which has a much shorter half-life and is excreted relatively rapidly.
dosimeter A device, instrument or system used to measure radiation dose.
dosimetry The accurate measurement of radiation doses.
dps Disintegrations per second. One dps is one Becquerel (Bq).
effective dose A measure of dose which takes account of the potential health effects that may arise following radiation exposure. It includes a factor to correct for the type of radiation involved (radiation weighting factor) and a further factor to allow for the radiological sensitivities of the organs and tissues involved (tissue weighting factor). The unit is the Sievert (Sv).
electromagnetic radiation Radiation made up of oscillating electric and magnetic fields that travel at the speed of light. Includes gamma radiation, X-rays, ultraviolet, visible, and infrared radiation, radar and radio waves.
electron A subatomic particle of very small mass carrying one negative charge.
electron volt A measure of the energy of ionising radiation: it is the energy gained by an electron passing through an electrical potential of 1 volt. One MeV is one million electron volts.
epidermis The outermost layer of skin.
150 Australian participants in British nuclear tests in Australia — Vol 1: Dosimetry

equivalent dose A measure of dose in organs and tissues that takes into account the type of radiation and its ability to cause biological damage (radiation weighting factor). Tables of radiation weighting factors are provided by ICRP. Confusingly, as for effective dose, the unit is the Sievert (Sv).
EST (Australian) Eastern Standard Time.
exposure A general term indicating human contact with ionising radiation.
exposure pathway The physical course or route by which a radioactive material may irradiate people.
external radiation Radiation from sources external to a person’s body.
fallout Deposition of radioactive material produced by a nuclear explosion. ‘Local fallout’ is defined as fallout that reaches the earth within 24 hours of the nuclear explosion. See also ‘delayed fallout’.
film badge A type of dosimeter that uses the darkening of photographic film to determine an individual’s radiation dose.
fireball The luminous cloud of hot gases formed in the instant after a nuclear explosion.
fissile Material capable of undergoing (nuclear) fission. The important fissile isotopes in nuclear weapons are plutonium (239Pu) and uranium (235U, 238U).
fission See ‘nuclear fission’.
fission products (see nuclear fission)
A general term for the complex mixture of nuclides, both stable and radioactive, produced as a result of nuclear fission.
fission weapon A weapon using the large energy released by the process of nuclear fission to generate an explosion. Commonly called an atomic bomb (A-bomb).
fractionation The separation of fallout radionuclides produced in a nuclear detonation caused by the differences in condensation rates as the fireball cools.
fusion See nuclear fusion.
fusion weapon A weapon using the large amount of energy released by the process of nuclear fusion to generate an explosion. Commonly called a hydrogen bomb (H-bomb).
Glossary and common acronyms 151
gamma () radiation A form of electromagnetic radiation emitted by the nuclei of many radionuclides.
Geiger–Müller counter An instrument used for the detection and quantitative measurement of gamma and beta radiations. Often called simply ‘Geiger counter’.
genetic A term used when something is based on or related to genes (e.g. genetic damage).
Gray (Gy) The unit of absorbed dose. It is defined as one joule of energy per kilogram of the medium irradiated.
ground zero (GZ) The point on the surface of the earth directly below the point of explosion of a nuclear weapon.
half-life The length of time taken for a radioactive material to decay to 50% of the initial quantity. See also: biological half-life and radioactive half-life.
health physics That science devoted to the recognition, evaluation and control of health hazards from ionising and non-ionising radiation.
hotbox A colloquial term used to describe a specially designed box in which high level radioactive sources can be manipulated. The hotbox in Building DC 12 was highly contaminated with radioactive materials. (The term was also used to describe a British experiment, involving a sealed RAF Canberra aeroplane flying through the radioactive cloud after Totem 1.)
induced radioactivity When nonradioactive materials are bombarded with neutrons, they can be converted into radioactive substances. For example, when nonradioactive 59Co is placed in a nuclear reactor some is converted to radioactive 60Co. During a nuclear explosion, slightly radioactive, long half-life 238U can be changed into 239U, which decays relatively quickly to 239Pu.
ICR International Congress on Radiology.
ICRP International Commission on Radiological Protection.
initial nuclear radiation (also known as ‘prompt radiation’)
Nuclear radiation, mainly gamma radiation and neutrons, emitted by the fireball and the cloud column in the first minute after a nuclear explosion.
inhalation The breathing in of (in this case) radioactive materials which can then irradiate internal body organs.
152 Australian participants in British nuclear tests in Australia — Vol 1: Dosimetry

initiator A device to generate neutrons to initiate the chain reaction in a nuclear weapon’s fissile material, thus producing a nuclear explosion.
internal exposure Radiation exposure arising from radioactive materials within a person’s body as a result of intake by either inhalation or ingestion.
inverse square law When radiation from a point source is emitted uniformly in all directions, the dose rate at any given distance is proportional to the inverse square of the distance from the source of radiation (assuming no absorption by shielding). This means that the dose rate at, say, 2 m from a radiation source is one quarter of that at 1 m.
ion An atom or molecule that carries a positive or negative charge as a result of having lost (or gained) one or more orbiting electrons.
ionising radiation Radiation that directly or indirectly causes ionisation in matter through which it passes. It is a general term, which includes alpha particles, beta particles, X-rays, gamma rays and neutrons.
isotopes Atoms of the same element that have the same number of protons (and hence the same chemical properties), but a different number of neutrons, and therefore, different atomic weights. Isotopes can be stable or radioactive.
Joule (J) The unit of energy: 1 Joule = 0.24 calorie. 1 electron volt = 10-19 J.
JSTU Joint Services Training Unit.
kiloton (Kt) A measure of the explosive force of a nuclear weapon. A 20 Kt weapon is equivalent to the explosive force of 20 000 tonnes of TNT.
leukaemia A group of malignant, commonly fatal, blood diseases.
maximum permissible body burden (mpbb)
A concept used in limiting radiation exposures from inhalation or ingestion, by setting maximum amounts of radioactive materials that could be (safely) accumulated in the body. Now obsolete.
maximum permissible concentrations (mpc)
The level of radioactive material in air or water that, if breathed or ingested, for 40 hours per week, 50 weeks per year, would lead to 1 mpbb.
MEP Maralinga Experimental Programme, the name used for the minor trials program after 1957.
Glossary and common acronyms 153

MeV One million electron volts (106).
minor trials The generic name for a range of experiments conducted at Emu and Maralinga that included tests of weapons components, safety tests of weapons under accident conditions and tests of neutron initiators.
MARSU Maralinga Range Support Unit.
NAA National Archives of Australia.
neutron An elementary particle with a mass approximately that of the hydrogen atom. Carrying no charge, it is a constituent of all atomic nuclei (except hydrogen).
NRAC National Radiation Advisory Council.
nuclear fission The process in which the nucleus of a heavy element splits into (usually) two lighter nuclei with the release of a substantial amount of energy.
nuclear fuel Fissionable or fusible materials that that can generate energy by fission or fusion reactions. Usually isotopes of uranium or plutonium.
nuclear fusion A nuclear reaction process in which lighter nuclei are merged to form heavier ones and which is usually accompanied by a large energy release.
nuclide A species of atoms having a specified number of protons and neutrons in their nucleus, e.g. . U is the symbol for uranium, which always contains 92 protons, 235 means the nucleus contains a total of 235 neutrons and protons (i.e. 92 protons and 143 neutrons). Nuclides can be either stable or radioactive. Often written U-235.
pathway The route by which a contaminant travels from the source area to reach a person at risk.
PMG Postmaster General’s Department. Responsible for both postal and telephone services.
point source An idealised discrete source of radiation that is of an infinitesimally small size. In practice, a point source is one where the dimensions of the source are small compared with the distance at which the radiation is being measured or a person being exposed.
prompt radiation See: initial nuclear radiation.
protocol The formal guidelines which describe the conduct of this study; see Appendix 5.
154 Australian participants in British nuclear tests in Australia — Vol 1: Dosimetry

proton An elementary particle with a mass approximately that of the hydrogen atom and carrying a positive charge; it is a constituent of all atomic nuclei.
quartz fibre electroscope (QFE)
A direct reading pocket dosimeter, typically used to measure the dose received during a particular task. It is based on the principle of the gold-leaf electroscope.
RAAF Royal Australian Air Force.
Rad Radiation absorbed dose: the former unit of absorbed dose defined as 0.01 J of energy adsorbed per kg of the medium irradiated. Now replaced by the Gray (Gy).
RAF Royal Air Force
radiation dose See: dose.
radiation protection (radiological protection)
The control of exposure to ionising radiation by the use of principles, standards, measurements, models, and other means such as restrictions on access to radioactive areas or locations where radiation fields may be encountered.
radiation sickness Acute physical illness caused by exposure to doses of ionising radiation large enough to cause toxic reactions, in most people approximately 1 Sv. The symptoms can include nausea, diarrhoea, headache, lethargy and fever.
radiation weighting factor (Wr)
A factor that that allows for the different abilities of different radiations to cause biological damage. ICRP has established a range of radiation weighting factors ranging from 1 for gamma rays up to 20 for alpha particles (when inhaled or ingested).
radioactive decay The spontaneous emission of radiation by unstable (radioactive) nuclei.
radioactive half-life The time required for the radioactivity of a specified radionuclide to be reduced to half of its value as a result of radioactive decay. After two half-lives the amount of radioactivity is reduced to one quarter of the initial amount, ten half-lives to 0. 1% (one thousandth).
radioactivity The spontaneous decay or disintegration of unstable atomic nuclei, accompanied by the emission of energy in the form of radiation.
radionuclide A radioactive nuclide.
Glossary and common acronyms 155

radiosensitivity Sensitivity to the action of ionising radiation. Some body organs are more radiosensitive than others. For example, skin is less easily damaged by exposure to ionising radiation than bone marrow.
RAF Royal Air Force.
RAN Royal Australian Navy.
Rem Rad equivalent man, the former unit for equivalent dose.
Rep Abbreviation for roentgen-equivalent-physical. Used to equate radiation doses from radiations other than X- and gamma rays to the roentgen. Now obsolete.
residual radiation Ionising radiation, mainly from gamma rays and beta particles, which persists for some time following a nuclear explosion.
resuspension The process whereby radioactive particles that have been spread on the ground are again suspended in air by wind, moving vehicles, marching and so on.
resuspension factor A factor relating the amount of a material suspended in air to the surface concentration on the ground. For radioactive contamination, it is the atmospheric concentration (in Bq per m3) divided by the surface contamination (Bq per m2). The unit is m.
RN Royal Navy.
Roentgen (R or r) A unit of radiation exposure used at the time of the British nuclear tests. The amount of ionising radiation that will produce 2.58 10-4 coulomb per kg of dry air.
RSRM Radiological Safety Regulations Maralinga.
rule of seven A rule of thumb describing the change in activity of fission products with time. For each seven-fold increase in time since fission, the total activity reduces by a factor of approximately 10. Starting with a unit of activity at 1 hour, the activity is reduced to about a tenth at 7 hours, a hundredth at 2 days, a thousandth at 2 weeks and so on.
SAC Scientific Advisory Committee.
shielding A protective barrier, usually of a dense material, that reduces the passage of radiation from radioactive materials to the surroundings by absorbing it.
156 Australian participants in British nuclear tests in Australia — Vol 1: Dosimetry
SI Systéme International d’Unites: the metric system of units of measurement.
Sievert (Sv) The unit of effective dose, it has replaced the rem.
somatic Pertaining to parts of the body other than egg cells, sperm, and sperm-generating cells. In radiation protection, somatic effects are those such as cancer affecting the person exposed, in contrast to genetic effects arising in their offspring.
specific activity The total activity of a given nuclide per kilogram of a compound, element, or radioactive nuclide.
sticky paper sampler These consisted of a box containing a piece of sticky paper. Immediately before a weapon was fired, the box lids were opened remotely and the paper collected any radioactive material that fell upon it. The samples were collected by, amongst others, members of the Australian Radiation Detection Unit. They were then brought back to the laboratory for counting.
study roll The list of participants in the nuclear test program used as the cohort for the study. It was drawn from a nominal roll of all known participants, less some excluded by study methodology. These were women, pastoralists and rabbiters, indigenous people, and those lacking key information such as date of birth, or dates at test sites.
stochastic effects The potential effects of exposure where there is no apparent threshold before the effect might be observed. The probability that the effect does or does not occur in a particular person depends on the radiation dose received. The main stochastic effects in radiation protection are induction of cancer or genetic disease in offspring.
subatomic particles Constituents of atoms (e.g. electrons, neutrons and protons).
TAG (Maralinga) Technical Advisory Group.
tamper Dense material used in a nuclear weapon to both enhance the compression and reflect neutrons back into the fissile material, thus increasing the efficiency of the weapon. If made of uranium, some of the tamper will undergo fission and contribute to the yield of the weapon.
target response items Materials placed near a nuclear explosion to study changes to them that result from the explosion.
Glossary and common acronyms 157

thermonuclear weapon A fusion weapon, commonly called Hydrogen bomb or H-bomb.
tissue weighting factor (Wt)
A factor that allows for the differing radiosensitivity of different body organs. ICRP provides a table of radiation weighting factors. They range from 0.01 for bone surfaces to 0.2 for gonads.
tolerance dose An old concept: that the body could ‘tolerate’ a certain amount of radiation within a specified period with negligible adverse health effects. Now obsolete.
UKAEA United Kingdom Atomic Energy Authority.
urgency provisions A set of guidelines developed for use in the tests to define the requirements and dose limits for single and emergency entries into forward areas.
WST (Australian) Western Standard Time. The time zone applying to the Monte Bello Island tests.
whole body monitor A radiation detection device consisting of an array of large sensitive detectors designed to monitor the body for low-level gamma-ray emissions from radioactive nuclides in the body. Not available at the time of the tests.
X-ray Electromagnetic radiation similar to gamma rays but usually rather less penetrating. Technically distinguished from gamma radiation by being produced by electrons rather than in the atomic nucleus.
yield The total effective energy released in a nuclear explosion.
158 Australian participants in British nuclear tests in Australia — Vol 1: Dosimetry

Appendix 1 Project staff
Researchers — Mortality and Cancer Incidence Study
Adelaide University Department of Public Health
Dr R Gun MB BS FAFOM, University of Adelaide
Ms J Parsons BA BHSc MPH, Research fellow and study manager
Associate Professor P Ryan MBBS BSc FAFPHM(RACP)
Dr P Crouch BSc(Hons) PhD MARPS
Professor J Hiller DipSocSt BA MPH PhD
Researchers — Dosimetry Study
Mr M Carter BSc(Eng) Honours
Mr F Robotham MInstP
Dr K Wise MAppSc PhD MARPS MACPSEM MSSA
Dr G Williams BSc(Hons) PhD
Dr P Crouch BSc(Hons) PhD MARPS
Staff — Australian Government Department of Veterans’ Affairs
Dr K Horsley, Specialist Advisor Health Studies
Air Commodore (Dr) W Harrex, Consultant Occupational Physician
Mr B Connolly, Director — Research Studies Support
Ms F Tuckwell, Successive Project Officer
Mr D Goldrick, Successive Project Officer
Mr C Clarke, Successive Project Officer
Other staff included Ms A Curry, Mr G Flynn, Mr C Gill, Mr A Leahy, Ms V Ludwig, Ms F Quinlan, Ms C Salmon, Ms M Scerri, Ms M Stewart and Ms D Summerhayes.
159

Appendix 2 Membership of the Consultat ive Forum
Chairs
Mr B Maxwell
Mr B Telford (General Manager, Policy and Development Division)
Members
Major A Batchelor (Retd) MBE
Mr W Lichacz (Aboriginal and Torres Strait Islander Commission)
Mr R Johnstone (Australian Nuclear Veterans’ Association)
Ms A Munslow-Davies (Australian Ex-Service and Atomic Survivors’ Association)
Mr T Toon (Atomic Ex-Servicemen’s Association)
Mr J Sallans (Atomic Ex-Servicemen’s Association)
Mr L Rice (Atomic Ex-Servicemen’s Association)
Mr P Burns (Australian Radiation Protection and Nuclear Safety Agency)
Mr R Spring (National Servicemen’s Association of Australia)
Mr P Alexander (deceased) (Australian Veterans and Defence Services Council)
Rear Admiral I M Crawford AO AM (Mil) (Australian Veterans and Defence Services Council)
Mr B Neyle (Australian Veterans and Defence Services Council)
Mr P Cooke-Russell (Naval Association of Australia)
Commodore M Dowsett (Retd) (Regular Defence Force Welfare Association)
Mr C Snewin (Returned and Services League of Australia Limited)
Mr B Tunnah (Returned and Services League of Australia Limited)
Mr H Michaelis (Returned and Services League of Australia Limited)
Mr R Usher (Royal Australian Air Force Association)
Mr R Christie (Royal Australian Air Force Association)
Dr J Lonergan OBE (Royal Australian Air Force Association)
Mr H Miller (Wangka Wilurrara Regional Council, Aboriginal and Torris Strait Islander Commission)
Professor B Armstrong (Chair of the Scientific Advisory Committee) (Head of Department, School of Population Health and Health Services Research, University of Sydney, Sydney, NSW)
161
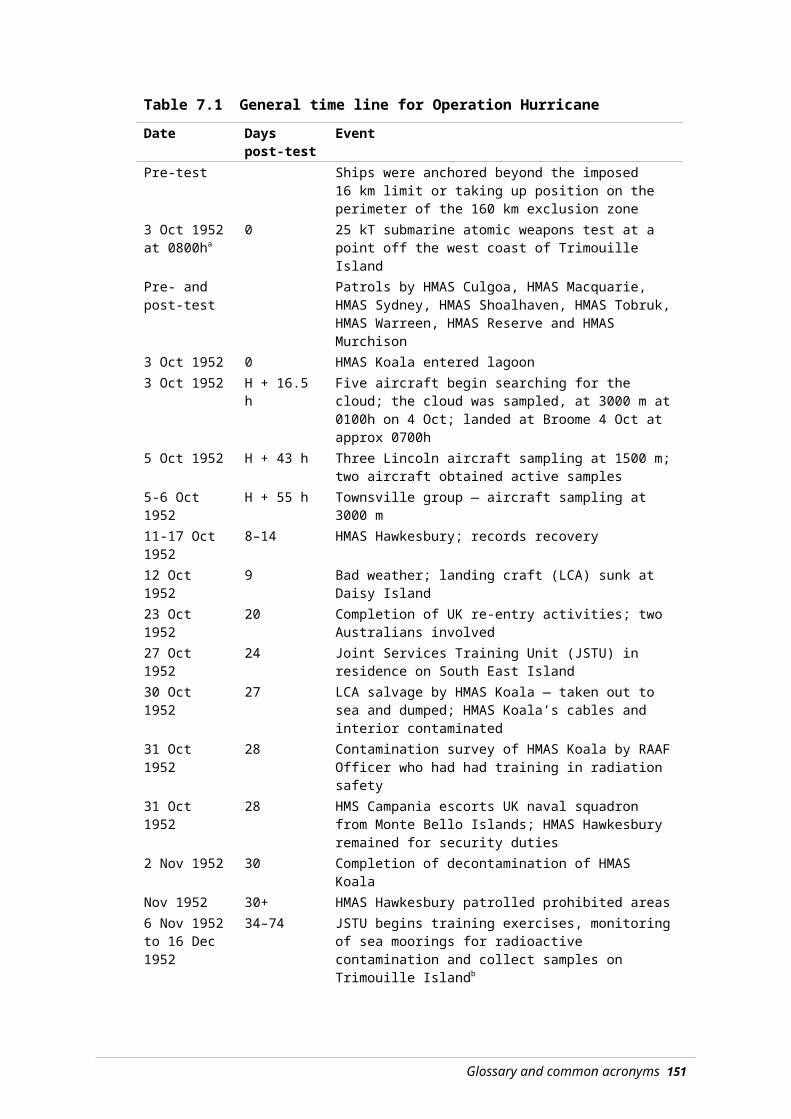
Mr M Carter (Chair of the Dosimetry Subcommittee) Radiation Safety Consultants, Heathcote, NSW
Mr N Bayles (Branch Head, Defence Links/Head Secretariat, Review of Veterans Entitlements, Department of Veterans’ Affairs)
Mr M Johnson (Branch Head, Disability Compensation, Department of Veterans’ Affairs)
Mr A Edgar (Branch Head, Defence Links, Department of Veterans’ Affairs)
Ms H Parry (Branch Head, Defence Links, Department of Veterans’ Affairs)
Ms P Stevenson (Branch Head, Defence Links, Department of Veterans’ Affairs)
Mr J Geary (Branch Head, Defence Links, Department of Veterans’ Affairs)
Ms H Devlin (Branch Head, Defence Links, Department of Veterans’ Affairs)
Ms S Hansen (COMCARE)
Mr N Swails (COMCARE)
Ms V Clingan (COMCARE)
Ms B Stephens (COMCARE)
Mr A O’Shea (COMCARE)
Mr J Brown (Department of Defence)
Mr D Cooke (Department of Defence)
Ms G Wharton (Department of Defence)
Dr L Rymer (Department of Industry, Science and Resources)
Ms M Taylor (Department of Education, Science and Training)
Mr R Mason (Department of Education, Science and Training)
Mr C Whiting (Department of Education, Science and Training)
Successive representatives are listed in chronological order.
162

Appendix 3 Membership of the Scient i f ic Advisory Committee
Chair
Professor B Armstrong AM MBBS(Hons) DPhil(Oxon) FRACP FAA, Head of Department, School of Population Health and Health Services Research, University of Sydney, Sydney, NSW
Members
Professor D Holman MBBS MPH(Harv.) PhD GCLaw GAICD FACE FAFPHM FAIM, School of Population Health, University of Western Australia, Crawley, WA
Professor G Giles BSc MSc PhD, Cancer Control Research Institute, Carlton South, Vic
Professor G Sutherland AC BSc MSc PhD DSc FAA FRS, Bionomics Ltd, North Adelaide, SA
Mr M Carter BSc(Eng) Honours, Radiation Safety Consultants, Heathcote, NSW
Ms A Munslow-Davies BAppSc (Consultative Forum Representative), Australian Ex-Service and Atomic Survivors’ Association
Major A Batchler (Retd) MBE (Alternate Consultative Forum Representative)
163

Appendix 4 Membership of the Dosimetry Sub-Committee, and Exposure Panel
Dosimetry Sub-Committee
Chair
Mr M Carter, Radiation Safety Consultants, Heathcote, NSW
Members
Dr P Crouch, University of Adelaide, Adelaide, SA
Dr G Williams, Australian Radiation Protection and Nuclear Safety Agency
Dr K Horsley, Department of Veterans’ Affairs, Specialist Advisor Health Studies
Ms A Munslow-Davies (Consultative Forum Representative), Australian Ex-Service and Atomic Survivors’ Association
Dosimetry Exposure Panel
Members
Dr P Crouch, University of Adelaide, Adelaide, SA
Dr G Williams, Australian Radiation Protection and Nuclear Safety Agency
Mr F Robotham
Dr K Wise
165
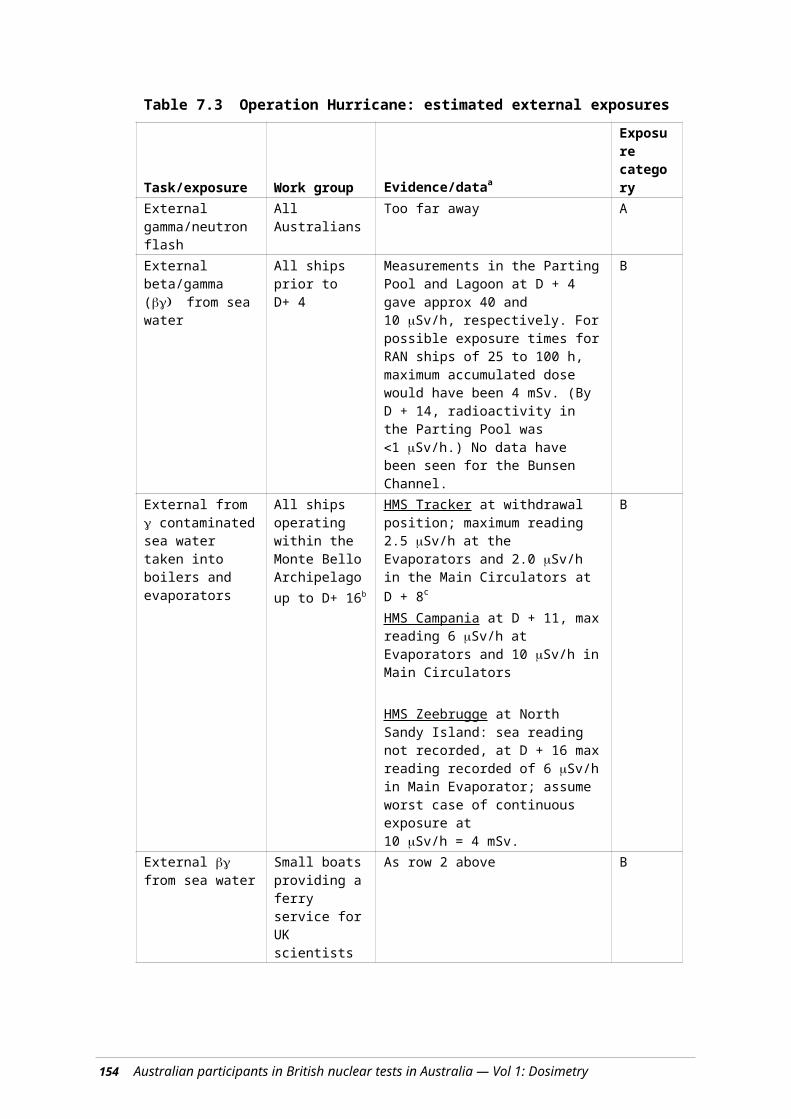
Appendix 5 Mortal i ty and cancer incidence study of Austral ian part ic ipants
in Bri t ish nuclear tests in Austral ia
Dosimetry Exposure Panel
Ionising radiation dosimetry study research protocol
Introduction
This protocol is for an ionising radiation dosimetry investigation to support a cohort study of former members of the Australian Defence Forces and civilians who participated in the British nuclear weapons tests and associated minor trials carried out in Australia between 1952 and 1963.
It is intended that this study, whilst primarily providing radiation dose estimates for the parallel Nuclear Tests Veterans Cancer Incidence and Mortality Study (Gunn et al 2006), will also collate relevant data on information sources used to make these estimates.
Estimation of individual doses for a case-control study of nuclear test participants was covered in the protocol for the Mortality and Cancer Incidence studies.
Background
Between 1952 and 1963, the United Kingdom, with Australian support and involvement, conducted a series of nuclear weapons developmental trials in Australia.
The first explosion, codenamed Operation Hurricane, was at Monte Bello Archipelago on 3 October 1952. A second series of two tests, Operation Totem, took place at Emu Field in 1953. In 1956 two further devices, Operation Mosaic, were exploded at Monte Bello Archipelago, and four at Maralinga: Operation Buffalo. The last series of three major tests was at Maralinga in 1957, codenamed Operation Antler.
In addition, approximately 600 minor trials were carried out between 1953 and 1963. A small number were conducted at Emu Field, whilst the majority were conducted at Maralinga. These were principally tests of aspects of weapon design and safety that did not involve significant levels of nuclear fission. However, several series, in particular some ‘Kittens’ trials and ‘Vixen B’ experiments, did lead to the release of relatively large quantities of radioactive contamination.
Several post-trial cleanup operations have been conducted, most notably in 1963, 1967 and during the 1990s.
Over 16 000 Australians, both civilians and members of the Defence Forces, participated in the various tests. British participants numbered over 20 000. In addition, there was some limited Canadian, New Zealand and United States involvement.
167
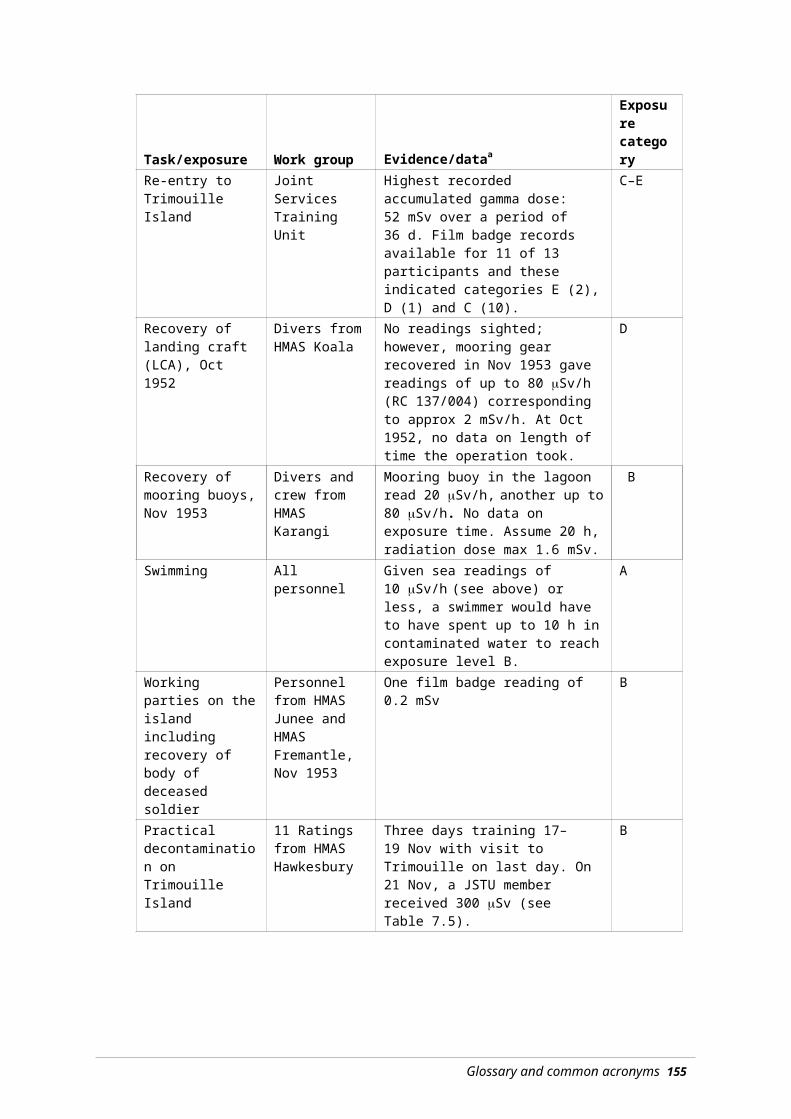
Although the proposal to conduct the nuclear tests in Australia was initially well received, by the late 1970s concerns were being expressed about the long-term health implications for the participants (Tame and Robotham 1982). In 1984, the Australian Government established a Royal Commission (Australian Royal Commission 1985) to review the conduct of the tests and to assess the safety of participants, Australian Aboriginals present at the tests, and the general Australian population.
Over the ensuing 20 years, concerns have been expressed that the Commissioners had not had access to all relevant documents, and their findings, therefore, were not necessarily conclusive.34
During the past five years, two major collections of nuclear test related documents have been assembled that provide a basis for the possible reconstruction of ionising radiation doses that may have been received by Australian participants (Major [Retd] Alan Batchelor and Ms. Ann Munslow-Davies).
There are insufficient data to enable epidemiological studies of the central Australian Aboriginal population of the 1950s. Therefore, the Nuclear Tests Veterans Cancer Incidence and Mortality Study excludes Aboriginal people living near the testing areas. Likewise, this report does not attempt to reconstruct any possible radiation exposures of those Australian Aboriginals.
Health effects of exposure to ionising radiation
The effects of exposure to ionising radiation can be divided into two broad categories:
Deterministic effects
Those effects that become apparent shortly after receiving a large (1 Sv) radiation exposure. The effects range from relatively mild nausea and diarrhoea to death (5 to 10 Sv). Below a threshold dose of approximately 1 Sv, deterministic effects are rarely observed. The rapidity of onset and severity of the effects observed increase with increasing dose.
Stochastic effects
Those effects that may become apparent many years after exposure to one or many incremental doses of ionising radiation. Possible outcomes include leukaemia, certain cancers (e.g. thyroid cancer) and hereditary effects. In the field of radiation safety, it is assumed that there is no threshold below which the effects do not occur, with the likelihood of an effect occurring increasing with increasing radiation dose.
Radiation hazards
There are two ways in which people can be exposed to ionising radiation:
External exposure
The danger that arises from sources of ionising radiation outside the body where all or part of the body may be exposed to radiation fields.
The danger can be minimised by limiting the length of time of exposure, increasing the distance between the radiation source and the person, or shielding the radiation source can control the hazard and minimise external radiation doses.
34 Ms Munslow-Davies and others, Australian Broadcasting Commission (ABC), ‘7.30 Report’, 21 May 2001.
168

Internal exposure
The danger that arises from radioactive materials taken into the body, where they may be retained and directly irradiate internal organs.
The danger can be minimised by minimising the intake of radioactive materials via inhalation, ingestion, or through cuts and wounds.
Objective
This study will aim to:
Categorise, as far as practicable, the exposure to ionising radiation incurred by Australian participants in the British nuclear weapons tests and the associated ‘minor trials’ conducted in Australia between 1952 and 1963.
For each work group or task, the estimated exposures will be grouped into the following categories for ionising radiation dose in millisievert (mSv):
Category A: <1 mSv
Category B: 1 to <5 mSv
Category C: 5 to <20 mSv
Category D: 20 to 50 mSv
Category E: >50 mSv
Category F: unknown
Where the activities/tasks of particular groups are unknown or it is not possible to assign dose estimates, they will be placed in Category F.
Procedure
The study will review available documents for:
external radiation exposure records of participants
external radiation measurements of beta (), gamma () and neutron dose rates
surface contamination measurements of alpha (), and gamma ()
airborne contamination measurements of , and radioactivity
records of contamination of personnel
biological sampling records (urine, faeces, thyroid, blood) for participants
records of tasks undertaken by the exposed groups
other relevant documents (i.e. UK nuclear trial documentation).
Documents will be sought from, inter alia:
Australian Radiation Protection and Nuclear Safety Agency (ARPANSA)
Australian War Museum
Appendix 5 — Mortality and cancer incidence study of Australia participants 169

Australian Nuclear Veterans’ Organisations
COMCARE (the statutory body responsible for workplace safety, rehabilitation and compensation)
Department of Defence
Department of Education, Science and Training
Department of Veterans’ Affairs
Department of Health, Western Australia
Individual researchers (e.g. Batchelor, Munslow-Davies)
National Australian Archives
UK sources (Public Records Office, Imperial War Museum, Atomic Weapons Establishment [formerly Atomic Weapons Research Establishment], National Radiological Protection Board, individual researchers).
Appropriate Australian nuclear veterans will be interviewed and the scientific literature reviewed for recent and/or relevant reports and studies.
Methodology
The following data will be extracted from the reviewed documents:
(i) External exposure records: film badges, quartz fibre electroscopes for .
(ii) Air sample data including Cascade Impactor results for airborne contamination levels and aerosol particle size, for , , and activities.
(iii) Surface contamination levels, including resuspension data for , , and activities.
(iv) Information on contaminated foodstuffs.
(v) Results of any biological analyses; urine, faeces, blood.
(vi) Work tasks and times.
(vii) Work locations.
For each major trial and for minor trials likely to result in significant radiation doses to the study population, an attempt will be made to:
a) determine locations that could pose a possible external or internal hazard and identify potentially exposed groups
b) for external radiation doses, use (i) and (iii) (above) in conjunction with (vi) and (vii) to calculate possible doses
c) for internal radiation exposures, where relevant, use (ii), (iii), (iv), (v) in conjunction with (vi) and (vii) to calculate possible internal committed doses using standard dose conversion factors (International Commission on Radiological Protection)
170 Australian participants in British nuclear tests in Australia — Vol 1: Dosimetry

d) add the calculated and/or measured external and internal doses and assign an exposure category
e) examine the Nominal Roll and where necessary make cumulative dose assessments for those participants who were involved in multiple risk activities (i.e. present at more than one trial series).
Results
An expert panel, convened by the Department of Veterans’ Affairs, will oversee the ionising radiation dose reconstruction study. During their analyses, neither the panel nor the panel’s researchers will review any health data relating to participants.
The study will initially assess each test series individually, and progressive reports will be submitted to the Department of Veterans’ Affairs for matching with the Nominal Roll. The outcome of the dosimetry estimates will then be made available to the Cancer Incidence and Mortality Study Group.
The results of the dosimetry study’s assessed exposure categories will be provided, via the Department of Veterans’ Affairs, to the Department of Public Health, University of Adelaide, for addition to the relevant Cancer Incidence and Mortality Study participants’ records.
For the case-control study, the exposure panel will be supplied with relevant exposure history, but not participants’ names, enabling a more detailed estimate of a subject’s ionising radiation dose.
In all cases, the professional judgement of the researchers supported by members of the exposure panel will be used to make realistic estimates of potential exposure pathways and consequent imputed radiation doses.
References
In addition to the following references, documents collected by Major (Retd) Alan Batchelor and Ms Ann Munslow-Davies were consulted.
Commonwealth of Australia (1985). The report of the Royal Commission to British Nuclear Tests in Australia Vol 1 and 2, Australian Government Publishing Service, Canberra.
Gunn R et al (2006). Cancer Incidence and Mortality Study of Nuclear Test Participants, Department of Public Health, University of Adelaide, and Department of Veterans’ Affairs, Canberra.
ICRP (International Commission on Radiological Protection) (1998). The International Commission on Radiological Protection (ICRP) Database of Dose Coefficients: Workers and Members of the Public: Version 2.01, Committee 2, ICRP, Stockholm, Sweden.
Tame A and Robotham FPJ (1982). Maralinga: British A-Bomb Australian Legacy, Fontana Books, Melbourne.
Appendix 5 — Mortality and cancer incidence study of Australia participants 171

Appendix 6 Some brief notes on radiat ion quanti t ies and units
Introduction
The quantities involved in ionising radiation are measured in SI units, which have been used almost universally for over 20 years. However, at the time of the atomic weapon tests in Australia, an older system of units was used, and these were the units used in contemporaneous monitoring and reports. SI units have generally been used throughout this report, except in some historical contexts, such as where direct quotes are used. This section discusses both systems of units.
SI units
Units used for measuring exposure to ionising radiation
Ionising radiation is defined by its ability to produce ions in matter and its measurement is based on the ionisation caused by the radiation. The health effects in those exposed are believed to be a result of ionisation in human cells. The quantities and units used are the Gray and the Sievert.
Gray (Gy): The Gray is the unit of ‘absorbed dose’; the amount of energy deposited in the form of ionisation in matter. It is equal to one Joule of energy deposited per kg of matter. The Gray is a purely physical measure of radiation; it takes no account of biological effects that the radiation might produce in living matter.
Sievert (Sv): The Sievert is the unit of ‘effective dose’; a quantity that takes account of the fact that different types of radiation have different effects on different parts of the body. The effective dose (E) is obtained by multiplying the absorbed dose (DR,T in Gy) in tissue (T) from radiation of type R by two weighting factors: (i) the radiation weighting factor (wR) and (ii) the tissue weighting factor (wT), and summing over all the radiations and tissues involved. Mathematically, this is written as:
The radiation weighting factor allows for the different effects of different types of radiation. Alpha particles and neutrons are much more effective at producing biological damage than gamma or beta radiation. The radiation weighting factors for beta and gamma = 1; alpha = 20; and neutrons = 5 to 20, depending on neutron energy.
The tissue weighting factor allows for the different radiosensitivities as determined by empirical studies of the cancer risks to different organs from radiation. For example, the tissue weighting factor for gonads is 0.2; thyroid is 0.05; skin is 0.01. The sum of wT over all organs, T, is 1.
173

For whole-body gamma exposure, both weighting factors are one, so the effective dose (in Sv) equals the absorbed dose (in Gy) when the body receives the same absorbed dose in all tissues.
One Sievert is a large dose (a fatal acute whole body dose is approx 5 Sv). Doses discussed in this report are measured in millisieverts (mSv); that is, one thousandth of a Sv. A useful comparison can be made against the annual dose from natural and man-made sources, which is approximately 2 mSv.
Radiation exposure can occur in two different ways:
External exposure (i.e. the radiation comes from radiation sources outside the body). External doses can usually be assessed relatively easily by monitoring the (absorbed) dose rate in air outside the body, using a Geiger–Müller counter, film badge, or similar device.
Internal exposure arising from radioactive material inside the body usually after its ingestion or inhalation. In order to determine internal dose, it is necessary to have information on the radioactive substance(s) involved — the types of radiation they emit and the half-lives involved, and on the body’s metabolism of the radioactive material — how much is absorbed from the lung or gut, how it is distributed and deposited in body organs and how quickly it is excreted.
In general, following an initial intake, exposure will continue until the radioactive material is excreted or it decays. This may take many years. In calculating doses from intakes, the total dose that will eventuate over the remaining lifetime (taken to be 50 years) is assigned to the time of intake. This quantity is called the ‘committed dose’.
When ‘dose’ is used without qualification, as in ‘the dose received in this operation’, it is usually referring to effective dose (in Sv).
Unit used for measuring radioactivity
The quantity of radioactive material is called the ‘activity’. The unit of activity is the Becquerel (Bq): one Becquerel is defined as one radioactive disintegration per second. Note that there is no simple relationship between the activity (Bq) of a radioactive source and the resulting dose (Sv).
Historical units
Units used for measuring exposure to ionising radiation
Roentgen (R): This is a unit of ‘exposure’. Technically, it is the amount of ionisation (amount of electric charge) produced in matter by radiation. It was widely used because this is relatively easy to measure (at least in gases). The Roentgen is defined as an exposure producing 2.58 × 10⁻⁴ Coulomb per kilogram of air.
It is approximately equivalent to 8.7 mGy (0.87 Rad — see below).
Rad: A unit of absorbed dose or the energy deposited in a material.
174

One Rad equals 0.01 Gy (10 mGy).
Rem: (Rad Equivalent Man). This was the unit of biological effectiveness of the radiation. As with the Sievert, it allows for the differing biological effects of the various types of radiation and the differing radiosensitivies of different body organs. The rem was derived by multiplying the number of rads by what were called ‘quality factors’.
One Rem approximately equals 0.01 Sv (10 mSv).
Rep: (Roentgen Equivalent Physical). This unit was used for measuring β radiation, as opposed to X-ray and radiation. The intention was that 1 rep β ≡ 1 R γ. There is no direct equivalent in the SI system.
In the general practice of the time of the tests and minor trials, where the hazard was from gamma radiation, in most situations roentgen, rad and rem were taken to be equal to one another.
Unit used for measuring radioactivity
Curie (Ci): This was the unit of activity (quantity of radioactive material). Occasionally abbreviated as ‘C’ or ‘c’ in the early test reports. It was originally based on the activity of 1 g of radium.
One Ci equals 3.7 × 10¹⁰ Bq.
Other measures of radioactivity in use at the time
In the various reports written at the time of the tests and minor trials, measurements are often quoted in counts per second (cps) or counts per minute (cpm). Of themselves, they are little value, but if the efficiency of the detector is known and its method of use, then a reading in cps may be converted to an exposure dose rate. For example, for the widely used 1021 monitor, 100 cps is approximately equal to 1 mR/h.
Scientific numbers and their symbols
Very large and very small numbers are unwieldly to write in the usual decimal notation. Therefore, scientists recognise ways of printing or communicating them in a shorter format. Associated with these are abbreviations such as the commonly used ‘kilo’ for thousand.
Appendix 6 — Some brief notes on radiation quantities and units 175
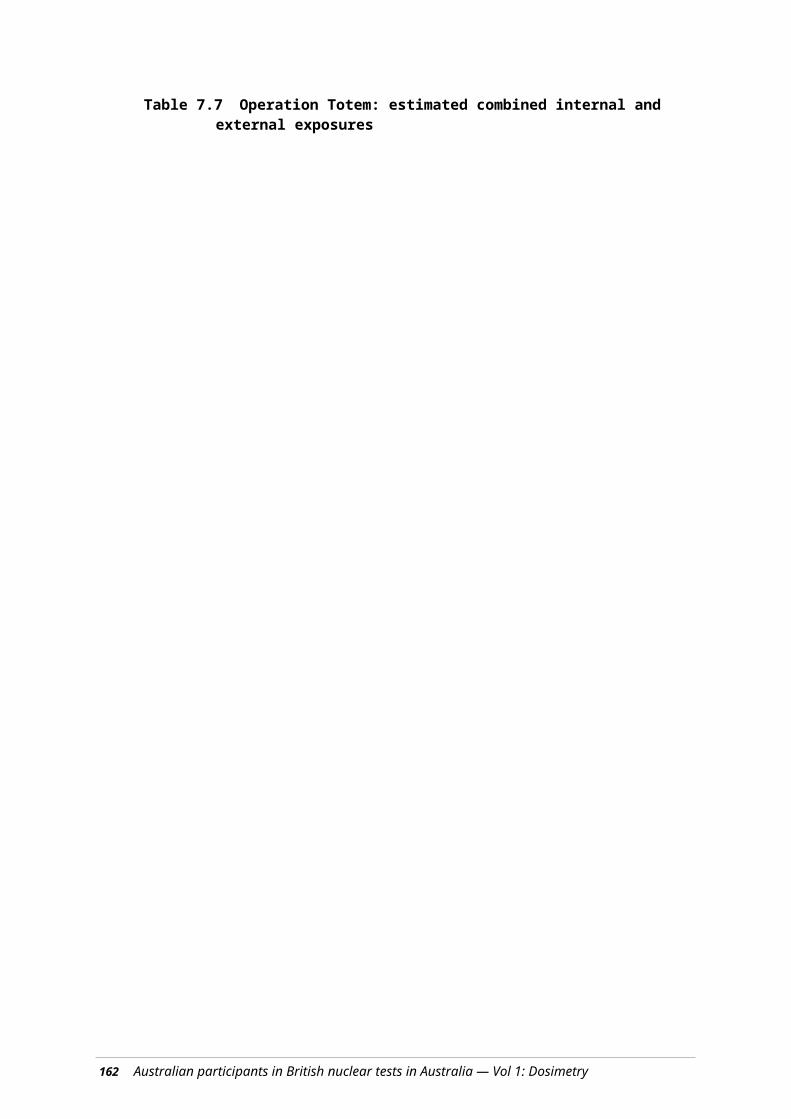
Table A2.1 Decimal numbers and their corresponding abbreviations
Decimal Scientific Commonly Prefix Symbol1 000 000 000 0001 000 000 0001 000 0001 000100100.10.010.0010.000 0010.000 000 0010.000 000 000 001
1012
109
106
103
102
101
10-1
10-2
10-3
10-6
10-9
10-12
trillionbillionmillion
thousandhundred
tententh
hundredththousandth
millionthbillionthtrillionth
tera-giga-
mega-kilo-
hecto-deca-deci-centi-milli-
micro-nano-pico-
TGMkh
dadcmµnp
176 Australian participants in British nuclear tests in Australia — Vol 1: Dosimetry
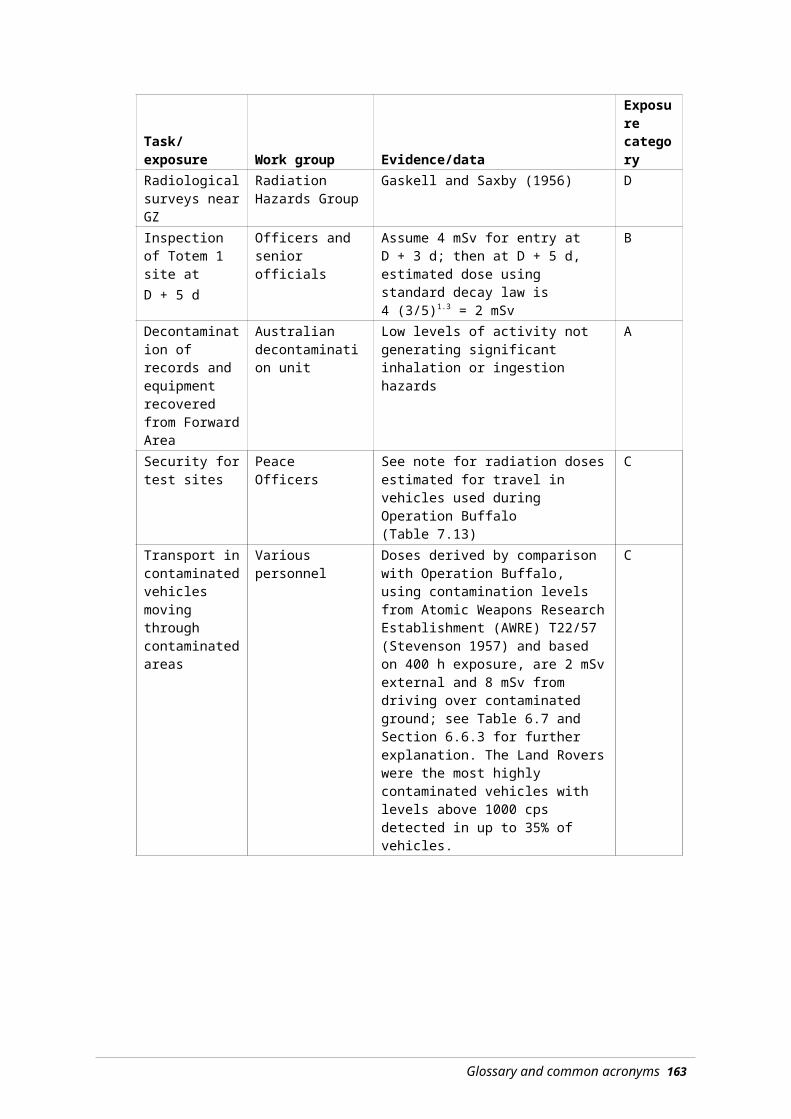
Appendix 7 Radiat ion safety instrumentat ion used during the Bri t ish
nuclear weapons tests
To enable effective radiological control in any situation, a variety of measurements may be necessary to determine any prevailing radiation and/or contamination levels. Radiation and contamination monitoring equipment have been developed that can fulfil several functions by measuring:
external radiation exposure of personnel who are using radiation sources or exposed to radiation fields
ambient radiation fields to enable an estimation of possible external radiation hazards and the length of time that may be spent in those fields before exceeding any set exposure limits
radioactive materials on surfaces such as soil, equipment, clothing and people, to determine if a potential internal or skin hazard may be present
radioactive contamination in air and water.
The types of instruments used to carry out these measurements are outlined below and some of the more common instruments used during the British nuclear weapons tests are listed in Tables A.1 and A.2.
Exposure of personnel
Measurement of the radiation exposure of personnel using radiation sources or exposed to radiation fields can be done in one of two ways: film badges or quartz fibre electroscopes.
Film badges
Wearing a film badge, as used during the test series, can produce a record of accumulated external radiation exposure over a set period of days or weeks. A disadvantage is that the accrued radiation dose is not known until the dosimeter has been processed.
During the tests, the dosimeter was usually worn on the lapel or, less frequently, at waist level.
Where appropriate, special badges were worn on wrists or on a cap to measure extremity doses.
Photographic film is affected by beta and gamma radiation in the same way that it is affected by light. After an irradiated film has been developed, the density (blackness) of the film indicates the amount of radiation it has received. The amount of radiation is determined by measuring the density of the particular film and then, by using a graph of densities of films that have been exposed to known amounts of radiation, the radiation exposure of the film in question is obtained.
177

This is then taken to indicate the radiation dose received by the wearer. Film holders can be designed to measure different radiations by adding filters to the holder. By using filters of varying thickness of different metals, it is possible to differentiate the radiations. The film holders in use at the time of the tests were only able to distinguish between beta and gamma radiations.
Initially, standard dental X-ray films were used; however, by the time of Operation Totem, commercial low and high range films were available.
The lower limit of detection for the low range film was 0.02 R (200 Sv).
The upper limit of the high range film was approximately 500 R (5 Sv).
Film badges, when worn and processed correctly, are considered to give the most accurate assessment of personal radiation exposures.
Quartz fibre electroscope
By carrying another type of instrument called a quartz fibre electroscope (QFE), an instantaneous indication of accumulated radiation exposure, particularly from gamma radiation, can be obtained. The QFE or pocket dosimeter is essentially a small hermetically sealed chamber about the size of a large fountain pen. The centre electrode supports a conducting fibre that acts as a cursor. Before use, the QFE is ‘charged up’ by setting the cursor at zero on a graduated scale. When radiation enters the chamber, the ionisation allows some of the charge on the central electrode to leak and the fibre moves across a scale that can be read directly using the inbuilt microscope. The reading indicates the amount of radiation that had passed though the chamber and, by analogy, the radiation dose received by the wearer.
The QFE has two significant disadvantages: the reading is easily altered by knocks, and it does not provide a permanent record. QFEs have been mostly superseded by solid-state dosimeters.
QFEs were made in several ranges: 0.0 to 0.1 R (0 to 1 mSv) up to 0 to 50 R (0 to 500 mSv). For personnel monitoring at the tests, the 0.0 to 0.5 R and 0 to 5 R ranges were the most commonly used.
Ambient radiation
Measurement of ambient radiation levels enables estimations of possible external radiation hazards. The length of time that may be spent in active fields before exceeding any set exposure limits can then be calculated.
Most radiation detectors used at time of the tests were based on the same basic design to measure the ionisation produced in a specifically designed chamber.
This most commonly takes the form of a metal or glass chamber containing a pair of electrodes (cathode and anode) connected to a power supply, mains or battery. The chamber is filled with an appropriate mixture of gases, and ionising radiation entering the chamber produces negative and positive ions that are collected on the electrodes. The
178

resultant current or pulse, if fed thorough a meter, gives an indication of the strength of the radiation field.
The voltage of the electric field within the detection chamber determines the type of response and allows for different types of measurement.
Radiation monitors (survey meters as they were usually called) could be set to measure radiation fields in ranges from thousandths of to a hundred roentgens per hour. The design of different instruments could allow for separate or combined estimates of beta and gamma radiations. Care had to be taken when using survey meters to ensure:
the ‘window’ of the monitor faced the radiation field
the beta/gamma window was open or closed as necessary
the correct scale was being read, if the instruments had different scales.
Surface contamination
Measurement of radioactive materials on surfaces (such as soil, equipment, clothing and people) can determine if a potential internal or skin hazard is present and if decontamination is required.
A standard radiation survey instrument is usually too insensitive to measure low levels of surface contamination, and a range of instruments has been developed for this specific purpose.
Several of the most common instruments used for contamination monitoring use a Geiger–Müller chamber as the detector. Usually in the form of a tube with a central anode, it has the advantage of providing an output signal requiring relatively simple electronics. It is widely referred to as a Geiger counter or simply a G–M monitor. Like survey meters, the G–M tube can be fitted with a shield to enable discrimination between beta and gamma radiations.
Because of the poor penetrability of alpha particles, it is difficult to make a G–M tube with sufficiently thin walls to allow them to be detected.
The most common method for monitoring for alpha contamination is a scintillation detector. If a radioactive particles or ionising rays enter a phosphorescent material, they can cause flashes of light which in turn can be detected by a photomultiplier tube, thus generating a signal that can be measured on a suitable scaler (i.e. counter). Alpha particle monitoring instruments had been developed for field use by the time of Operation Buffalo. They suffered from one serious drawback (and still do). The foil window covering the scintillation screen has to be very thin to allow the transmission of the alpha particles. If the foil is damaged in any way, even the tiniest pinprick, the scintillation screen responds to ambient light and no alpha measurements are possible.
Contamination monitor scales usually read in counts per second (cps) or counts per minute (cpm). The instruments could be calibrated to give an indication of surface contamination in µCi/cm2.
When using contamination monitors, care has to be taken not to contaminate the detector, thus leading to false readings. As with survey meters, whether the beta window is open or
Appendix 7 — Radiation safety instrumentation 179

shut affects the readings, and ensuring that the correct scale is used is essential for accurate measurement.
The speed with which a contaminated surface is scanned, the orientation of the detector and its closeness to area being monitored can all affect the results. This is particularly so with alpha monitoring where extreme care must be taken to monitor close to the contaminating surface without puncturing the protective foil.
In practice, where survey meters are not readily available, an estimate of radiation doses rates can be obtained by using a contamination monitor.
For the three most common contamination monitors used during the tests — 1021, 1295 and 1320 using a standard G–M tube as detector, with the beta window closed — a count rate of 100 cps was taken to be approximately equivalent to 1 mR/h (10 Sv/h).
Where appropriate, this relationship has been adopted throughout this report.
Radioactivity in air or water
Measurement of radioactive contamination in air and water can be done using the following methods.
Filtration
Passing a known quantity of air though a filter paper and then measuring the amount of radioactivity collected can provide an estimate of atmospheric contamination. The most common instrument used was based on a household vacuum cleaner with a filter paper holder fitted to the intake. On completion of sampling, the filter paper had to be removed and placed in a sensitive contamination detector. This meant that the level of airborne radioactivity was only known after the event of interest.
A more specialised air sampler is the ‘Cascade Impactor’, which is designed to measure the size distribution of particles in the dust cloud being sampled. The aim is to determine what fraction of the radioactivity in a sample was of a respirable size and, therefore, a potential hazard. The impactors used were of limited value in the Australian desert. The jelly used to coat the glass impactor slides often melted, with subsequent loss of the sample.
Passive sampling on adhesive paper
Later in the test series, ‘sticky paper’ passive samplers were placed at strategic points to detect long-range fallout. These had been developed in the USA for the Nevada nuclear tests. They consisted of a box containing a piece of sticky paper. Immediately before a weapon was fired, the box lids were opened remotely and the paper collected any radioactive material that fell upon it. The samples were collected by, amongst others, members of the Australian Radiation Detection Unit. They were then brought back to the laboratory for counting. ‘Sticky paper’ samplers were the basis of the Australia-wide fallout-monitoring network established by the AWTSC at Australian population centres during the later test series.
180 Australian participants in British nuclear tests in Australia — Vol 1: Dosimetry
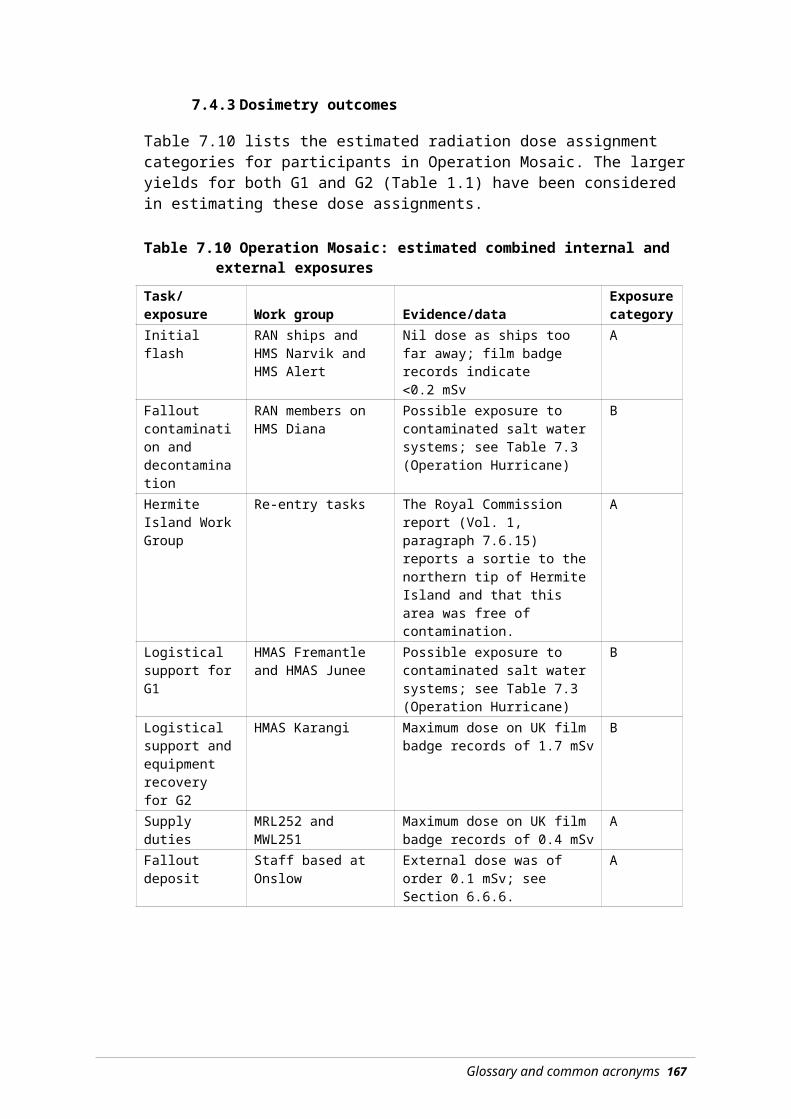
Processing water sample
Radioactive contamination in water is usually measured by collecting a sample and placing it, often after evaporation, in a counter capable of detecting the expected contaminants.
In special cases, such as measuring the contamination of seawater after Operations Hurricane and Mosaic, water can be passed directly over an installed radiation detector, thus providing an instantaneous measurement.
Other physical methods
Instruments and measurement techniques developed during the trials included:
high level dosimeters to record the initial gamma flash
experimental dose rate and contamination monitors, both portable and fixed
methods of analysing the radionuclides present in a given sample
a range of portable and permanent airborne dust samplers.
Table A3.1 tabulates the most common survey (dose rate) meters in use during the nuclear test program.
Table A3.2 lists the more common contamination instruments used, including air samplers.
Table A3.1 Some survey (dose rate) monitoring instruments used during the British nuclear tests in Australia
Type Radiation Dose Range RemarksAvo Portable Survey Meter
Beta, gamma 0 to 500 R/h Not considered as reliable as other instruments
Radiac No. 2 Portable Survey Meter
Beta, gamma Three scales ranging from 0 to 300 R/h
Modified at Buffalo to read lower by a factor of 10
1043 Portable Survey Meter
Gamma 0 to16 mR/h Used to measure survey dose rates
1092 Portable Survey Meter
Beta, gamma Mk 1: 0 to10 mR/h; Mk 2: 0 to 50 mR/h
1312 Portable Survey Meter
Gamma Two scales ranging from 0 to 100 R/h
Based on earlier type 1155 instrument
1313 Portable Survey Meter
Gamma Three scales ranging from 0 to 5 R/h
Based on earlier type 1193. Widely used at a number of tests.
1314 Portable Survey Meter
Beta Two scales ranging from 0 to 50 rep/h
Based on the type 1043
1390 Portable Survey meter
Gamma 10 scales ranging from 10 mR/h to 30 R/h
Ground survey of dose rate from deposited fallout
1391 Portable Survey Meter
Beta, gamma Four scales ranging from 0 to 100 R/h (gamma), 0-10 rep/h (beta)
Used to monitor beta dose rate from deposited fallout
1368 Portable Survey Meter
Gamma Five log scales in ranges 1 mrem/h to 600 mrem/h
General dose rate monitoring
Note: Adapted from the Royal Commission Report.
Appendix 7 — Radiation safety instrumentation 181

Table A3.2 Some contamination monitors used during the British nuclear tests in Australia
Type Radiation Count range Remarks1021 Contamination monitor fitted with G–M and scintillation probes
Alpha, beta, gamma
Three scales: 0–2000 cps; also fitted with a 1/10 function
The contamination monitoring ‘work horse’, widely used for personnel and equipment monitoring and decontamination work. Used in Health Physics control points
1295 Portable contamination monitor fitted with G–M and scintillation probes
Alpha, beta, gamma
Portable version of the type 1021. Set to sound an alarm at a preset contamination level.
Scintillation probe prone to light sensitivity when used in the field
1027 Installed hand, foot and clothing monitor G–M and scintillation probes
Alpha, beta, gamma
Dependant on the individual probe used
Personnel monitoring; the main instrument used in Health Physics control points
1319 Installed hand, foot and clothing monitor G–M and scintillation probes
Alpha, beta, gamma
Development of 1027, set to sound an alarm at a preset contamination level.
Personnel monitoring
1320 Battery operated portable contamination monitor G–M and scintillation probes
Alpha, beta, gamma
Two scales 1–1000 cps; also fitted with a 1/10 function
The portable ‘work horse’ widely used monitor for area contamination surveys, cloud tracking and general purpose monitoring. Scintillation probe prone to light sensitivity when used in the field.
1195 Modified Electrolux vacuum cleaner, with a filter paper holder placed on the air intake
Filter paper removed and placed in a shielded alpha, beta, gamma counter to measure deposited activity. Not very accurate for alpha measurements due to self-absorption in the paper.
Cascade Impactor: specialised air sampler designed to segregate airborne particulates. First stages used greased glass slides, final stage a filter paper.
Initially three stages, later five; size segregation <1 μa: 1 to 3 µ: 3 to 5 µ: 5 to 10 µ: >10 µ
Slides and filter paper removed and placed in a shielded alpha, beta, gamma counter to measure deposited activity. Limited value as (anecdotally) the petroleum jelly used softened in the heat, leading to less effective adhesion.
a µ (mu) is the symbol for micron; a one micron particle has a diameter of 0.001 mm.Note: Adapted from the Royal Commission Report.
182 Australian participants in British nuclear tests in Australia — Vol 1: Dosimetry

Addendum Calculat ing the act iv i t ies and dose-rates for fa l lout mixtures
Introduction
This addendum presents the technical material on evaluating the activities and dose rates associated with radioactive deposits from nuclear weapons tests.
Fallout deposits consist of mixtures of radionuclides that vary in importance with time after detonation of the fission-based weapon. The analysis of the composition of the fallout at any time after fission begins with an idealisation. It is assumed that all radioactive elements produced in the explosion are uniformly distributed through the deposited fallout.
The next step in the analysis is to focus on a group of radionuclides that are linked through the decay of one radionuclide to another in the group. Generally, the parent radionuclides transform to a daughter radionuclide by emission of beta or gamma radiation so that the radionuclides in the decay series have a constant mass. There are some exceptions where a neutron is emitted during the decay, reducing the mass number by one. The daughter radionuclide may exist in several, usually two, forms known as isomers: a ground state and an excited state. A fraction of the decays of a parent radionuclide may be to the isomer, with the remainder of the decays occurring to the ground state. Further, the isomer could decay to the ground state or to the next daughter radionuclide in the sequence. The sequence of decays through all elements in the decay chain can be complicated, as can be seen from the example in Figure A.1.
The radionuclides formed by fission of heavy elements have been widely studied and much information is available on their half-lives, their modes of decay, the existence and life-times of isomeric states, the fraction of decays that pass through the isomeric states and the radiations emitted. Additionally, the number of atoms of each radionuclide generated by the fission of a known number of atoms of various fissile materials, the fission yield, has been measured; only the fission yields for 239Pu were used in this study. This basic data is all that is required to calculate the composition of fallout particles at a given time after fission.
183
Figure A.1 Decay scheme for radionuclides with mass number 95
Note: Half-lives are shown as seconds (s), minutes (m), hours (h) or days (d). The numbers of atoms of the radionuclides for 10 000 fissions of 239Pu are shown in brackets ( ).
Such data were used as input to a computer code, known as ADORED, written during 1972–1973 as part of a suite of diagnostic tools for analysing fallout deposit from nuclear weapons tests. The original purpose of ADORED was to compute activity, dose-rate and dose associated with the fallout deposit. The code has additional facilities for computing the gamma spectra from a fallout deposit and for investigating the effects of fractionation, but these are not required for the present study. The core of the program is a fast algorithm for solving all the equations describing the decay of the radionuclides at any time after fission. A summary of the mathematical theory for this algorithm and documentation of the data sources are given below. In addition, summary tables of the principal radionuclides contributing to the activities and dose-rates at different times after fission are provided.
Theory
We consider a series of n radionuclides Xi with half lives Ti and decay constants λi = ln(2)/Ti. It is assumed that the fission yields for radionuclide Xi are Ni(0), 1 ≤ i ≤ n and that a fraction fji, known as the branching ratio, of disintegration of radionuclide Xi are to radionuclide Xj. To find the number of atoms Ni(t) of radionuclide Xi at time t, we need to solve a generalised decay equation expressed in matrix form as:
(1)
where
184
95Kr 95Rb 95Sr 95Y 95Zr
95mNb
95Nb 95Mo
0.02
<1 s(18.8)
<1 s(125.9)
26 s(200.0)
10.9 m(82.7)
65 d(3.7)
69 m(0.0)
90 h(0.0)
Stable(0.0)
Mass number: 95
Decay scheme and 239Pu fission yields
0.98

with λii = λi and λji = fji λi. Clearly, . The solutions for Ni(t), 1 ≤ i ≤ n, are
obtained using eigenvalue-eigenvector methods as follows.
First, note that the eigenvalues, νi,, which are the solutions of det(Λ-νI) = 0, are νi = -λii= -λi, 1 ≤ i ≤ n. The matrix Λ can be written as the product of a matrix U, identified as the matrix of eigenvectors, the diagonal matrix D of eigenvalues, and a matrix V that is the inverse of U. Thus, Λ = U D V and U V = V U = I and
(2)
Now change variables so that . Pre-multiply both sides of (2) by matrix V to obtain:
(3)
The i’th element of the column vector is obtained by solving
(4)
is Ri(t) = Ri(0) exp(-λi t), where
(5)
Hence,
(6)
The solution is completed by using to give
(7)
To develop an algorithm for computer usage, efficient methods for calculating the matrix elements Uij and Vjk are required.
Appendix 7 — Radiation safety instrumentation 185
The columns of matrix U are the eigenvectors which satisfy , 1 ≤ ≤ n, that is are solutions of . The elements of the eigenvector corresponding to the eigenvalue –λi are obtained iteratively from the first element ui1 to the n’th element uin as:
(8)
Similarly, the elements of matrix must satisfy U V = V U = I. It is easy to show that matrix V is a lower triangular matrix and that V satisfies V Λ = D V. The elements Vmj are found from:
(9)
The elements in row m are found from (9) beginning with Vmm = 1 and then evaluating for j = m-1, j = m-2, … , j = 1.
Substitution of U and V from (8) and (9) into (7) completes the solution for N(t).
Data used
The input data for the calculation of the activities, λiNi(t) are as follows:
The half lives, Ti, decay constants λi = ln(2)/Ti and the branching ratios, fij, are from Meek and Rider (1972).
The yields for fission products, Ni(0), for several fissile materials are those given by Crouch (1968); the present calculations are based on 239Pu as the fissile material used throughout the British test series in Australia. Other yields included the following.
The yields for induced radionuclides given by Crocker and Turner (1965); these radionuclides derive from neutron irradiation of weapons material and other material associated with the explosion.
The yields for 239Np induced in the 238U tamper material as estimated from measurements of airborne debris from Hurricane (Gale 1954b), Totem (Gale 1954a) and Buffalo;35 for the present calculations, the adopted values are for 239U 9000 atoms per 10 000 fissions and for 239Np 180 atoms per 10 000 fissions.
the yield for the unburnt fissile material 239Pu — if a fraction F of N 239Pu atoms fission, then the number of unburnt atoms is (1 – F) N/F. It is assumed that F is 0.12 so that for 10 000 fissions N ≈ 83 000 and the yield of unburnt 239Pu is 73 000.
The computer program provides a summary of the activities of each radionuclide in a mixture with a unit total activity. The data described above have been compiled for
35 Marston HR (1957) The accumulation of radioactive iodine in the thyroids of grazing animals subsequent to atomic weapons tests. Unpublished manuscript.
186 Australian participants in British nuclear tests in Australia — Vol 1: Dosimetry

approximately 500 radionuclides; most of these radionuclides are short-lived and of no significance at the times considered in this report. About 130 different radionuclides are of significance at times ranging from 0.5 hours to 10 years after fission. The activities computed for different times after fission were transferred to an Excel™ spreadsheet to provide the basis of the calculations for the dose-rate for a fallout deposit on the ground surface, for the dose from inhalation of activity in air and for the dose from ingestion of radioactivity. This approach was adopted to allow use of more modern data for the conversion factors than were available in the early 1970s. The calculations drew on recent compilations of conversion factors.
For external dose rate from deposit on the ground surface, the conversion factors as μSv/h from a surface contamination of 1 MBq/m2 were derived from Table III.1 of Eckerman and Ryman (1993). In practice, the dose-rates are overestimated as no allowance is made for the roughness of the ground nor the leaching of the contamination into the soil.
For the committed dose from inhalation of 1 Bq of activity, the conversion factors given by the International Commission of Radiological Protection (ICRP 1995, 1996, 1998) for particles with activity median aerodynamic diameters (AMAD) of 1 μm, 5 μm and 10 μm were used. For the present work, an AMAD of 5 μm was adopted as being the most representative of particle sizes in close-in fallout.
For the committed dose from ingestion of 1 Bq of activity, the conversion factors given by the International Commission of Radiological Protection (ICRP 1995, 1996, 1998) were adopted.
Results
Tables A.1 and A.2 summarise the most important radionuclides and their activities per unit of total activity for times ranging from 1 hour to 10 days and from 20 days to 2 years, respectively.
Tables A.3 and A.4 summarise the most important radionuclides and their external dose rates for 1 MBq/m2 of deposit on the ground surface for times ranging from 1 hour to 10 days and from 20 days to 2 years, respectively.
Tables A.5 and A.6 summarise the most important radionuclides contributing to the inhalation dose for times ranging from 1 hour to 10 days and from 20 days to 2 years, respectively. The calculations for these tables assume that the concentration of the activity in air is 1 kBq/m3 and is inhaled at the rate of 3 m3 per hour, corresponding to the breathing rate for heavy work, for 10 h.
These tables illustrate the data available in the fuller data set, as the less significant radionuclides have been removed for publication. The derivation of the factors to convert activity in ground deposit to external dose rate, or of activity in air to a committed dose from inhalation of radioactivity, were from complete tables similar to Table A.1 to Table A.6. The abbreviated tables can be used to confirm the values reported in Table 6.3. For example, (i) the activity at time t from 1 MBq/m2 at H + 1 hour is calculated by dividing the activity as Bq per 10 000 fissions by 1.8556, (ii) the dose-rate as Sv/h at time t is calculated by multiplying the dose-rate at time t for 1 MBq/m2 at time t by the activity as MBq/m2 at time t from (i).
Appendix 7 — Radiation safety instrumentation 187
Table A.1 Activities of the more important radionuclides at 1 hour and at times of 0.5 days to 10 days post-fission
1 h 12 h 1 d 2 d 5 d 10 dBq per 10 000 fissions
1.85560 0.09702 0.05731 0.03254 0.01242 0.00407Radionuclide activity as Bq per Bq total92Y 0.002 0.034 0.008 0.00093Y 0.003 0.029 0.022 0.007 0.00097Zr 0.003 0.038 0.039 0.026 0.004 0.00097mNb 0.003 0.036 0.038 0.025 0.003 0.00097Nb 0.001 0.041 0.042 0.028 0.004 0.00099Mo 0.001 0.016 0.024 0.033 0.041 0.03699mTc 0.000 0.011 0.021 0.031 0.039 0.034101Tc 0.048103Ru <0.001 0.001 0.002 0.004 0.009 0.027103mRh <0.001 0.001 0.002 0.004 0.009 0.026105Ru 0.011 0.037 0.010 <0.001105Rh <0.001 0.021 0.034 0.039 0.026 0.008131Te 0.029 0.001 0.001 0.001 0.000 0.000131I <0.001 0.004 0.007 0.011 0.024 0.049132Te 0.001 0.011 0.017 0.024 0.034 0.035132I 0.001 0.012 0.018 0.025 0.035 0.036133I 0.002 0.037 0.043 0.034 0.008 <0.001133Xe <0.001 0.003 0.007 0.018 0.042 0.070134I 0.029 <0.001135I 0.007 0.045 0.022 0.003 <0.001135Xe 0.002 0.059 0.065 0.027 <0.001138Cs 0.040 <0.001139Ba 0.028 0.002 <0.001140Ba <0.001 0.003 0.005 0.009 0.019 0.045140La <0.001 0.001 0.002 0.006 0.019 0.050141La 0.013 0.040 0.008 <0.001141Ce <0.001 0.001 0.003 0.004 0.011 0.030143Ce 0.001 0.017 0.022 0.024 0.014 0.003143Pr <0.001 <0.001 0.001 0.004 0.013 0.035145Pr 0.004 0.023 0.010 0.001 <0.001147Nd <0.001 0.001 0.002 0.004 0.009 0.020237U <0.001 0.003 0.005 0.008 0.015 0.027239U 0.405239Np 0.014 0.281 0.410 0.538 0.581 0.406239Pu <1.0 10-5 <1.0 10-5 <1.0 10-5 1.0 10-5 2.0 10-5
Sub-total 0.650 0.810 0.889 0.938 0.959 0.937Total 1.000 1.000 1.000 1.000 1.000 1.000
188 Australian participants in British nuclear tests in Australia — Vol 1: Dosimetry
Table A.2 Activities of the more important radionuclides at times of 20 days to 2 years post-fission
20 d 50 d 100 d 200 d 1 y 2 yBq per 10 000 fissions
1.163 10-3 3.772 10-4 1.656 10-4 6.203 10-5 2.538 10-5 1.089 10-5
Radionuclide activity as Bq per Bq total89Sr 0.018 0.037 0.043 0.030 0.008 <0.00190Sr <0.001 <0.001 0.001 0.003 0.007 0.01590Y <0.001 <0.001 0.001 0.003 0.007 0.01591Y 0.023 0.049 0.062 0.051 0.018 0.00195Zr 0.037 0.083 0.111 0.102 0.043 0.00295mNb 0.001 0.002 0.002 0.002 0.001 <0.00195Nb 0.013 0.066 0.144 0.185 0.089 0.00499Mo 0.011 <0.00199mTc 0.010 <0.001103Ru 0.078 0.142 0.135 0.063 0.009 <0.001103mRh 0.077 0.141 0.134 0.062 0.008 <0.001106Ru 0.008 0.024 0.051 0.112 0.201 0.235106Rh 0.008 0.024 0.051 0.112 0.201 0.235129mTe 0.008 0.013 0.010 0.004 <0.001131I 0.072 0.017 0.001132Te 0.015 <0.001132I 0.015 <0.001133Xe 0.066 0.004 <0.001137Cs <0.001 <0.001 0.003 0.008 0.019 0.044137mBa <0.001 <0.001 0.003 0.008 0.018 0.042140Ba 0.091 0.055 0.008 <0.001140La 0.105 0.064 0.010 <0.001141Ce 0.084 0.138 0.110 0.036 0.003 <0.001143Pr 0.074 0.049 0.009 0.000144Ce 0.007 0.021 0.043 0.090 0.146 0.140144Pr 0.007 0.021 0.043 0.090 0.146 0.140147Nd 0.037 0.017 0.002 <0.001147Pm 0.001 0.004 0.010 0.024 0.053 0.094155Eu <0.001 0.001 0.002 0.004 0.008 0.013237U 0.034 0.005 <0.001239Np 0.074 <0.001239Pu 6.00 10-5 2.00 10-4 4.50 10-4 1.21 10-3 2.95 10-3 6.88 10-3
Sub-total 0.975 0.981 0.987 0.988 0.988 0.986Total 1.000 1.000 1.000 1.000 1.000 1.000
Appendix 7 — Radiation safety instrumentation 189

Table A.3 Dose rates for the more important radionuclides as Sv per hour for a total deposit of 1 MBq/m2 at 1 hour and at times 1 hour and 0.5 days to 10 days post-fission
μSv per hour for a deposit of 1 MBq/m2
1 h 12 h 1 d 2 d 5 d 10 d88Kr 0.024 0.031 0.00389Rb 0.04091Sr 0.006 0.052 0.037 0.012 0.00092Sr 0.038 0.044 0.00392Y 0.002 0.031 0.007 0.00094Y 0.06295ZR <0.001 0.001 0.002 0.004 0.011 0.03197mNB 0.008 0.093 0.096 0.064 0.009 0.00097NB 0.003 0.094 0.098 0.065 0.009 0.000101Mo 0.081101Tc 0.057103Ru <0.001 0.002 0.004 0.006 0.016 0.044105Ru 0.030 0.103 0.027 0.001128mSb 0.052 <0.001128Sb 0.004 0.033 0.022 0.006 0.000129Sb 0.027 0.089 0.022 0.001131Sb 0.107131mTe 0.001 0.018 0.023 0.023 0.012 0.002131Te 0.043 0.001 0.001 0.001 0.001 0.000131I <0.001 0.005 0.009 0.015 0.033 0.066132I 0.009 0.095 0.140 0.199 0.275 0.289133mTe 0.138 <0.001133I 0.004 0.080 0.092 0.073 0.018 0.001134Te 0.066 <0.001134I 0.267 0.003135I 0.039 0.238 0.116 0.017135Xe 0.002 0.052 0.056 0.024 0.000138Xe 0.036138Cs 0.316140Ba <0.001 0.002 0.003 0.006 0.012 0.029140La <0.001 0.007 0.018 0.044 0.147 0.390141Ba 0.061 <0.001 <0.001142La 0.167 0.023 <0.001239U 0.075 <0.001 <0.001239Np 0.008 0.165 0.241 0.315 0.341 0.238
Sub-total 1.775 1.262 1.020 0.877 0.883 1.091Total 2.121 1.448 1.188 1.024 1.013 1.236
190 Australian participants in British nuclear tests in Australia — Vol 1: Dosimetry

Table A.4 Dose rates for the more important radionuclides as Sv per hour for a total deposit of 1 MBq/m2 at times of 20 days to 2 years post-fission
μSv per hour for a total deposit of 1 MBq/m2
20 d 50 d 100 d 200 d 1 y 2 y60Co 0.0000 0.0002 0.0003 0.0008 0.0017 0.003589Sr 0.0001 0.0003 0.0003 0.0002 0.0001 0.000091Y 0.0005 0.0010 0.0013 0.0011 0.0004 0.000095Zr 0.0962 0.2155 0.2878 0.2646 0.1113 0.005395mNb 0.0002 0.0004 0.0005 0.0005 0.0002 0.000095Nb 0.0358 0.1770 0.3867 0.4984 0.2410 0.011999Mo 0.0056 0.000099mTc 0.0044 0.0000103Ru 0.1299 0.2369 0.2248 0.1043 0.0142 0.0001103mRh 0.0003 0.0006 0.0006 0.0003 0.0000 0.0000106Rh 0.0064 0.0187 0.0387 0.0856 0.1533 0.1793111Ag 0.0005 0.0001 0.0000125Sb 0.0001 0.0004 0.0009 0.0022 0.0049 0.0088127Sb 0.0040 0.0000129mTe 0.0010 0.0017 0.0014 0.0005 0.0000129Te 0.0011 0.0018 0.0015 0.0005 0.0000131I 0.0978 0.0228 0.0007132Te 0.0120 0.0001132I 0.1197 0.0006133Xe 0.0110 0.0007 0.0000136Cs 0.0207 0.0129 0.0020137mBa 0.0009 0.0026 0.0060 0.0159 0.0385 0.0876140Ba 0.0590 0.0358 0.0054 0.0001140La 0.8139 0.4948 0.0751 0.0009141Ce 0.0224 0.0367 0.0292 0.0096 0.0007144Ce 0.0005 0.0016 0.0031 0.0065 0.0107 0.0102144Pr 0.0010 0.0029 0.0058 0.0122 0.0199 0.0190147Nd 0.0183 0.0087 0.0009 0.0000155Eu 0.0001 0.0002 0.0004 0.0008 0.0017 0.0027156Eu 0.0146 0.0112 0.0025 0.0001237U 0.0163 0.0023 0.0000239Np 0.0436 0.0000
Sub-total 1.5378 1.2884 1.0761 1.0050 0.5987 0.3284Total 1.5384 1.2887 1.0763 1.0053 0.5991 0.3290
Appendix 7 — Radiation safety instrumentation 191

Table A.5 Main radionuclides contributing to the inhalation dose per 10-hour working day at times 1 hour and 0.5 days and 20 days post-fission
Inhalation dose as μSv from inhalation of 1 kBq/m3 of activity for 10 ha
1 h 12 h 1 d 2 d 5 d 10 d89Sr 0.00 0.05 0.08 0.13 0.34 0.9791Sr 0.04 0.36 0.26 0.08 0.0091Y 0.00 0.03 0.09 0.18 0.46 1.3492Y 0.01 0.28 0.07 0.0093Y 0.06 0.52 0.39 0.13 0.0095Zr 0.00 0.07 0.12 0.20 0.51 1.4897Zr 0.13 1.58 1.64 1.09 0.15 0.0099Mo 0.03 0.53 0.79 1.08 1.35 1.19103Ru 0.00 0.09 0.15 0.25 0.63 1.75105Ru 0.08 0.28 0.07 0.00105Rh 0.00 0.28 0.45 0.52 0.34 0.10106Ru 0.01 0.11 0.19 0.33 0.85 2.57109Pd 0.02 0.24 0.22 0.11 0.01 0.00129mTe 0.00 0.02 0.04 0.06 0.16 0.43131mTe 0.01 0.17 0.22 0.23 0.11 0.02131I 0.04 1.31 2.20 3.73 7.98 16.08132Te 0.06 1.01 1.53 2.18 3.02 3.17132I 0.01 0.07 0.11 0.15 0.21 0.22133I 0.13 2.36 2.69 2.14 0.52 0.03135I 0.10 0.62 0.30 0.04 0.00140Ba 0.01 0.15 0.25 0.41 0.92 2.15140La 0.00 0.04 0.10 0.26 0.85 2.26141Ce 0.00 0.12 0.23 0.41 1.00 2.76143Ce 0.03 0.51 0.67 0.71 0.41 0.10143Pr 0.00 0.03 0.09 0.26 0.88 2.29144Ce 0.00 0.08 0.14 0.24 0.63 1.89147Nd 0.01 0.09 0.15 0.25 0.55 1.23149Pm 0.00 0.11 0.17 0.21 0.22 0.14237U 0.01 0.15 0.25 0.39 0.76 1.39239U 0.43239Np 0.46 9.26 13.53 17.74 19.18 13.39239Pu 9.60 19.20
Sub-total 1.69 20.54 27.18 33.55 51.63 76.14Total 2.75 21.78 27.86 34.05 52.11 77.00a The breathing rate for heavy work is assumed to be 3 m3 of air per hour.
192 Australian participants in British nuclear tests in Australia — Vol 1: Dosimetry

Table A.6 Main radionuclides contributing to the inhalation dose per 10-hour working day at times 20 days and 2 years post-fission
Inhalation dose as μSv from inhalation of 1 kBq/m3 of activity for 10 ha
20 d 50 d 100 d 200 d 1 y 2 y60Co <0.01 0.01 0.02 0.05 0.10 0.2189Sr 2.98 6.15 7.19 5.06 1.37 0.0390Sr 0.35 1.04 2.36 6.24 15.08 34.3090Y 0.01 0.02 0.05 0.14 0.33 0.7691Y 4.16 9.01 11.37 9.34 3.27 0.1095Zr 4.66 10.43 13.93 12.81 5.39 0.2695mNb 0.02 0.04 0.06 0.06 0.02 0.0095Nb 0.52 2.56 5.60 7.22 3.49 0.1799Mo 0.35 <0.01103Ru 5.14 9.38 8.90 4.13 0.56 0.00106Ru 8.83 25.71 53.29 117.81 210.86 246.61111Ag 0.23 0.04 0.00123Sn 0.03 0.09 0.15 0.23 0.23 0.07125Sb 0.01 0.03 0.06 0.15 0.32 0.57127mTe 0.07 0.17 0.28 0.40 0.34 0.08127Te 0.01 <0.01 0.01 0.01 0.01 <0.01129mTe 1.23 2.07 1.70 0.59 0.05131I 23.84 5.55 0.17132Te 1.31 0.01137Cs 0.09 0.27 0.61 1.61 3.90 8.88140Ba 4.37 2.65 0.40 0.00140La 4.71 2.86 0.43 0.00141Ce 7.82 12.85 10.24 3.35 0.26 <0.01143Pr 4.86 3.25 0.58 0.01144Ce 6.45 18.47 37.22 77.87 127.25 121.66147Nd 2.30 1.09 0.11 0.00147Pm 0.11 0.45 1.02 2.55 5.53 9.88155Eu 0.04 0.11 0.23 0.56 1.15 1.82156Eu 0.30 0.23 0.05 0.00237U 1.74 0.25 <0.01239Np 2.45 <0.01239Pu 57.60 192.00 432.00 1161.60 2832.00 6604.80
Sub-total 146.58 306.79 588.04 1411.78 3211.50 7030.21Total 146.96 306.94 588.13 1411.92 3211.76 7030.61a The breathing rate for heavy work is assumed to be 3 m3 of air per hour.
References
Crocker G R and Turner T (1965). Calculated activities, exposure rates and gamma spectra for unfractionated fission products, United States Radiological Laboratory Report USNRDL-TR-1009, United States Naval Radiological Defense Laboratory, San Fransisco, California.
Crouch EAC (1969). Calculated independent yields in the thermal fission of 233U, 235U, 239Pu, 241Pu and in the fission of 232Th, 238U and 240Pu. Atomic Energy Research Establishment Report AERE-6056, Atomic Energy Research Establishment, Harwell, UK.
Appendix 7 — Radiation safety instrumentation 193

Eckerman KF and Ryman JC (1993). External exposure to radionuclides in air, water and soil, Federal Guidance Report 12, United States Environmental Protection Agency, Washington.
Gale HJ (1954a). Operation Totem: Radioactive sampling and analysis report, AWRE Report T6/54, Atomic Weapons Research Establishment, Aldermaston.
Gale HJ (1954b). Operation Hurricane Group Reports (part 50): The collection of radioactive cloud samples by aircraft sweeps, AWRE Report T88/54, Atomic Weapons Research Establishment, Aldermaston.
ICRP (International Commission on Radiological Protection) (1995). Age-dependent doses to members of the public from intake of radionuclides: Part 4. Inhalation dose coefficients. ICRP Publication 71, Annals of the ICRP 25(3–4), Pergamon, Oxford.
ICRP (International Commission on Radiological Protection) (1996). Age-dependent Doses to Members of the Public from Intake of radionuclides: Part 5 Compilation of Ingestion and Inhalation Dose Coefficients. ICRP Publication 72, Annals of the ICRP, 26(1), Elsevier Science, Oxford.
ICRP (International Commission on Radiological Protection) (1998). The ICRP Database of Dose Coefficients: Workers and Members of the Public, CD-ROM software version 1.0, October 1998, Elsevier Science, Oxford.
Meek ME and Rider BF (1974). Compilation of fission product yields. Vallecitos Nuclear Center Report NEDO-12154-1. General Electric Company, Vallecitos Nuclear Center, Pleasonton, California (unpublished).
194 Australian participants in British nuclear tests in Australia — Vol 1: Dosimetry


