VoIP Statistics Market Analysis - Point...
12
VoIP Statistics – Market Analysis Q2 2012 October 2012 Point Topic Ltd 73 Farringdon Road London EC1M 3JQ, UK Tel. +44 (0) 20 3301 3305 Email [email protected]
Transcript of VoIP Statistics Market Analysis - Point...

VoIP Statistics – Market Analysis
Q2 2012
October 2012
Point Topic Ltd 73 Farringdon Road
London EC1M 3JQ, UK Tel. +44 (0) 20 3301 3305
Email [email protected]

2 Point Topic VoIP Statistics – Q2 2012
© Point Topic Ltd 2012. Unauthorised reproduction prohibited
Contents
1 Introduction 3
2 Global and regional perspective 4
3 Top VoIP countries 8
4 The impact of internet telephony 12

3 Point Topic VoIP Statistics – Q2 2012
© Point Topic Ltd 2012. Unauthorised reproduction prohibited
1 Introduction At the start of the year, VoIP subscriptions reported healthy quarterly growth. However growth in
VoIP subscriptions has dropped significantly within this quarter and is line with the decline in growth
reported throughout 2011.
Considering all VoIP operators tracked by Point Topic around the globe, global VoIP subscriber
numbers at the end of June 2012 were 143.2 million. Net additions so far in 2012 are 7.4 million.
Our VoIP subscriber market is dominated by subscriptions in six lead countries – the United States,
Japan, France, South Korea, Germany and China. These countries have nearly 80% of our reported
global VoIP market share. Smaller players are posting more rapid growth, but overall these markets
have very little impact on the global trends reported.
Point Topic defines VoIP in this report as a subscription service that does not require a PC to
operate. For this reason, Skype services are not included in the figures for subscribers, although we
discuss them in this report. PSTN-style services are included.

4 Point Topic VoIP Statistics – Q2 2012
© Point Topic Ltd 2012. Unauthorised reproduction prohibited
2 Global and regional perspective
2.1 Overall growth
Considering all VoIP operators tracked by Point topic around the globe, at the end of June 2012 Point
Topic reported 143.2m global VoIP subscribers. Growth in this quarter was down compared to the
same period last year – with VoIP subscriber growth of 2.3% in Q2 2012 compared with 2.7% in Q2
2011. We tend to see strongest growth in the first quarter of the year, so the decline in growth
relative to Q1 2012 was expected.
Net additions for the operators being examined totalled 3.3 million for the quarter. In the first half of
2012, 7.4 million new VoIP subscribers were reported.
Quarter Subscribers Net adds (qtr) Growth
Q2 2011 129,027,509 3,507,388 2.7%
Q3 2011 132,479,282 3,451,773 2.6%
Q4 2011 135,809,530 3,330,248 2.5%
Q1 2012 139,875,875 4,066,345 2.9%
Q2 2012 143,192,213 3,316,338 2.3%
Figure 1: World VoIP subscriber numbers with growth. Source – Point Topic
0.0%
0.5%
1.0%
1.5%
2.0%
2.5%
3.0%
3.5%
120
125
130
135
140
145
Q2 2011 Q3 2011 Q4 2011 Q1 2012 Q2 2012Su
bsc
rib
er
gro
wth
Sub
scri
be
rs (
m)
Global VoIP Trends
Subscribers GrowthSource: Point Topic
5 Point Topic VoIP Statistics – Q2 2012
© Point Topic Ltd 2012. Unauthorised reproduction prohibited
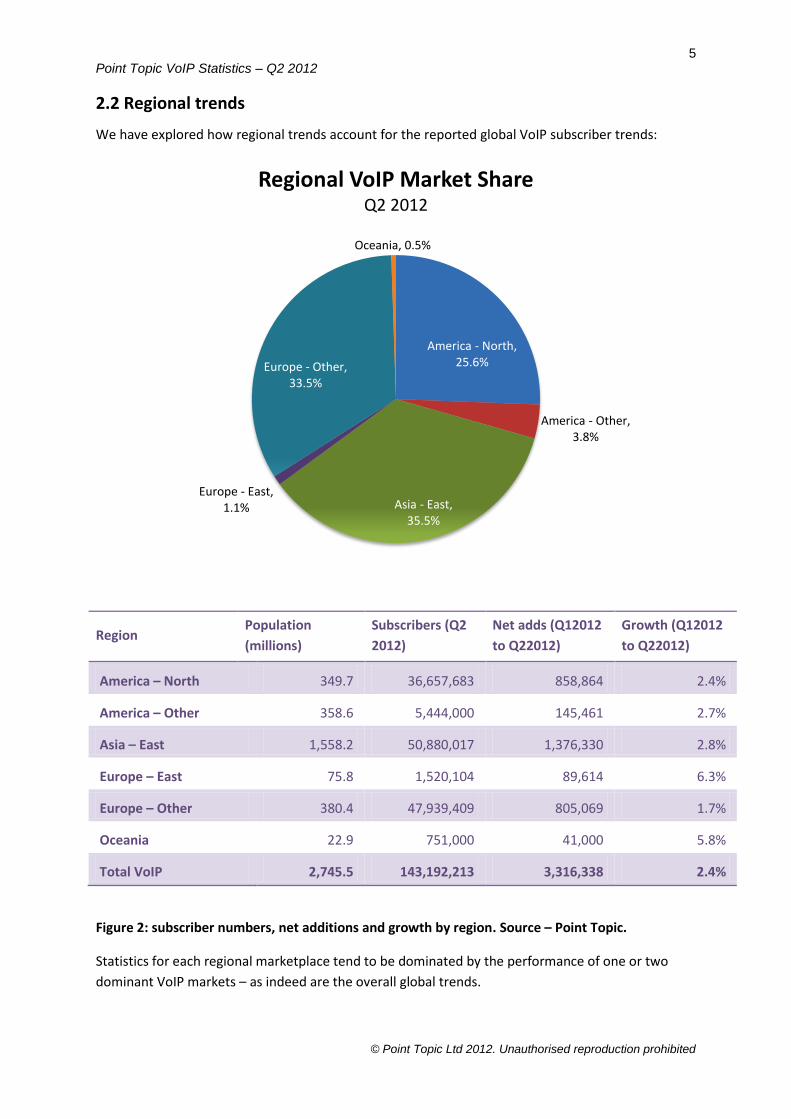
2.2 Regional trends
We have explored how regional trends account for the reported global VoIP subscriber trends:
Region Population
(millions)
Subscribers (Q2
2012)
Net adds (Q12012
to Q22012)
Growth (Q12012
to Q22012)
America – North 349.7 36,657,683 858,864 2.4%
America – Other 358.6 5,444,000 145,461 2.7%
Asia – East 1,558.2 50,880,017 1,376,330 2.8%
Europe – East 75.8 1,520,104 89,614 6.3%
Europe – Other 380.4 47,939,409 805,069 1.7%
Oceania 22.9 751,000 41,000 5.8%
Total VoIP 2,745.5 143,192,213 3,316,338 2.4%
Figure 2: subscriber numbers, net additions and growth by region. Source – Point Topic.
Statistics for each regional marketplace tend to be dominated by the performance of one or two
dominant VoIP markets – as indeed are the overall global trends.
America - North, 25.6%
America - Other, 3.8%
Asia - East, 35.5%
Europe - East, 1.1%
Europe - Other, 33.5%
Oceania, 0.5%
Regional VoIP Market ShareQ2 2012

6 Point Topic VoIP Statistics – Q2 2012
© Point Topic Ltd 2012. Unauthorised reproduction prohibited
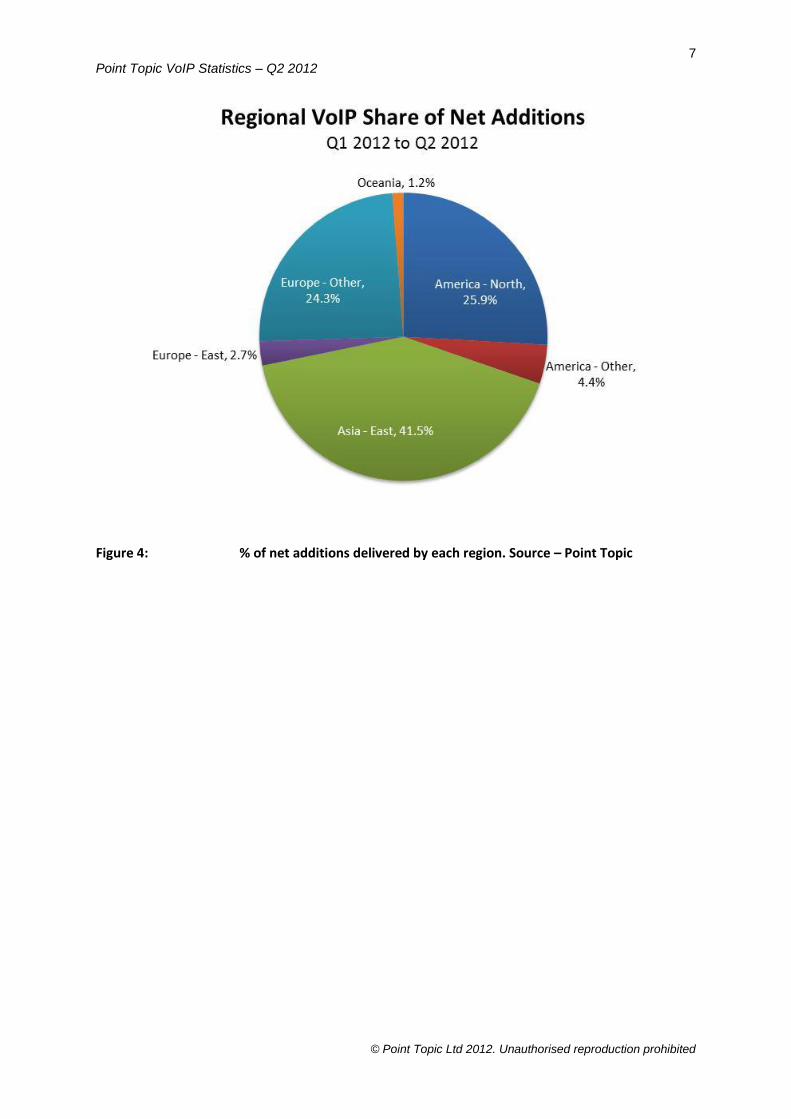
There is a fairly even split between the VoIP market share in East Asia, Europe and the Americas.
However, East Asia has taken the highest share of net additions within the quarter, adding 1.4
million new subscribers and 41.5% of all reported net additions. Out of the six key VoIP countries
tracked, China has posted the strongest growth within the quarter, which accounts for its greater
share of net additions in the quarter.
Eastern Europe continues to report strong growth, although growth has slowed down compared to
recent quarters. Oceania has also posted very strong growth, due to strong performance from the
Australian operator iiNet.
Note that we have changed our regional definitions within this quarter to align with the UN
classification for regions. Please get in touch if this affects your reporting. Definitions have all been
updated within the Global Broadband Statistics new service.
Figure 3: penetration and quarterly growth by region – area represents subscriber volume in
Q2 2012. Source – Point Topic
7 Point Topic VoIP Statistics – Q2 2012
© Point Topic Ltd 2012. Unauthorised reproduction prohibited
Figure 4: % of net additions delivered by each region. Source – Point Topic
8 Point Topic VoIP Statistics – Q2 2012
© Point Topic Ltd 2012. Unauthorised reproduction prohibited
3 Top VoIP countries
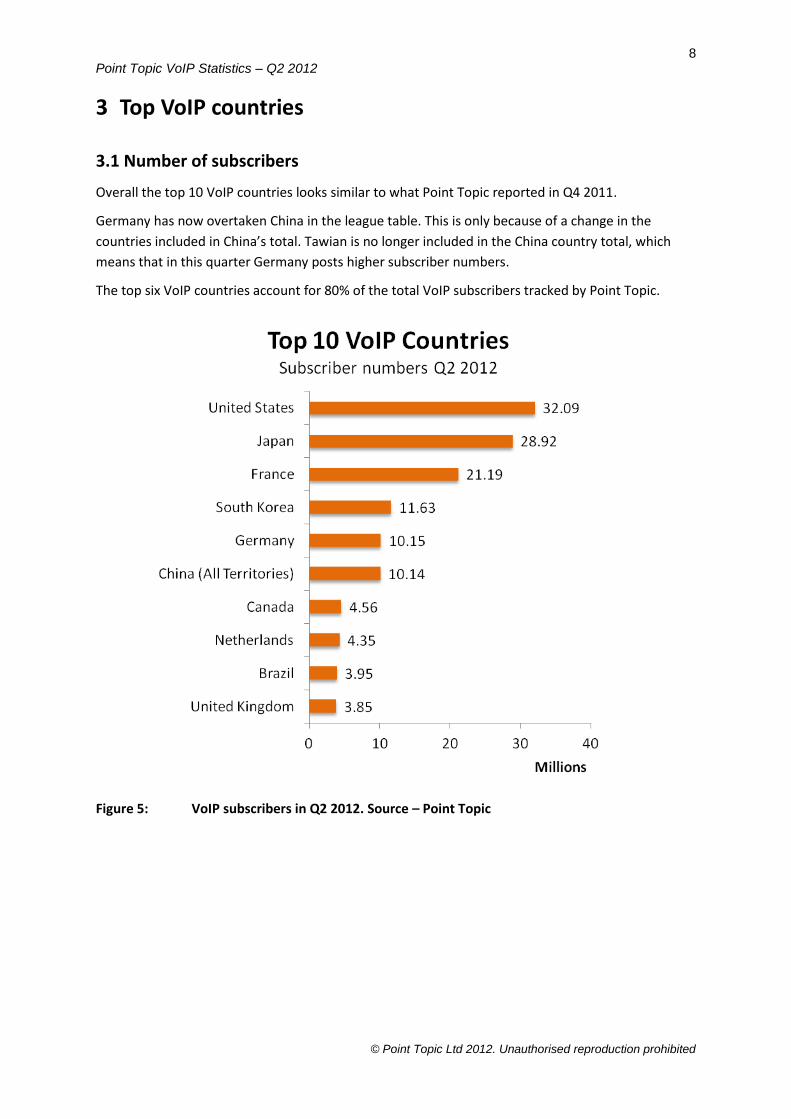
3.1 Number of subscribers
Overall the top 10 VoIP countries looks similar to what Point Topic reported in Q4 2011.
Germany has now overtaken China in the league table. This is only because of a change in the
countries included in China’s total. Tawian is no longer included in the China country total, which
means that in this quarter Germany posts higher subscriber numbers.
The top six VoIP countries account for 80% of the total VoIP subscribers tracked by Point Topic.
Figure 5: VoIP subscribers in Q2 2012. Source – Point Topic
9 Point Topic VoIP Statistics – Q2 2012
© Point Topic Ltd 2012. Unauthorised reproduction prohibited
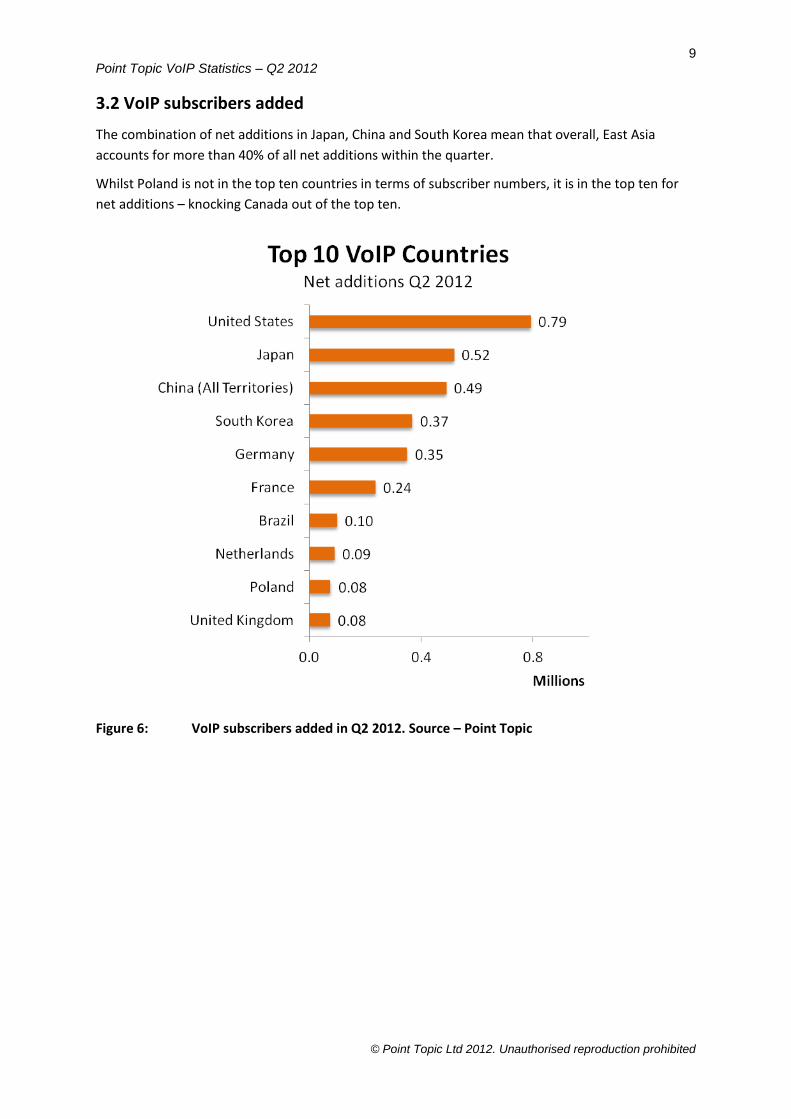
3.2 VoIP subscribers added
The combination of net additions in Japan, China and South Korea mean that overall, East Asia
accounts for more than 40% of all net additions within the quarter.
Whilst Poland is not in the top ten countries in terms of subscriber numbers, it is in the top ten for
net additions – knocking Canada out of the top ten.
Figure 6: VoIP subscribers added in Q2 2012. Source – Point Topic
10 Point Topic VoIP Statistics – Q2 2012
© Point Topic Ltd 2012. Unauthorised reproduction prohibited
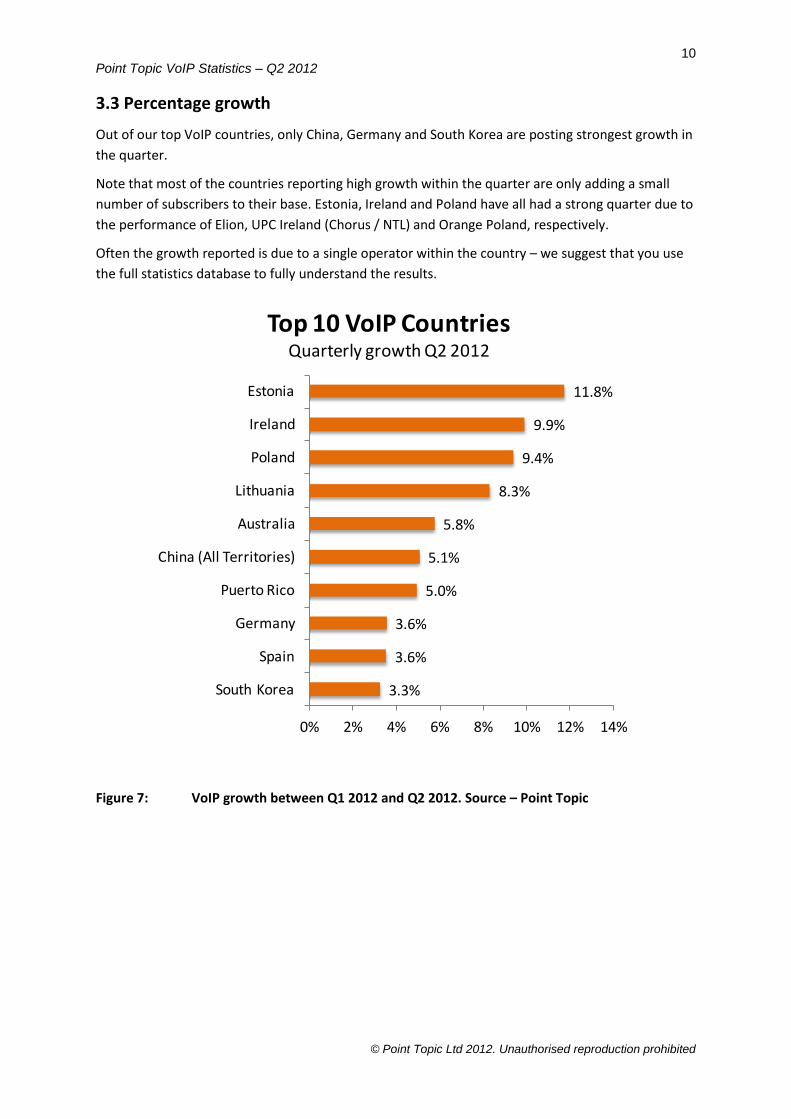
3.3 Percentage growth
Out of our top VoIP countries, only China, Germany and South Korea are posting strongest growth in
the quarter.
Note that most of the countries reporting high growth within the quarter are only adding a small
number of subscribers to their base. Estonia, Ireland and Poland have all had a strong quarter due to
the performance of Elion, UPC Ireland (Chorus / NTL) and Orange Poland, respectively.
Often the growth reported is due to a single operator within the country – we suggest that you use
the full statistics database to fully understand the results.
Figure 7: VoIP growth between Q1 2012 and Q2 2012. Source – Point Topic
3.3%
3.6%
3.6%
5.0%
5.1%
5.8%
8.3%
9.4%
9.9%
11.8%
0% 2% 4% 6% 8% 10% 12% 14%
South Korea
Spain
Germany
Puerto Rico
China (All Territories)
Australia
Lithuania
Poland
Ireland
Estonia
Top 10 VoIP CountriesQuarterly growth Q2 2012
11 Point Topic VoIP Statistics – Q2 2012
© Point Topic Ltd 2012. Unauthorised reproduction prohibited
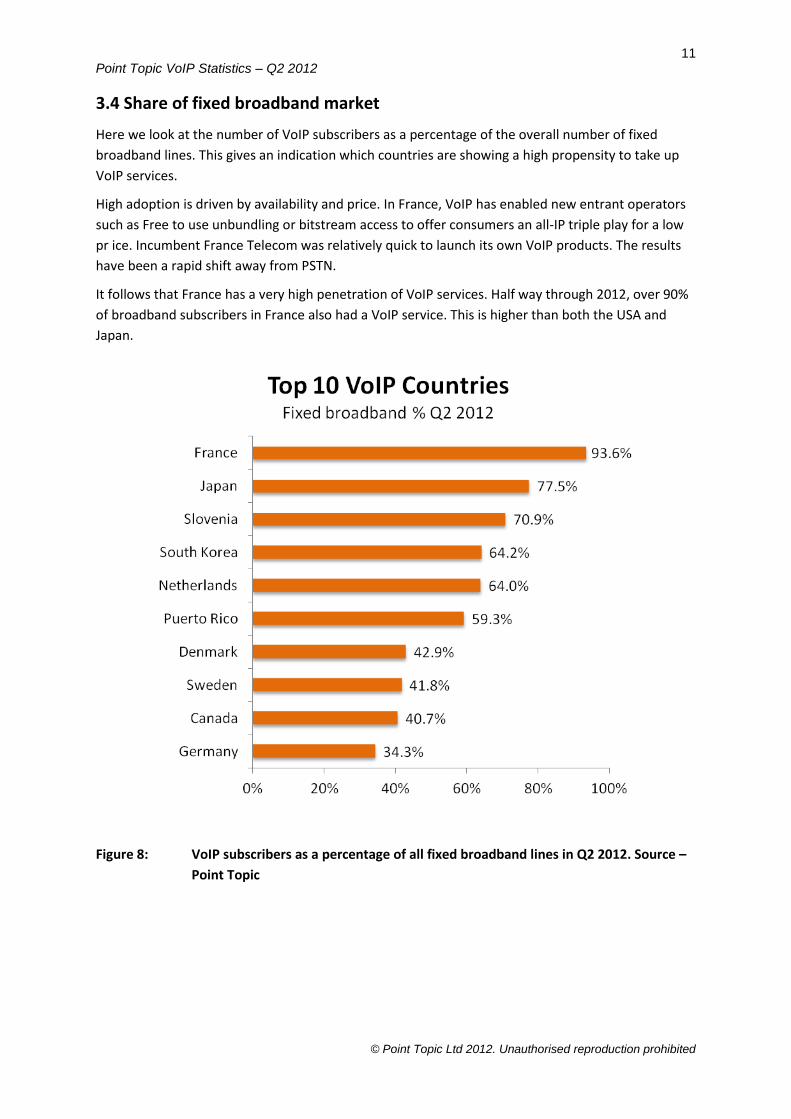
3.4 Share of fixed broadband market
Here we look at the number of VoIP subscribers as a percentage of the overall number of fixed
broadband lines. This gives an indication which countries are showing a high propensity to take up
VoIP services.
High adoption is driven by availability and price. In France, VoIP has enabled new entrant operators
such as Free to use unbundling or bitstream access to offer consumers an all-IP triple play for a low
pr ice. Incumbent France Telecom was relatively quick to launch its own VoIP products. The results
have been a rapid shift away from PSTN.
It follows that France has a very high penetration of VoIP services. Half way through 2012, over 90%
of broadband subscribers in France also had a VoIP service. This is higher than both the USA and
Japan.
Figure 8: VoIP subscribers as a percentage of all fixed broadband lines in Q2 2012. Source –
Point Topic

12 Point Topic VoIP Statistics – Q2 2012
© Point Topic Ltd 2012. Unauthorised reproduction prohibited
4 The impact of internet telephony All of the VoIP services that Point Topic has been tracking use IP technology to provide a PSTN-like
service. In other words, the customer can simply pick up a telephone handset to make a call, and will
receive a bill from their service provider.
But any discussion of VoIP needs to include Internet telephony. Luxembourg-registered Skype is by
far the most widespread of these services, although some IM platforms and online gaming networks
support IP voice traffic. Initially, the majority of calls via Skype were made and received from the PC.
For non-technical users, Skype still remains more complex to use.
Calls can now be made via a mobile, connecting to the Internet using WiFi (usually free) or 3G (could
be expensive depending on the tariff). Skype phones are also available, which plug directly into a
router and do not require the home PC to be switched on. But these have seen relatively low rate of
uptake.
In 2011 Skype provided some operational data for 2010, in an amendment to an S1 filing with the
SEC. An S1 filing is a general registration, which is the first step towards an initial public offering
(IPO).
Skype said that it had 663 million registered users at the end of 2010 (up 89 million over the year),
with 145 million registrants using Skype at least once a month. However, only 8.8 million Skype
registrants paid any money for the services, generating revenues of $859.8 million. That represents
an ARPU of just over $8 per user per month assuming a constant rate of ARPU growth. Skype also
said that 42% of its minutes in Q4 2010 were video telephony. Skype also planned to launch
advertising on its services, perhaps to make up for the revenue it is not earning from telephony.
Adverts were due to run in the USA, UK and Germany initially.
What these numbers suggest is that the number of regular Skype users is at around the same level
as the number of ‘full-service VoIP’ users (135 million). ARPU is considerably lower, as only 8.8
million Skype subscribers were paying anything at the end of 2010.
The other obvious point to be made from the Skype data is that there is demand for video calls. But
Skype has created an expectation that this is a free service. This makes monetising video calls
difficult for other operators in the consumer video telephony space, and even for operators looking
at the low end business video telephony market.