Voice Perception in Blind Persons Gougoux Et Al 2009
9
Please cite this article in press as: Gougoux, F., et al. Voice perception in blind persons: A functional magnetic resona nce imaging study. Neuropsychologia (2009), doi:10.1016/j.neuropsychologia.2009.06.027 ARTICLE IN PRESS G Model NSY -3349; No.of Page s 8 Neuropsychologia xxx (2009) xxx–xxx Contents lists available at ScienceDirect Neuropsychologia j ou r nal h o me p a g e: www.elsevier.com/locate/neuropsychologia Voice perception in blind persons: A functional magnetic resonance imaging study Frédéric Gougoux a , Pascal Belin b,c , Patrice Voss a,c,f , Franco Lepore a,d,e , Maryse Lassonde a,e , Robert J. Zatorre c,f ,∗ a Centre de Recherche en Neuropsychologie et Cognition, Université de Montréal, Montréal, Québec, Canada b Centre for Cognitive Neuroimaging (CCNi), University of Glasgow, Scotland, United Kingdom c Laboratory for Brain, Music and Sound research (BRAMS), Montréal, Canada d Institut Universitaire de Gériatrie de Montréal, Montréal, Canada e Centre Hospitalier Universitaire Mère-Enfant (Sainte-Justine), Montréal, Québec, Canada f Neuropsychology/Cognitive Neuroscience Unit, Montreal Neurological Institute, McGill University, Montreal, Québec, Canada a r t i c l e i n f o Article history: Received 11 March 2009 Received in revised form 4 June 2009 Accepted 23 June 2009 Available online xxx Keywords: Auditory perception Blindness Brain imaging Cross-modal Intramodal Plasticity a b s t r a c t Ear lyblindperso ns hav eoftenbeen shownto be superior tosight edones acr ossa widerangeof non-visual perce ptualabilities,which in turn are oftenexplainedby the functi onallyreleva nt recrui tmentof occipi tal areas.Whilevoicestimu li areknownto inv olv e voice-select iv e areas of thesuper iortemporal sul cus(STS) in sighted per sons , it remains unkn ownif the processing of vocal sti mul i involves similar bra in reg ions in blind persons, or whether it benefits from cross-modal processing. To address these questions, we used fMRI to mea sur e cer ebr al res ponsesto voi ce and non-vo icestimul i in bli nd (conge nita l and acq uir ed)and sighted subjects. The global comparison of all sounds vs. silence showed a different pattern of activation between blind(pooled congenitaland acquired)and sight ed group s, withblind subjec ts showi ng stron ger activation of occipital areas but weaker activation of temporal areas centered around Heschl’s gyrus. In contrast, the specific comparison of vocal vs. non-vocal sounds did not isolate activations in the occipital areasin eit herof theblind gro ups . Inthe congen itallyblind gro up,howeve r,it ledto a str ong eractiv ati onin the lef t STS , and to a les ser ext ent in the fus iform cortex, compar ed to bot h sig hted part ici pants andthose with acquired blindness. Moreover, STS activity in congenital blind participants significantly correlated with performance in a voice discrimination task. This increased recruitment of STS areas in the blind for voice processing is in marked contrast with the usual cross-modal recruitment of occipital cortex. © 2009 Elsevier Ltd. All rights reserved. 1. Introduction It is a common belief that blind people perform better than sighted ones at a variety of non-visual tasks, probably because they compensate for their lack of vision with increased process- ing within other sensory modalities. Indeed, many studies have confirmed that blind persons have superior abilities for non-visual perceptual tasks, such as pitch-change direction discrimination (Gougoux et al. , 2004 ), verbal memor y (Amedi, Raz,Pianka, Malac h, & Zoha ry , 2003; Hull & Mason , 1 995; Röder , Rosl er , & Nev ille, 2001), speech discrimination (Muchnick, Efrati, Nemeth, Malin, & Hildesheimer, 1991; Niemeyer & Starlinger, 1981), sound local- ization (Ashmead et al., 1998; Gougoux, Zatorre, Lassonde, Voss, & Lepor e, 2005; Lessard , Paré , Lasso nde, & Lepor e, 1 998; Rice, 1 970 ; Röder et al., 1999; Voss, Lasso nde, Gougoux , Guil lemo t, ∗ Corresponding author at: Montreal Neurological Institute, 3801 University , Montreal, Québec, Canada, H3A 2B4. Tel.: +1 514 398 8903; fax: +1 514 398 1338. E-mail address: robert.zatorre @mcgill.ca (R.J. Zatorre). & Lepore, 2004) or tact ile discrimination (Gold reic h & Kani cs, 2003; Van Boven, Hamilton, Kauffman, Keenan, & Pascual-Leone, 2000). What are the neural mechanisms involved in these superior behavioral abilities? One influential hypothesis is that the recruit- men t of vis ualareas is involved in this compen sation . Some ins igh t into the neural substrates of these enhan ced capacit ies is pro- vided by animal studies (for a review, see Rauschecker, 1995). For instance, in cats deprived of visual input for several years by eye- lid suture shortly after birth, the auditory cortical representation occupied larger portions of the multi-modal Anterior Ectosylvian area (Rauschecker & Korte, 1993), and auditory spatial tuning of the neurons was sharper (Korte & Rauschecker, 1993). Similarly, in neonatally enucleated rats, electroph ysiological recordings have shown somatosensory (Toldi, Farkas, & Volgyi, 1994) and auditory (Piche et al., 2007) responses in visual cortex, and an enlargement of receptive fields or an increased deflection angular sensitivity for cells in different whisker barrels (Toldi, Rojik, & Feher, 1994). Thus,cortic al repr esent ation s of non- visua l moda liti es inde ed seem to invade the visual cortex in blind animals while some sensory- 0028-3932/$ – see front matter © 2009 Elsevier Ltd. All rights reserved. doi:10.1016/j.neuropsychologia.2009.06.027
Transcript of Voice Perception in Blind Persons Gougoux Et Al 2009
8/11/2019 Voice Perception in Blind Persons Gougoux Et Al 2009
http://slidepdf.com/reader/full/voice-perception-in-blind-persons-gougoux-et-al-2009 1/8
Please cite this article in press as: Gougoux, F., et al. Voice perception in blind persons: A functional magnetic resonance imaging study.
Neuropsychologia (2009), doi:10.1016/j.neuropsychologia.2009.06.027
ARTICLE IN PRESSG Model
NSY-3349; No.of Pages 8
Neuropsychologia xxx (2009) xxx–xxx
Contents lists available at ScienceDirect
Neuropsychologia
j o u r n a l h o m e p a g e : w w w . e l s e v i e r . c o m / l o c a t e / n e u r o p s y c h o l o g i a
Voice perception in blind persons: A functional magnetic resonanceimaging study
Frédéric Gougoux a, Pascal Belin b,c, Patrice Voss a,c,f , Franco Lepore a,d,e,Maryse Lassonde a,e, Robert J. Zatorre c,f ,∗
a Centre de Recherche en Neuropsychologie et Cognition, Université de Montréal, Montréal, Québec, Canadab Centre for Cognitive Neuroimaging (CCNi), University of Glasgow, Scotland, United Kingdomc Laboratory for Brain, Music and Sound research (BRAMS), Montréal, Canadad Institut Universitaire de Gériatrie de Montréal, Montréal, Canadae Centre Hospitalier Universitaire Mère-Enfant (Sainte-Justine), Montréal, Québec, Canadaf Neuropsychology/Cognitive Neuroscience Unit, Montreal Neurological Institute, McGill University, Montreal, Québec, Canada
a r t i c l e i n f o
Article history:
Received 11 March 2009
Received in revised form 4 June 2009
Accepted 23 June 2009
Available online xxx
Keywords:
Auditory perception
Blindness
Brain imaging
Cross-modal
Intramodal
Plasticity
a b s t r a c t
Earlyblindpersons have oftenbeen shownto be superior tosightedones acrossa wide rangeof non-visual
perceptualabilities,which in turn are oftenexplainedby the functionallyrelevant recruitmentof occipital
areas.Whilevoicestimuli areknownto involve voice-selective areas of thesuperiortemporal sulcus(STS)
in sighted persons, it remains unknownif the processing of vocal stimuli involves similar brain regions in
blind persons, or whether it benefits from cross-modal processing. To address these questions, we used
fMRI to measure cerebral responsesto voice and non-voicestimuli in blind (congenital and acquired)and
sighted subjects. The global comparison of all sounds vs. silence showed a different pattern of activation
between blind(pooled congenitaland acquired)and sighted groups, withblind subjects showing stronger
activation of occipital areas but weaker activation of temporal areas centered around Heschl’s gyrus. In
contrast, the specific comparison of vocal vs. non-vocal sounds did not isolate activations in the occipital
areasin eitherof theblind groups. Inthe congenitallyblind group,however,it ledto a strongeractivationin
the left STS, and to a lesser extent in the fusiform cortex, compared to both sighted participants andthosewith acquired blindness. Moreover, STS activity in congenital blind participants significantly correlated
with performance in a voice discrimination task. This increased recruitment of STS areas in the blind for
voice processing is in marked contrast with the usual cross-modal recruitment of occipital cortex.
© 2009 Elsevier Ltd. All rights reserved.
1. Introduction
It is a common belief that blind people perform better than
sighted ones at a variety of non-visual tasks, probably because
they compensate for their lack of vision with increased process-
ing within other sensory modalities. Indeed, many studies have
confirmed that blind persons have superior abilities for non-visual
perceptual tasks, such as pitch-change direction discrimination
(Gougoux et al., 2004), verbal memory (Amedi, Raz,Pianka, Malach,& Zohary, 2003; Hull & Mason, 1995; Röder, Rosler, & Neville,
2001), speech discrimination (Muchnick, Efrati, Nemeth, Malin,
& Hildesheimer, 1991; Niemeyer & Starlinger, 1981), sound local-
ization (Ashmead et al., 1998; Gougoux, Zatorre, Lassonde, Voss,
& Lepore, 2005; Lessard, Paré, Lassonde, & Lepore, 1998; Rice,
1970; Röder et al., 1999; Voss, Lassonde, Gougoux, Guillemot,
∗ Corresponding author at: Montreal Neurological Institute, 3801 University,
Montreal, Québec, Canada, H3A 2B4. Tel.: +1 514 398 8903; fax: +1 514 398 1338.
E-mail address: [email protected] (R.J. Zatorre).
& Lepore, 2004) or tactile discrimination (Goldreich & Kanics,
2003; Van Boven, Hamilton, Kauffman, Keenan, & Pascual-Leone,
2000).
What are the neural mechanisms involved in these superior
behavioral abilities? One influential hypothesis is that the recruit-
ment of visual areas is involved in this compensation. Some insight
into the neural substrates of these enhanced capacities is pro-
vided by animal studies (for a review, see Rauschecker, 1995). For
instance, in cats deprived of visual input for several years by eye-lid suture shortly after birth, the auditory cortical representation
occupied larger portions of the multi-modal Anterior Ectosylvian
area (Rauschecker & Korte, 1993), and auditory spatial tuning of
the neurons was sharper (Korte & Rauschecker, 1993). Similarly,
in neonatally enucleated rats, electrophysiological recordings have
shown somatosensory (Toldi, Farkas, & Volgyi, 1994) and auditory
(Piche et al., 2007) responses in visual cortex, and an enlargement
of receptive fields or an increased deflection angular sensitivity
for cells in different whisker barrels (Toldi, Rojik, & Feher, 1994).
Thus,cortical representations of non-visual modalities indeed seem
to invade the visual cortex in blind animals while some sensory-
0028-3932/$ – see front matter © 2009 Elsevier Ltd. All rights reserved.
doi:10.1016/j.neuropsychologia.2009.06.027
8/11/2019 Voice Perception in Blind Persons Gougoux Et Al 2009
http://slidepdf.com/reader/full/voice-perception-in-blind-persons-gougoux-et-al-2009 2/8
Please cite this article in press as: Gougoux, F., et al. Voice perception in blind persons: A functional magnetic resonance imaging study.
Neuropsychologia (2009), doi:10.1016/j.neuropsychologia.2009.06.027
ARTICLE IN PRESSG Model
NSY-3349; No.of Pages 8
2 F. Gougoux et al. / Neuropsychologia xxx (2009) xxx–xxx
specific cortical cells seem to show improved characteristics such
as, for example, sharper tuning or better angular sensitivity.
In humans, several studies using neuroimaging techniques have
shown thatoccipital areas in blind persons are recruitedto carry out
non-visual tasks such as Braille reading (Burton, Snyder, Conturo,et
al., 2002; Sadato et al., 1996), memory retrieval (Amedi et al., 2003)
sound localization (Gougoux et al., 2005; Leclerc, Saint-Amour,
Lavoie, Lassonde, & Lepore, 2000; Weeks et al., 2000) or other
auditory functions (Arno et al., 2001; Burton, Snyder, Diamond, &
Raichle, 2002; Kujala et al., 1995; Liotti, Ryder, & Woldroff, 1998;
Röder, Stock, Bien, Neville, & Rosler, 2002). A few studies have also
suggested increased cortical representation in the expected areas
for auditory (Elbert et al., 2002), somatosensory (Sterr et al., 1998)
or motor functions (Pascual-Leone & Torres, 1993) in blind persons.
Little is known, however, about the brain mechanisms involved in
voice perception in blind persons.
Voice perception is a crucial aspect of human social communi-
cation, allowing us to extract from a voice not only the linguistic
message contained in speech, but also a wealth of information
about the speaker’s identity (gender, age, region of origin) and
affective state (Belin, Fecteau, & Bédard, 2004). Voice perception
is especially important for blind individuals in allowing them
to recognize other people. Interestingly, the philosopher Diderot
reported over two centuries ago, in his Lettre pour les aveugles(1749), the case of a blind man able to recognize voices with a very
high accuracy. Although a wealth of anecdotal observations indeed
suggests better voice processing in the blind, empirical evidencefor
such a superiority of blind persons is quite scarce. The few avail-
able behavioral studies have yielded only conflicting results, with
only one study showing superiority in the blind (Bull, Rathborn, &
Clifford, 1983) while twoothers did notfind any differencebetween
sighted and blind individuals (Gunzburger, Bresser, & Ter Keurs,
1987; Winograd, Kerr, & Spence, 1984).
In sighted persons, it has been shown that auditory cortex along
anterior superior temporal sulcus (STS) contains voice-selective
regions more active specifically in response to vocal sounds com-
pared to non-vocal sounds (Belin, Zatorre, & Ahad, 2002; Belin,
Zatorre, Lafaille, Ahad, & Pike, 2000; Fecteau, Armony, Joanette, &
Belin, 2004; von Kriegstein, Eger, Kleinschmidt, & Giraud, 2003;
Warren, Scott, Price, & Griffiths,2006). Itis as yet unknownwhether
the processing of vocal stimuli involves similar brain regions in
blind persons, or recruits additional visual areas as is the case for
many other non-visual tasks. We used functional magnetic res-
onance imaging (fMRI) to measure brain responses to vocal and
non-vocal sounds in blind and sighted subjects in order to test
the hypothesis that vocal processing would engage not only voice-
sensitive regions, but also occipital cortices.
2. Material and methods
2.1. Participants
The participants were 14 healthy sighted volunteers and 15 blind subjects who
either lost their vision at birth (congenital blindness; n = 5) or later in life (acquired
blindness; n = 10), from one year to 45 years after birth (see Table 1). In each case,
the visual deficit was of peripheral origin and led to total blindness except for some
residuallightperception in four subjects (categories4 and5, according tothe World
Health Organization [WHO] classification, 1996). All participants underwent audio-
metric testing to ensure good hearing, with no difference between ears superior to
25 dB for frequencies between 500 Hz and 8 kHz. They gave their written informed
consent in accordance with guidelines approved by the Ethics and Research Com-
mittees of the Montreal Neurological Institute and the Nazareth and Louis-Braille
Institute for the Blind.
2.2. Scanner experiment
2.2.1. Procedure and stimuli
Following the procedure developed by Belin et al. (2000, 2002) in sighted indi-
viduals, subjects were asked to listen passively to vocal or to overall energy (RMS)
matched non-vocalsoundswhile theywere lying within thescanner. Auditory stim-
Table 1
Characteristics of blind and sighted participants.
Subject Gender Age (years) Age at blindness onset Etiology (years) Residual light perception
Congenitally blind group (n = 5; mean age 30.4 years)
1 F 36 0 Bilateral retinal dysplasia Y
2 F 23 0 Retinopathy of prematurity N
3 F 21 0 Retinal detachment N
4 M 40 0 Congenital, non-specified N
5 M 32 0 Leber’s disease Y
Acquired blind group (n = 10; mean age 34.2 years)
1 F 25 1 Retinoblastoma N
2 M 23 2 Retinoblastoma N
3 F 41 5 Retinoblastoma Y
4 F 24 8 Retinal detachment
5 M 34 14 Leber’s disease N
6 M 36 14 Juvenile inflammatory rheumatism N
7 F 33 22 Glaucoma N
8 F 46 45 Retinitis pigmentosa Y
9 M 40 37 Glaucoma N
10 M 40 37 Glaucoma cataract N
Sighted group (n = 14; mean age 26.3 years)
1 M 27
2 M 25
3 M 22
4 F 25
5 F 22
6 M 26
7 F 37
8 F 27
9 F 37
10 M 25
11 F 21
12 F 25
13 M 27
14 M 22
8/11/2019 Voice Perception in Blind Persons Gougoux Et Al 2009
http://slidepdf.com/reader/full/voice-perception-in-blind-persons-gougoux-et-al-2009 3/8
Please cite this article in press as: Gougoux, F., et al. Voice perception in blind persons: A functional magnetic resonance imaging study.
Neuropsychologia (2009), doi:10.1016/j.neuropsychologia.2009.06.027
ARTICLE IN PRESSG Model
NSY-3349; No.of Pages 8
F. Gougoux et al. / Neuropsychologia xxx (2009) xxx–xxx 3
uli were presented binaurally overelectrostaticMR-compatibleheadphones (KOSS)
and additional plastic muffs were added to attenuate the sounds of the scanner.
Stimuli were presentedat 75dB SPL. Theparticipants were asked to close their eyes
while they listened to the sounds. The paradigm was identical to the one used in
a previous study (see Belin et al., 2000). Sounds were presented in blocks of 20 s
duration: 21 blocks of vocal sounds and 21 blocks of environmental sounds; the
inter-block interval was 10 s. Each block included 12 different speakers (for vocal
sounds) or sources (for non-vocal sounds) of similar overall energy (RMS). Vocal
stimuli within the same block could be either speech (33%: words, non-words, for-
eign language) or non-speech (67%: laughs, sighs, various onomatopoeia). Sounds
that did not involve vocal-fold vibration were excluded (for example, whistling,whispered speech). Non-vocal stimuli consisted of sounds from nature (14%: for
example, wind, streams),animals (29%: cries, gallops), the modern humanenviron-
ment (37%: cars, telephones, aeroplanes) or musical instruments (20%: bells, harp,
instrumental orchestra).
2.2.2. MRI acquisition and fMRI scanning
Scans were obtained on a 1.5-T Siemens Magnetom scanner. A T1-weighted MR
image was first acquired to provide anatomical detail (TE= 10ms; TR = 22 ms, sagit-
tal acquisition plane, head coil, flip angle 30◦). Then a series of 128 gradient-echo
BOLD images was acquired for the experiment (TE= 50 ms, head coil, matrix size:
64×64; voxel size: 5 mm×5 mm×5 mm; 10 slices acquired in the orientation of
the Sylvian fissure covering the auditory cortex and centered on Heschl’s gyrus).
To avoid artifacts caused by scanning noise, we used a sparse-sampling (TR = 10s)
echo-planar imaging fMRI(Belin, Zatorre,Hoge,Evans,& Pike,1999; Hallet al.,1999).
The 20 s blocks were presented in a pseudo-random order with 10 s silence inter-
valsusing MediaControlFunctionsoftware (Digivox, Montreal)and blockonset was
synchronized with acquisition of the first brain image.
2.2.3. Data analysis
Blood oxygenation-level dependent(BOLD)imagesweresmoothed(6-mmgaus-
sian), corrected for motion artefacts and transformed into standardized stereotaxic
space (Talairach & Tournoux, 1988) using in-house software (Collins, Neelin, Peters,
& Evans, 1994) and theMNI 305 averageas thetarget.Statisticalmaps wereobtained
for each individual using a voxel-based analysis based on a linear model with cor-
related errors, with direct specification of the design matrix (Worsley et al., 2001).
Group-average statistical images were obtained by computing an omnibus-test on
individual t -maps using a pooled estimate of standard deviation (Worsley, Evans,
Marrett, & Neelin, 1992). Depending on the analysis, criteria of t = 4.8–5.0 were cal-
culated for the whole brain (Worsley et al., 1996). However, a less strict threshold
(t >2.5) was considered for regions of interest defined a priori, such as occipital and
temporal areas.
In the group contrast analyses that follow in Section 3, we use the blindness
categories congenital vs. acquired; however, four individuals in the acquired group
lost their visionearly in life butnot at birth (between theagesof 1 and8), andcouldalso be grouped along with the congenitally blind to form an early blind that would
then be compared to a late-blind group. We therefore also tested for group differ-
ences using this classification. The pattern of results reported below did not change
with this re-classification, with the exception of the vocal vs. non-vocal contrast, as
identified within the results.
2.3. Behavioral task
2.3.1. Procedure
After the scanning session, participants performed a voice discrimination task
in the laboratory. On each trial, subjects heard two different syllables and had to
decide whether the two syllables were spoken by the same or a different speaker.
Participants were seated in front of a computer and the stimuli were delivered
through headphones at a comfortable intensity level for each individual. Com-
pliance to all instructions was ascertained by an experimenter remaining seated
beside the subject. The response was obtained via two buttons of a computer
mouse and thus the procedure was the same for sighted and blind subjects. Onelate-blind subject was excluded from analysis because the task was not well under-
stood.
2.3.2. Stimuli
Stimuli consisted of 81 spoken syllables: 9 syllables (head, had, hawed, haid,
heid, heard, hid, heed, hoad) each spoken by 9 speakers: 3 men, 3 women and 3
male children. They were part of a database of American English vowels recorded
in similar controlled conditions across a large number of speakers, described in
detail elsewhere (Hillenbrand, Getty, Clark, & Wheeler, 1995) and kindly made
available to the present authors. All stimuli (16-bits, mono, 16 kHz sampling rate)
were equated for RMS amplitude using Mitsyn software (WLH, MA, USA). On
each trial, one of the 81 syllables was paired randomly with another of the 80
remaining syllables, such that on about half of the trials the two syllables were
pronounced by a same speaker (50% “same” and 50% “different” trials). Two stimuli
with a mean duration of 451 ms were presented one after the other without pause
except for the silence included in the wave files (mean “inter-stimuli-interval” of
156ms).
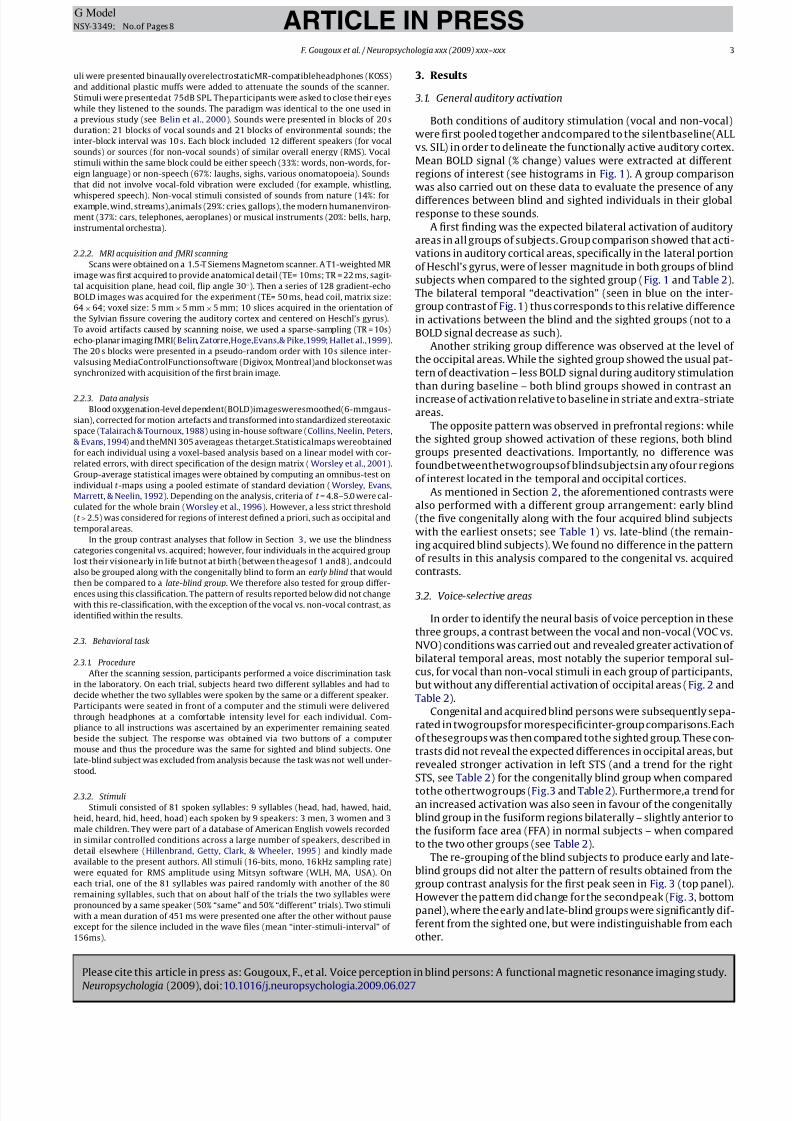
3. Results
3.1. General auditory activation
Both conditions of auditory stimulation (vocal and non-vocal)
were first pooled together andcompared to the silentbaseline(ALL
vs. SIL) in order to delineate the functionally active auditory cortex.
Mean BOLD signal (% change) values were extracted at different
regions of interest (see histograms in Fig. 1). A group comparison
was also carried out on these data to evaluate the presence of anydifferences between blind and sighted individuals in their global
response to these sounds.
A first finding was the expected bilateral activation of auditory
areas in all groups of subjects. Group comparison showed that acti-
vations in auditory cortical areas, specifically in the lateral portion
of Heschl’s gyrus, were of lesser magnitude in both groups of blind
subjects when compared to the sighted group (Fig. 1 and Table 2).
The bilateral temporal “deactivation” (seen in blue on the inter-
group contrast of Fig. 1) thus corresponds to this relative difference
in activations between the blind and the sighted groups (not to a
BOLD signal decrease as such).
Another striking group difference was observed at the level of
the occipital areas. While the sighted group showed the usual pat-
tern of deactivation – less BOLD signal during auditory stimulationthan during baseline – both blind groups showed in contrast an
increase of activation relative to baseline in striate and extra-striate
areas.
The opposite pattern was observed in prefrontal regions: while
the sighted group showed activation of these regions, both blind
groups presented deactivations. Importantly, no difference was
foundbetweenthetwogroupsof blindsubjectsin any ofour regions
of interest located in the temporal and occipital cortices.
As mentioned in Section 2, the aforementioned contrasts were
also performed with a different group arrangement: early blind
(the five congenitally along with the four acquired blind subjects
with the earliest onsets; see Table 1) vs. late-blind (the remain-
ing acquired blind subjects). We found no difference in the pattern
of results in this analysis compared to the congenital vs. acquired
contrasts.
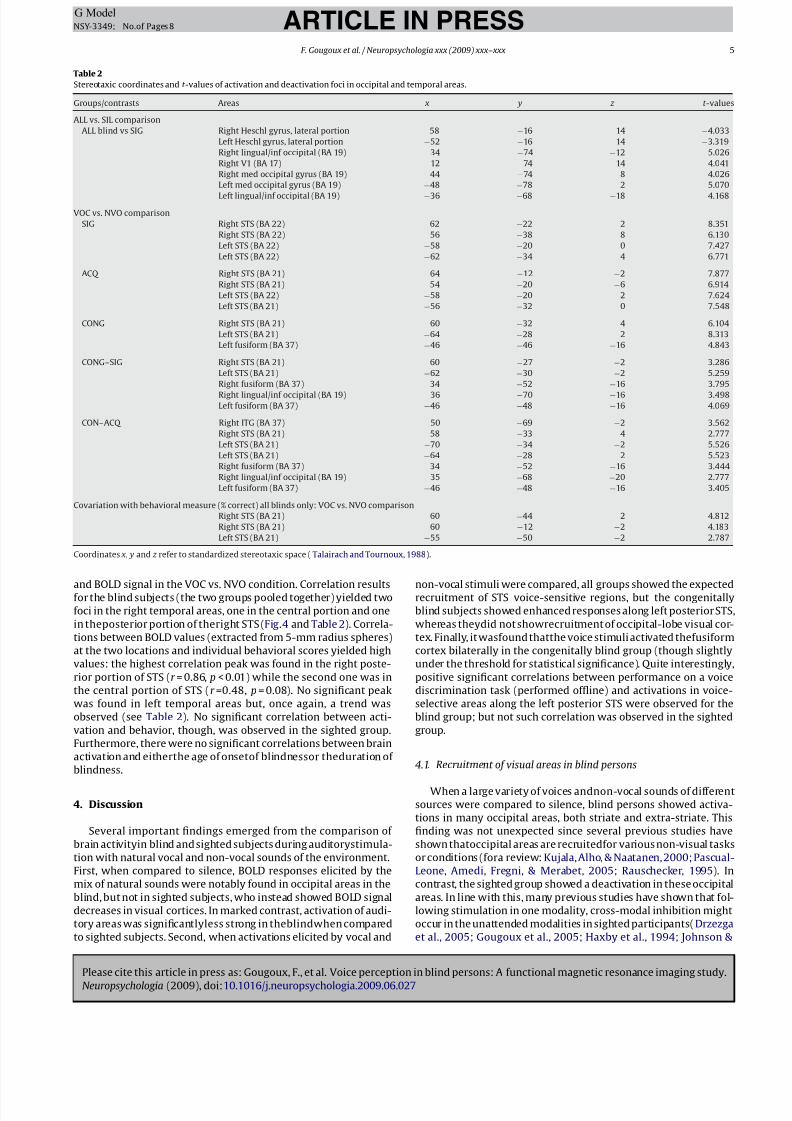
3.2. Voice-selective areas
In order to identify the neural basis of voice perception in these
three groups, a contrast between the vocal and non-vocal (VOC vs.
NVO) conditions was carried out and revealed greater activation of
bilateral temporal areas, most notably the superior temporal sul-
cus, for vocal than non-vocal stimuli in each group of participants,
but without any differential activation of occipital areas (Fig. 2 and
Table 2).
Congenital and acquired blind persons were subsequently sepa-
rated in twogroupsfor morespecificinter-group comparisons.Each
of thesegroups was then compared tothe sighted group. These con-
trasts did not reveal the expected differences in occipital areas, butrevealed stronger activation in left STS (and a trend for the right
STS, see Table 2) for the congenitally blind group when compared
tothe othertwogroups (Fig.3 and Table 2). Furthermore,a trend for
an increased activation was also seen in favour of the congenitally
blind group in the fusiform regions bilaterally – slightly anterior to
the fusiform face area (FFA) in normal subjects – when compared
to the two other groups (see Table 2).
The re-grouping of the blind subjects to produce early and late-
blind groups did not alter the pattern of results obtained from the
group contrast analysis for the first peak seen in Fig. 3 (top panel).
However the pattern did change for the secondpeak (Fig. 3, bottom
panel), where the early and late-blind groups were significantly dif-
ferent from the sighted one, but were indistinguishable from each
other.
8/11/2019 Voice Perception in Blind Persons Gougoux Et Al 2009
http://slidepdf.com/reader/full/voice-perception-in-blind-persons-gougoux-et-al-2009 4/8
Please cite this article in press as: Gougoux, F., et al. Voice perception in blind persons: A functional magnetic resonance imaging study.
Neuropsychologia (2009), doi:10.1016/j.neuropsychologia.2009.06.027
ARTICLE IN PRESSG Model
NSY-3349; No.of Pages 8
4 F. Gougoux et al. / Neuropsychologia xxx (2009) xxx–xxx
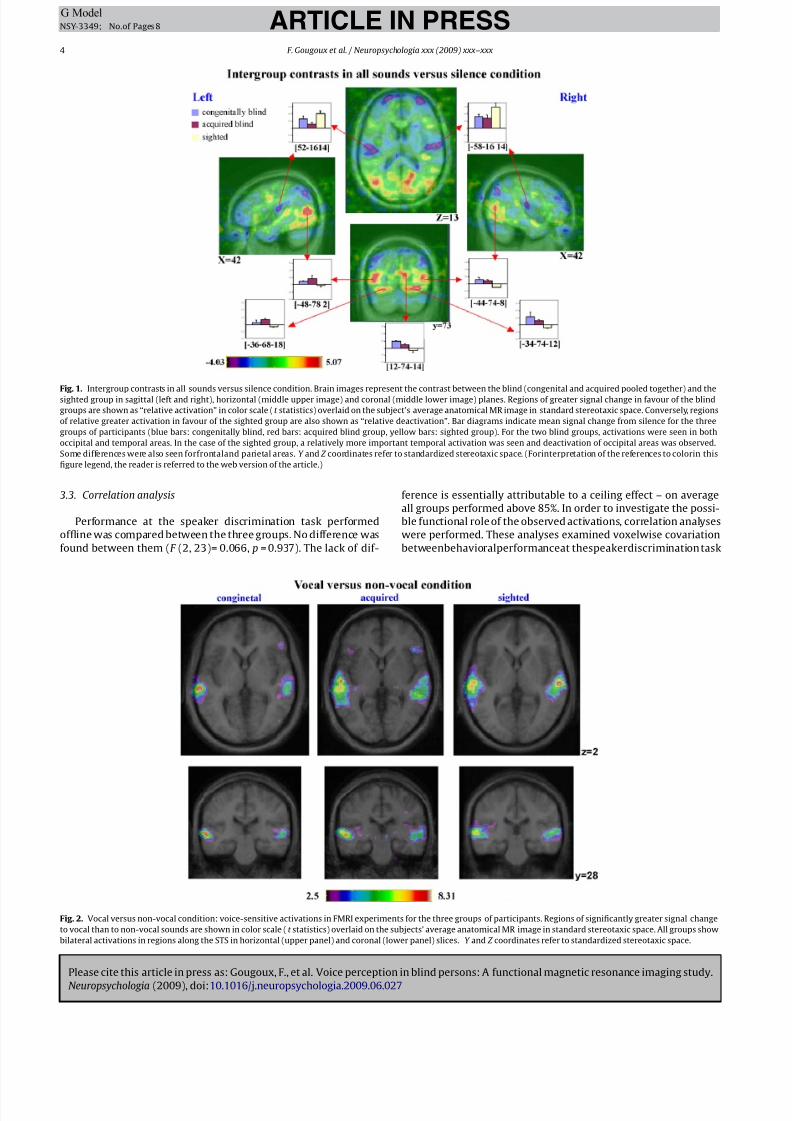
Fig. 1. Intergroup contrasts in all sounds versus silence condition. Brain images represent the contrast between the blind (congenital and acquired pooled together) and the
sighted group in sagittal (left and right), horizontal (middle upper image) and coronal (middle lower image) planes. Regions of greater signal change in favour of the blind
groups are shown as “relative activation” in color scale (t statistics) overlaid on the subject’s average anatomical MR image in standard stereotaxic space. Conversely, regions
of relative greater activation in favour of the sighted group are also shown as “relative deactivation”. Bar diagrams indicate mean signal change from silence for the three
groups of participants (blue bars: congenitally blind, red bars: acquired blind group, yellow bars: sighted group). For the two blind groups, activations were seen in both
occipital and temporal areas. In the case of the sighted group, a relatively more important temporal activation was seen and deactivation of occipital areas was observed.
Some differences were also seen forfrontaland parietal areas. Y and Z coordinates refer to standardized stereotaxic space. (Forinterpretation of the references to colorin this
figure legend, the reader is referred to the web version of the article.)
3.3. Correlation analysis
Performance at the speaker discrimination task performed
offline was compared between the three groups. No difference was
found between them (F (2, 23)= 0.066, p = 0.937). The lack of dif-
ference is essentially attributable to a ceiling effect – on average
all groups performed above 85%. In order to investigate the possi-
ble functional role of the observed activations, correlation analyses
were performed. These analyses examined voxelwise covariation
betweenbehavioralperformanceat thespeakerdiscrimination task
Fig. 2. Vocal versus non-vocal condition: voice-sensitive activations in FMRI experiments for the three groups of participants. Regions of significantly greater signal change
to vocal than to non-vocal sounds are shown in color scale (t statistics) overlaid on the subjects’ average anatomical MR image in standard stereotaxic space. All groups show
bilateral activations in regions along the STS in horizontal (upper panel) and coronal (lower panel) slices. Y and Z coordinates refer to standardized stereotaxic space.
8/11/2019 Voice Perception in Blind Persons Gougoux Et Al 2009
http://slidepdf.com/reader/full/voice-perception-in-blind-persons-gougoux-et-al-2009 5/8
Please cite this article in press as: Gougoux, F., et al. Voice perception in blind persons: A functional magnetic resonance imaging study.
Neuropsychologia (2009), doi:10.1016/j.neuropsychologia.2009.06.027
ARTICLE IN PRESSG Model
NSY-3349; No.of Pages 8
F. Gougoux et al. / Neuropsychologia xxx (2009) xxx–xxx 5
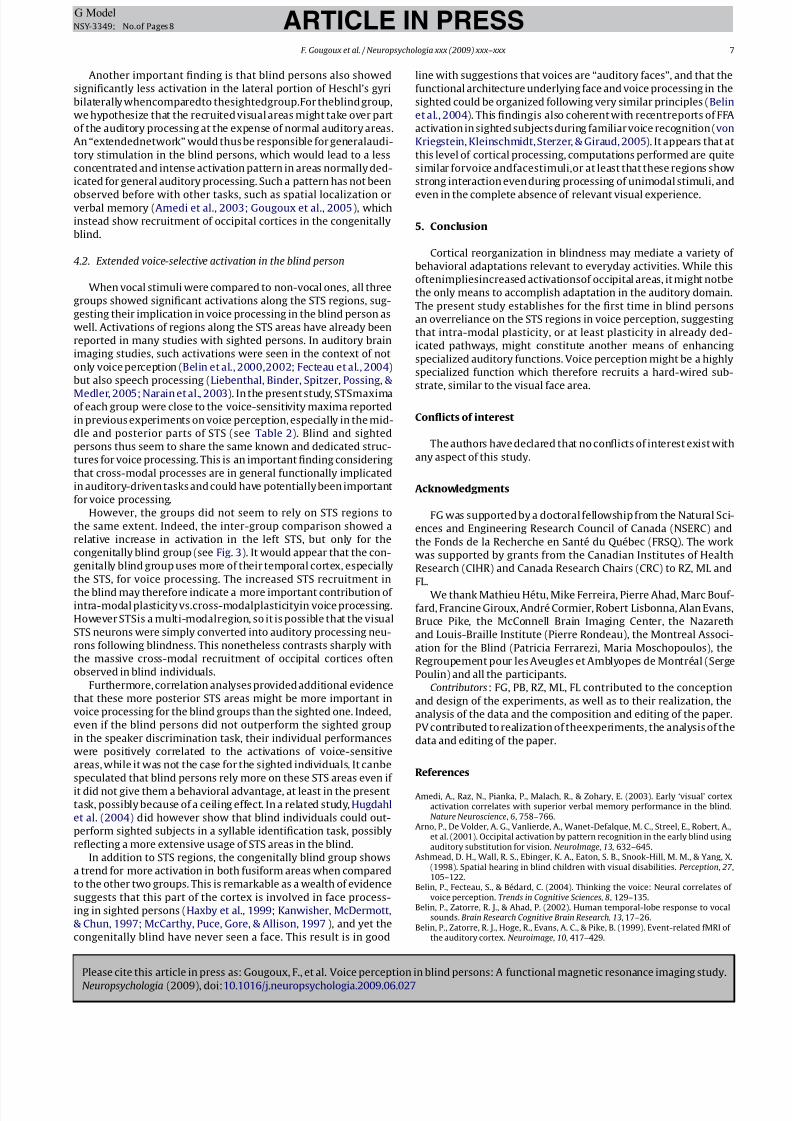
Table 2
Stereotaxic coordinates and t -values of activation and deactivation foci in occipital and temporal areas.
Groups/contrasts Areas x y z t-values
ALL vs. SIL comparison
ALL blind vs SIG Right Heschl gyrus, lateral portion 58 −16 14 −4.033
Left Heschl gyrus, lateral portion −52 −16 14 −3.319
Right lingual/inf occipital (BA 19) 34 −74 −12 5.026
Right V1 (BA 17) 12 −74 14 4.041
Right med occipital gyrus (BA 19) 44 −74 8 4.026
Left med occipital gyrus (BA 19) −
48 −
78 2 5.070Left lingual/inf occipital (BA 19) −36 −68 −18 4.168
VOC vs. NVO comparison
SIG Right STS (BA 22) 62 −22 2 8.351
Right STS (BA 22) 56 −38 8 6.130
Left STS (BA 22) −58 −20 0 7.427
Left STS (BA 22) −62 −34 4 6.771
ACQ Right STS (BA 21) 64 −12 −2 7.877
Right STS (BA 21) 54 −20 −6 6.914
Left STS (BA 22) −58 −20 2 7.624
Left STS (BA 21) −56 −32 0 7.548
CONG Right STS (BA 21) 60 −32 4 6.104
Left STS (BA 21) −64 −28 2 8.313
Left fusiform (BA 37) −46 −46 −16 4.843
CONG–SIG Right STS (BA 21) 60 −27 −2 3.286
Left STS (BA 21) −
62 −
30 −
2 5.259Right fusiform (BA 37) 34 −52 −16 3.795
Right lingual/inf occipital (BA 19) 36 −70 −16 3.498
Left fusiform (BA 37) −46 −48 −16 4.069
CON–ACQ Right ITG (BA 37) 50 −69 −2 3.562
Right STS (BA 21) 58 −33 4 2.777
Left STS (BA 21) −70 −34 −2 5.526
Left STS (BA 21) −64 −28 2 5.523
Right fusiform (BA 37) 34 −52 −16 3.444
Right lingual/inf occipital (BA 19) 35 −68 −20 2.777
Left fusiform (BA 37) −46 −48 −16 3.405
Covariation with behavioral measure (% correct) all blinds only: VOC vs. NVO comparison
Right STS (BA 21) 60 −44 2 4.812
Right STS (BA 21) 60 −12 −2 4.183
Left STS (BA 21) −55 −50 −2 2.787
Coordinates x, y and z refer to standardized stereotaxic space ( Talairach and Tournoux, 1988).
and BOLD signal in the VOC vs. NVO condition. Correlation results
for the blind subjects (the two groups pooled together) yielded two
foci in the right temporal areas, one in the central portion and one
in theposterior portion of theright STS (Fig.4 and Table 2). Correla-
tions between BOLD values (extracted from 5-mm radius spheres)
at the two locations and individual behavioral scores yielded high
values: the highest correlation peak was found in the right poste-
rior portion of STS (r = 0.86, p < 0.01) while the second one was in
the central portion of STS (r =0.48, p = 0.08). No significant peak
was found in left temporal areas but, once again, a trend was
observed (see Table 2). No significant correlation between acti-
vation and behavior, though, was observed in the sighted group.
Furthermore, there were no significant correlations between brain
activation and eitherthe age of onsetof blindnessor theduration of blindness.
4. Discussion
Several important findings emerged from the comparison of
brain activityin blind and sighted subjects during auditorystimula-
tion with natural vocal and non-vocal sounds of the environment.
First, when compared to silence, BOLD responses elicited by the
mix of natural sounds were notably found in occipital areas in the
blind, but not in sighted subjects, who instead showed BOLD signal
decreases in visual cortices. In marked contrast, activation of audi-
tory areas was significantlyless strong in theblindwhen compared
to sighted subjects. Second, when activations elicited by vocal and
non-vocal stimuli were compared, all groups showed the expected
recruitment of STS voice-sensitive regions, but the congenitally
blind subjects showed enhanced responses along left posterior STS,
whereas theydid not showrecruitment of occipital-lobe visual cor-
tex. Finally, it wasfound thatthe voice stimuli activated thefusiform
cortex bilaterally in the congenitally blind group (though slightly
under the threshold for statistical significance). Quite interestingly,
positive significant correlations between performance on a voice
discrimination task (performed offline) and activations in voice-
selective areas along the left posterior STS were observed for the
blind group; but not such correlation was observed in the sighted
group.
4.1. Recruitment of visual areas in blind persons
When a large variety of voices andnon-vocal sounds of different
sources were compared to silence, blind persons showed activa-
tions in many occipital areas, both striate and extra-striate. This
finding was not unexpected since several previous studies have
shown thatoccipital areas are recruitedfor various non-visual tasks
or conditions (fora review: Kujala, Alho, & Naatanen, 2000; Pascual-
Leone, Amedi, Fregni, & Merabet, 2005; Rauschecker, 1995). In
contrast, the sighted group showed a deactivation in these occipital
areas. In line with this, many previous studies have shown that fol-
lowing stimulation in one modality, cross-modal inhibition might
occur in the unattended modalities in sighted participants(Drzezga
et al., 2005; Gougoux et al., 2005; Haxby et al., 1994; Johnson &

8/11/2019 Voice Perception in Blind Persons Gougoux Et Al 2009
http://slidepdf.com/reader/full/voice-perception-in-blind-persons-gougoux-et-al-2009 6/8
Please cite this article in press as: Gougoux, F., et al. Voice perception in blind persons: A functional magnetic resonance imaging study.
Neuropsychologia (2009), doi:10.1016/j.neuropsychologia.2009.06.027
ARTICLE IN PRESSG Model
NSY-3349; No.of Pages 8
6 F. Gougoux et al. / Neuropsychologia xxx (2009) xxx–xxx
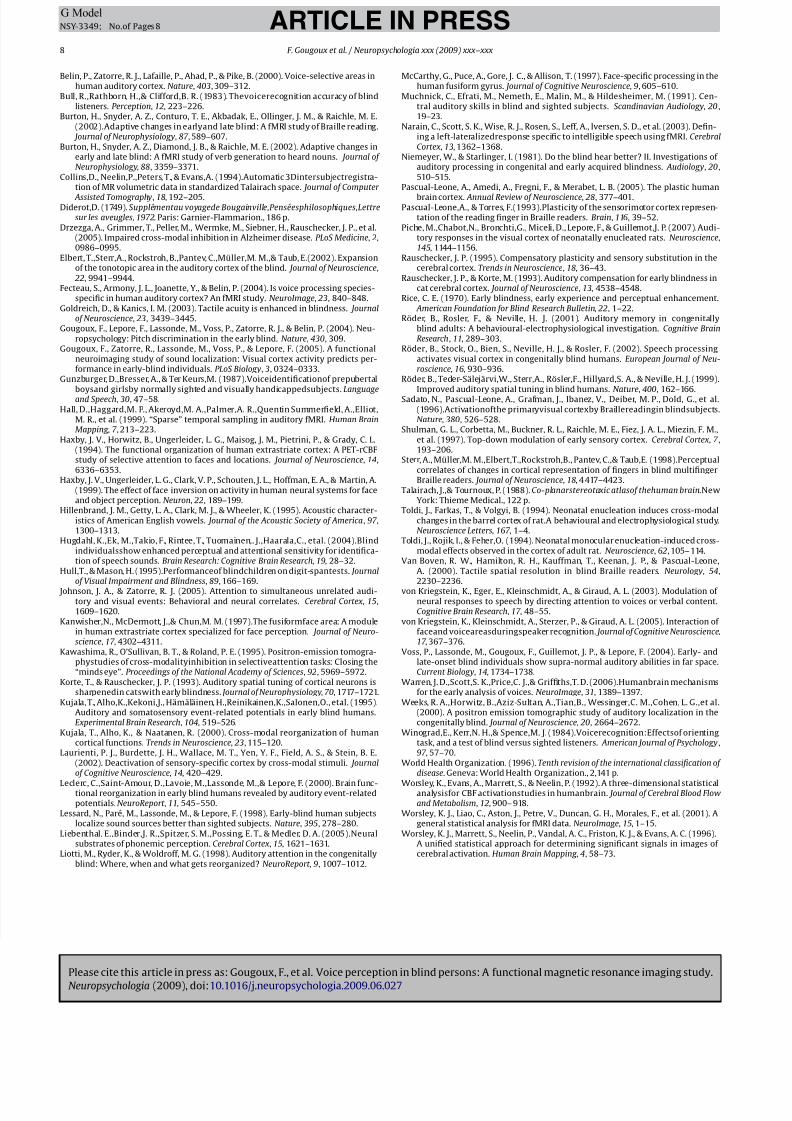
Fig. 3. Intergroup contrasts in vocal versus non-vocal condition. (A) Imaging results. Horizontal (left) and coronal (middle) images showing the congenitally blind group
compared to acquired blind group (upper panel) and sighted group (lower panel), respectively. These contrasts yielded the differences in region along the STS between the
congenitally blindgroup and thetwo other groups, especiallyon theleft side.Y and Z coordinates refer to standardized stereotaxic space. (B)Histograms.In theright section of
the figure, intergroup maxima are seenfor the vocalversus non-vocalcontrast between congenitally blindand acquiredgroup (upper panel) and sighted group(lowergroup),
respectively. Bars represent signal changes in percent (mean ± s.e.). Significant differences are seen between the congenitally blind groups and the two other groups. Blue
bars indicate the congenitally blind group, red bars indicate the acquired blind group while the yellow bars represent the sighted g roup. (For interpretation of the references
to color in this figure legend, the reader is referred to the web version of the article.)
Zatorre, 2005; Kawashima, O’Sullivan, & Roland, 1995; Laurienti
et al., 2002; Shulman et al., 1997). In addition, deactivation of the
primary visual areas in sighted persons coupled with activation of
these same areas in blind persons has been previously observed
(Gougoux et al., 2005; Sadato et al., 1996; Weeks et al., 2000).
The contrasting results between blind and sighted groups at the
occipital level might suggest a possible difference in cross-modal
inhibitory processes.
Fig. 4. Correlation analysis for vocalversus non-vocalcondition. These panels show the correlation analysis between performances in speaker discriminationtask (% correct)
and BOLD signal in a group of congenitally and acquired blind subjects. The two columns of brain images (left images, sagittal sections; middle images, horizontal sections)
illustrate the statistical map of the correlation which is significant for two regions along the STS. The red arrows in the sagittal slices indicate the focus selected for the
respective horizontal slices. The scatter grams show the individual values (effect size/individual baseline) extracted from these two regions. X and Z coordinates refer to
standardized stereotaxic space. (For interpretation of the references to color in this figure legend, the reader is referred to the web version of the article.)
8/11/2019 Voice Perception in Blind Persons Gougoux Et Al 2009
http://slidepdf.com/reader/full/voice-perception-in-blind-persons-gougoux-et-al-2009 7/8
Please cite this article in press as: Gougoux, F., et al. Voice perception in blind persons: A functional magnetic resonance imaging study.
Neuropsychologia (2009), doi:10.1016/j.neuropsychologia.2009.06.027
ARTICLE IN PRESSG Model
NSY-3349; No.of Pages 8
F. Gougoux et al. / Neuropsychologia xxx (2009) xxx–xxx 7
Another important finding is that blind persons also showed
significantly less activation in the lateral portion of Heschl’s gyri
bilaterally whencomparedto thesightedgroup.For theblind group,
we hypothesize that the recruited visual areas might take over part
of the auditory processing at the expense of normal auditory areas.
An “extendednetwork” would thus be responsible for generalaudi-
tory stimulation in the blind persons, which would lead to a less
concentrated and intense activation pattern in areas normally ded-
icated for general auditory processing. Such a pattern has not been
observed before with other tasks, such as spatial localization or
verbal memory (Amedi et al., 2003; Gougoux et al., 2005), which
instead show recruitment of occipital cortices in the congenitally
blind.
4.2. Extended voice-selective activation in the blind person
When vocal stimuli were compared to non-vocal ones, all three
groups showed significant activations along the STS regions, sug-
gesting their implication in voice processing in the blind person as
well. Activations of regions along the STS areas have already been
reported in many studies with sighted persons. In auditory brain
imaging studies, such activations were seen in the context of not
only voice perception (Belin et al., 2000,2002; Fecteau et al., 2004)
but also speech processing (Liebenthal, Binder, Spitzer, Possing, &Medler, 2005; Narain et al., 2003). In the present study, STSmaxima
of each group were close to the voice-sensitivity maxima reported
in previous experiments on voice perception, especially in the mid-
dle and posterior parts of STS (see Table 2). Blind and sighted
persons thus seem to share the same known and dedicated struc-
tures for voice processing. This is an important finding considering
that cross-modal processes are in general functionally implicated
in auditory-driven tasks and could have potentially been important
for voice processing.
However, the groups did not seem to rely on STS regions to
the same extent. Indeed, the inter-group comparison showed a
relative increase in activation in the left STS, but only for the
congenitally blind group (see Fig. 3). It would appear that the con-
genitally blind group uses more of their temporal cortex, especiallythe STS, for voice processing. The increased STS recruitment in
the blind may therefore indicate a more important contribution of
intra-modal plasticity vs.cross-modalplasticityin voice processing.
However STSis a multi-modalregion, so it is possible that the visual
STS neurons were simply converted into auditory processing neu-
rons following blindness. This nonetheless contrasts sharply with
the massive cross-modal recruitment of occipital cortices often
observed in blind individuals.
Furthermore, correlation analyses provided additional evidence
that these more posterior STS areas might be more important in
voice processing for the blind groups than the sighted one. Indeed,
even if the blind persons did not outperform the sighted group
in the speaker discrimination task, their individual performances
were positively correlated to the activations of voice-sensitiveareas, while it was not the case for the sighted individuals. It canbe
speculated that blind persons rely more on these STS areas even if
it did not give them a behavioral advantage, at least in the present
task, possibly because of a ceiling effect. In a related study, Hugdahl
et al. (2004) did however show that blind individuals could out-
perform sighted subjects in a syllable identification task, possibly
reflecting a more extensive usage of STS areas in the blind.
In addition to STS regions, the congenitally blind group shows
a trend for more activation in both fusiform areas when compared
to the other two groups. This is remarkable as a wealth of evidence
suggests that this part of the cortex is involved in face process-
ing in sighted persons (Haxby et al., 1999; Kanwisher, McDermott,
& Chun, 1997; McCarthy, Puce, Gore, & Allison, 1997), and yet the
congenitally blind have never seen a face. This result is in good
line with suggestions that voices are “auditory faces”, and that the
functional architecture underlying face and voice processing in the
sighted could be organized following very similar principles (Belin
et al., 2004). This findingis also coherent with recentreports of FFA
activation in sighted subjects during familiar voice recognition (von
Kriegstein, Kleinschmidt, Sterzer, & Giraud, 2005). It appears that at
this level of cortical processing, computations performed are quite
similar forvoice andfacestimuli,or at least that these regions show
strong interaction even during processing of unimodal stimuli, and
even in the complete absence of relevant visual experience.
5. Conclusion
Cortical reorganization in blindness may mediate a variety of
behavioral adaptations relevant to everyday activities. While this
oftenimpliesincreased activationsof occipital areas, it might notbe
the only means to accomplish adaptation in the auditory domain.
The present study establishes for the first time in blind persons
an overreliance on the STS regions in voice perception, suggesting
that intra-modal plasticity, or at least plasticity in already ded-
icated pathways, might constitute another means of enhancing
specialized auditory functions. Voice perception might be a highly
specialized function which therefore recruits a hard-wired sub-strate, similar to the visual face area.
Conflicts of interest
The authors have declared that no conflicts of interest exist with
any aspect of this study.
Acknowledgments
FG was supported by a doctoral fellowship from the Natural Sci-
ences and Engineering Research Council of Canada (NSERC) and
the Fonds de la Recherche en Santé du Québec (FRSQ). The work
was supported by grants from the Canadian Institutes of Health
Research (CIHR) and Canada Research Chairs (CRC) to RZ, ML andFL.
We thank Mathieu Hétu, Mike Ferreira, Pierre Ahad, Marc Bouf-
fard, Francine Giroux, André Cormier, Robert Lisbonna, Alan Evans,
Bruce Pike, the McConnell Brain Imaging Center, the Nazareth
and Louis-Braille Institute (Pierre Rondeau), the Montreal Associ-
ation for the Blind (Patricia Ferrarezi, Maria Moschopoulos), the
Regroupement pour les Aveugles et Amblyopes de Montréal (Serge
Poulin) and all the participants.
Contributors: FG, PB, RZ, ML, FL contributed to the conception
and design of the experiments, as well as to their realization, the
analysis of the data and the composition and editing of the paper.
PV contributed to realization of theexperiments, the analysis of the
data and editing of the paper.
References
Amedi, A., Raz, N., Pianka, P., Malach, R., & Zohary, E. (2003). Early ‘visual’ cortexactivation correlates with superior verbal memory performance in the blind.Nature Neuroscience, 6, 758–766.
Arno, P., De Volder, A. G., Vanlierde, A., Wanet-Defalque, M. C., Streel, E., Robert, A.,et al. (2001). Occipital activation by pattern recognition in the early blind usingauditory substitution for vision. NeuroImage, 13, 632–645.
Ashmead, D. H., Wall, R. S., Ebinger, K. A., Eaton, S. B., Snook-Hill, M. M., & Yang, X.(1998). Spatial hearing in blind children with visual disabilities. Perception, 27 ,105–122.
Belin, P., Fecteau, S., & Bédard, C. (2004). Thinking the voice: Neural correlates of voice perception. Trends in Cognitive Sciences, 8, 129–135.
Belin, P., Zatorre, R. J., & Ahad, P. (2002). Human temporal-lobe response to vocalsounds. Brain Research Cognitive Brain Research, 13, 17–26.
Belin, P., Zatorre, R. J., Hoge, R., Evans, A. C., & Pike, B. (1999). Event-related fMRI of
the auditory cortex. Neuroimage, 10, 417–429.
8/11/2019 Voice Perception in Blind Persons Gougoux Et Al 2009
http://slidepdf.com/reader/full/voice-perception-in-blind-persons-gougoux-et-al-2009 8/8
Please cite this article in press as: Gougoux, F., et al. Voice perception in blind persons: A functional magnetic resonance imaging study.
Neuropsychologia (2009) doi:10 1016/j neuropsychologia 2009 06 027
ARTICLE IN PRESSG Model
NSY-3349; No.of Pages 8
8 F. Gougoux et al. / Neuropsychologia xxx (2009) xxx–xxx
Belin, P., Zatorre, R. J., Lafaille, P., Ahad, P., & Pike, B. (2000). Voice-selective areas inhuman auditory cortex. Nature, 403, 309–312.
Bull, R.,Rathborn, H.,& Clifford,B. R. (1983). Thevoicerecognition accuracy of blindlisteners. Perception, 12, 223–226.
Burton, H., Snyder, A. Z., Conturo, T. E., Akbadak, E., Ollinger, J. M., & Raichle, M. E.(2002).Adaptive changes in earlyand late blind: A fMRI study of Braille reading.
Journal of Neurophysiology, 87 , 589–607.Burton, H., Snyder, A. Z., Diamond, J. B., & Raichle, M. E. (2002). Adaptive changes in
early and late blind: A fMRI study of verb generation to heard nouns. Journal of Neurophysiology, 88, 3359–3371.
Collins,D., Neelin,P.,Peters, T., & Evans,A. (1994).Automatic 3Dintersubjectregistra-
tion of MR volumetric data in standardized Talairach space. Journal of Computer Assisted Tomography, 18, 192–205.
Diderot,D. (1749). Supplémentau voyagede Bougainville,Penséesphilosophiques,Lettresur les aveugles, 1972. Paris: Garnier-Flammarion., 186 p.
Drzezga, A., Grimmer, T., Peller, M., Wermke, M., Siebner, H., Rauschecker, J. P., et al.(2005). Impaired cross-modal inhibition in Alzheimer disease. PLoS Medicine, 2,0986–0995.
Elbert, T.,Sterr,A., Rockstroh, B.,Pantev, C.,Müller,M. M.,& Taub, E.(2002). Expansionof the tonotopic area in the auditory cortex of the blind. Journal of Neuroscience,
22, 9941–9944.Fecteau, S., Armony, J. L., Joanette, Y., & Belin, P. (2004). Is voice processing species-
specific in human auditory cortex? An fMRI study. NeuroImage, 23, 840–848.Goldreich, D., & Kanics, I. M. (2003). Tactile acuity is enhanced in blindness. Journal
of Neuroscience, 23, 3439–3445.Gougoux, F., Lepore, F., Lassonde, M., Voss, P., Zatorre, R. J., & Belin, P. (2004). Neu-
ropsychology: Pitch discrimination in the early blind. Nature, 430, 309.Gougoux, F., Zatorre, R., Lassonde, M., Voss, P., & Lepore, F. (2005). A functional
neuroimaging study of sound localization: Visual cortex activity predicts per-formance in early-blind individuals. PLoS Biology, 3, 0324–0333.
Gunzburger, D.,Bresser, A., & Ter Keurs,M. (1987).Voiceidentificationof prepubertalboysand girlsby normally sighted and visually handicappedsubjects. Languageand Speech, 30, 47–58.
Hall, D.,Haggard,M. P., Akeroyd,M. A.,Palmer,A. R.,Quentin Summerfield, A.,Elliot,M. R., et al. (1999). “Sparse” temporal sampling in auditory fMRI. Human BrainMapping , 7 , 213–223.
Haxby, J. V., Horwitz, B., Ungerleider, L. G., Maisog, J. M., Pietrini, P., & Grady, C. L.(1994). The functional organization of human extrastriate cortex: A PET-rCBFstudy of selective attention to faces and locations. Journal of Neuroscience, 14,6336–6353.
Haxby, J. V., Ungerleider, L. G., Clark, V. P., Schouten, J. L., Hoffman, E. A., & Martin, A.(1999). The effect of face inversion on activity in human neural systems for faceand object perception. Neuron, 22, 189–199.
Hillenbrand, J. M., Getty, L. A., Clark, M. J., & Wheeler, K. (1995). Acoustic character-istics of American English vowels. Journal of the Acoustic Society of America, 97 ,1300–1313.
Hugdahl, K.,Ek, M.,Takio, F., Rintee, T., Tuomainen,. J.,Haarala,C., etal. (2004).Blindindividualsshow enhanced perceptual and attentional sensitivity for identifica-
tion of speech sounds. Brain Research: Cognitive Brain Research, 19, 28–32.Hull,T., & Mason, H. (1995).Performanceof blindchildren on digit-spantests. Journalof Visual Impairment and Blindness, 89, 166–169.
Johnson, J. A., & Zatorre, R. J. (2005). Attention to simultaneous unrelated audi-tory and visual events: Behavioral and neural correlates. Cerebral Cortex, 15,1609–1620.
Kanwisher,N., McDermott, J.,& Chun,M. M. (1997).The fusiformface area: A modulein human extrastriate cortex specialized for face perception. Journal of Neuro-science, 17 , 4302–4311.
Kawashima, R., O’Sullivan, B. T., & Roland, P. E. (1995). Positron-emission tomogra-phystudies of cross-modalityinhibition in selectiveattention tasks: Closing the“minds eye”. Proceedings of the National Academy of Sciences, 92, 5969–5972.
Korte, T., & Rauschecker, J. P. (1993). Auditory spatial tuning of cortical neurons issharpenedin catswith early blindness. Journal of Neurophysiology, 70, 1717–1721.
Kujala, T., Alho,K.,Kekoni,J., Hämäläinen, H.,Reinikainen,K.,Salonen,O., etal. (1995).Auditory and somatosensory event-related potentials in early blind humans.Experimental Brain Research, 104, 519–526.
Kujala, T., Alho, K., & Naatanen, R. (2000). Cross-modal reorganization of humancortical functions. Trends in Neuroscience, 23, 115–120.
Laurienti, P. J., Burdette, J. H., Wallace, M. T., Yen, Y. F., Field, A. S., & Stein, B. E.(2002). Deactivation of sensory-specific cortex by cross-modal stimuli. Journalof Cognitive Neuroscience, 14, 420–429.
Leclerc, C.,Saint-Amour, D.,Lavoie, M.,Lassonde, M.,& Lepore, F. (2000). Brain func-tional reorganization in early blind humans revealed by auditory event-relatedpotentials. NeuroReport , 11, 545–550.
Lessard, N., Paré, M., Lassonde, M., & Lepore, F. (1998). Early-blind human subjectslocalize sound sources better than sighted subjects. Nature, 395, 278–280.
Liebenthal, E.,Binder,J. R.,Spitzer, S. M.,Possing, E. T., & Medler, D. A. (2005).Neuralsubstrates of phonemic perception. Cerebral Cortex, 15, 1621–1631.
Liotti, M., Ryder, K., & Woldroff, M. G. (1998). Auditory attention in the congenitallyblind: Where, when and what gets reorganized? NeuroReport , 9, 1007–1012.
McCarthy, G., Puce, A., Gore, J. C., & Allison, T. (1997). Face-specific processing in thehuman fusiform gyrus. Journal of Cognitive Neuroscience, 9, 605–610.
Muchnick, C., Efrati, M., Nemeth, E., Malin, M., & Hildesheimer, M. (1991). Cen-tral auditory skills in blind and sighted subjects. Scandinavian Audiology, 20 ,19–23.
Narain, C., Scott, S. K., Wise, R. J., Rosen, S., Leff, A., Iversen, S. D., et al. (2003). Defin-ing a left-lateralizedresponse specific to intelligible speech using fMRI. CerebralCortex, 13, 1362–1368.
Niemeyer, W., & Starlinger, I. (1981). Do the blind hear better? II. Investigations of auditory processing in congenital and early acquired blindness. Audiology, 20,510–515.
Pascual-Leone, A., Amedi, A., Fregni, F., & Merabet, L. B. (2005). The plastic humanbrain cortex. Annual Review of Neuroscience, 28, 377–401.
Pascual-Leone,A., & Torres, F.(1993).Plasticity of the sensorimotor cortex represen-tation of the reading finger in Braille readers. Brain, 116, 39–52.
Piche, M.,Chabot,N., Bronchti,G., Miceli, D., Lepore, F., & Guillemot,J. P. (2007). Audi-tory responses in the visual cortex of neonatally enucleated rats. Neuroscience,145, 1144–1156.
Rauschecker, J. P. (1995). Compensatory plasticity and sensory substitution in thecerebral cortex. Trends in Neuroscience, 18, 36–43.
Rauschecker, J. P., & Korte, M. (1993). Auditory compensation for early blindness incat cerebral cortex. Journal of Neuroscience, 13, 4538–4548.
Rice, C. E. (1970). Early blindness, early experience and perceptual enhancement. American Foundation for Blind Research Bulletin, 22, 1–22.
Röder, B., Rosler, F., & Neville, H. J. (2001). Auditory memory in congenitallyblind adults: A behavioural-electrophysiological investigation. Cognitive BrainResearch, 11, 289–303.
Röder, B., Stock, O., Bien, S., Neville, H. J., & Rosler, F. (2002). Speech processingactivates visual cortex in congenitally blind humans. European Journal of Neu-roscience, 16, 930–936.
Röder, B., Teder-Sälejärvi,W., Sterr,A., Rösler,F., Hillyard,S. A., & Neville, H. J. (1999).Improved auditory spatial tuning in blind humans. Nature, 400, 162–166.
Sadato, N., Pascual-Leone, A., Grafman, J., Ibanez, V., Deiber, M. P., Dold, G., et al.(1996).Activationofthe primaryvisual cortexby Braillereadingin blindsubjects.Nature, 380, 526–528.
Shulman, G. L., Corbetta, M., Buckner, R. L., Raichle, M. E., Fiez, J. A. L., Miezin, F. M.,et al. (1997). Top-down modulation of early sensory cortex. Cerebral Cortex, 7 ,193–206.
Sterr, A., Müller,M. M.,Elbert,T.,Rockstroh,B., Pantev, C.,& Taub,E. (1998).Perceptualcorrelates of changes in cortical representation of fingers in blind multifingerBraille readers. Journal of Neuroscience, 18, 4 417–4423.
Talairach, J.,& Tournoux, P. (1988). Co-planarstereotaxic atlasof thehuman brain.NewYork: Thieme Medical., 122 p.
Toldi, J., Farkas, T., & Volgyi, B. (1994). Neonatal enucleation induces cross-modalchanges in the barrel cortex of rat.A behavioural and electrophysiological study.Neuroscience Letters, 167 , 1–4.
Toldi, J., Rojik, I., & Feher,O. (1994). Neonatal monocular enucleation-induced cross-modal effects observed in the cortex of adult rat. Neuroscience, 62, 105–114.
Van Boven, R. W., Hamilton, R. H., Kauffman, T., Keenan, J. P., & Pascual-Leone,A. (2000). Tactile spatial resolution in blind Braille readers. Neurology, 54,2230–2236.
von Kriegstein, K., Eger, E., Kleinschmidt, A., & Giraud, A. L. (2003). Modulation of neural responses to speech by directing attention to voices or verbal content.Cognitive Brain Research, 17 , 48–55.
von Kriegstein, K., Kleinschmidt, A., Sterzer, P., & Giraud, A. L. (2005). Interaction of faceand voiceareasduringspeaker recognition. Journal of Cognitive Neuroscience,17 , 367–376.
Voss, P., Lassonde, M., Gougoux, F., Guillemot, J. P., & Lepore, F. (2004). Early- andlate-onset blind individuals show supra-normal auditory abilities in far space.Current Biology, 14, 1734–1738.
Warren, J. D.,Scott,S. K.,Price,C. J.,& Griffiths,T. D. (2006).Humanbrain mechanismsfor the early analysis of voices. NeuroImage, 31, 1389–1397.
Weeks, R. A.,Horwitz, B.,Aziz-Sultan, A.,Tian,B., Wessinger,C. M.,Cohen, L. G.,et al.(2000). A positron emission tomographic study of auditory localization in thecongenitally blind. Journal of Neuroscience, 20, 2664–2672.
Winograd,E., Kerr,N. H.,& Spence,M. J. (1984).Voicerecognition:Effectsof orientingtask, and a test of blind versus sighted listeners. American Journal of Psychology,
97 , 57–70.World Health Organization. (1996). Tenth revision of the international classification of
disease. Geneva: World Health Organization., 2,141 p.Worsley, K., Evans, A., Marrett, S., & Neelin, P. (1992). A three-dimensional statistical
analysisfor CBF activationstudies in humanbrain. Journal of Cerebral Blood Flowand Metabolism, 12, 900– 918.
Worsley, K. J., Liao, C., Aston, J., Petre, V., Duncan, G. H., Morales, F., et al. (2001). Ageneral statistical analysis for fMRI data. NeuroImage, 15, 1–15.
Worsley, K. J., Marrett, S., Neelin, P., Vandal, A. C., Friston, K. J., & Evans, A. C. (1996).A unified statistical approach for determining significant signals in images of cerebral activation. Human Brain Mapping , 4, 58–73.