Voice and Sight Tag Program and Leash Regulations on … and Sight Tag Program and Leash Regulations...
100
Voice and Sight Tag Program and Leash Regulations on Open Space and Mountain Parks Lands Baseline Conditions Monitoring Report Prepared by: Deonne VanderWoude, Human Dimensions Program Coordinator and Ellyn Bitume, Visitor Use Technician June 2015
Transcript of Voice and Sight Tag Program and Leash Regulations on … and Sight Tag Program and Leash Regulations...

Voice and Sight Tag Program and Leash Regulations on
Open Space and Mountain Parks Lands
Baseline Conditions Monitoring Report
Prepared by:
Deonne VanderWoude, Human Dimensions Program Coordinator
and
Ellyn Bitume, Visitor Use Technician
June 2015

ii | P a g e
Voice and Sight Tag Program and Leash Regulations
on Open Space and Mountain Parks Lands
Monitoring Report
Prepared by:
Deonne VanderWoude, Human Dimensions Program Coordinator and
Ellyn Bitume, Visitor Use Technician
City of Boulder
Open Space and Mountain Parks Department
Boulder, Colorado
June 2015
Cover photograph: Typical leash interview set-up.
Suggested Citation:
VanderWoude, D. and Bitume, E. (2015). Voice and Sight Tag Program and Leash Regulations
on Open Space and Mountain Parks Lands Monitoring Report. The City of Boulder, Department
of Open Space and Mountain Parks. Boulder, Colorado.

Table of Contents
iii | P a g e
Table of Contents Pg. Table of Contents ……………………………………………………………………………. iii
List of Tables ………………………………………………………………………………... v
List of Figures ……………………………………………………………………………….. vi
Executive Summary …………………………………………………………………………. viii
Acknowledgements ………………………………………………………………………….. xii
Introduction ………………………………………………………………………………….. 1
Tag Program monitoring background ……………………………………………….. 1
Tag Program and leash regulation monitoring purpose ……………………………... 1
Goals and objective …………………….………………………………………...….. 1
Guidance from Visitor Master Plan...………………………………………………... 2
Methods ……………………………………………………………………………………… 3
Study area ……………………………………………………………………..……... 4
Preparation for data collection ………………………………………………………. 5
General methods …………………………………………………………………….. 5
Field methods ……………………………………………………………….……….. 8
GIS digitizing methods-mapping sites……………………………………………….. 9
Quality control procedures………………………………………………………….... 9
Monitoring design rationale and suggested limitations……………………………… 11
Results………………………………………………………………………………………... 12
Generalizing to OSMP Dog Guardian Population…………………………………… 12
Voice and Sight Regulations component……………………………………………. 12
Leash Interview component…………………………………………………………. 23
Leash Required component………………………………………………………….. 29
Discussion…………………………………………………………………………………… 34

Table of Contents
iv | P a g e
Baseline conditions………...………………………………………………………… 34
Potential barriers to regulation compliance ………..……………………….………. 36
Standard setting…………...………………………………………………….………. 37
Perception of effects…………………………………………………………………. 37
Management suggestions…………………………………………………………….. 38
Recommendations…………………………………………………………………….……… 39
Further develop decision-making strategies for dog management………………..…. 39
Implement strategies to maximize visitor compliance with dog regulations……….... 39
Increase dog guardians’ voice control skills …………………………........................ 40
Re-test observer variability and review the methods during each data collection
interval ………………………………………………………………………………. 40
Refine analysis techniques and database structure……….………………….………. 40
Consider developing new dog monitoring indicators related to ecological health and
visitor quality……….…………………..……………………….…………………… 41
Consider developing new dog monitoring indicators related to understanding the
benefits of recreating with dogs...………………………….…….…………………... 42
Conduct a study aimed at understanding barriers to compliance with regulations on
OSMP…………………………………….………….………………………………. 42
Consider communication recommendations from published literature…………..…. 42
References Cited………...………………………….……………………………………..…. 44
Appendices …………………………………………………………………………………... 49
Appendix A. Management strategies and actions for dog management by
management area designation………………………………………………………... 49
Appendix B. Glossary of terms...……………………………………………..……... 50
Appendix C. 2014 study area map ………………………………………....……….. 52
Appendix D. List of monitoring sites included in 2014 sampling frame listed by
Trail Study Area………………………..…..…………………............................ 53

Table of Contents
v | P a g e
Appendix E. OSMP management area designations summer 2014………………… 62
Appendix F. OSMP Trail Study Areas summer 2014……….…………………..….. 63
Appendix G. Photo map example ……………………………………..……………. 64
Appendix H. Voice and Sight datasheets and codes ………………………...……… 65
Appendix I. Leash Interview datasheet …………...………………………………… 71
Appendix J. Leash Required datasheet …………...………………………....…...… 72
Appendix K. Rationale for 2014-2018 Monitoring Design ………………………… 73
Appendix L. Suggested limitations………………………………………...…...…… 75
Appendix M. Compliance results at the event level …………..……………....…….. 77
Appendix N. Confidence interval calculation methods and results …………..…….. 80
Appendix O. Examples of social science theory constructs which could be used to
better understand off-leash dog guardians …………………………...……………… 82
List of Tables
Pg.
Table 1. Comparison of data collected during 2006-2010 and 2014 monitoring of Tag
Program and excrement regulations ….…………………………………….......….... 3
Table 2: Description of each B.R.C. code and number of offences collected during the
monitoring period……………………………………………………………………. 8
Table 3. Total number of off-leash dogs by visitor party for the Voice and Sight
component……………………………………………………………………………. 14
Table 4. Overall Tag Program compliance rates for the years 2006, 2007, 2010, and
2014……………..…………………………………………………………….…….... 15
Table 5. Overall Tag Program compliance rates for the years 2006, 2007, 2010, and 2014
(normalized without unsures)..………………………..…………………….…….... 15
Table 6. Yearly comparison of tag display breakdown by visitor party for off-leash dogs for
the Voice and Sight component ……………………………………………………... 17
Table 7. Statistical comparisons between years for tag display for the Voice and Sight
component …………………………………………………………………………. 17
Table 8. Yearly comparison of compliance with the out of sight regulation at the visitor 18

Table of Contents
vi | P a g e
party level……………………………………………………………………...…....
Table 9. Statistical comparisons between years for the out of sight regulation ……………… 18
Table 10. Number, type of event and compliance outcome for events involving other
visitors reported at the visitor party level………..…................................................... 19
Table 11. Number, type of event and compliance outcome for events involving other
dogs reported at the visitor party level………………………………………..…….... 19
Table 12. Number, type of event and compliance outcome for events involving
wildlife/livestock reported at the visitor party level…………………...…….…….... 20
Table 13. Number, type of event and compliance outcome for V/S command events
collapsed at the visitor party level for each type of event ………….……….…….... 20
Table 14. Yearly comparison of excrement removal by visitor party for only off-leash
dogs.….……………………………………………………………………….…….... 22
Table 15. Statistical comparisons between years for excrement removal……..…………….. 23
Table 16. Comparison of 2006 and 2014 Leash Interview Data….………………….…….... 28
Table 17. Results of comparison between years for leash possession for the Leash Interview
component…...……………………………………………………………...…….... 29
Table 18: Number of charges issued by OSMP Rangers and accompanying B.R.C. code
during the monitoring period (May 1 2014 - July 31 2014)…………………………. 33
List of Figures
Pg.
Figure 1. Leash interview sign-i-cade ………………………………………………………... 9
Figure 2. Dog tags commonly found in Boulder Colorado ……………………………...….. 10
Figure 3. The number of sessions and visitor parties broken down by attribute
for the Voice and Sight component.……………………………………………….... 13
Figure 4. Number of visitor parties by activity for the Voice and Sight component……......... 14
Figure 5. Number of visitor parties and dogs by tag display for the Voice and Sight
component …………………………………………………………………..……… 16
Figure 6. Excrement removal status by visitor party broken down by visitor party action ...... 22
Figure 7. Number of sessions and visitor parties broken down by attribute for the Leash 24

Table of Contents
vii | P a g e
Interview component ……………………………………………………………….
Figure 8. Number of visitor parties by activity for the Leash Interview Component………… 25
Figure 9. Number of visitor parties by number of dogs in party for the Leash Interview
component………………………………………………………............................... 26
Figure 10. Number of dogs and visitor parties by leash presence for the Leash Interview
component…………………………………………................................................. 27
Figure 11. Number of visitor parties and dogs by tag display for the Leash Interview
component…..……………………………………................................................... 28
Figure 12. Number of sessions and visitor parties broken down by attribute for the Leash
Required component……………………………………………………………….. 30
Figure 13. Number of visitor parties by activity for the Leash Required component………… 31
Figure 14. Number of visitor parties and dogs broken down by leash category for the Leash
Required component.………………………............................................................. 32
Figure 15. Tag display by leash status and visitor party and dog number for the Leash
Required component…………………………………….......................................... 33
Figure 16. Social norm curve applied to the number of unpleasant dog encounters within
one visitor trip…………………………………………………………………… 41

Executive Summary
viii | P a g e
The Voice and Sight Dog Tag Program (Tag Program) is a management strategy within the
Education and Outreach, Safety and Enforcement, Recreation Opportunities and User Conflict
Reduction Initiatives of the Visitor Master Plan (City of Boulder 2005). Under the Tag Program,
launched in the summer of 2006, visitors wishing to manage their dog(s) off-leash and under
voice and sight control are required to have a voice and sight tag visibly displayed on their dogs.
From 2006 through 2014 the process of obtaining a voice and sight tag required an applicant to
view a video describing the requirements of voice and sight control, acknowledge understanding
of those requirements, pay a fee and complete a registration form. Beginning in January 2015,
participants are also required to attend an hour-long in-person Tag Program training session.
Dog guardians not registered in the program or who do not have a voice and sight tag visibly
displayed on their dog are required to keep their dog on-leash while visiting Open Space and
Mountain Parks (OSMP) and other City of Boulder properties where voice and sight control is an
option.
Previous monitoring conducted before (2006), immediately after (2007) and almost four years
after (2010) the program’s launch, as well as other sources of information, indicated that the
program achieved some but not all of the original objectives (City of Boulder 2011). In 2011,
OSMP was directed by Boulder City Council to evaluate and recommend revisions to the Tag
Program. In collaboration with the public and appointed advisors, OSMP has developed a
number of Tag Program enhancements designed to improve the program and increase
understanding of and compliance with Tag Program requirements. The current monitoring
project is scheduled to be conducted before (“baseline”), soon after and three years after
implementing Tag Program enhancements to gain an understanding of any measurable change in
observed behaviors.
During development of the 2014 protocol, staff determined that repeating the previous methods
would not meet current project needs, and a new methodology was created based upon a
literature review, public and Open Space Board of Trustees input, professional peer review and
professional judgment.
Dog management success is important to maintain quality visitor experiences and for the
protection of resources. By the end of the summer of 2010, over 25,000 participants had
registered in the Tag Program (City of Boulder 2011) and OSMP receives about 2 million annual
dog visits (on and off-leash) (Vaske et al. 2009).
Because the 2006-2010 and 2014 monitoring projects were conducted with
different methodologies, only limited attempts will be made to quantitatively
compare each interval of tag program monitoring.

Executive Summary
ix | P a g e
The overall goals of the enhanced Tag Program are to:
Increase the proportion of dog guardians visiting OSMP who have control over their
dogs as required by applicable regulations, including proof of current dog rabies
vaccinations;
Maintain a safe, high-quality visitor experience for all; and
Contribute to natural resource conservation.
The Tag Program enhancements project’s objective relevant to this monitoring study is to:
Increase compliance with observed dog regulations and voice and sight control rules.
Methods
Data for this project were collected on trails with designated dog access across OSMP from
May-July 2014. There were 64 locations allocated as both Voice and Sight and Leash Interview
component sites, 13 as Voice and Sight only sites, 17 as Leash Interview only sites and 34 as
Leash Required sites.
The Voice and Sight Regulations component of the monitoring was an observational study
designed to evaluate dog guardian compliance with observable aspects of specific dog
regulations from the voice and sight ordinances. During field monitoring, data was collected to
describe visitor party attributes, dog behaviors and guardian responses. Observations were
categorized as “pass” events where no dog behaviors were recorded, “interaction” events where
the dog under observation exhibited a behavior toward another person, dog, wildlife or livestock
and as “other” events describing situations where the dog was out of sight and/or the guardian
issued a command and where these observations were not associated with a pass or interaction
event. The resulting descriptive data were evaluated and interpreted using the collected
information for each party. The use of these data provided context for each party’s recorded
behaviors and interactions. Evaluation and interpretation was conducted by the monitoring staff
for objective indicators such as the number of dogs per guardian or visible tag display. For the
more subjective indicators such as charging/chasing wildlife or voice control, project
management and ranger staff also participated in determining a final compliance outcome for
each visitor party.
The Leash Interview component of the monitoring was a visitor interview administered to
visitor parties with at least one dog off-leash and without a leash visible to the observer for each
off-leash dog. During the interview, each guardian was asked to demonstrate that the guardian
possessed a leash for each dog they were managing under voice and sight control.
Additional measures of dog regulation compliance
Two additional measures of dog regulation compliance not specific to the Tag Program were
monitored during the study period. These two additional components included dog excrement
removal and leash compliance on both year-round and seasonal leash-required trails. These
measures were added to this project based upon direction received from the Open Space Board
of Trustees (OSBT) and project team staff.

Executive Summary
x | P a g e
The Dog Excrement component was an observational study designed to evaluate dog
guardian compliance with dog excrement pickup and removal regulations. This
component was executed simultaneously with the Voice and Sight component.
The Leash Required component was an observational study designed to evaluate dog
guardian compliance with seasonal and year-round leash laws on OSMP leash-required
trails.
Major Findings
Compliance rates for most individually measured attributes and indicators were >70% during
baseline (i.e., 2014) monitoring, and overall compliance was 67% (details below). Categories
with lower compliance rates were:
More than 2 dogs off-leash per guardian (12%);
Excrement pickup (69%); and
Interactions with wildlife/livestock (50%).
Baseline conditions as characterized during this project along with the results from the two
additional monitoring periods (2016, 2018) will inform future discussions about ranges of
acceptable compliance rates and associated standards for future dog regulations along with
associated compliance studies.
Voice and Sight Regulations
During monitoring of the Voice and Sight Regulations component, 310 visitor parties were
observed. The overall compliance rate was 67%. Individual compliance results, estimated at
the visitor party level, include:
Tag display: 69%
Within sight: 93%
No more than 2 dogs per guardian off-leash (8 total visitor parties observed with
more than 2 dogs per guardian; 7 parties had more than 2 dogs per guardian
off-leash): 12%
Voice control: 77%
Charging, chasing or otherwise displaying aggression toward any person or behave
toward any person in a manner that a reasonable person would find harassing or
disturbing:
o Including passes (i.e., dog passes by person without interaction) and interactions
(i.e., dog and person interact): 92%
o Including interactions only: 70%
Charging, chasing or otherwise displaying aggression toward any dog:
o Including passes and interactions: 87%
o Including interactions only: 81%
Chasing, harassing or disturbing wildlife or livestock:
o Including passes and interactions: 50%
o Including interactions only: 29%

Executive Summary
xi | P a g e
Detailed methods for calculating compliance rates at the visitor party level as well as the event
level for voice control and the three types of charging are included in the results section of this
report.
Leash Interviews
During the Leash Interview component, 302 visitor parties were observed and/or interviewed.
Close to 91% of visitor parties observed and/or interviewed had a leash for each dog being
managed under voice and sight control. The majority of those parties in compliance with the
leash possession regulation had the correct number of leashes visible to the observer (205 visitor
parties) and these parties were not contacted for an interview. Ninety-seven visitor parties were
contacted for an interview and of these, 70 had the correct number of leashes with them, 13
parties did not and 14 parties had unknown leash possession status because they did not stop
and/or stopped but refused participation.
Dog Excrement
The 2014 project included numerous new sampling sites, the majority of which were located
beyond the trailhead area. Because of this change, and the possibility that dogs are more likely
to relieve themselves near the start of the trail, we anticipated observing fewer events than during
the previous project (n ranged from 100-188 during 2006-2010). As expected, we observed
fewer dogs defecating. Of the 26 visitor parties observed with one or more such events, 18
parties (69%) both picked up and took the bag with them. Eight parties (31%) did not meet the
requirements due to not picking up, or picking up and then leaving the bag on the side of the
trail.
Leash Required
Staff observed 238 visitor parties during observation for the Leash Required component. Of
these, 195 parties had all of their dogs leashed (82% compliance).
Recommendations
Recommendations for increasing compliance and improving project management include:
1. Further develop decision-making strategies for dog management.
2. Implement strategies to maximize visitor compliance with dog regulations.
3. Increase dog guardians’ voice control skills.
4. Re-test observer variability and review the methods during each data collection interval.
5. Refine analysis techniques and database structure.
6. Consider developing new dog monitoring indicators related to ecological health and
visitor experience quality.
7. Consider developing new dog monitoring indicators and studies related to understanding
the benefits of recreating with dogs.
8. Conduct a study aimed at understanding barriers to compliance with dog regulations on
OSMP.
9. Consider communication recommendations from published literature.
Acknowledgements
xii | P a g e
This report represents the collective work of the Monitoring Group with support from the
Resource Information Systems work group within the City of Boulder Open Space and Mountain
Parks (OSMP) Department. Steve Armstead, Mark Gershman, Ann Lezberg, Joe Reale, Ruth
Magtanong, Charlie Philbrick, Deonne VanderWoude and external peer reviewers contributed to
project protocols. The final 2014 protocol, written by Deonne VanderWoude and Ruth
Magtanong, and the final 2006-2010 Tag Program monitoring report, were used extensively in
writing this report. Ann Lezberg, Deonne VanderWoude, Ellyn Bitume, Ruth Magtanong and
Bryce Limón collected field data for this project. Jen Sherry provided database support and
management and Kathy Metivier provided GPS and mapping support and management. Brian
Anacker contributed to confidence interval calculations. Deonne VanderWoude provided
day-to-day project management and Mark Gershman was the overall project supervisor. There
were also numerous internal contributors and reviewers of the report.

Introduction
1 | P a g e
City of Boulder
Open Space and Mountain Parks
Visitor Master Plan Monitoring
Tag Program and Leash Regulations
Report of 2014 Baseline Conditions
1.0 Introduction
1.1. Tag Program monitoring background
Previous monitoring conducted before (2006), immediately after (2007) and almost four years
after (2010) the voice and sight tag program launch indicated that the program achieved some
but not all of the original objectives (City of Boulder 2011). Selected results of the previous
project include:
OSMP increased voice and sight control outreach to visitors and some visitors reported
an improved understanding of the voice and sight rules because of the program.
OSMP observed an increase in compliance with some components of voice and sight
rules.
OSMP did not detect any increase in dog guardians’ ability to use voice control following
implementation of the program.
During 2006-2010, OSMP also measured compliance with dog excrement removal rules.
Compliance with these rules ranged from 46% to 63% during the previous 4-year study period.
1.2. Tag Program and leash regulation monitoring purpose
In 2011 OSMP was directed by Boulder City Council to evaluate and recommend revisions to
the Tag Program. In collaboration with the public and appointed advisors, OSMP has developed
a number of Tag Program enhancements designed to improve the program and increase
understanding of and compliance with Tag Program requirements. The current monitoring
project is scheduled to be conducted before (2014), soon after (2016), and three years after
(2018) implementing Tag Program enhancements (early 2015) to gain an understanding of any
measurable change in observed characteristics and behaviors.
1.3. Goals and objective
The overall goals of the enhanced Tag Program are to:
Increase the proportion of dog guardians visiting OSMP who have control over their
dogs as required by applicable regulations, including proof of current dog rabies
vaccinations;
Maintain a safe, high-quality visitor experience for all; and
Contribute to natural resource conservation.

Introduction
2 | P a g e
The Tag Program enhancements project objective relevant to this monitoring study is:
Increase compliance with observed dog regulations and voice and sight control rules.
1.4. Guidance from Visitor Master Plan
The Voice and Sight Dog Tag Program (Tag Program) is a management strategy within the
Education and Outreach, Safety and Enforcement, Recreation Opportunities and User Conflict
Reduction Initiatives of the Visitor Master Plan (City of Boulder 2005). Under the Tag Program,
launched in the summer of 2006, visitors wishing to manage dogs off-leash and under voice and
sight control were required to have a voice and sight tag visibly displayed on their dogs and
comply with all other program requirements.
The 2005 VMP outlined monitoring measures associated with dog management on OMSP (City
of Boulder 2005 p. 59, 63, 64). These monitoring measures are included in the Safety and
Enforcement, Resource Protection and the User Conflict Reduction initiatives of the VMP. All
measures initially had a proposed standard of 90% visitor compliance. This and previous studies
are meant to better inform decision making as staff no longer proposes to use the 90% standard
when interpreting dog monitoring projects. Additionally, high levels of uncertainty involved in
the management of visitor use and natural resources often leads to approaches that receive major
revision. Many times the most effective strategies must be discovered through the feedback
loops of repeated monitoring and modification; an approach called adaptive management. “An
adaptive and cautious approach considers changing circumstances, creates opportunities to
incorporate new information and evaluate unanticipated outcomes and minimizes the likelihood
of irreversible environmental impacts” (City of Boulder 2005 p. 35).
While potential dog management actions will be implemented through Trail Study Area (TSA)
processes and plans, strategies associated with the OSMP management area designation will
guide dog management decisions (City of Boulder 2005, p. 48-50) (Appendix A). The VMP
established the four management area designations (Passive Recreation Areas, Natural Areas,
Agricultural Areas, and Habitat Conservation Areas) based upon characteristics of visitation and
resource status, and describes general management objectives for each. Management strategies
for dog management range from voice and sight control with off-trail opportunities (maximum
access) to dogs prohibited (no access). Typically, Passive Recreation Areas have the greatest
amount of access for dogs/guardians and Habitat Conservation Areas have the least access.

Methods
3 | P a g e
2.0 Methods
The 2014 monitoring methods are as similar to the 2006-2010 methods as possible. Because
some new components were added, some previously observed behaviors were removed and
some definitions were changed, these respective methods have been modified. Table 1 provides
an example of the similarity in the methods between the two study periods.
Table 1. Comparison of data collected during 2006-2010 and 2014 monitoring of
Tag Program and excrement regulations
Collected Data Type 2006-2010 2014
Work shift attributes (location, time, weather, etc.) Yes Yes
Visitor party demographics Yes Yes
Tag display Yes1 Yes
Number of dogs off-leash per visitor party Yes Yes
Dog behaviors Yes2 Yes
Guardian attempts to manage dog Yes3 Yes
Others present (people, dogs, wildlife or livestock) Yes4 Yes
Others present behaviors/dog interactions Yes5 Yes
Excrement pickup and removal Yes Yes
Dog out of sight Yes Yes
Visitor party travelled off-trail Yes Yes
Dog “passes” of others (no interaction occurred) Yes6 Yes
Visitor party travelled on undesignated trail Yes No
Guardian and/or dog entered a closure area No Yes
1 Collected only in 2007 and 2010 post Tag Program launch
2 Behavior codes and definitions were revised in 2014
3 Recording of guardian attempts to manage a dog was revised in 2014
4 Livestock was not recorded in 2010; modified in 2014
5 Recording of interactions between dogs and others was revised in 2014
6 Recording of dog “passes” was revised in 2014
Because the 2006-2010 and 2014 monitoring projects were conducted with
different methodologies, only limited attempts will be made to quantitatively
compare each interval of tag program monitoring.

Methods
4 | P a g e
During development of the 2014 protocol, staff determined that repeating the previous methods
would not meet current project needs, and revised the methodology based upon a literature
review, a reexamination of departmental needs, public and Open Space Board of Trustees input,
expert peer review and professional judgment.
The methods presented below are a general description of the methods used during this project.
For further explanation on any topic, a detailed protocol for the 2014 project is available from
OSMP upon request (VanderWoude & Magtanong 2015). A glossary of terms used in this report
can be found in Appendix B. The Voice and Sight control definition is included below.
Definitions used in this report (exempting those contained within the Boulder Revised Code) are
modified specifically for the purpose of the Tag Program and Leash Regulations monitoring
project and should not be considered universal. Finally, this study is not meant to be exhaustive
of every possible human or dog behavior that could be considered a violation of dog
management regulations.
Boulder Revised Code – Voice and Sight Control Definition (B.R.C. 6-1-2)
"Voice and sight control" means the ability of a guardian or keeper to adequately control a dog
by using voice commands and sight commands (such as hand gestures). In order for a guardian
or keeper to have voice and sight control over a dog, the guardian or keeper must: (1) be able to
see the dog's actions; and (2) be able to prevent the dog from engaging in the following
behaviors, using voice and sight commands, without regard to circumstances or distractions:
(a) Charging, chasing or otherwise displaying aggression toward any person or behave
toward any person in a manner that a reasonable person would find harassing or disturbing;
(b) Charging, chasing or otherwise displaying aggression toward any dog;
(c) Chasing, harassing or disturbing wildlife or livestock; or
(d) Failing to come to and stay with the guardian or keeper immediately upon command by
such person.
2.1. Study Area
The 2014 study area was primarily based upon the locations of designated trails across OSMP
that include official dog opportunities and covered the vast majority of all OSMP-managed trails
(Appendix C) as of May 2014. Known exemptions include mountain peaks and other hard to
reach areas greater than a 60-minute hike in from an access point. The study area only included
properties where OSMP has an enforcement responsibility. Elevations ranged from
approximately 5,200 to 7,600 feet in a topographically diverse setting including mountain slopes,
mesas, bottomlands, canyons and plains. The study area included riparian, grassland, foothill
scrub, ponderosa pine, Douglas-fir and sub-alpine spruce-fir forest vegetation falling within the
Central Shortgrass Prairie and Southern Rocky Mountains eco-regions as defined by the Nature
Conservancy (Bunin 1985; Cooper 1984; Nied et al., 2009).
The 2014 study area included the 2006-2010 sites except for the Red Rocks Trailhead which was
excluded due to inadequacies in the ability of observers to see what was needed to meet current

Methods
5 | P a g e
objectives. The 2014 study area also included sites not monitored in previous iterations of this
study (Appendix D). Sites were located across all OSMP management area designations
(Appendix E) and within the four Trail Study Areas (Appendix F).
Sites for the 2016 and 2018 monitoring projects will be selected from the 2014 list, modified by
any necessary changes due to trail closures/construction or regulation changes.
2.2. Preparation for data collection
A system-wide map of all monitoring sites was created using ESRI ArcMap® (Appendix C).
This map, along with the GIS attribute table, contains all sites and the attributes of each site
(Appendix D), such as the site’s TSA or the estimated visitation rate for the trail. Additional
information contained in the attribute table, and documented only for the Voice and Sight
Regulations (V/S) component, were the linear length of the field of view and the length of the
off-set from the trail to be observed to the point where the observer was physically positioned to
collect data.
Before beginning fieldwork, Global Positioning System (GPS) receivers were uploaded with
background files including all of the monitoring sites, OSMP lands, designated trails, fences and
gates and other files intended to aid field technicians in locating property boundaries, trails,
access points and monitoring sites.
Preparation for the V/S component included the creation of a photo map for each observation
station (Appendix G). These photo maps included access information, photos representing the
field of view and adjacent landscape features, the trail(s) to observe, the line(s) of sight, the
observation post and other notes about the site. These maps were created to aid in locating the
specific monitoring location during the current project, to ensure each observer was observing
the same field of view, and for re-locating the sites in the future.
Before leaving the office, the field technicians prepared:
Site location on GIS map
GPS unit
Datasheets
Gear list
Photo map
Access/parking directions
2.3. General methods
Methods included naturalistic7 observation and face to face interviews. The following criteria
were used to select the best location along the trail for each monitoring site in the field (not all
sites meet all criteria; see protocol for additional detail on site selection):
Sight distance of at least 400 feet (Voice and Sight component only)
7 In this context, naturalistic means a research method commonly used by psychologists and other social scientists
which involves observing subjects in their natural environment.

Methods
6 | P a g e
Audio distance of at least 400 feet (Voice and Sight component only)
Few visual obstructions on/along trail such as boulders, shrubs, trees, trail undulations or
switchbacks
Ease of access and available legal parking for field technician
Location along trail continuum; need to represent various locations along the trail
(trailhead, first quarter mile, interior)
Recreation setting (combination of biophysical, managerial and social conditions along
with infrastructure development); need to represent a range of recreation settings
Existence of a potential challenge for dog management (water access, prairie dogs,
livestock)
Topographical setting; need to represent flats, hills, peak access, canyons
Not within a Trailhead Leash area
Underlain by OSMP owned and managed property (OSMP has enforcement
responsibility)
2.3.1. Voice and Sight (V/S) Regulations Component
The V/S component of the monitoring was a naturalistic observational study designed to evaluate
dog and guardian compliance with observable aspects of specific dog regulations of the voice
and sight ordinances. During field monitoring, data was collected to describe visitor party
attributes, dog and human behaviors and guardian responses (Appendix H). There is a full list
of categorical codes that were used to categorize and standardize observations throughout the
monitoring process at the end of Appendix H. Observations were categorized as “pass” events
when no dog behaviors were recorded, “interactions” when the dog under observation exhibited
a behavior toward another person, dog, wildlife or livestock and as “other” when the dog was out
of sight and/or the guardian issued a command (and these observations were not associated with
a pass or interaction event). These descriptive field data were evaluated and interpreted using the
collected information for each party to provide context and a chronological understanding of
each party’s behaviors and interactions. Evaluation and interpretation was conducted by the
monitoring, project management and ranger staff to determine a final compliance outcome for
each visitor party.
An important part of the B.R.C. code states that guardians must have voice control over their dog
while off-leash. To issue a V/S command means that the guardian spoke an audible command to
the dog with their voice; issued commands may include other signals (including but not limited
to vocalizations [words, whistles, whoops, etc.], clapping, or by making noises with their person
or a device, or by motions, movements or positions of their person); and that the signal appeared
to the observer to be communication intended to establish control of the dog including but not
limited to gaining the dog’s attention and/or requiring the dog to stop or return to the guardian.
Intended to establish control means that the guardian spoke discreet commands such
as “come here” and that the direction of movement of the guardian, tone of voice
and/or rate of speech used by the guardian is more urgent or stern than a friendly or
relaxed behavior or tone would be.
For purposes of this report, and to limit ambiguity, we separated commands into those that were
clearly meant to establish V/S control over a dog, and “other attempts” that were less clear.

Methods
7 | P a g e
These command events were reviewed by a team of experienced employees at OSMP including
Tag Program and monitoring staff along with lead law enforcement staff. Only commands that
included a word or phrase associated with a V/S regulation were included in the voice control
compliance measure.
For the Voice and Sight component, overall compliance was calculated by quantifying the
following variables in each visitor party.
Tag compliance (visible display of tag);
Out of sight (dog within sight of guardian);
More than 2 dogs per guardian;
Wildlife/livestock violation (charging, chasing or disturbing wildlife/livestock);
Human or dog violation (charging, chasing, or disturbing a human or dog);
No response to V/S command of guardian.
If a visitor party was not compliant with any one of these regulations, they were considered
noncompliant in the overall compliance measure. The number of noncompliant visitor parties
was divided by the total observed parties to obtain the compliance measure.
The Dog Excrement component of the monitoring was an observational study designed to
evaluate dog guardian compliance with dog excrement removal regulations. This component
was executed simultaneously with the V/S component. This component was not designed or
intended to measure Tag Program compliance. It is included in this project based upon direction
received from the Open Space Board of Trustees (OSBT) on July 10, 2013.
2.3.2. Leash Interview Component
The Leash Interview component of the effectiveness monitoring was a visitor interview
administered to visitor parties with at least one dog off-leash and without a leash visible (for each
off-leash dog) to the observer. During the interview, each guardian was asked to demonstrate
that they possessed a leash for each dog being managed under voice and sight control. The
interview was designed to evaluate dog guardian compliance with the leash possession
regulation. During these shifts, field technicians recorded data as shown in Appendix I.
For the leash interview component, compliance was measured at the visitor party level by
summing the total number of visitor parties that did not possess a leash for each off leash dog
and dividing this number by the total number of visitor parties observed.
2.3.3. Leash Required Component
The Leash Required component was an observational study designed to evaluate dog guardian
compliance with seasonal and year-round leash requirements on OSMP trails. Due to the time
frame of the first data collection period, the only seasonal leash trail to be included in the
sampling was the Greenbelt Plateau Trail. During these shifts, technicians recorded data as
shown in Appendix J.
For the leash required component, compliance was measured by summing the total number of
visitor parties that did not have each dog leashed and dividing this number by the total number of

Methods
8 | P a g e
visitor parties observed.
2.3.4. Violation data
OSMP Rangers have the authority to issue a summons when they see visitor parties that are in
violation of the B.R.C.. Each issued summons can include one or more charges. Staff gathered
the data for the number of charges issued that related to V/S violations of the B.R.C. for the same
time period as our monitoring (May 1, 2014 – July 31, 2014); codes are shown in Table 2.
Table 2. Description of each B.R.C. code collected during the monitoring
period
Nature of offense B.R.C. code
Aggressive Animal Prohibited 6-1-20
Dog running at large 6-1-16
Dogs prohibited 8-3-3
Failure to protect wildlife 8-3-5
Voice and Sight Control Evidence Tag Required 6-13-2
Additionally, we quantified the number of violations against B.R.C. code 6-1-18: Failure to
remove animal excrement.
2.4. Field methods
For all components, field personnel arrived at the monitoring site at least ten minutes prior to the
start of the monitoring period. Most monitoring sites required a hike from the trailhead or other
parking area and the time necessary to access the site was appropriately planned for.
2.4.1. Voice and Sight Regulations Component
Field personnel did not wear attire that identified them as OSMP staff and followed written
procedures. Once the monitoring session began, the observer watched the first visitor party with
one or more off-leash dogs that entered the field of view (from any direction). The observer
collected and recorded the visitor party data as shown in Appendix H. The observer watched
the visitor party the entire time the party remained in the observation area. Once the party that
was being observed left the observation area, the observer began observing the next
dog-containing party to enter the observation area and repeated the data collection process.
2.4.2. Leash Interview Component
During the leash interviews field personnel did wear attire that identified them as OSMP staff
and followed written procedures. Upon arrival at the monitoring location, the observer set up the
“Please STOP!” sign (Figure 1) near the monitoring site. Once the monitoring session began,
the observer attempted to stop the first visitor party with one or more off-leash dogs (and did not
have a leash visible for each off-leash dog) that approached the monitoring post from any
direction. Staff interviewed willing participants and used the datasheet to collect and record

Methods
9 | P a g e
Figure 1. Leash interview sign-i-cade
information as shown in Appendix I. Staff did not
attempt to contact the visitor party when leashes for
all dogs in the visitor party were visible.
2.4.3. Leash Required Component
When monitoring the leash required component,
field personnel did not wear attire that identified
them as OSMP staff and followed written
procedures. Once the monitoring session began,
the technician observed every visitor party with one
or more dogs that crossed over the observation
point (coming from all directions). The observer
collected and recorded the visitor party data as
shown in Appendix J.
2.5. GIS digitizing methods-mapping sites
A field technician visited each potential V/S site’s area, and then located the best place (greatest
field of view, least obstructions and suitable off-trail place to sit) along the specified trail to place
the monitoring site. GPS points were collected at the observation posts, along with the off-sets
from the trail to the posts and along the fields of view for each monitoring location and were
downloaded into a Geographic Information System (GIS) to facilitate digitizing of each V/S
component site. The study design included a 60-minute limit to the hiking time necessary to
access any monitoring site. Consequently, a handful of the highest elevation and/or hard to reach
trail locations on OSMP were not included in the study area.
Leash interview and leash required sites were digitally mapped in the office and field checked
during the first visit to them. As needed, points were digitally moved to the most suitable
location.
2.6. Quality control procedures
To produce the highest quality data set possible and maintain data integrity, monitoring staff
implemented the quality assurance/quality control procedures listed below.
2.6.1. Training and testing
Project staff participated in extensive in and out of office training prior to the start of data
collection.
Protocol and definitions training
Prior to the start of monitoring, staff members responsible for collecting data received extensive
training in the office including things such as: code definitions, scenario review, datasheet
review, protocol review, Q/A sessions, numerous group discussions and reading of relevant
literature. Project staff also participated in numerous field tests in real-time and these provided
an opportunity for staff to observe the behaviors and conditions being evaluated by this

Methods
10 | P a g e
monitoring. Field technicians were trained to identify the current OSMP voice and sight control
tag and decipher this tag from other common tags such as the Boulder County rabies tag and the
City of Boulder dog license tag (Figure 2).
Inter-observer variability test
In any study where more than one observer is responsible for collecting data, the results can be
compared using an inter-rater reliability (IRR) statistic. Cohen’s kappa () is the most commonly
used and widely acceptable statistic for comparing IRR (Viera and Garrett, 2005). There were
three observes collecting data for this project.
After extensive office and field training, a real-time field test was conducted to measure the level
of inter-observer reliability in data collection. During this field test, data collection staff silently
and simultaneously completed an observation session of three hours at six sampling locations,
representing a range of monitoring site conditions. While data were collected for a variety of
variables and behaviors, staff only tested reliability for those behaviors or events that were
relevant to the B.R.C and inferred compliance or non-compliance of a visitor party.
Perfect agreement would be indicated by = 1, while agreement equivalent to chance is
indicated by = 0. The minimum level of adequate consistency was set at = 0.6, which is an
accepted practice among researchers involved in similar studies (Landis and Koch 1977; Sim and
Wright 2005). Kappa was calculated in R (R Development Core Team, 2014) using package
“irr” (Gamer et al 2012).
Across all variables and all observers, the ranged from 0.39-1.00 and averaged 0.75, indicating
substantial agreement across observers. The average -value of 0.75 is above the normally
acceptable 0.6, and thus observations between observers collected during the study period could
be considered reliably collected.
OSMP V/S Tag City of Boulder dog license Boulder County rabies tags
Figure 2. Dog tags commonly found in Boulder Colorado

Methods
11 | P a g e
2.7. Monitoring design rationale and suggested limitations
Staff were asked by City Council and the Open Space Board of Trustees to re-design the tag
monitoring project for 2013-2017 (post-flood dates changed to 2014-2018). The ordinances
related to voice and sight control in the B.R.C. do not provide definitive measurable parameters
by which a guardian must “adequately control a dog using voice and sight commands” (B.R.C.
6-1-2) in order to prevent specific outcomes from taking place. Thus, staff developed a
monitoring project that would align with the legal interpretation of the B.R.C. regarding V/S
control by incorporating the thought process rangers use in enforcing these regulations. As such,
modifications were made to the 2006-2010 monitoring methods to reflect this new thought
process. A full explanation of the monitoring design rationale and the specific changes can be
found in Appendix K. A list of suggested limitations to the current project is included in
Appendix L.

Results
12 | P a g e
3.0 Results
Other notes on interpreting results:
1. Results represent data at the visitor party level; results at the per event level are included in
Appendix M.
2. Individual or summed values less than .05 are typically not included; totals represent
rounding to the nearest tenth of a percent, or to the nearest whole count or percent.
3. Slight differences in individual values and/or sums are due to rounding.
4. Summed values greater than 100% are due to rounding of individual values.
5. All comparisons between years were conducted using the χ2 test of equality of proportions
where α = 0.05. When a significant difference was detected, this result is shown in bold red
text.
3.1. Generalizing to OSMP Dog Guardian Population
The vast majority of OSMP trails were included in the sampling site list. However, as a result of
selecting monitoring sites with a maximum of a 60-minute hiking access time, compliance
estimates generated by this study can only be generalized to the population of dog guardians that
visit trails on OSMP that allow dogs and have similar dog management as to those trails listed in
Appendix D (i.e. no mountain summits or other areas more than a 60 minute hike in from an
access point).
The monitoring study was designed to gain an understanding of the level of compliance with
voice and sight requirements, leash regulations and excrement removal across all trails on the
OSMP system that met our selection criteria. For each component, staff will pool data from the
study sites and will not compare the individual study sites to each other. Observations at
individual sites were too few to support statistically useful comparisons between sites.
3.2. Voice and Sight Regulations Component
For the Voice and Sight regulations component, we conducted 65 monitoring sessions and
sampled a total of 310 visitor parties. The overall compliance rate was 67%.
The monitoring periods were distributed over all days of the week, three time periods per day
and varying locations along the trail (Figure 3). Sessions occurred at locations of varying
visitation volume (high to low volume) and across numerous geographic locations on OSMP.
While only 38.5% of all sessions took place in the morning, 56% of all visitor parties were
Because the 2006-2010 and 2014 monitoring projects were conducted with different
methodologies, only limited attempts will be made to quantitatively compare each
interval of tag program monitoring. Additionally, results presented do not intend to determine the compliance rate for a
visitor’s entire trip. All rates of compliance should be understood as rates only
through the observation zone.

Results
13 | P a g e
observed during that time period. Similarly, while about 28% of all sessions took place at the
trailhead/start of trail, 38% of visitor parties were observed at those locations. These results
suggest that proportionally, more people come to OSMP in the mornings and that more people
travel near the trailhead (less people travel to the interior) or potentially become more spread out
as trails branch off into different routes.
Figure 3. The number of sessions (n=65) and visitor parties (n=310) broken down by
attribute for the Voice & Sight component.

Results
14 | P a g e
Of the 310 visitor parties monitored for the Voice and Sight regulations component, there were
255 hiking, 48 running, 6 cycling and 1 equestrian party (Figure 4). Compared to the most
recent system-wide visitor survey activity distribution (City of Boulder 2011), there was more
hikers, fewer cyclists and about an equal percentage of runners.
The majority of visitor parties had only one dog, and very few had more than 2 dogs (Table 3).
These results are similar to the 2011 OSMP visitor survey, where of the parties that had a dog
with them, 77% of people brought 1 dog, 19% brought 2 dogs, and 3% brought 3 or more dogs.
Table 3. Total number of off-leash dogs by visitor party (n=310) for the Voice and Sight
component
Number of off-leash
dogs
Number of visitor
parties
Total number
of dogs
Percent of observed
parties
1 236 236 76.1
2 60 120 19.4
3 11 33 3.5
4 3 12 1.0
Total 310 401 100.0%
3.2.1. Overall compliance rate system-wide
The overall Tag Program compliance rate system-wide (excluding the Leash Interview
component which was monitored separately), is 67% (95% CI, 61.2 to 72.0) (Appendix N).
82%
16%
2% <1%
Hikers
Runners
Cyclists
Equestrians
Figure 4. Number of visitor parties (n=310) by activity for the Voice & Sight
component.
Results
15 | P a g e
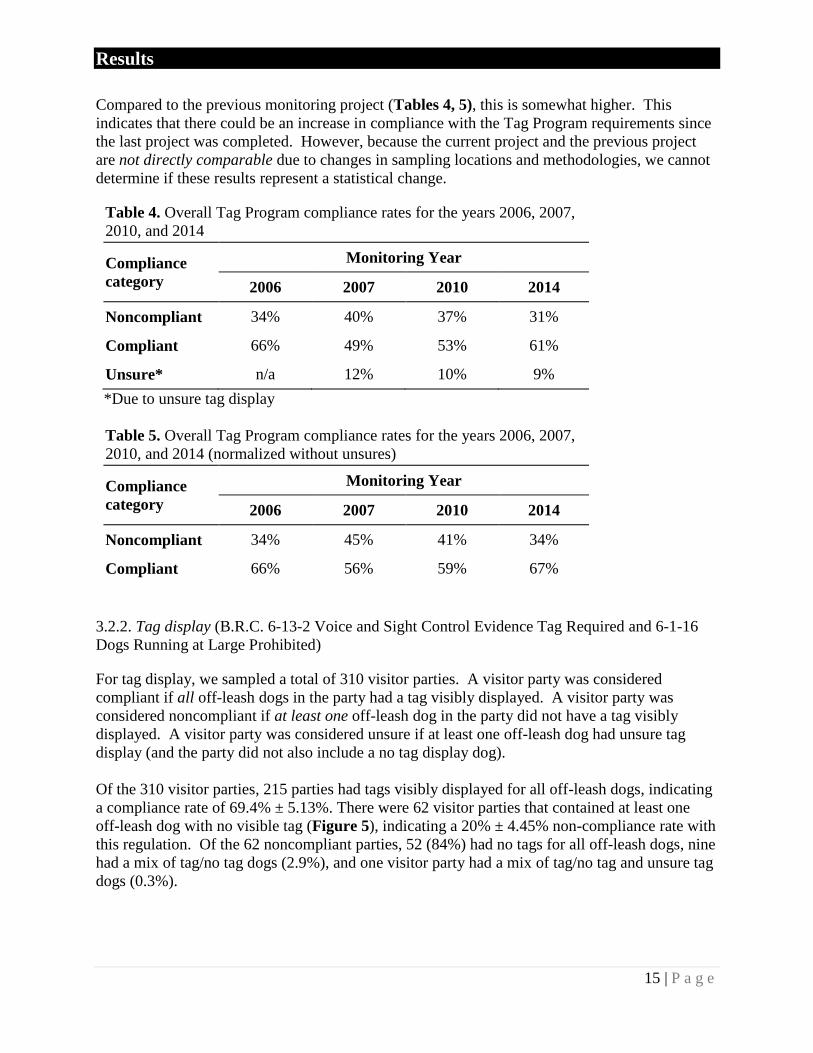
Compared to the previous monitoring project (Tables 4, 5), this is somewhat higher. This
indicates that there could be an increase in compliance with the Tag Program requirements since
the last project was completed. However, because the current project and the previous project
are not directly comparable due to changes in sampling locations and methodologies, we cannot
determine if these results represent a statistical change.
Table 4. Overall Tag Program compliance rates for the years 2006, 2007,
2010, and 2014
Compliance
category
Monitoring Year
2006 2007 2010 2014
Noncompliant 34% 40% 37% 31%
Compliant 66% 49% 53% 61%
Unsure* n/a 12% 10% 9%
*Due to unsure tag display
Table 5. Overall Tag Program compliance rates for the years 2006, 2007,
2010, and 2014 (normalized without unsures)
Compliance
category
Monitoring Year
2006 2007 2010 2014
Noncompliant 34% 45% 41% 34%
Compliant 66% 56% 59% 67%
3.2.2. Tag display (B.R.C. 6-13-2 Voice and Sight Control Evidence Tag Required and 6-1-16
Dogs Running at Large Prohibited)
For tag display, we sampled a total of 310 visitor parties. A visitor party was considered
compliant if all off-leash dogs in the party had a tag visibly displayed. A visitor party was
considered noncompliant if at least one off-leash dog in the party did not have a tag visibly
displayed. A visitor party was considered unsure if at least one off-leash dog had unsure tag
display (and the party did not also include a no tag display dog).
Of the 310 visitor parties, 215 parties had tags visibly displayed for all off-leash dogs, indicating
a compliance rate of 69.4% ± 5.13%. There were 62 visitor parties that contained at least one
off-leash dog with no visible tag (Figure 5), indicating a 20% ± 4.45% non-compliance rate with
this regulation. Of the 62 noncompliant parties, 52 (84%) had no tags for all off-leash dogs, nine
had a mix of tag/no tag dogs (2.9%), and one visitor party had a mix of tag/no tag and unsure tag
dogs (0.3%).

Results
16 | P a g e
During the monitoring of tag display, observers noted 34 visitor parties that had at least one
off-leash dog with unsure tag status (observer unable to determine status of tag display). Of
these 34, 29 visitor parties (94%) had unsure tag status on all dogs in the party and were not
assigned as complaint or noncompliant but rather in a unique category named “unsure”. Four of
the 34 visitor parties had a mix of tagged and unsure tagged dogs and were also included in the
unsure category (1.3%). One of the 34 parties had a combination of tag/no tag/ unsure tag, and
thus was included in the group of 62 visitor parties with at least one untagged dog
(noncompliant).
The total sample size of all visitor parties in 2007 and 2010 was 1,029 and 1,010 respectively
(City of Boulder 2011). In order to compare tag display of visitor parties across years, we
removed all visitor parties from previous years with only on-leash dogs. Also, in previous years,
unsure tag display was categorized as compliant. In order to compare with the current year, we
placed unsure tag display in its own category. The remaining sample size and consequent tag
display can be seen in Table 6. Data from 2006 is not included here, as 2006 pre-dated the
implementation of the V/S program.
Figure 5. Number of visitor parties (n=310) and dogs (n=401) by tag
display for the Voice & Sight component.

Results
17 | P a g e
Table 6. Yearly comparison of tag display breakdown by visitor party for off-leash dogs for the
Voice and Sight component
Tag display 2007 #
parties
2007
Percent
2010 #
parties
2010
Percent
2014 #
parties
2014
Percent
All dogs have tags
(compliant) 499 64.0 573 72.3 215 69.4
All no tag (non-
compliant) 142 18.2 96 12.1 52 16.8
Mix tag/no tagged,
no unsure (non-
compliant)
20 2.6 16 2.0 9 2.9
Mix tag/no tagged
with unsure (non-
compliant)
2 0.3 0 0.0 5 1.6
Mix no tag unsure
(noncompliant) 2 0.3 2 0.3 0 0.0
Only unsure
(unsure) 107 13.7 90 11.4 29 9.4
Mix yes tag with
unsure (unsure) 8 1.0 15 1.9 0 0.0
Total 780 100.0% 792 100.0% 310 100.0%
We used the χ2
test statistic to determine if there were significant differences in the proportion of
visitor parties displaying tags for all off-leash dogs between years. For all tests, α = 0.05. For
consistency, we removed all visitor parties from the previous years that were comprised of only
on-leash dogs. We found a significant increase in compliant visitor parties from 2007 to 2010,
and no difference between 2010 and 2014 (Table 7).
Table 7. Statistical comparisons between years for tag display for the
Voice and Sight component
Years to compare χ2 df p
2007/2010 12.70535 1 <0.001
2010/2014 0.97997 1 0.32
3.2.3. Within sight (B.R.C. 6-1-2 Definitions)
In 2014, we observed 21 unique parties with one or more dogs that were out of sight one or more
times within the observation area, this resulted in a 93% compliance rate (Table 8).

Results
18 | P a g e
Table 8. Yearly comparison of compliance with the out of sight regulation
at the visitor party level
Year 2006 2007 2010 2014
# of Visitor parties with at
least one off-leash dog 919 780 792 310
# Out of sight 129 61 38 21
Percent noncompliant 14% 8% 5% 7%
Percent compliant 86% 92% 95% 93%
To compare 2014 results with previous years, we removed all visitor parties with only on-leash
dogs from the 2006-2010 data. While the differences between 2006/2007 and 2007/2010 were
determined to be significantly different, the compliance rate between 2010 and 2014 were not
(Table 9).
Table 9. Statistical comparisons between years for the out of sight
regulation
Years to compare χ2 df p
2006/2007 16.41536 1 <0.001
2007/2010 6.08382 1 0.014
2010/2014 1.71712 1 0.19
3.2.4. No more than 2 dogs off-leash (B.R.C. 6-1-16. Dogs Running at Large Prohibited)
Out of 8 visitor parties with a total of more than 2 dogs per guardian, 7 visitor parties had too
few guardians for the number of off-leash dogs. This indicates a non-compliance rate of 88%.
In 2006, 2007, and 2010, the compliance rate for no more than two dogs off-leash was 6% (1 out
of 18 visitor parties), 41% (7/17), and 33% (3/9)8 respectively. We were unable to calculate the
χ2
statistic for this component between 2010 and 2014 due to a low sample size, however there
was a strong decrease with the compliance rate falling from 33% in 2010 to 12% in 2014.
3.2.5. Charging…person (B.R.C. 6-1-2 Definitions)
At the visitor party level, compliance is 92% including both passes and interactions and 70%
including only interactions (Table 10).
8 In the 2011 City of Boulder report, the original total sample was 10 visitor parties. After re-analyzing the data, we
found an error and now report the new sample size as 9 visitor parties.

Results
19 | P a g e
Table 10. Number, type of event and compliance outcome for events involving other visitors
reported at the visitor party level (some parties had more than one type of event).
Type of event/visitor party
level
No
violation Violation Total
Compliance
both
Compliance
interactions only
Person passes* 111 n/a 111
92% 70%
Person interactions 22 7 29
Person and dog passes 11 n/a 11
Person and dog interactions 9 6 15
Totals 153 13 166
**Includes one equestrian pass
When reduced to the unique number of visitor parties that included one or more events (of any
type) involving other people (n=139),12 visitor parties had one or more noncompliant event and
this results in an overall charging…person compliance rate of 91%. Of these 12 parties, the
majority had tags on all off-leash dogs.
3.2.6. Charging…dog (B.R.C. 6-1-2 Definitions)
At the visitor party level, compliance is 87% including both passes and interactions and 81%
including only interactions (Table 11).
Table 11. Number, type of event and compliance outcome for events involving other dogs
reported at the visitor party level (some parties had more than one type of event)
Type of event/visitor party
level
No
violation Violation Total
Compliance
both
Compliance
interactions only
Dog passes 7 n/a 7
87% 81%
Dog interactions 20 1 21
Person and dog passes 11 n/a 11
Person and dog interactions 9 6 15
Totals 47 7 54
When reduced to the unique number of visitor parties that included one or more events (of any
type) involving other dogs (n=47), 7 visitor parties each had one noncompliant event and this
results in an overall charging…dog compliance rate of 85%. Of these 7 parties, equal numbers
did and did not have tags on all off-leash dogs.
3.2.7. Charging ……person and a dog (B.R.C. 6-1-2 Definitions)
In some cases, the observers recorded an interaction including both a person and a dog. Of the 15
visitor parties that had one or more interactions with both a person and a dog, there were 6
parties whose interactions led to the harassment of both a person and a dog (Appendix M).

Results
20 | P a g e
In some instances, the off-leash dog under observation approached an on-leash dog and their
guardian. In four of these cases, there was contact between the off-leash dog and the leashed dog
and human guardian. In four of these cases (not necessarily the same cases) there was avoidance
behavior and/or verbal protest from the human guardian of the leashed dog. Three of these cases
resulted in a violation of regulations on the part of the unleashed dog visitor party.
There were also 11 visitor parties with one or more passes of a person and a dog. The
compliance rates for these events are included in the appropriate B.R.C. sections/figures above
(Tables 10, 11).
3.2.8. Chasing…..wildlife (B.R.C. 6-1-2 Definitions)
At the visitor party level, compliance is 50% including both pass and interactions events and
29% with only interactions (Table 12).
Table 12. Number, type of event and compliance outcome for events involving
wildlife/livestock reported at the visitor party level
Type of event/visitor
party level
No
violation Violation Total
Compliance
both
Compliance
interactions only
Wildlife passes* 3 n/a 3
50% 29% Wildlife interactions* 2 5 7
Totals 5 5 10
*Includes one livestock event
When reduced to the unique number of visitor parties that included one or more events involving
wildlife/livestock (n=10), 5 visitor parties each had one noncompliant event and this results in an
overall charging…wildlife compliance rate of 50%. Of these 5 parties, the majority had tags on
all off-leash dogs.
3.2.9. Voice recall (B.R.C. 6-1-2 Definitions)
Summarized to the visitor party level for each type of event, overall compliance with the voice
control regulation is 77% (95% CI, 64.2 to 87.3) (Table 13) (Appendix N).
Table 13. Number, type of event and compliance outcome for V/S command events
collapsed at the visitor party level (some parties had more than one type of event)
Type of event Dog response
Total Compliance rate No Yes
Pass 1 3 4 75%
Interaction 4 14 18 78%
Isolated 9 31 40 78%
Total 14 48 62 77%

Results
21 | P a g e
When reduced to the unique number of visitor parties that included one or more command events
(n=57), 13 visitor parties had one or more noncompliant event and this results in an overall voice
control compliance rate of 77%. Of the 310 observed visitor parties, 253 did not give a V/S
command within the observation zone.
Other observed attempts/methods to control a dog
On numerous occasions (38), field observers noted a guardian communicating with a dog using
words or phrases that could not definitively be related to a V/S command (e.g. just a dog’s name
or words like, “Hey!”). The observers recorded what was said and whether or not there was a
response from the dog. Observers also documented a handful (11) of other attempts to control a
dog. These included whistling, leashing, and physical restraint. Of these total (49) other
observed attempts/methods to control a dog, 37 included a response from the dog and 12 did not.
This rate of response (76%) was very similar to the V/S command results.
3.2.10. Passes summary When the dog party under observation “passed by” another person, dog, wildlife or livestock,
and the dog exhibited no behavior(s) toward the other being, field staff recorded this as a pass
event. Staff recorded a total of 195 passes across 119 visitor parties, and the vast majority of
these took place with just people (170), while there were 8 passes of just dogs, 2 of just wildlife,
1 of just an equestrian and 1 of just livestock. There were also 13 passes of a person and a dog.
3.2.11. Interactions summary
When a dog displayed a behavior toward another being, an interaction was recorded. Sixty-three
visitor parties had one or more interactions with another person, dog, livestock or wildlife (or
some combination) and there were a total of 92 interactions documented. Of these 92
interactions, 23 resulted in a violation of the B.R.C. 6-1-2 Definitions section.
3.2.12. All opportunities summary
Of the 310 observed visitor parties, 148 had many potential opportunities (287) to interact with
other people, dogs, wildlife or livestock or some combination of these. The majority (195) of
potential opportunities resulted in a neutral pass and the remainder (92) resulted in an interaction.
Of the 287 potential opportunities, 23 resulted in a violation against a person, dog or wildlife.
The majority of parties (162) had no opportunity to pass or interact with another being because
no other thing was within the observation zone at the same time as the party under observation.
3.2.13. Dog excrement pickup and removal (B.R.C. 6‐1‐18 Removal of Animal Excrement
Required)
While not a requirement specific to the Voice and Sight Tag Program, field observations
included collection of data associated with dog excrement regulations. This was the most
efficient and feasible way to include these observations within the current project as staff was in
place making observations.
Compliance with the regulations requires that a visitor party bags and takes all excrement with
them, and thus any visitor party that bags the excrement but does not take it with them, i.e.,

Results
22 | P a g e
leaves the bag on the side of the trail, was considered noncompliant. To quantify visitor party
behavior, we divided noncompliant visitor parties into two categories: “Bagged and left” refers
to guardians that bagged their dog’s excrement and left the bag, while “No action” indicates that
the visitor party did not bag or remove their dog’s excrement.
We observed 26 visitor parties with dogs that defecated during the study period. Out of those 26,
18 parties were compliant, i.e., bagged and took the excrement with them. Of the eight
noncompliant parties, 4 did not bag their dog’s excrement (“no action”), while the other 4 visitor
parties bagged the excrement but did not take it with them (“Bagged”). These results indicate a
compliance rate of 69.2% (18/26). Of the 8 noncompliant dog parties that did not take all
excrement (Figure 6), the majority were compliant with tag regulations.
Our sample sizes are considerably lower than other years of data collection (2006-2010) because
previously, excrement monitoring was done primarily near trailheads or the start of the trail
(where dogs are more likely to defecate), and included observation of parties comprised
exclusively of leashed dogs. The sample sizes for 2006, 2007, and 2010 were 188, 100, and 103
respectively. Of those visitor parties, the total number of noncompliant parties for 2006, 2007,
and 2010 were 69, 50, and 56. However, here we report the yearly comparison of excrement
removal compliance rates and the type of non- compliance with excrement removal (Table 14)
considering only visitor parties with at least one off-leash dog. Removing the leash-only parties
Table 14. Yearly comparison of excrement removal by visitor party for off-leash dogs
Excrement category 2006 2007 2010 2014
Took all (compliant) 105 (62%) 36 (44%) 38 (41%) 18 (70%)
Bagged and left (non
compliant) 30 (18%) 29 (36%) 26 (28%) 4 (15%)
No action (non compliant) 35 (21%) 16 (20%) 16 (31%) 4 (15%)
Total 170 (100%) 81 (100%) 93 (100%) 26 (100%)
Figure 6. Excrement removal status by visitor party (n=26) broken down by
visitor party action

Results
23 | P a g e
from the previous data was necessary to compare compliance of visitor parties with at least one
off-leash dog between years. Additionally, because the 2014 project included excrement
observations for only off-leash dogs, the comparison tables include data for off-leash dogs only
(some parties had on-leash dogs as well but these were not observed).
We used the χ2
test statistic to determine if there were significant differences in the proportion of
visitor parties picking up and removing all excrement between years (i.e., took all). For all tests,
α = 0.05. For consistency, we removed all visitor parties from the previous years that were
comprised of only on-leash dogs. In agreement with the previous report (City of Boulder, 2011),
we found a significant decrease in the proportion of compliant visitor parties from 2006 to 2007,
with no difference between 2007 and 2010 (Tables 14, 15). In addition, we found a significant
increase in compliance from 2010 to 2014.
Table 15. Statistical comparisons between years for excrement removal
Years to compare χ2 df p
2006/2007 6.685051 1 0.009
2007/2010 0.22755 1 0.633
2010/2014 6.564631 1 0.01
3.3. Leash Interview Component
For the Leash Interview component, we conducted 60 monitoring sessions and sampled a total of
302 visitor parties. The monitoring periods were distributed over all seven days of the week,
three time periods per day and location (Figure 7). Sessions occurred at locations of varying
visitation volume (high to low volume) and across numerous geographic locations on OSMP.
While 36.7% of sessions were conducted in the morning, 58% of visitor parties were accounted
for during the AM sessions. The same pattern was observed in the V/S monitoring. Possible
reasons for higher visitation in the morning include lower temperatures and/or personal
preference for exercise in the morning.

Results
24 | P a g e
Out of the 302 visitor parties observed or contacted during the leash interviews, 81.8% were
composed of hikers and about 16% were composed of runners (Figure 8). The remaining visitor
parties were composed of cyclists or climbers. The activity type for one visitor party was not
recorded, and this party is reported as “other” in Figure 8.

Results
25 | P a g e
The vast majority of leash interview parties had only one dog per party (235, 77.8%) (Figure 9).
Fifty-two visitor parties had two dogs per party, while the remaining parties were composed of
three, four and six dogs. These numbers are very similar to the visitor party characterization of
the V/S component where 76.1% of the parties had only one dog.

Results
26 | P a g e
Of the 302 visitor parties sampled, 275 were either observed as having all leashes (205), or
showed the correct number of leashes when questioned by the interviewer (70) (Figure 10).
These numbers result in a compliance rate of 91.1% for the leash possession regulation. Twenty-
seven visitor parties were recorded as unknown compliance or noncompliant. Fourteen visitor
parties did not stop when asked and 13 visitor parties did not possess the correct number of
leashes for all of their off-leash dogs. For the 14 visitor parties that did not stop when asked, we
do not know if they possessed the correct number of leashes and hence did not assign them to a
compliance category.
Figure 9. Number of visitor parties (n=302) by number of dogs in party (n=388) for the Leash
Interview component.

Results
27 | P a g e
While not a measure of compliance for the Leash Interview component, we also recorded the tag
display of off-leash dogs during this monitoring. We found that out of 302 visitor parties, 252
had tags for all off-leash dogs (83.4%). Thirty-three (10.9%) visitor parties had no tags for any
off-leash dogs, and only six visitor parties (2%) were still marked unsure after the interview
(Figure 11). The remaining 11 parties had mixed tagged status including one or more off-leash
dogs without a tag and these are included in the noncompliant category.
Figure 10. Number of dogs (n=388) and visitor parties (n=302) by leash
presence for the Leash Interview component.

Results
28 | P a g e
The Leash Interview component was last conducted in 2006. In 2006, the compliance rate was
about 93%, with the vast majority of visitor parties possessing leashes for each off-leash dog
(Table 16).
Table 16. Comparison of 2006 and 2014 Leash Interview Data
Category 2006 2014
# Visitor parties 393 302
# Parties with leashes for every dog 365 275
# Parties without leashes for every
dog 28 27
Compliance rate 93% 91%
Figure 11. Number of visitor parties (n=302) and dogs (n=388) by tag display for
the Leash Interview component.

Results
29 | P a g e
To determine any difference in compliance between 2006 and 2014 we used the χ2
statistic and
found no significant difference in compliance between the two monitoring periods (Table 17).
Table 17. Results of comparison between years for leash possession for
the Leash Interview component
Years to compare χ2 df p
2006/2014 0.772569 1 0.379424
3.4. Leash Required Component
For the Leash Required component, we conducted 88 monitoring sessions and sampled a total of
238 visitor parties. Because fewer visitor parties tend to recreate with their dogs on-leash
compared to the off-leash areas, this component required more monitoring sessions to reach an
adequate sample size. The monitoring periods were distributed over all seven days of the week,
three time periods per day, and location. Sessions occurred at locations of varying visitation
volume (high to low volume) and across numerous geographic locations on OSMP. Contrary to
what was seen during the Leash Interview and V/S monitoring, visitors to leash-only trails had
higher visitation rates during the mid-day sessions than the morning sessions. There is also a
strong trend for a higher percentage of visitors on the weekend compared to the percentage of
sessions (Figure 12).

Results
30 | P a g e
Out of the 238 visitor parties observed during the leash required component, 84% were
composed of hikers and about 15% were composed of runners (Figure 13). The remaining
visitor parties were composed of cyclists and equestrians.

Results
31 | P a g e
Out of 238 visitor parties, 195 were composed of only on-leash dogs, resulting in a compliance
rate of 81.9% (Figure 14). Those 14 parties observed on Greenbelt Plateau Trail (seasonal leash
required trail) had a moderately lower compliance rate (57%) than those on trails with a
year-round leash requirement (83%). Overall 18.1% of observed parties were noncompliant and
only 3 visitor parties (1%) had a mix of both on and off-leash dogs.
84%
15%
1% <1%
Hikers
Runners
Cyclists
Equestrians
Figure 13. Number of visitor parties (n= 238) by activity for the Leash
Required component.

Results
32 | P a g e
During the leash required monitoring, we recorded 40 visitor parties composed of only off-leash
dogs. Of these 40 parties, 24 had tags on all their dogs, compared to 11 visitor parties that did
not have tags on all their dogs (Figure 15). This graph and table does not include the 3 visitor
parties that included at least one on and one off-leash dog (mixed leash status).
Figure 14. Number of visitor parties (n= 238) and dogs (n= 296)
broken down by leash category for the Leash Required component.

Results
33 | P a g e
3.5 Violation data
Table 18 shows the number of charges issued by OSMP Rangers during the monitoring time
period.
Table 18: Number of charges issued by OSMP Rangers and accompanying B.R.C. code
during the monitoring period (May 1, 2014 - July 31, 2014).
Nature of offense Total # of charges B.R.C. code
Aggressive Animal Prohibited 2 6-1-20
Dog running at large 21 6-1-16
Failure to protect wildlife 0 8-3-5
Failure to remove animal excrement 0 6-1-18
Voice and Sight Control Evidence Tag Required 25 6-13-2
Figure 15. Tag display by leash status and visitor party (n= 235) and dog number (n=289)
for the Leash Required component.

Discussion
34 | P a g e
4.0 Discussion
Tag Program success is important to maintain quality visitor experiences and for the protection
of natural resources. By the end of the summer of 2010, over 25,000 participants had registered
in the program (City of Boulder 2011) and OSMP receives about 2 million annual dog visits
(Vaske, Shelby & Donnelly 2009). This project was intended to estimate the 2014 baseline level
of compliance with Tag Program requirements directly before implementing the suite of
approved program enhancements. The creation of a new baseline, rather than using the results of
the previous 2006-2010 project, contributes to a better understanding of conditions at the time
program changes are implemented and reduces the chance that measured pre-change conditions
are not reflective of the actual conditions on OSMP prior to modification of the program. The
primary program enhancements include:
Attendance of an in-person information/education class
Proof of rabies vaccination
Education and outreach strategies
Modifications to fines and violations causing suspension of participation
Participant fee(s) revision
This project is scheduled to be repeated soon after (2016) and again three years after (2018)
implementing Tag Program enhancements to gain an understanding of any measurable change in
observed behaviors.
4.1. Baseline conditions
The 2014 overall Tag Program compliance rate is 67%. Baseline conditions for most
individually measured attributes and indicators include compliance rates greater than or equal to
70%. Components with lower compliance rates include more than two dogs off-leash per
guardian, excrement pickup and interactions with wildlife/livestock. Baseline condition results
from this project along with the results from the two additional monitoring periods (2016, 2018)
are meant to inform future discussions and the potential creation of ranges of acceptability and
associated standards for future dog regulation compliance measures.
4.1.1. Voice and sight regulations
The previous Tag Program monitoring project (2006, 2007, 2010) resulted in overall compliance
rates ranging from 56-66%. The current overall compliance rate (67%) is somewhat higher
compared to previous years. In particular, voice control compliance increased from the previous
range of 56-64% to 77%. This would suggest that Tag Program compliance has improved, or at
least that compliance has not gone down, and/or some portion of the change could be a result of
methodological changes (such as the elimination of recording conflictive behaviors). Because
OSMP has not yet defined an acceptable level of compliance, it can only be said that compliance
rates are generally higher compared to previous results.
Lack of tag display had more total noncompliant visitor parties than any other single compliance
category. Part of the non-compliance is likely due to people who have never signed up with the
program and another part is likely from people who are participants, but have lost and not
replaced their tag. OSMP could do a systematic check of parties not displaying a tag. Knowing

Discussion
35 | P a g e
if lack of tag display is due to non-participation or lack of attaining a replacement tag could
inform future management designed to improve upon the compliance with tag display. For
example, reminders to check that each off-leash dog has a current tag could be sent once each
mid-year to current participants or areas with higher proportions of visitors that have not ever
signed up could receive targeted education or patrol efforts.
Items with the lowest compliance rate and needing special attention include having no more than
two dogs off-leash per guardian and interactions with wildlife/livestock. While the number of
observations for each of these items was small during the study period, the likelihood of a
violation was high when they did occur, and cumulatively over the course of a year across
OSMP, the number of occurrences would be in the tens of thousands. These two items could be
addressed with targeted patrol and further clarified in outreach materials, trails signs or during
the in-person training class.
4.1.2. Leash interview
The vast majority of off-leash dog guardians met the requirement to have a leash for each
off-leash dog under their care. This indicates that dog guardians are aware of the regulation and
are willing to carry leashes for their off-leash dogs. Guardians may also carry leashes for their
dogs for personal and the safety of others or to be ready for unforeseen circumstances. Because
the 2014 compliance rate was greater than 90%, it is unlikely that OSMP will repeat this
component during future intervals of tag program monitoring.
4.1.3. Leash required
During observation for the Leash Required component, 82% of observed parties complied with
the requirement to keep all dogs under their care on a leash. The 14 parties observed on
Greenbelt Plateau Trail (seasonal leash required trail) had a moderately lower compliance rate
(57%) than those parties on trails with a year-round leash requirement (83%). The lower
compliance rate along Greenbelt Plateau Trail could be attributed to visitors simply being
unaware of the seasonal leash requirement, visitors choosing to not comply with the leash
requirement (including visitors arriving from surrounding V/S trails who do not want to leash
their dog mid-hike) or to a lowered social norm and/or the belief that not leashing their dog is not
affecting anyone (because few visitors or no one is on the trail). Correspondingly, the higher
compliance rate along year-round leash required trails may imply that visitors to these trails have
a greater awareness of the leash law, are used to having their dog on-leash in these areas or may
choose to go to a leash required trail purposefully.
4.1.4. Dog Excrement
Of the 26 visitor parties observed with a defecating dog, 18 parties (69%) complied with all dog
excrement regulations. Compared to the previous monitoring project (ranged from 46% to 63%)
this is a higher compliance rate, and this could be attributed to an actual increase in compliance
or could be due to sample site selection differences (i.e. having more internal sites).

Discussion
36 | P a g e
4.2. Potential barriers to regulatory compliance
Several researchers have proposed frameworks to classify reasons why visitors engage in
behaviors considered to diminish visitor or resource quality such as failing to properly manage
their off-leash dog or violating park rules (Widner-Ward & Roggenbuck 2003, Miller et al. 2001,
Gramann & Vander Stoepp 1986, Nesbitt 2006, Borrie & Harding 2002). Other researchers have
categorized the actions themselves rather than the motivations behind the action in an effort to
explain visitor behavior and propose management strategies to effect change if the behavior is
considered unacceptable (Hendee et al. 1978, Hendee and Dawson 2002). Collectively, these
ideas could be used to better understand possible barriers to compliance with dog regulations.
Where available information is not the limiting factor, some of the hypothesized explanations for
visitor noncompliance include (Miller et al. 2001, Borrie & Harding 2002, Gramann & Vander
Stoep 1987, Hendee & Dawson 2002):
1. Cognitive failure in the form of faulty decision-making,
2. Ineffective attitude shift when presented new information,
3. Habituated behaviors,
4. Lack of awareness of a problem,
5. Presence or absence of an underlying ethic,
6. Lack of the necessary skill to carry out appropriate behaviors,
7. Normative influences and social pressures,
8. Cognitive overload when exposed to more than one message at a time,
9. Attitudes toward park regulations are established long before on-site visit.
Social norms (Donnelly et al. 2000) could influence the likelihood that a dog guardian chooses to
comply with V/S regulations. When visiting OSMP, dog guardians may think the expected norm
is to control their dogs, but maybe not to the level of control demonstrated in the video or as
explained in the in-person education class. Additionally, dog guardians may not experience guilt
(as a result of breaking the expected norm) if they don’t achieve the demonstrated level of
control. This potential lack of obligation and internal sanction could lead to a weaker perceived
norm and result in a dog guardian not meeting the V/S requirements.
Another barrier to compliance could be the perceived lack of OSMP ranger presence. Although
there is no data to empirically estimate how often visitors encounter an OSMP ranger, the odds
of a visitor party encountering a ranger on a given visit are likely very small. There are few
rangers on patrol relative to the number of acres managed by OSMP and to the number of
visitors on OSMP-managed lands. OSMP rangers also assist with resource protection, respond
to emergencies and lead educational efforts, further minimizing their available time to conduct
standard patrols and reducing the likelihood that visitors encounter a ranger on a given visit.
This unlikelihood of encountering a ranger could weaken any external pressure experienced by
dog guardians to comply with V/S rules. Across all 2014 monitoring periods, rangers were noted
during:
Zero of 65 V/S sessions;
One of 88 leash required sessions; and
Three of 60 leash interview sessions.

Discussion
37 | P a g e
A better understanding of which factors most limit compliance could inform more effective
strategies in achieving compliance. Depending on which factors are limiting compliance,
managers might apply different management strategies. For example, if interpretation of the
situation seems to be problematic, managers could pursue educational efforts or B.R.C.
ordinance clarifications that very clearly illustrate why certain situations are problems or may be
illegal. Or, if visitors are having a hard time successfully implementing voice control, OSMP
could work with the community and local dog trainers to set up V/S control classes with the
objective of teaching the behaviors required to meet V/S regulations.
4.3. Standard setting
The 2014 results provide information to OSMP managers and other staff that is useful for
guiding decisions about dog management on OSMP trails and more specifically, to potentially
create new standards for which future monitoring projects would be designed to measure success
or failure. The 2014 overall system-wide Tag Program compliance rate indicates that about
two-thirds of dog guardians met the requirements while in the observation zone.
4.4. Perception of Effects
Past research suggests that land managers often differ from visitors in their perception (types and
level of impact) and their evaluation or interpretation of such impacts (positive or negative)
(Farrell et al., 2001; Kim et al., 2003; White et al., 2001). For example, a dog approaching an
oncoming hiker without permission may be interpreted by agency management as unacceptable
while some visitors may view the interaction as beneficial to their enjoyment. Or, different
visitors on the trail may have different views on the same observed visitor/dog behavior.
When a disparity exists between land manager and public perceptions of system conditions,
conflict and distrust can arise as visitors may believe that the agency is “creating problems”
when, from the visitor perspective, there aren’t any problems to address (Dorwart et al. 2004).
As managers work to address the perceived problems, perhaps through visitor regulation or
enforcement, frustration on both sides has the potential to escalate and contribute to an
unproductive relationship. Manning (1999) states “objective and systematically collected
information is needed from visitors about what defines satisfying recreation experiences”.
Therefore, it is critical that land managers work with their stakeholders to identify the range of
perceived conditions, how these may differ from the agency perspective, and to work toward
management strategies that most stakeholders can support.
This difference of opinion has been part of community dog regulation discussions for many
years. For example, current project results indicate that of all the visitor parties with an off-leash
dog that passed or interacted with another dog, 87% of these parties resulted in compliance with
the regulation not to charge, chase or otherwise display aggression toward another dog.
However, in essence, this means that more than 1 out of 10 visitor parties had a noncompliant
interaction with another dog. Some people may think this is acceptable and some people may
think this is unacceptable.

Discussion
38 | P a g e
4.5. Management suggestions
Visitor and dog management has the potential to be contentious, particularly for public agencies.
Decision-making often requires scientifically collected data and in-depth community
conversations. Because OSMP has no established ranges of acceptability for visitor and dog
behaviors, debate and frustration about what should or shouldn’t be considered “ok” continue.
Working toward resolution will require agreement on ranges of acceptability for measured
indicators and metrics. OSMP could also consider adding more details or examples of what is
prohibited to the B.R.C. definitions and further clarification of “out of sight” (e.g., dog walking
behind a person or ahead, how far).
The City Charter section of the B.R.C. describes the purposes of open space (B.R.C. Article XII,
section 176) but includes no priorities or rankings. This has been interpreted to mean that equal
weight should be given to all purposes, including recreation opportunities and ecological
conservation. Because the on-going community conversations regarding visitor and dog
management often involve whether or not acceptable recreation access is given and/or
unacceptable ecological change is occurring, OSMP would benefit from defining acceptable
conditions or changes and implementing studies as needed to determine whether or not
conditions are acceptable.
Lastly, the population of Boulder County and visitation to OSMP has increased over time (City
of Boulder 2005). Thus, gaining a shared understanding with the community on what successful
dog management looks like will be beneficial to all OSMP stakeholders. Successful
management of this activity will likely need to include broadly accepted objectives with
measurable attributes and ranges of acceptable conditions. Without these, there could be a need
to modify future visitor patterns and designations because of (then perceived) unacceptable
impacts of past and current generations. Creating new visitor regulations or restrictions in the
future could be considered not fair to existing or future economic supporters of the OSMP
system.

Recommendations
39 | P a g e
5.0 Recommendations
Adaptive management often necessitates adjustments to initial management strategies based on
information acquired through monitoring. This monitoring project evaluated a set of dog
management regulations across the OSMP system. The results presented in the preceding
sections are intended to inform conversations to identify which dog regulations are working and
areas for improvement with current visitor and dog management strategies. The
recommendations outlined below are provided to help refine these strategies to move toward
success with recreation/dog management objectives while maintaining high quality visitor
experiences and natural resource conditions on OSMP.
5.1. Further develop decision-making strategies for dog management
As part of the VMP (City of Boulder 2005, Table 4.1), an approach was developed to assess and
manage for dogs on OSMP lands (Appendix A). This approach was based upon the four
management areas and intended to be used during future TSA planning efforts. This approach
could be further developed to provide more clarity and definitions from which to make dog
management decisions during each TSA process. For example, specific recommendations for
behavior within certain habitat types (rather than entire management areas) or particular areas to
avoid, such as trails with actively grazing cattle, could be directly stated.
5.2. Implement strategies to maximize visitor compliance with dog regulations
A few recommended strategies to maximize visitor compliance with dog regulations include:
1. Develop a comprehensive recreation management strategy/plan which includes
recreation/dog management objectives and ranges of acceptability.
2. Undertake a visitor study to better understand the factors that contribute to
decision-making by dog guardians with regards to how they choose to manage their dogs.
Such an understanding can foster a productive relationship between OSMP and dog
guardians and could contribute to the design of strategic actions to achieve OSMP’s
recreation/dog management objectives.
3. Better define the “problem”, and implement strategies to inform visitors specifically
about the “problem” from the OSMP perspective. Strategies might include new
education modules, hands-on workshops, hikes or the development of new messages and
signs along the trail.
4. Continue to encourage reporting by rangers, other field staff and volunteer trail guides of
dog interactions observed on the system. This kind of information can be helpful at
identifying areas for rapid response before patterns of incompatible behaviors become
established and more difficult to change.
5. Better define the rules; remove “gray areas” as feasible. For example, tag program rules
could directly state whether or not dogs travelling behind a guardian is allowed or at what
distance or under what conditions (e.g. dog is ahead around a bend in the trail) the dog is
no longer under “sight” control.
6. Develop a shared departmental perspective on interpreting the more subjective
components of V/S control. Use this shared understanding to reduce the subjectivity of
regulations.

Recommendations
40 | P a g e
7. Develop formal OSMP guidelines for dog etiquette/expectations for behavior on the trail.
8. Be transparent and direct about what is the law and what is trail etiquette.
5.3. Increase dog guardians’ voice control skills
When attempting to use voice control to manage their dog, 77% of the visitor parties were
successful in 2014. This observation suggests that some dog guardians and their dogs did not
show (and may not have) the skills necessary to comply with the level of immediacy expected
for voice control. If this is true, strategies aimed at increasing guardians’ and their dogs’ skill in
using voice control should improve compliance with this component of the V/S rules.
To foster community acceptance and participation in increasing voice control success, OSMP
could sponsor specific dog training classes aimed at promoting voice control skills. Training
sessions could be organized by OSMP as part of the department’s outreach and education efforts
working in conjunction with experienced dog trainers to teach and relate common control
challenges and possible training techniques to improve voice control.
5.4. Re-test observer variability and review the methods during each data collection interval
During the 2014 dog monitoring set-up, staff conducted lengthy office and field tests to establish
shared definitions and protocols. Great care was taken in reducing inter-observer variability and
the amount of perceived subjectivity in data collection efforts. As new field technicians are
hired, re-testing and review of the methods will need to occur based upon the variability
observed between the new set of field staff assigned to the project. When working on any
revisions to existing protocols, project staff should consider a critical peer-review by experts in
the Recreation Management and Animal Behavior fields.
5.5. Refine analysis techniques and database structure
As time passes, new or unmet data and/or analysis needs will become apparent. A few ideas to
consider are:
Develop additional spatial and non-spatial analyses techniques to evaluate the dog
monitoring data including:
o Assess compliance by geographic sub-set such as existing OSMP management areas or
by dog visitation volume;
o Assess the locations of noncompliant events and identify “hot spots”; and
o Develop dog management indicators or metrics that integrate spatial information on
resources of interest such as trail condition or visitor infrastructure (such as doggie
stations).
Refine the dog monitoring GIS database to provide quick and easy reporting and display of
desired data;
Revise the database to be more efficient and useful based upon project revisions that
occurred along the way.

Recommendations
41 | P a g e
5.6. Consider developing new dog monitoring indicators related to ecological health and visitor
quality
There is potential for dogs to negatively impact ecological resources and/or the quality of the
visitor experience. This project specifically included chasing wildlife as an observed behavior,
but other indicators of ecological health could be developed. For example, OSMP could
consider developing new monitoring indicators that would measure pertinent components of
ecological health in relation to various dog regulations such as: dominant species cover and
condition; total non-native species cover; wildlife status and water quality. Relationships
between the ecological datasets and dog datasets could be explored with geospatial and statistical
analyses. If OSMP would like to better understand the relationship between recreation with dogs
and ecological conditions and/or change, formal research work is suggested.
OSMP could develop a potential new “social impact” indicator designed to understand the level
of acceptability with “dog or guardian behavior X” or the number of unpleasant dog encounters
during a visitor trip using a social norm curve (Figure 16, adapted from Manning 2011). This
new indicator could be informed through visitor inquiry, on-site surveys, community
conversations and other public input and then systematically measured through various
monitoring studies. Results from these types of inquiries could contribute to future
discussions/creation of behavioral ranges of acceptability.
Figure 16. Social norm curve applied to the number of unpleasant dog encounters
within one visitor trip
Recommendations
42 | P a g e
5.7. Consider developing new dog monitoring indicators and studies related to understanding the
benefits of recreating with dogs
OSMP could conduct formal studies to understand the benefits of recreating with dogs from the
community perspective. Having the Tag Program in place encourages people to spend
time/exercise with their dogs and doing so can lead to various benefits including:
Sense of well-being;
Higher quality of life;
Improving dog and human health;
Socialization for dog and guardian;
Bonding time between dog and guardian;
Personal visitor safety.
5.8. Conduct a study aimed at understanding barriers to compliance with dog regulations on
OSMP
OSMP could formally conduct research into the barriers to compliance with dog regulations both
from the visitor perspective and from the agency perspective. Because these two perspectives
necessarily operate together (not in isolation), both perspectives should wholly be taken into
account when attempting to understand compliance barriers.
5.9. Consider communication recommendations from published literature
Numerous researchers have put together summaries of steps managers and communication teams
can take to foster effective communications and visitor management success (Miller et al. 2001,
Dowart et al. 2004).
A few of these include (Adapted from Miller et al. 2001 and Dowart et al., 2004):
1. Teach how to recognize situations where visitor behavior is contributing to
unacceptable conditions, such as dogs chasing wildlife.
2. Illustrate ideal situations and desired behaviors, such as asking permission before
your dog approaches another visitor party.
3. Emphasize individual responsibility and behavioral accountability, such as not
responding with “He’s friendly” when your dog approaches/jumps on another visitor
(they may not like it).
4. Collaborate with local opinion leaders and stakeholders to foster peer education and
promotion of recommended behaviors, such as FIDOS sponsoring educational
opportunities modeling tag program expectations.
5. Determine what conditions and impacts your visitors perceive and are concerned
about, such as directly asking “what do you see” and “why does it matter”.
6. Be explicit and transparent about the rationale underlying management decisions and
policies, such as clearly stating why certain trails are dogs prohibited or why a given
trail’s dog management regulation may be changing (share with staff and volunteers
so they can respond correctly when asked).

Recommendations
43 | P a g e
OSMP could also support and encourage further research focused on assessing visitors'
perceptions of conditions, how they attribute responsibility and how they affect visitor
experience quality.
References Cited
44 | P a g e
Abrantes, R. 1997. Dog language: An encyclopedia of canine behavior. S. Whitehead (Ed.).
Naperville, ILL: Wakan Tanka Publishers.
Ajzen, I. 2006. Constructing a TpB questionnaire: Conceptual and methodological
considerations
Borrie, William T. and Harding, James A. 2002. Effective recreation visitor communication
strategies: Rock climbers in the Bitterroot Valley, Montana. U.S. Department of Agriculture,
Forest Service, Rocky Mountain Research Station. RMRS-RN-15.
Bunin, J. E. 1985. Vegetation of the City of Boulder, Colorado Open Space Lands. Unpublished
report available from
http://www.bouldercolorado.gov/files/openspace/pdf_gis/IndependentResearchReports/1292
_Bunin_Jane_Vegetation.pdf (accessed April 2013).
City of Boulder, Open Space and Mountain Parks Department. 2005. City of Boulder Open
Space & Mountain Parks Visitor Master Plan. Available from
http://www.bouldercolorado.gov/index.php?option=com_content&task=view&id=3067&Ite
mid=1128 (accessed April 2013).
City of Bouder, Open Space and Mountain Parks Department. 2011. Voice and Sight Tag
Program Monitoring Report. Available from https://www-
static.bouldercolorado.gov/docs/voice-sight-tag-program-monitoring-report-1-
201304101211.pdf (accessed July 2014).
City of Bouder, Open Space and Mountain Parks Department. 2012. Visitor Survey Report.
Available from https://www-static.bouldercolorado.gov/docs/2010-11-visitor-survey-report-
1-201304101153.pdf (accessed August 2014).
Cooper, D.J. 1984. Vegetation of the Mountain Parks. Pages 5-33 in D. J. Cooper, editor.
Ecological survey of the City of Boulder, Colorado Mountain Parks. Available from
http://www.bouldercolorado.gov/files/openspace/pdf_gis/IndependentResearchReports/249_
Cooper_David_Ecological.pdf (accessed April 2013).
Donnelly, M.P., Vaske, J.J., and Shelby, B. 2000. Toward an understanding of norm prevalence:
A comparative analysis of 20 years of research. Journal of Environmental Management 25:
No 4, p. 403-414.
Dorwart, Catherine E., Leung, Yu-Fai and Moore, Roger. 2004. Managing visitors' perceptions:
find out why park managers need to understand how a visitor perceives recreation resource
impacts. Journal of Park and Recreation Administration. Accessed online July 10, 2008.
http://www.nrpa.org/content/default.aspx?documentId=916
Edwards, V. and Knight, S. 2006. Understanding the psychology of walkers with dogs: New
approaches to better management. University of Portsmouth; Portsmouth, England.

References Cited
45 | P a g e
Farrell, T., Hall, T., and White, D. 2001. Wilderness campers' perception and evaluation of
campsite impacts. Journal of Leisure Research, 33(3), 229-250.
Gamer, M., Lemon, J., Fellows, I., Singh, P. 2012. Various coefficients of interrater reliability
and agreement. R package v 1.1-5. See http://cran.r-project.org/package=irr.
Gramann, J. and G. Vander Stoep. 1986. Reducing depreciative behavior at Shiloh National
Military Park. Technical Report No. 2. Prepared for Shiloh National Military Park and
National Park Service. CA 7029-5-0006.
Gramann, J. H. and Vander Stoep, G. A. 1987. Prosocial behavior theory and natural resource
protection: a conceptual synthesis. Journal of Environmental Management, 24, 247-257.
Hardin, Garrett. 1968. The tragedy of the commons. Science, Volume 162, pp. 1243-1248.
Hendee, J.C., Stankey, G.H. and Lucas, R.C. 1978. Wilderness Management. USDA Forest
Service Misc. Publication No. 1365, 381p. Washington, D.C.
Hendee, J.C., Stankey, G.H. and Lucas, R.C. 1990. Wilderness Management, 2nd ed. North
American Press: Golden, CO.
Hendee, J.C., and C.P. Dawson. 2002. Wilderness Management: Stewardship and Protection of
Resources and Values. Third edition. Fulcrum Publishing, Golden, Colorado.
Horowitz, A. C. 2009. Attention to attention in domestic dogs (Canis familiaris) dyadic play.
Animal Cognition, 12, 107-118.
Horowitz, A. C., & Bekoff, M. 2007. Naturalizing anthropomorphism: Behavioral prompts to
our humanizing of animals. Anthrozoös, 20, 23-35.
Kim, S., Lee, C.H., and Shelby, B. 2003. Utilization of photographs for determining impact
indicators for trail management. Environmental Management, 32(2), 282-289.
Ladha, C., Hammerla, N., Hughs, E., Olivier, P., & Plötz, T. 2013, September 8-12. Dog’s life:
Wearable activity recognition for dogs. Paper presented at ACM International Joint
Conference on Pervasive and Ubiquitous Computing (UbiComp), Zurich, Switzerland.
Landis J.R. and G.G. Koch. 1977. The measurement of observer agreement for categorical data.
Biometrics 33:159–174.
Manning, R.E. 1999. Studies in outdoor recreation: Search and research for satisfaction (2nd
Ed.). Corvallis, OR: Oregon State University Press.
Manning, R.E. 2011. Studies in outdoor recreation: Search and research for satisfaction (3rd
Ed.). Corvallis, OR: Oregon State University Press.
References Cited
46 | P a g e
Marion, J. and S. Reid. 2007. Minimizing visitor impacts to protected areas: The efficacy of low
impact education programmes. Journal of Sustainable Tourism, 15, No.1, 23p.
Marion, J., R. Dvorak, and R. Manning. 2008. Wildlife Feeding in Parks: Methods for
Monitoring the Effectiveness of Educational Interventions and Wildlife Food Attraction
Behaviors. Human Dimensions of Wildlife 13: 429-442.
McGuire, W.J. 1985. Attitudes and attitude change. In G. Lindzey and E. Aronson (Eds.) The
Handbook of Social Psychology (3rd ed. vol. 2). New York: Random House.
Miller, Theron. A.; Borrie, William T.; Harding, James A. 2001. Basic knowledge of factors that
limit the practice of low-impact behaviors. Unpublished report on file at: U.S. Department of
Agriculture, Forest Service, Rocky Mountain Research Station, Aldo Leopold Wilderness
Research Institute, Missoula, MT. 182 p.
Namba, R., Dustin, D. 1992. Towards new definitions of depreciative behaviour and vandalism,
in: H. H. Christensen (Ed.) Vandalism: Research, Prevention and Social policy, pp. 62–69.
National Research Center. 2010. City of Boulder Open Space and Mountain Parks Resident
Survey Report of Results. National Research Center, Boulder, CO.
Nesbitt, R. 2006. Toward an understanding of noncompliant behavior in outdoor recreation:
linking the theory of planned behavior to off-leash dogs at William B. Umstead State Park.
Master’s Thesis. North Carolina State University, Raleigh, North Carolina.
Nied, S., Lemly, J., Siemers, J., Decker, K., and D. Culver. 2009. Survey of critical biological
resources in Boulder County, Colorado 2007-2008. Colorado Natural Heritage Program, Fort
Collins, CO. Available from
http://www.cnhp.colostate.edu/download/documents/2009/BoulderCoReportFINAL_6-26-
2009.pdf l (accessed April 2013).
Petty, R.E., and Cacioppo, J.T. 1986. Communication and persuasion: Central and peripheral
routes to attitude change. New York: Springer-Verlag.
Petty, R. E., & Wegener, D. T. 1999. The Elaboration Likelihood Model: Current status and
controversies. In S. Chaiken & Y. Trope (Eds.), Dual process theories in social psychology
(pp. 41–72). New York: Guilford.
Public Information Corporation. 2004. City of Boulder Open Space and Mountain Parks
Attitudinal Survey Report. Public Information Corporation, Littleton, CO.
R Development Core Team. 2011 R: a language and environment for statistical computing,
2.15.1 ed. Vienna, Austria: R Foundation for Statistical Computing.
Revelle, W. 2014 psych: Procedures for Personality and Psychological Research, Northwestern

References Cited
47 | P a g e
University, Evanston, Illinois, USA, http://CRAN.R-project.org/package=psych Version =
1.4.8.
Roggenbuck, J.W. 1992 Use of persuasion to reduce resource impacts and visitor conflicts. In
M.J. Manfredo (ed.) Influencing Human Behavior: Theory and Applications on Recreation,
Tourism, and Natural Resources Management (pp. 149–208). Champaign, IL: Sagamore.
Sim J. and C. Wright. 2005. The Kappa statistic in reliability studies: Use, interpretation, and
sample size requirements. Physical Therapy 85(3):257-268.
Stern, P. 2000. Toward a coherent theory of environmentally significant behavior. Journal of
Social Issues, Vol. 56, No. 3, 2000, pp. 407-424.
VanderWoude, D. and R. Magtanong. 2015. Tag Program and Leash Regulations Monitoring
Protocol. Unpublished document created for the City of Boulder Open Space and Mountain
Parks Department. Boulder, Colorado. Available from OSMP upon request.
Vas, J., Topál, J., Gácsi, M., Miklósi, A., & Csányi, V. 2005. A friend or an enemy? Dogs’
reaction to an unfamiliar person showing behavioural cues of threat and friendliness at
different times. Applied Animal Behaviour Science, 94, 99-115.
Vaske, J. J. and M. P. Donnelly, M. P. 1999. A value-attitude-behavior model predicting
wildland voting intentions. Society and Natural Resources, 12, 523-537.
Vaske, J. J., L. B. Shelby, and Donnelly, M. P. 2009. Estimating visitation to Boulder Open
Space and Mountain Parks. (HDNRU Report No. 80). Report for Boulder Open Space and
Mountain Parks. Human Dimensions of Natural Resources, Colorado State University, Fort
Collins, Colorado.
Viera, A.J. and Garrett, J.M. 2005 Understanding interobserver agreement: The Kappa Statistic.
Family Medicine 37(5): 360-3.
White, D., Hall, T., and Farrell, T. 2001. Influence of ecological impacts and other campsite
characteristics on wilderness visitors' campsite choices. Journal of Park and Recreation
Administration, 19(2), 83-97.
Widner-Ward, J.C. and J.W. Roggenbuck. 2003. Understanding park visitors’ responses to
interventions to reduce petrified wood theft. Journal of Interpretive Research, 8: 67-82.
Williams, K. J. H., Weston, M.A. , Henry, S. and Maguire, G.S. 2009. Birds and beaches, dogs
and leashes: Dog owners' sense of obligation to leash dogs on beaches in Victoria, Australia,
Human Dimensions of Wildlife, 14: 2, 89-101.
Online references
B.R.C. https://www.municode.com/library/co/boulder/codes/municipal_code accessed 02/2015
Social science methods http://www.socialresearchmethods.net/, accessed 12/2014

References Cited
48 | P a g e
http://psychology.about.com/od/nindex/g/naturalistic.htm
http://writing.colostate.edu/guides/page.cfm?pageid=1386

Appendices
49 | P a g e
Appendix A. Management strategies and actions for dog management by management area designation (City of Boulder 2005, p. 53,
Table 4.1).
Passive Recreation
Area Strategies
Natural Area
Strategies
Agricultural Area
Strategies
Habitat
Conservation Area
Strategies
Visitors are strongly
encouraged to keep
dogs on-trail.
Dog management is
predominantly
voice and sight
control.
Dogs on-leash, dogs
prohibited or seasonal
dog requirements may
be implemented.
Visitors are strongly
encouraged to keep
dogs on-trail.
Dog management is
predominantly voice
and sight control.
Dogs on-leash, dogs
prohibited, or seasonal
dog requirements may
be implemented.
Visitors are strongly
encouraged to keep
dogs on-trail.
Dog management is
predominantly voice
and sight control.
Dogs on-leash, dogs
prohibited, dogs on
corridor voice and
sight control, or
seasonal dog
requirements may
be implemented.
Dogs are required to
be on-trail, with
some exceptions
allowing on-corridor
voice-and-sight
control.
Dog management is
predominantly
on-leash.
Dogs on-leash,
Dogs prohibited, dogs
on corridor
voice and sight
control, or
seasonal dog
requirements may
be implemented.

Appendices
50 | P a g e
Appendix B. Glossary of terms
Definitions used in this report are modified specifically for the purpose of the dog management
monitoring project and should not be considered universal except for those quoted from the
Boulder Revised Code.
Boulder Revised Code – Animal Control Related
6-1-2 Definitions
http://www.colocode.com/boulder2/chapter6-1.htm#section6_1_2
"Guardian" means owner.
"Leash" means a chain, rope, cord, or strap with a clip or snap for rapid attachment to a choke
chain, collar, or harness, all the parts of which are of sufficient strength to hold at least four times
the weight of the dog and are suitable for walking the dog and controlling it.
"Owner" means each person who owns an animal. If an animal has more than one owner, all
such persons are jointly and severally liable for the acts or omissions of an animal owner under
this chapter, even if the animal was in possession and control of a keeper at the time of an
offense.
"Voice and sight control" means the ability of a guardian or keeper to adequately control a dog
by using voice commands and sight commands (such as hand gestures). In order for a guardian
or keeper to have voice and sight control over a dog, the guardian or keeper must: (1) be able to
see the dog's actions; and (2) be able to prevent the dog from engaging in the following
behaviors, using voice and sight commands, without regard to circumstances or distractions:
(a) Charging, chasing or otherwise displaying aggression toward any person or behave
toward any person in a manner that a reasonable person would find harassing or disturbing;
(b) Charging, chasing or otherwise displaying aggression toward any dog;
(c) Chasing, harassing or disturbing wildlife or livestock; or
(d) Failing to come to and stay with the guardian or keeper immediately upon command by
such person.
Other Terms
Event: A unit of observation developed to define the parameters for which an observation is
separate from another or the next observation and to define one line item from the next on the
datasheets. Events can be passes, interactions, commands given or out of sight occurrences.
Field of view/Observation zone: The extent of the landscape to be included in the observation.
The field of view includes areas off-trail within the observation zone typically within 180°
equidistant from the observer and to include the depth of field as defined by the flushing
distances of wildlife species included in this study. The field of view is also defined by the
typical visual and auditory observation abilities of a field technician.
Frequency distribution: The number or percent of subjects within each possible response for a
particular variable.

Appendices
51 | P a g e
Inter-rater or Inter-observer reliability: The degree to which different raters/observers give
consistent ratings/estimates of the same phenomenon using the same rating system; variation
which occurs between observers when collecting and interpreting field data.
http://www.socialresearchmethods.net/kb/reltypes.php
Naturalistic observation: A research method commonly used by psychologists and other social
scientists which involves observing subjects in their natural environment. This type of research is
often utilized in situations where conducting lab research is unrealistic, cost prohibitive or would
unduly affect the subject's behavior. http://psychology.about.com/od/nindex/g/naturalistic.htm
Out of sight: The dogs in a visitor party are not within the immediate 360° field of view of the
guardian(s) at all times.
Recreation setting: A combination of the physical, biological, managerial and social conditions
within a recreation area that give value to a place (Clark and Stankey 1979).
Reliability: The extent to which an experiment, test or any measuring procedure yields the same
result on repeated trials. http://writing.colostate.edu/guides/page.cfm?pageid=1386
Sampling Frame: The sampling frame consists of two components: 1) All the OSMP trails with
designated dog opportunities meeting our selection criteria and 2) All the dates and time periods
within the data collection period.
Target Population: The group of interest to be investigated.
Validity: The degree to which a study accurately reflects or assesses the specific concept that the
researcher is attempting to measure. [Colo site]
Visitor trip: A trip to the study area, regardless of how much time a visitor spent on OSMP
during their trip.
Voice and Sight Tag Program: An OSMP program designed to certify dog guardians’
understanding of what “voice and sight” dog management means while visiting OSMP lands.
After watching a video demonstrating what voice and sight dog management means, a dog
guardian can purchase a green tag for their dog allowing them to manage their dog under voice
and sight control in designated areas.

Appendices
52 | P a g e
Appendix C. 2014 study area map

Appendices
53 | P a g e
Appendix D. List of monitoring sites included in 2014 sampling frame listed by Trail Study Area
Site Name Site Type Trail Study Area Visitation Volume Trail Continuum
Bobolink Trail New Both East High Start of Trail
Boulder Creek Path - Foothills Leash Required East Low Interior Trail
Centennial Greenway Both East Low Start of Trail
Cherryvale TH Leash Required East Low Trailhead
Cottontail Trail Leash Required East Low Interior Trail
Cottonwood TH Interview East Low Trailhead
Cottonwood TH Leash Required East Medium Trailhead
Cottonwood Trail Both East Low Start of Trail
Dry Creek Trail New Both East High Interior Trail
East Boulder - Teller Lake ADA Leash Required East Medium Interior Trail
East Boulder-Teller Lake Trail Interview East Medium Start of Trail
East Boulder-Teller Lake North
Trail
Interview East Medium Trailhead
Gunbarrel TH Both East Medium Trailhead
Gunbarrel Trail Both East Medium Interior Trail
KOA Lake Greenway Leash Required East Very Low Interior Trail

Appendices
54 | P a g e
Site Name Site Type Trail Study Area Visitation Volume Trail Continuum
South Boulder Creek at EBCC Both East High Interior Trail
South Boulder Creek Greenway Leash Required East High Start of Trail
Teller Farm TH Both East Medium Trailhead
Teller Farm Trail Both East Medium Interior Trail
*Both means the site was used for the observation and the interview components
Site Name Site Type Trail Study Area Visitation Volume Trail Continuum
Buckingham Park Leash Required North Medium Trailhead
Cobalt Trail Observation North Medium Interior Trail
Degge Trail Both North Medium Start of Trail
Eagle Shelter Both North Medium Interior Trail
Eagle TH Both North Medium Trailhead
Eagle West New Both North Medium Start of Trail
Foothills North Trail Interview North Medium Trailhead
Foothills South/Old Kiln Leash Required North High Interior Trail
Foothills TH New Both North Medium Start of Trail

Appendices
55 | P a g e
Site Name Site Type Trail Study Area Visitation Volume Trail Continuum
Foothills Trail Both North Medium Interior Trail
Fourmile Creek Greenway Both North Low Interior Trail
Hidden Valley Trail Both North Medium Interior Trail
Lefthand Trail Leash Required North Low Interior Trail
Lefthand Trailhead Leash Required North Low Trailhead
Mesa Reservoir Trail Both North Medium Interior Trail
North Rim Trail Both North Low Start of Trail
Old Kiln Trail Leash Required North Medium Interior Trail
Sage TH Both North Medium Trailhead
Sage Trail Both North High Interior Trail
Wonderland Hill Trail Leash Required North Low Start of Trail
Wonderland Lake TH Leash Required North Medium Trailhead
Wonderland Lake Trail Leash Required North High Interior Trail
*Both means the site was used for the observation and the interview components
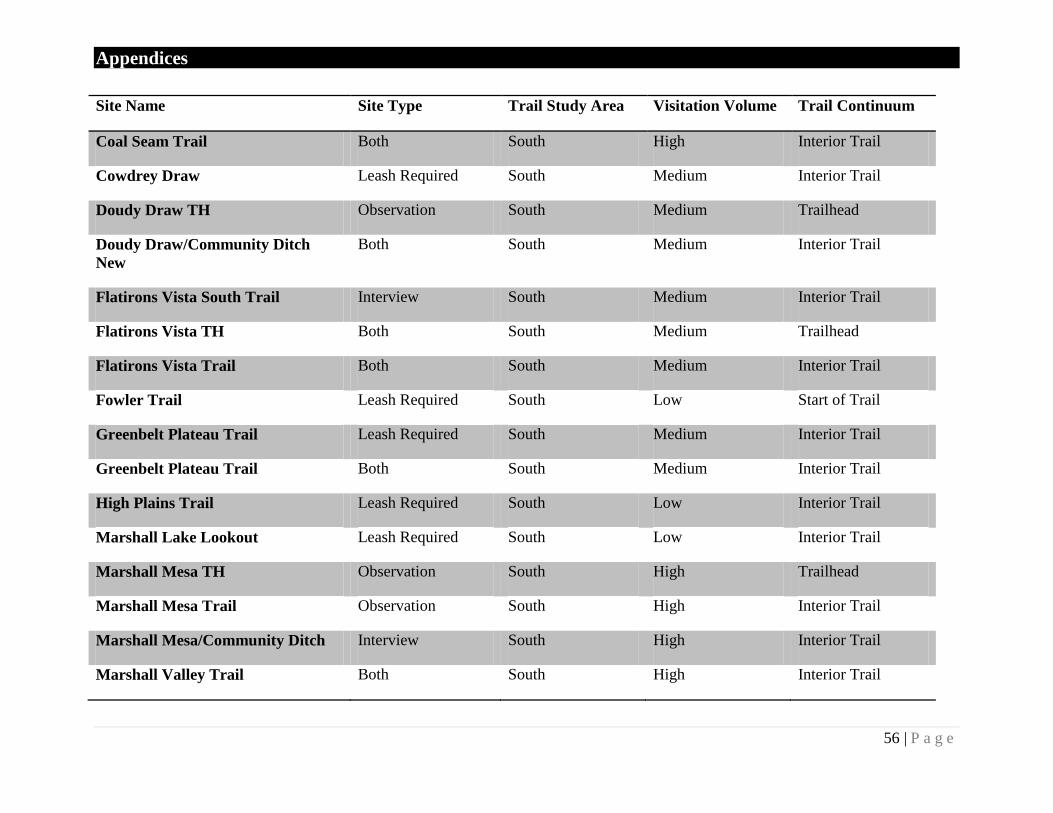
Appendices
56 | P a g e
Site Name Site Type Trail Study Area Visitation Volume Trail Continuum
Coal Seam Trail Both South High Interior Trail
Cowdrey Draw Leash Required South Medium Interior Trail
Doudy Draw TH Observation South Medium Trailhead
Doudy Draw/Community Ditch
New
Both South Medium Interior Trail
Flatirons Vista South Trail Interview South Medium Interior Trail
Flatirons Vista TH Both South Medium Trailhead
Flatirons Vista Trail Both South Medium Interior Trail
Fowler Trail Leash Required South Low Start of Trail
Greenbelt Plateau Trail Leash Required South Medium Interior Trail
Greenbelt Plateau Trail Both South Medium Interior Trail
High Plains Trail Leash Required South Low Interior Trail
Marshall Lake Lookout Leash Required South Low Interior Trail
Marshall Mesa TH Observation South High Trailhead
Marshall Mesa Trail Observation South High Interior Trail
Marshall Mesa/Community Ditch Interview South High Interior Trail
Marshall Valley Trail Both South High Interior Trail

Appendices
57 | P a g e
Site Name Site Type Trail Study Area Visitation Volume Trail Continuum
Post Office Access Leash Required South Very Low Start of Trail
Prairie Vista Trail Both South Medium Start of Trail
Spring Brook Loop North Leash Required South Medium Interior Trail
*Both means the site was used for the observation and the interview components
Site Name Site Type Trail Study Area Visitation Volume Trail Continuum
1st/2nd Flatiron Trail Interview West Medium Interior Trail
Amphitheater Trail Both* West Medium Start of Trail
Amphitheater Trail Leash Required West Medium Start of Trail
Anemone Trail Both West Medium Interior Trail
Baseline Trail Interview West Medium Interior Trail
Baseline/Bluebell-Baird Leash Required West Medium Trailhead
Bear Peak West Ridge/Bear Canyon Leash Required West Medium Interior Trail
Bluebell - Baird Trail Both West Medium Interior Trail
Bluebell Road Both West High Interior Trail
Centennial TH Both West Medium Trailhead

Appendices
58 | P a g e
Site Name Site Type Trail Study Area Visitation Volume Trail Continuum
Chapman TH Both West Low Trailhead
Chapman Trail Leash Required West Low Start of Trail
Chautauqua Trail Interview West High Interior Trail
Contact Corner Trail + Spurs Both West Low Start of Trail
Crown Rock TH Observation West Medium Trailhead
Crown Rock Trail Both West Medium Start of Trail
Dakota Ridge Trail Leash Required West Medium Start of Trail
Dakota Ridge Trail Both West Medium Interior Trail
E.M. Greenman Leash Required West Medium Interior Trail
East Ridge Trail Both West High Interior Trail
Eldorado Canyon Trail Leash Required West Low Interior Trail
Enchanted Mesa Trail Both West Medium Interior Trail
Fern Canyon Trail Observation West Medium Interior Trail
Fern Meadow - Cragmoor Trail Observation West Low Start of Trail
Flagstaff Trail Both West Low Interior Trail
*Both means the site was used for the observation and the interview components

Appendices
59 | P a g e
Site Name Site Type Trail Study Area Visitation Volume Trail Continuum
Flatirons Loop Trail Both West Medium Interior Trail
Four Pines TH Both West Low Trailhead
Four Pines Trail Both West Low Start of Trail
Goat Trail Observation West Low Start of Trail
Green Mountain West Ridge/Green
Bear
Leash Required West Medium Interior Trail
Gregory Canyon Trail Both West Medium Interior Trail
Homestead Leash Trail Leash Required West Medium Interior Trail
Homestead Trail Observation West Medium Interior Trail
Homestead/Mesa Trail Interview West Medium Interior Trail
Kohler Mesa Trail Both West Low Interior Trail
Lehigh Connector - South Trail Both West Low Start of Trail
Lost Gulch Trail Leash Required West Medium Trailhead
Lower Big Bluestem/Bluestem
Connector
Leash Required West Low Interior Trail
Mallory Cave Trail Both West Low Interior Trail
Mesa/Bear Canyon-NCAR Trail Interview West Medium Interior Trail
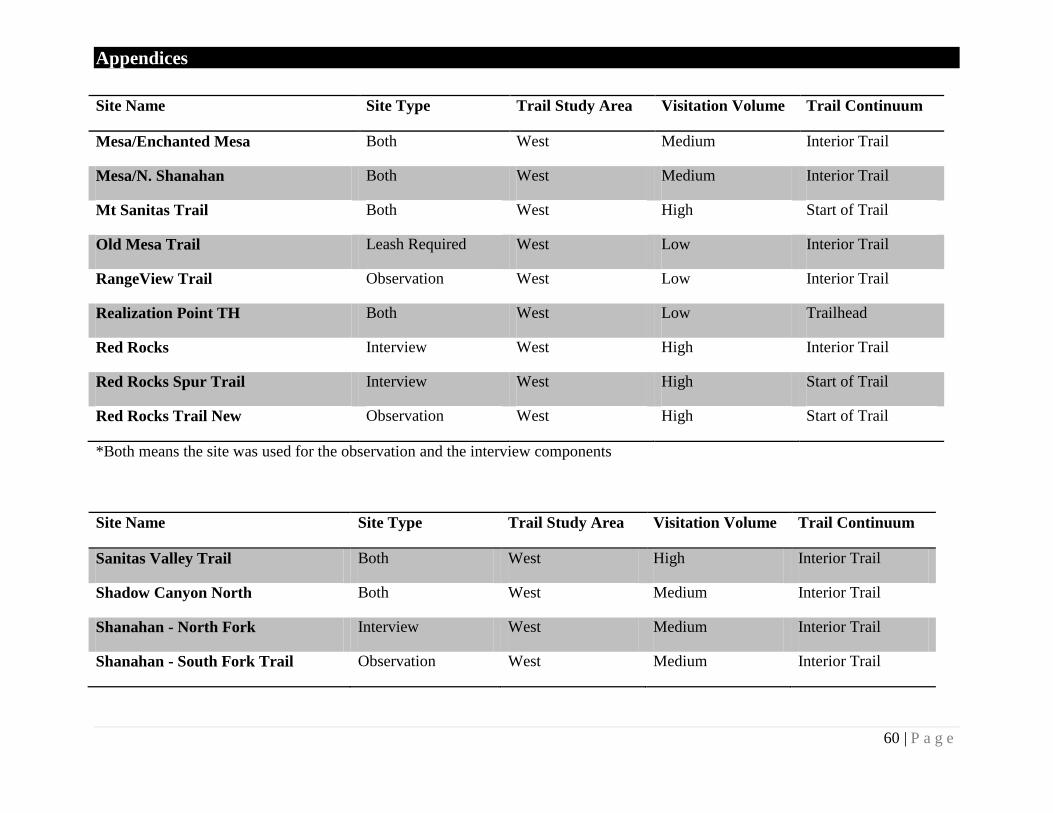
Appendices
60 | P a g e
Site Name Site Type Trail Study Area Visitation Volume Trail Continuum
Mesa/Enchanted Mesa Both West Medium Interior Trail
Mesa/N. Shanahan Both West Medium Interior Trail
Mt Sanitas Trail Both West High Start of Trail
Old Mesa Trail Leash Required West Low Interior Trail
RangeView Trail Observation West Low Interior Trail
Realization Point TH Both West Low Trailhead
Red Rocks Interview West High Interior Trail
Red Rocks Spur Trail Interview West High Start of Trail
Red Rocks Trail New Observation West High Start of Trail
*Both means the site was used for the observation and the interview components
Site Name Site Type Trail Study Area Visitation Volume Trail Continuum
Sanitas Valley Trail Both West High Interior Trail
Shadow Canyon North Both West Medium Interior Trail
Shanahan - North Fork Interview West Medium Interior Trail
Shanahan - South Fork Trail Observation West Medium Interior Trail

Appendices
61 | P a g e
Site Name Site Type Trail Study Area Visitation Volume Trail Continuum
Shanahan Connector Both West Medium Interior Trail
Shanahan Ridge Both West Medium Start of Trail
Shanahan -South Fork/Mesa Trail Interview West Medium Interior Trail
Skunk Canyon Trail Both West Medium Interior Trail
South Boulder Creek West TH Both West Medium Trailhead
South Boulder Creek West Trail Both West Medium Interior Trail
South Mesa TH Both West High Trailhead
South Mesa Trail New Observation West High Interior Trail
South Mesa/Big Bluestem Interview West Medium Interior Trail
Sunshine Canyon Trail Both West Medium Interior Trail
Tenderfoot Trail Both West Low Interior Trail
Upper Chautauqua Trail Both West High Interior Trail
Ute Trail Both West Low Interior Trail
Viewpoint TH Interview West Low Trailhead
Viewpoint Trail Both West Low Interior Trail
*Both means the site was used for the observation and the interview components

Appendices
62 | P a g e
Appendix E. OSMP management area designations summer 2014

Appendices
63 | P a g e
Appendix F. OSMP Trail Study Areas summer 2014

Appendices
64 | P a g e
Appendix G. Photo map example

Appendices
65 | P a g e
Appendix H. Voice and sight datasheets and codes
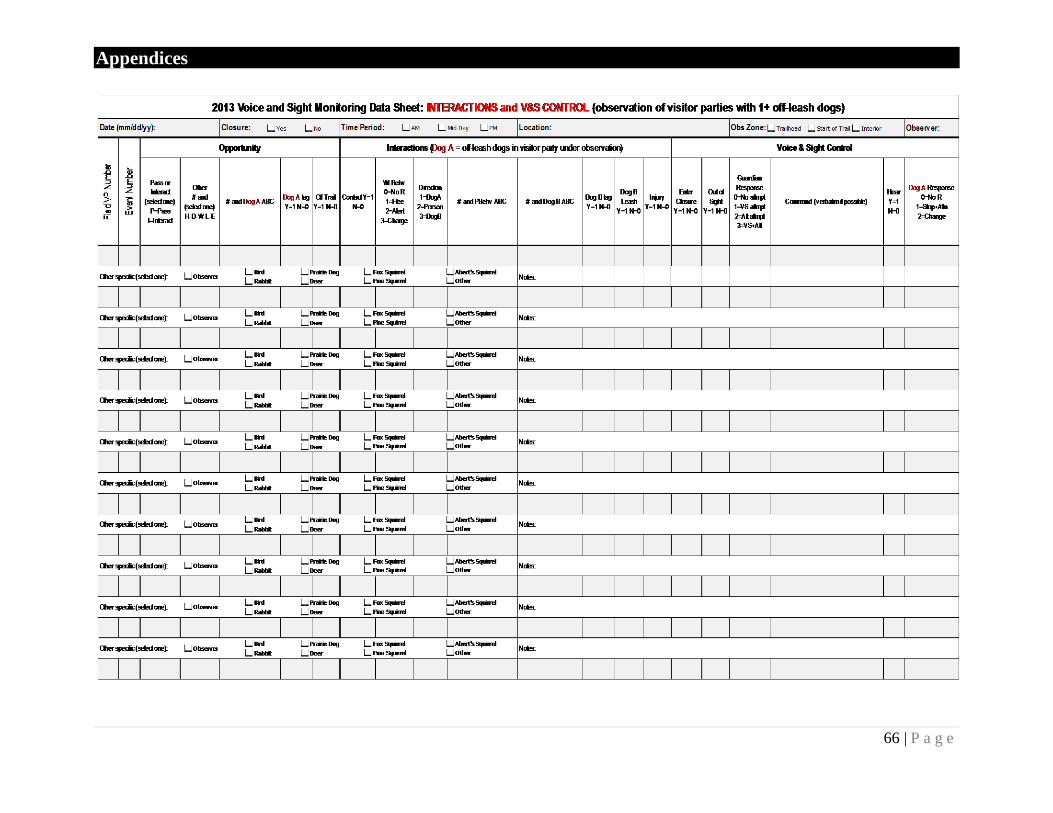
Appendices
66 | P a g e

Appendices
67 | P a g e
PERSON
BEHAVIOR DEFINITION
EXAMPLES
RELEVANT B.R.C
CODE
No behavior observed N/A
Verbal invitation
Vocalizations (e.g. words, whistles,
sounds etc.) directed towards the
dog ; “attention-getting” (Horowitz
& Bekoff 2007); could be initiated
or response
Approaching visitor says "Oh
my gosh, you are so cute.
Come here!"
Physical invitation
Hand and/or arm is extended away
from the person’s body and
towards the dog; “contact seeking”
(Vas et al 2005); could be initiated
or response
Approaching visitor kneels
down and extends arm toward
oncoming dog
Avoidance Moving away, head/body averted,
hands up palms out
Approaching visitor steps
laterally away or off-trail to
avoid contact with oncoming
dog
Verbal protest
Verbal statements and/or noises
accompanied by gestures (hands up
palms out, shaking head, etc)
directed towards dog and/or
guardian expressing objection to
dog presence and/or behavior
Approaching visitor says
"Keep your dog away from
me"
Physical protest Body movements directed towards
getting dog to stop the behavior or
Approaching visitor kicks leg
out to get dog away from

Appendices
68 | P a g e
PERSON
BEHAVIOR DEFINITION
EXAMPLES
RELEVANT B.R.C
CODE
for harming the dog his/her feet
Other Any other behavior observed
DOG BEHAVIOR DEFINITION EXAMPLES RELEVANT B.R.C
CODE
No behavior observed N/A
Jumping/pawing
PHYSICAL CONTACT
REQUIRED; A jumping or pawing
dog is one with movements
between the moment the paws
leave the floor until they are back
in contact with the ground (Ladha
et al 2013) (front or all paws) with
front paws working independently
of each other. A pawing action
corresponds to repeated backwards
pulls toward the dog’s belly and
hind legs of a single paw (Ladha et
al 2013)
A dog jumps up and makes
physical contact with another
human; a dog paws a child's
legs as he/she walks by
6-1-16. Dogs Running at
Large Prohibited.
6-1-20. Aggressive
Animals Prohibited.
(Would need to be
combined with a negative
response from receiving
party or a prohibited
behavior to be considered
violation)
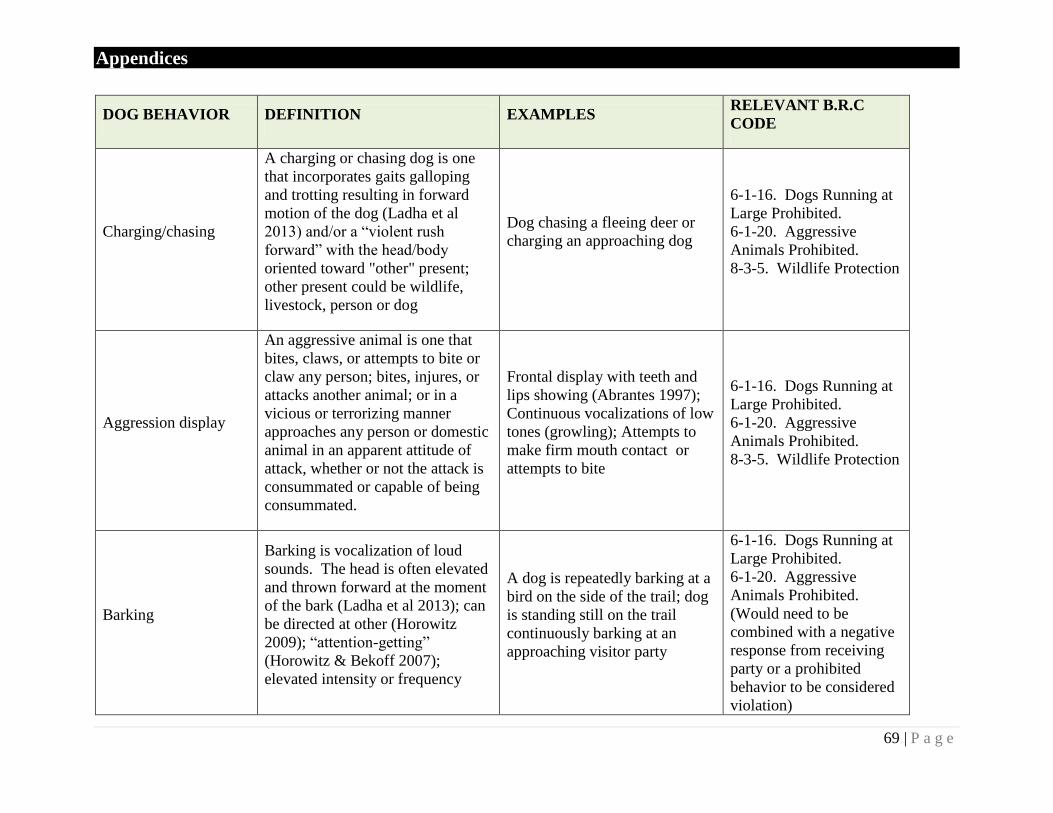
Appendices
69 | P a g e
DOG BEHAVIOR DEFINITION EXAMPLES RELEVANT B.R.C
CODE
Charging/chasing
A charging or chasing dog is one
that incorporates gaits galloping
and trotting resulting in forward
motion of the dog (Ladha et al
2013) and/or a “violent rush
forward” with the head/body
oriented toward "other" present;
other present could be wildlife,
livestock, person or dog
Dog chasing a fleeing deer or
charging an approaching dog
6-1-16. Dogs Running at
Large Prohibited.
6-1-20. Aggressive
Animals Prohibited.
8-3-5. Wildlife Protection
Aggression display
An aggressive animal is one that
bites, claws, or attempts to bite or
claw any person; bites, injures, or
attacks another animal; or in a
vicious or terrorizing manner
approaches any person or domestic
animal in an apparent attitude of
attack, whether or not the attack is
consummated or capable of being
consummated.
Frontal display with teeth and
lips showing (Abrantes 1997);
Continuous vocalizations of low
tones (growling); Attempts to
make firm mouth contact or
attempts to bite
6-1-16. Dogs Running at
Large Prohibited.
6-1-20. Aggressive
Animals Prohibited.
8-3-5. Wildlife Protection
Barking
Barking is vocalization of loud
sounds. The head is often elevated
and thrown forward at the moment
of the bark (Ladha et al 2013); can
be directed at other (Horowitz
2009); “attention-getting”
(Horowitz & Bekoff 2007);
elevated intensity or frequency
A dog is repeatedly barking at a
bird on the side of the trail; dog
is standing still on the trail
continuously barking at an
approaching visitor party
6-1-16. Dogs Running at
Large Prohibited.
6-1-20. Aggressive
Animals Prohibited.
(Would need to be
combined with a negative
response from receiving
party or a prohibited
behavior to be considered
violation)

Appendices
70 | P a g e
DOG BEHAVIOR DEFINITION EXAMPLES RELEVANT B.R.C
CODE
8-3-5. Wildlife Protection
Default values
Code# Description Example
999 Missing value
Observer forgets to code
variable
777 Unsure
Observer is unsure dog
pooped
555 Not applicable Tag display for leashed dog
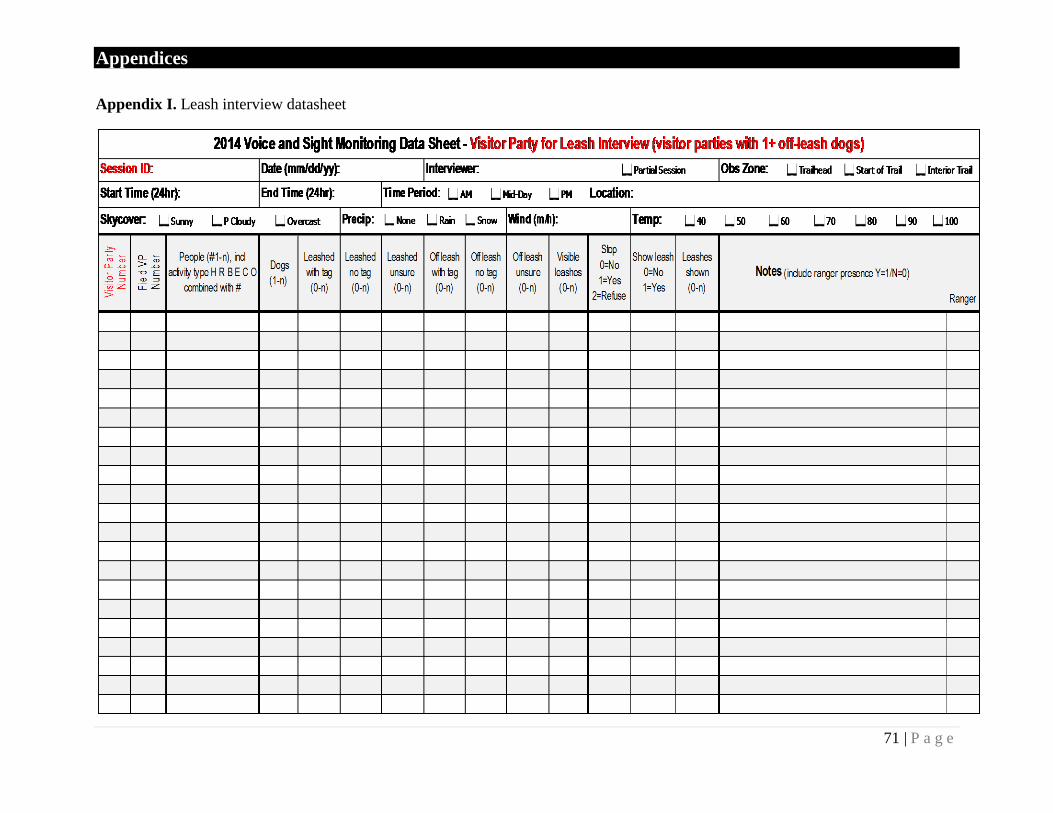
Appendices
71 | P a g e
Appendix I. Leash interview datasheet

Appendices
72 | P a g e
Appendix J. Leash required datasheet

Appendices
73 | P a g e
Appendix K. Rationale for 2014-2018 Monitoring Design
Staff were asked by City Council and the Open Space Board of Trustees to re-design the tag
monitoring project for 2013-2017 (post-flood dates changed to 2014-2018). Since the ordinances
related to voice and sight control in the Boulder Revised Code (B.R.C.) do not provide definitive
measurable parameters by which a guardian must “adequately control a dog using voice and
sight commands” (B.R.C. 6-1-2) in order to prevent specific outcomes from taking place, staff
developed a monitoring project that would align with the legal interpretation of the B.R.C.
regarding voice and sight control by incorporating the thought process rangers use in enforcing
these regulations. Since enforcement of the V/S regulations of the B.R.C. requires a perspective
that looks at behaviors in context (as part of a situation) rather than as isolated components, we
accomplished this alignment by hiking with rangers on patrol and obtaining real-time
information on encounters involving dog guardians. For example, an interpretation of “out of
sight” in relation to V/S control is typically incomplete when only the ability to see the dog is
used as rationale for issuing a summons. Typically, a violation of V/S control that would receive
a summons requires the guardian not seeing the dog and that specific dog behaviors outlined in
the B.R.C. are not prevented from taking place. This information gave monitoring staff insight
for understanding specific situations where rangers would write tickets versus using alternative
options such as issuing warnings or engaging in educational talks. We began developing a
context-specific monitoring project, with the emphasis on capturing dog behaviors and guardian
responses that are specifically outlined in the B.R.C. for situations involving chasing, harassing
or disturbing people, other dogs, wildlife or livestock. Furthermore, the re-design separates
monitoring into two distinct processes for those regulations that are more subjective in
interpretation: 1] the collection of descriptive data by trained observers and 2] the evaluation of
the collected data by a committee comprised of monitoring and project management staff along
with the ranger supervisor for compliance determination. In other words, compliance would not
be determined in the field by the observers to address public comments regarding observer bias
for the more subjective components of the regulations.
To understand the level of compliance for dog regulations on the entire system, seasonal and
year-round leash trails were included in the 2014 monitoring design in addition to voice and
sight trails designated with low visitor volume. To ensure that we were collecting data on voice
commands directed at controlling dog behaviors versus dog guardians conversing with their
dogs, we included an auditory component where observers were required to be able to hear and
record guardians’ specific commands.
Changes to the 2006-2010 protocol implemented during the 2014-2018 project:
1. Removed conflictive behaviors terminology (as documented in 2006-2010).
2. Added a mid-day weekday monitoring period.
3. Added a late afternoon/early evening weekend monitoring period.
4. Added observation of leash-compliance in year-round and seasonal leash-required areas.
5. Added a summary of ranger observations, incidents, summons and convictions.
6. Added additional V/S and Leash Interview component monitoring sites including very
low to high volume locations along with sites located more interior (farther from
trailhead areas) on the OSMP system.
7. Eliminated observation of leashed only dog parties for the V/S component.

Appendices
74 | P a g e
8. Modified behavior coding strategy and behavior definitions.
9. Added recording commands given along with dog/guardian responses.
10. Moved off-trail sites used in 2006-2010 as needed to facilitate auditory monitoring of dog
guardian commands.
11. Changed to random site selection.
12. Changed to everyday sampling for the V/S and Leash Interview components; this wasn’t
designed, but rather implemented to meet the desired sample size within a shortened data
collection phase.
13. Removed “unsure” tag observation from compliant proportion to become unique
category.
14. Added “livestock” to potential off-trail challenges list for dogs.
15. Removed determination of “negative” or “positive” interactions in the field.
16. Revised determination of overall compliance to be evaluation outcome for each visitor
party to include interpretation of each visitor party’s collected attributes, interactions and
commands; determination of compliance will not occur in the field by the data collector,
and will be determined later in the office by a team representing monitoring, project team
and ranger staff.
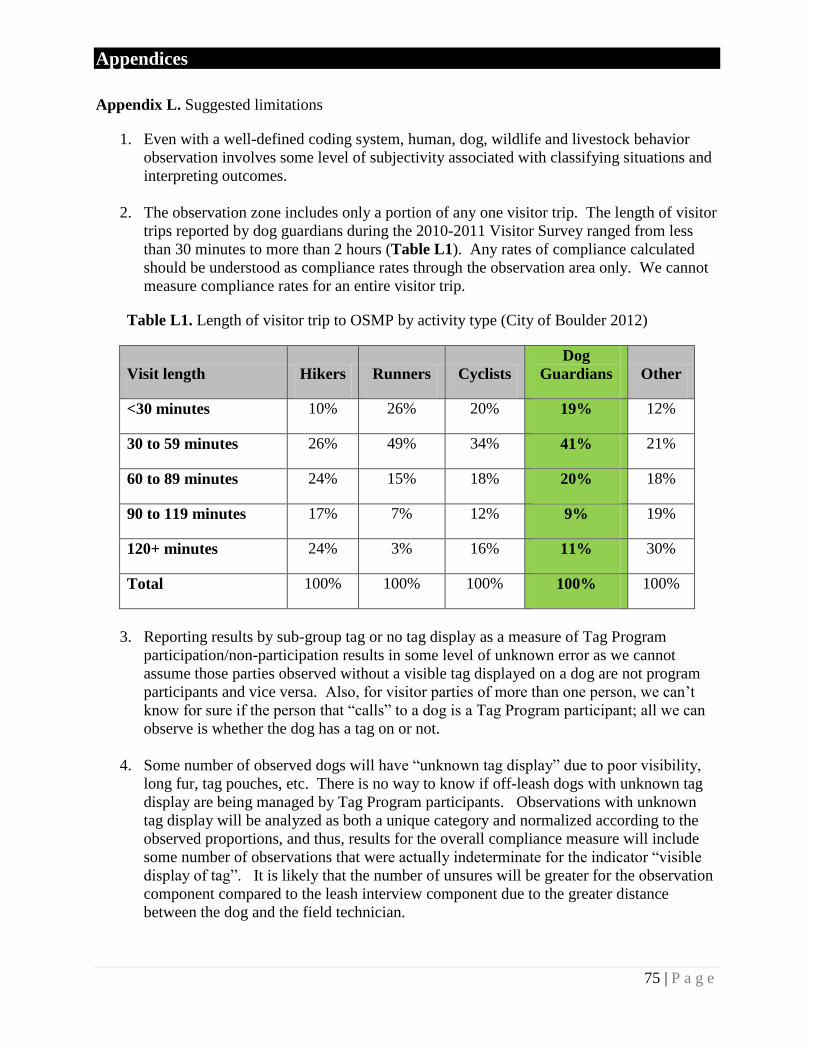
Appendices
75 | P a g e
Appendix L. Suggested limitations
1. Even with a well-defined coding system, human, dog, wildlife and livestock behavior
observation involves some level of subjectivity associated with classifying situations and
interpreting outcomes.
2. The observation zone includes only a portion of any one visitor trip. The length of visitor
trips reported by dog guardians during the 2010-2011 Visitor Survey ranged from less
than 30 minutes to more than 2 hours (Table L1). Any rates of compliance calculated
should be understood as compliance rates through the observation area only. We cannot
measure compliance rates for an entire visitor trip.
Table L1. Length of visitor trip to OSMP by activity type (City of Boulder 2012)
Visit length Hikers Runners Cyclists
Dog
Guardians Other
<30 minutes 10% 26% 20% 19% 12%
30 to 59 minutes 26% 49% 34% 41% 21%
60 to 89 minutes 24% 15% 18% 20% 18%
90 to 119 minutes 17% 7% 12% 9% 19%
120+ minutes 24% 3% 16% 11% 30%
Total 100% 100% 100% 100% 100%
3. Reporting results by sub-group tag or no tag display as a measure of Tag Program
participation/non-participation results in some level of unknown error as we cannot
assume those parties observed without a visible tag displayed on a dog are not program
participants and vice versa. Also, for visitor parties of more than one person, we can’t
know for sure if the person that “calls” to a dog is a Tag Program participant; all we can
observe is whether the dog has a tag on or not.
4. Some number of observed dogs will have “unknown tag display” due to poor visibility,
long fur, tag pouches, etc. There is no way to know if off-leash dogs with unknown tag
display are being managed by Tag Program participants. Observations with unknown
tag display will be analyzed as both a unique category and normalized according to the
observed proportions, and thus, results for the overall compliance measure will include
some number of observations that were actually indeterminate for the indicator “visible
display of tag”. It is likely that the number of unsures will be greater for the observation
component compared to the leash interview component due to the greater distance
between the dog and the field technician.

Appendices
76 | P a g e
5. We have no way to interpret how visitor parties with dogs differ from non-dog parties in
reference to human/dog/wildlife responses; we can’t say if dog parties have more, similar
or less impact because we are not measuring human/dog/wildlife responses associated
with non-dog parties.

Appendices
77 | P a g e
Appendix M. Compliance results at the event level
During each observation period, field observers recorded each instance (event) of each item
presented below to better understand off-leash dog management.
Charging…person (B.R.C. 6-1-2 Definitions)
At the event level, of the 33 interactions with just a person, there were 7 interactions that led to
the harassment of a person by a dog (Table M1). These 7 violations were attributed to 7 unique
visitor parties.
There were also 171 (including one equestrian) passes of just a person and 13 passes of a person
and a dog. Collectively with the interactions mentioned above and those included below as part
of a person and dog interaction (21), this equals 238 compliance opportunities with another
person. There were a total of 13 violations resulting in an overall compliance rate of 95%. When
considering the compliance rate for only passes, by default, the rate is 100%. The compliance
rate for only interactions is 76% (41 of 54).
Table M1. Number, type of event and compliance outcome for events involving other visitors
reported at the event level
Type of event/event level No
violation Violation Total
Compliance
both
Compliance
interactions only
Person passes* 171 n/a 171
95% 76%
Person interactions 26 7 33
Person and dog passes 13 n/a 13
Person and dog interactions 15 6 21
Totals 225 13 238
*Includes one equestrian pass
Charging…dog (B.R.C. 6-1-2 Definitions)
At the event level, of the 27 interactions with just a dog, there was 1 interaction that led to the
harassment of a dog by another dog (Table M2). Also out of the 27 interactions with a dog,
there were 6 visitor parties whose off-leash dog approached a leashed dog. In 1 of these 6
incidents, the off-leash dog was out of sight of its guardian. There was no contact observed
between the off-leashed and leashed dogs.
There were also 8 passes of just a dog and 13 passes of a person and a dog. Collectively with the
interactions mentioned above and those included below as part of a person /dog interaction (21),
there 69 compliance opportunities with another dog were observed. There were a total of 7
violations resulting in an overall compliance rate of 90%. When considering the compliance rate
for only passes, by default, the rate is 100%. The compliance rate for only interactions is 85%
(41 of 48).

Appendices
78 | P a g e
Table M2. Number, type of event and compliance outcome for events involving other dogs
reported at the event level
Type of event/event level No
violation Violation Total
Compliance
both
Compliance
interactions only
Dog passes 8 n/a 8
90% 85%
Dog interactions 26 1 27
Person and dog passes 13 n/a 13
Person and dog interactions 15 6 21
Totals 62 7 69
Chasing…..wildlife (B.R.C. 6-1-2 Definitions)
At the event level, of the 11 interactions with wildlife (includes one livestock event), 9
interactions led to the harassment of wildlife by an off-leash dog, with a total of 5 unique visitor
parties involved in the 9 interactions (Table M3). There were also 3 passes of wildlife/livestock.
Table M3. Number, type of event and compliance outcome for events involving
wildlife/livestock reported at the event level
Type of event/event
level
No
violation Violation Total
Compliance
both
Compliance
interactions only
Wildlife passes* 3 n/a 3
36% 18% Wildlife interactions* 2 9 11
Totals 5 9 14
*Includes one livestock event
Voice recall (B.R.C. 6-1-2 Definitions)
At the event level, there were a total of 83 observed command events distributed over passes,
interactions and isolated command events. Isolated command events describe events when the
dog was not passing or interacting with any other person, dog, wildlife or livestock, and the
guardian issued a command to the dog. Staff recorded 4 command events during passes, 23
during interactions and 56 command events not associated with a pass or an interaction event.
The successful response rate for commands issued during passes, interactions and isolated
command events was 75%, 70% and 75% respectfully and the overall voice control compliance
rate was 73% (Table M4).

Appendices
79 | P a g e
Table M4. Number, type of event and compliance outcome for V/S command events
at the event level
Type of event Dog response
Total Compliance rate No Yes
Pass 1 3 4 75%
Interaction 7 16 23 70%
Isolated 14 42 56 75%
Total 22 61 83 73%
Appendices
80 | P a g e
Appendix N. Confidence interval calculation methods and results
Methods To determine the reliability of our overall compliance estimates (60.7% based on the raw data;
66.4% based on the data without the “unsure” observations; 66.7% based on the normalized
data), we calculated the 95% confidence interval (CI) for compliance. The CIs were calculated
by looking up our observed estimate at the probabilities of 0.025 and 0.975 using a quantile
function for a beta (interval 0 to 1) distribution. For example, for the lower CI, the
corresponding syntax in R would be: qbeta(0.025, number of successes, number of failures - 1).
This was repeated for voice command response, one of the constituent components of overall
compliance.
To determine the minimum number of field observations necessary to obtain the observed
overall compliance estimate, we used a random sampling algorithm. From the data vector of
length N (N = 283, which is the total number of observations [310] minus those observations that
were “unsure” [27]), we randomly sampled n records, where n could include every integer value
between 5 and N. For each level of n (i.e., 5, 6, 7…283), the random sample was repeated 1000
times. From the random sample, compliance was calculated. We then plotted compliance (y
axis) against number of observations (n), and overlaid two horizontal lines to represent the 95%
CI around the observed compliance estimate. The minimum sampling effort is the number of
observations (n) where all 1000 random samples fall within the 95% CI. This routine was
repeated for voice command response compliance; in this case, N = 57.
Results
Overall compliance was 60.7 (95% CI, 55.0 to 66.1) for the full dataset; 66.4 (95% CI, 60.6 to
71.9) for the data without the “unsures”; and 66.7 (95% CI, 61.2 to 72.0) for the normalized
dataset. The minimum number of samples necessary to obtain the observed compliance value of
66.4 was 199 (vs. the 283 observations collected; Figure N1). For voice control response,
compliance was 77.2 (95% CI, 64.2 to 87.3) and the minimum number of samples necessary to
obtain this value was 41 (vs. the 57 observations actually collected).

Appendices
81 | P a g e
Figure N1. A random sampling algorithm was used to determine the minimum number of
observations required (vertical, dashed line) to obtain the observed values for overall compliance
(upper panel) and voice control compliance (lower panel).

Appendices
82 | P a g e
Appendix O. Examples of social science theory constructs which could be used to better
understand off-leash dog guardians
There are numerous social science theory constructs related to visitor management and recreation
behavior that could be used to improve the quality of the visitor experience quality and Tag
Program success. This information can help managers better understand off-leash dog guardians
and design new strategies for improving conditions and monitoring change.
The works of Nesbitt (2006) and Williams et al. (2009) include a focus on the role of dog
guardians’ attitudes and beliefs in influencing compliance with dog regulations and could be
useful in determining how guardians choose to manage their dogs. Attitudinal factors, which
include a person’s beliefs and attitudes about a behavior or action, can play a significant role in
shaping visitor behavior (Marion et al. 2008). In the absence of strong contextual factors, such
as uniformed personnel or visual cues, attitudinal factors are largely responsible for determining
visitor behavior (Stern 2000, Williams et al. 2009). Given this, dog guardians’ beliefs and
attitudes need to be better understood and used to inform future management strategies and
improve visitor experience quality.
Elaboration Likelihood Model
Elaboration is the extent to which a person carefully thinks (active cognition) about presented
information and/or arguments contained in a persuasive communication. The Elaboration
Likelihood Model (Figure O1) distinguishes between the peripheral route and the central route
of persuasion as two paths that can lead to attitudinal (and behavioral) change (Petty & Wegener
1999, Petty & Cacioppo 1986). Generally speaking, the peripheral route of persuasion is
intended to elicit a temporary attitude shift (through credibility/authority of the source or other
quick visual cues) and gain the desired response from the message reader while the central route,
which relies on “visitor attention, consideration and internalization of the message” (Marion &
Reid 2007), is intended to foster a long-term attitude/behavior change through activation of more
complex cognitive function and internalization of the attitude change.
The Elaboration Likelihood Model could be used to implement a suite of messages ranging from
very little need to a highly developed need for cognition for testing reader response within V/S or
other dog regulation trail areas of interest. Those messages which elicit the greatest level of
compliance could be piloted in other areas for further testing and/or used in areas with
compliance problems.

Appendices
83 | P a g e
Figure O1. The Elaboration Likelihood Model (Petty & Cacioppo 1986)

Appendices
84 | P a g e
The Theory of Planned Behavior (Ajzen 2006)
Within the construct of The Theory of Planned Behavior (Figure O2), human behavior is
influenced by:
Beliefs about the likely outcomes of the behavior and the evaluations of these outcomes
(behavioral beliefs);
Beliefs about the normative expectations of others and motivation to comply with these
expectations (normative beliefs); and
Beliefs about the presence of factors that may facilitate or impede performance of the
behavior and the perceived power of these factors (control beliefs).
These three behavioral intention antecedents lead to attitude and subjective norm development
along with a person’s level of perceived behavioral control. Collectively, these three inputs
contribute to a person’s formation of a behavioral intention which, if nothing intervenes within
the context of the given situation, leads to an expressed behavior.
For example, applied to the behavior of interest “dogs jumping on people” (Edwards & Knight
2006), the Theory of Planned Behavior could be used to understand which component of
behavioral intent (behavioral beliefs, normative beliefs or control beliefs) is contributing most to
how dog guardians manage this behavior (Figure O3). This knowledge, in turn, could be used
to design future studies, outreach strategies, ideas for further public inquiry, management
strategies, education curricula revisions and targeted persuasive message creation.
Figure O2. The Theory of Planned Behaivor (Ajzen 2006)

Appendices
85 | P a g e
Depreciative Behavior Taxonomies
Several researchers have organized depreciative behavior frameworks and/or classification
systems aimed at understanding the motivation or rationale behind the behavior. Widner-Ward
and Roggenbuck (2003), following Gramann and Vander Stoep (1987), suggested that one
potential explanation of depreciative behaviors was a person’s choice not to comply with
perceived social norms. They proposed a taxonomy of depreciative behaviors comprising five
typical violations:
1. Unintentional – “I did not know I was doing something wrong.”
2. Uninformed – “I did not know harvesting firewood for my campfire could negatively
affect the area’s animals.”
3. Releasor cue – “I saw everybody else doing it.”
4. Responsibility-denial – “I did not contribute to this problem.” and
5. Status confirming – “All my friends are doing it.”
The Depreciative Behavior Taxonomy, as adopted from Hendee et al. 1978, outlines five
categories of depreciative visitor behavior and assigns them each a likelihood that any
intervention strategy would result in a modification of visitor behavior (Table O1).
Figure O3. Theory of Planned Behavior applied to the behavior of interest
“dogs jumping on people” (Edwards & Knight 2006)

Appendices
86 | P a g e
Table O1. General typology of depreciative visitor behavior and the potential degree of
effectiveness for intervention strategies
Type of behavior
Examples
Potential degree of
effectiveness
Illegal actions
Cutting fence line
Not picking up dog poop
Low
Careless actions
Walking side by side blocking trail
Nuisance activity (e.g., shouting)
Moderate
Unskilled actions
Unable to manage dog using voice and
sight control
Unable to perform cyclist tripod yield
High
Uninformed actions
Not walking through mud
Not having extra poop pick up bag
Walking off trail
Very high
Unavoidable
actions
Human/dog waste disposal
Loss of ground cover vegetation at
trailhead
Low
These factors interplay and can be additive in nature. For example, visitors who allow their dogs
to chase birds or squirrels near the trail are likely not intentionally trying to harm wildlife. They
may also have seen other people/dogs doing so and may think that the managing agency should
excuse and accept such trailside activity. In this example, we see visitor actions which are
simultaneously unintentional, releasor cue and responsibility denial related.
Namba and Dustin (1992) suggested that depreciative behavior is most effectively addressed by
clearly articulating (to visitors) the behaviors that are unacceptable and further relating the
behaviors to specific unwanted consequences. Land managers also need to provide visitors with
an option to “do the right thing” to ensure voluntary compliance with recommended behaviors.
Another idea concerning why depreciative behavior occurs was first discussed by Hardin (1968)
in his “Tragedy of the Commons” paper. The “commons dilemma” view contends that
depreciative behaviors occur in recreation areas because visitors may deny the potential negative
impacts to everyone else when rationalizing the benefit to self. For example, the benefit from
allowing a dog to run around freely accrues to the individual and the dog, while all the other
visitors (and non-human beings) share the cost of an unmanaged dog. To the visitor, the
perceived benefit of running freely outweighs the perceived cost to everyone else in the park.
Any of the Depreciative Behavior Taxonomies could be used to design future visitor surveys,
focus groups, interviews, or other studies designed to understand the reasoning behind unwanted
depreciative behaviors such as dogs jumping on people or dogs chasing wildlife.

Appendices
87 | P a g e
Information-Processing Model of Persuasion and Behavioral Change
The Information-Processing Model of Persuasion and Behavioral Change (McGuire 1985),
graphically displays the steps required to attain the desired response from a reader exposed to a
persuasive message (Figure O4). These steps include:
Exposure: Visitor is exposed to an educational message
Attention: Visitor processes the message
Comprehension: Message is understood
Yielding: Visitor accepts the message and changes their attitude
Retention: Visitor retains the message and attitude
Behavior: Visitor behaves in accordance with changed attitude (or learns how to)
Avoidance/reduction of impacts: Resource or experiential impacts are avoided or
reduced
These steps require careful thought and consideration in the kinds of communication used, the
message content, the message source, the targeted receivers/audience and the desired behavioral
choices that are expected to follow.
The Information-Processing Model of Persuasion and Behavioral Change could be used to
design future behavioral compliance studies, pilot or long-term message studies, behavioral
choice interviews or other studies designed to understand the effects of selected messages at
reducing unwanted depreciative behaviors such as dogs jumping on people or dogs chasing
wildlife.
Figure O4: Information-Processing Model of Persuasion and Behavioral
Change (McGuire, 1985)

Appendices
88 | P a g e
Value-Attitude-Behavior Model (cognitive hierarchy of human behavior)
As displayed in Figure O5, values represent the “top” of the cognitive hierarchy of human
behavior. Values are few in number, slow to change, central to beliefs and transcend situations
(Vaske & Donnelly 1999). They affect human beliefs and attitudes, which in turn, affect
behavioral intentions and actualized behaviors. Depending on the desired outcome (short-term
or long-term behavioral change), OSMP could design future monitoring studies to determine the
most salient values, attitudes and belief systems contributing to observed visitor behaviors.
Generally speaking, if seeking long-term behavioral change, interventions will need to address
and focus upon those items (values and value orientations) at the top of the cognitive hierarchy.
THE END.
Behaviors
Behavioral Intentions
Attitudes and Norms
Value Orientations
(Basic Belief
Patterns)
Values
Few in number
Slow to change
Central to beliefs
Transcend situations
Numerous
Faster to change
Peripheral
Specific to situations
Figure O5. Value-attitude-behavior model