Wärmepumpen Herausforderungen für Verteilnetzbetreiber (VNB)
News release: April 25, 2017
NSE Code: ICICIPRULI BSE Code: 540133
VNB growth of 61.7%
New Business APE up 28.1%
Embedded Value rises to `161.84 billion
Final Dividend of 35%
~ New business Annualised Premium Equivalent (APE*) increased by 28.1% to ` 66.25 billion
in FY2017 from ` 51.70 billion in FY2016
~ Final dividend of ` 3.50 per equity share
~ Value of New Business (VNB*) increased by 61.7% with VNB margins improving to 10.1%
for FY2017 from 8.0% for FY2016
~ Embedded Value (EV*) growth of 16.1% to ` 161.84 billion for FY2017 from ` 139.39 billion
for FY2016
Performance for the period ended March 31, 2017
` billion FY2016 FY2017 Growth YoY
Annualized Premium Equivalent (APE)*
51.70 66.25 28.1%
-Savings 50.31 63.64 26.5%
-Protection 1.39 2.60 87.1%
Market share based on RWRP* 11.3% 12.0% -
Value of New Business (VNB)* 4.121
6.661
61.7%
Value of New Business (VNB) Margin* (%) 8.0%1
10.1%1
Embedded value (EV)* 139.39 161.84 16.1%
13th month persistency*
82.4% 86.0%2
-
49th month persistency*
62.2% 61.1%2
-
Cost Ratio (Cost/TWRP)* 14.5% 15.1% -
Assets under management (AUM) 1,039.39 1,229.19 18.3%
1. VNB and VNB margin based on actual cost
2. For policies issued during March to February period of relevant year measured as on March 31, 2017
3. Totals may not add up to sum of individual numbers on the table due to rounding off
* Refer the section on definitions, abbreviations and explanatory notes
The Board of Directors of ICICI Prudential Life Insurance Company Limited approved its audited
financial results for the quarter ended March 31, 2017, following its meeting on Wednesday,
April 25, 2017 in Mumbai. The disclosure of financial results submitted to exchanges is annexed
to this release.
Commenting on the performance Mr. Sandeep Batra, Executive Director ICICI Prudential Life,
said “This year the Company registered a robust and well rounded performance on all value
drivers. New business registered a strong growth with an increase in market share. Our strategy
has been customer centric products, superior customer service and quick claims settlement.
Our focus on Protection enabled this segment to grow by 87.1% year on year. Our VNB Margin
expanded from 8.0% to 10.1% and the Embedded Value registered a growth of 16.1% which
validates our value creation approach and is indicative of the strong performance on new
business, expanding margins as well as sound risk management of the in-force book. Our
customer centric philosophy also ensured good quality sales leading to higher persistency,
with the 13th month persistency at 86.0%.
We feel particularly excited about the potential that the industry has to offer. Life insurance is
uniquiely positioned to straddle both the categories of a) protection and b) long term savings.
We believe that the savings business would gain from the growing affluence, positive macro-
economic environment and a visible shift in preference towards financial savings accelerated
by the recent demonetisation initiative.
The Sum Assured to GDP ratio for the country was low at 66.8%. We believe, that as the young
Indian workforce continues to grow, so will their need for financial protection.
We would continue to focus on all the value drivers to create superior value for all our
stakeholders by focusing on leveraging the insurance opportunity on both protection and
savings.”
New business growth and market share
28.1% year on year growth in Annual Premium Equivalent (APE);
Protection APE increased by 87.1% and Savings APE increased by 26.5%
29.3% growth in APE for Q4-FY2017 as compared to Q4-FY2016
Overall market share of 12.0% and private market share of 22.3% based on retail weighted
received premium (RWRP) for FY2017 retaining leadership amongst private players.
Profitability
Value of New Business (VNB) was ` 6.66 billion for FY2017 as compared to ` 4.12 billion
for FY2016.
VNB margin increased to 10.1% for FY2017 from 8.0% for FY2016 primarily on account of
increase in protection business and improvement in persistency.
Our Embedded Value as on March 31, 2017 was ` 161.84 bn compared to ` 139.39 bn as
on March 31, 2016, a growth of 16.1% after dividend and 20.6% before dividend.
Profit after tax at ` 16.82 billion for FY2017 as compared to ` 16.50 billion for FY2016.
Dividend
Final dividend of ` 3.50 per equity share (including the special dividend of ` 1.20 per equity
share) for H2-FY2017.
Interim dividend of ` 3.85 per share already declared and paid
Aggregate of total dividend of ` 7.35 per share for FY2017
Quality of business and efficiency
13th
month persistency improved to 86.0% for FY2017 from 82.4% for FY2016.
The cost to Total Weighted Received Premium (TWRP) ratio stood at 15.1% for FY2017
compared to 14.5% for FY2016 primarily on account of high growth in protection business.
Definitions, abbreviations and explanatory notes
Annual Premium Equivalent (APE): APE is a measure of new business written by a life insurance company. It is computed
as the sum of annualised first year premiums on regular premium policies, and ten percent of single premiums, written
by the Company during any period from new retail and group customers.
Value of New Business (VNB) and VNB margin: VNB is used to measure profitability of the new business written in a
period. It is present value of future profits to shareholders as measured at the end of the year in which the business is
written. Future profits are computed on the basis of long term assumptions which are reviewed annually. Also referred to
as NBP (new business profit). VNB margin is computed as VNB for the period/APE for the period. It is similar to profit
margin for any other business.
Embedded Value (EV): EV is the current networth of the company plus the present value of all future profits to shareholders
from the existing book of the Company (including new business written in the year). As in the case of VNB, future profits
are computed based on assumptions which are reviewed annually. A positive EV variance is indicative of superior
performance by the Company as compared to what was assumed in arriving at the EV at the beginning of the year. A
positive EV variance and VNB increase the EV year on year. The change in EV because of performance as compared to
assumptions is disclosed by the Company through Ananlysis of Movement disclosure annually. EV has been computed
using IEV principles set out in Actuarial practice standard 10 and mandated by IRDAI for the mandatory EV disclosure for
IPO.
Retail Weighted Received Premium (RWRP): RWRP is a new business measure very similar to APE for the retail (also
referred to as individual) business with the only difference being that the regular premiums considered here are first year
premiums actually received by the life insurer and not annualised. Secondly since its a new business measure for retail
business, it includes only premium received from retail customers. It is the sum of all retail first year premiums and ten
percent of retail single premiums received in a period.
Total Weighted Received Premium (TWRP): TWRP is a measure of total premiums from new and existing retail and group
customers received in a period. It is sum of first year and renewal premiums on regular premium policies and ten percent
of single premiums received from both retail and group customers by Company during the period.
Cost Ratio:Cost ratio is a measure of the cost efficiency of a Company. Expenses are incurred by the Company on new
business as well as renewal premiums. Cost ratio is computed as a ratio of all expenses incurred in a period comprising
commission, operating expenses, provision for doubtful debts and bad debts written off to total weighted received
premium (TWRP)
Persistency: It is the most common parameter for quality of business representing the percentage of retail policies (where
premiums are expected) that continue paying premiums. The method of computation of Persistency has been prescribed
by IRDAI vide its circular dated January 23, 2014.
About ICICI Prudential life insurance
ICICI Prudential Life Insurance Company Ltd. (ICICI Prudential Life) is a joint venture between ICICI Bank Ltd. and Prudential
Corporation Holdings Limited which is a part of an international financial services group headquartered in United Kingdom.
ICICI Prudential Life was amongst the first private sector insurance companies to begin operations in December 2000. The
Company has maintained its leadership position, on a Retail Weighted Received Premium basis (RWRP) among private life
insurers. The Company offers products across the categories of Protection and Savings that fulfil the different life stage
needs of customers.
ICICI Prudential Life is the first private life insurance company to cross the Rs.1 trillion mark for assets under management
(AUM) and as on March 31, 2017 had an AUM of Rs. 1,229.19 billion and in-force sum assured of over Rs.3 trillion. ICICI
Prudential Life is listed on National Stock Exchange (NSE) and The Bombay Stock Exchange (BSE).
Disclaimer
Except for the historical information contained herein, statements in this release which contain words or phrases such as 'will',
‘expected to’, etc., and similar expressions or variations of such expressions may constitute 'forward-looking statements'.
These forward-looking statements involve a number of risks, uncertainties and other factors that could cause actual results,
opportunities and growth potential to differ materially from those suggested by the forward-looking statements. These risks
and uncertainties include, but are not limited to, the actual growth in demand for insurance and other financial products and
services in the countries that we operate or where a material number of our customers reside, our ability to successfully
implement our strategy, including our use of the Internet and other technology our exploration of merger and acquisition
opportunities, our ability to integrate mergers or acquisitions into our operations and manage the risks associated with such
acquisitions to achieve our strategic and financial objectives, our growth and expansion in domestic and overseas markets,
technological changes, our ability to market new products, the outcome of any legal, tax or regulatory proceedings in India
and in other jurisdictions we are or become a party to, the future impact of new accounting standards, our ability to implement
our dividend policy, the impact of changes in insurance regulations and other regulatory changes in India and other
jurisdictions on us. ICICI Prudential Life insurance undertakes no obligation to update forward-looking statements to reflect
events or circumstances after the date thereof.
This release does not constitute an offer of securities.
For further press queries please call Rajiv Adhikari / Lopamudra Bhattacharya 91-22-40391600 (Ext: 1703 / 1732) or email
1 billion = 100 crore
April 25, 2017
Performance for the year ended March 31, 2017
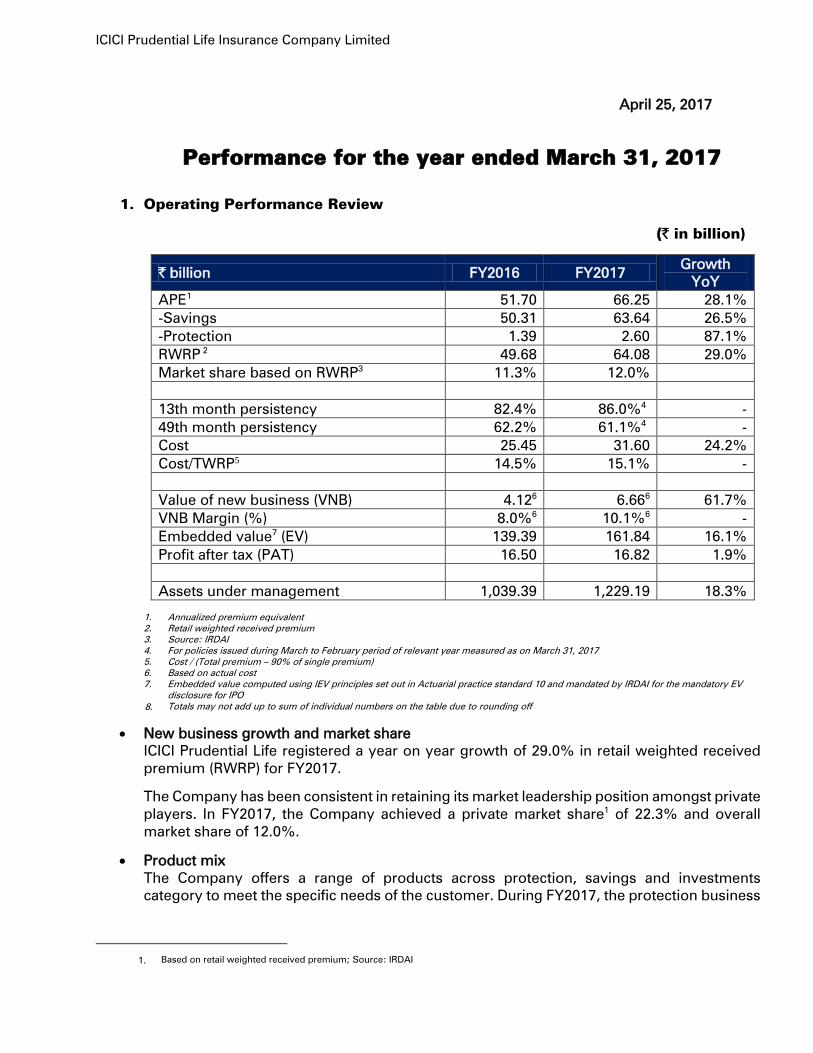
1. Operating Performance Review
(` in billion)
` billion FY2016 FY2017 Growth
YoY
APE1
51.70 66.25 28.1%
-Savings 50.31 63.64 26.5%
-Protection 1.39 2.60 87.1%
RWRP 2
49.68 64.08 29.0%
Market share based on RWRP3
11.3% 12.0%
13th month persistency
82.4% 86.0%4
-
49th month persistency 62.2% 61.1%4
-
Cost 25.45 31.60 24.2%
Cost/TWRP5
14.5% 15.1% -
Value of new business (VNB) 4.126
6.666
61.7%
VNB Margin (%) 8.0%6
10.1%6
-
Embedded value7
(EV) 139.39 161.84 16.1%
Profit after tax (PAT) 16.50 16.82 1.9%
Assets under management 1,039.39 1,229.19 18.3%
1.
2.
3.
4.
5.
6.
7.
Annualized premium equivalent
Retail weighted received premium
Source: IRDAI
For policies issued during March to February period of relevant year measured as on March 31, 2017
Cost / (Total premium – 90% of single premium)
Based on actual cost
Embedded value computed using IEV principles set out in Actuarial practice standard 10 and mandated by IRDAI for the mandatory EV
disclosure for IPO
Totals may not add up to sum of individual numbers on the table due to rounding off
New business growth and market share
ICICI Prudential Life registered a year on year growth of 29.0% in retail weighted received
premium (RWRP) for FY2017.
The Company has been consistent in retaining its market leadership position amongst private
players. In FY2017, the Company achieved a private market share1
of 22.3% and overall
market share of 12.0%.
Product mix
The Company offers a range of products across protection, savings and investments
category to meet the specific needs of the customer. During FY2017, the protection business
8.
Based on retail weighted received premium; Source: IRDAI1.
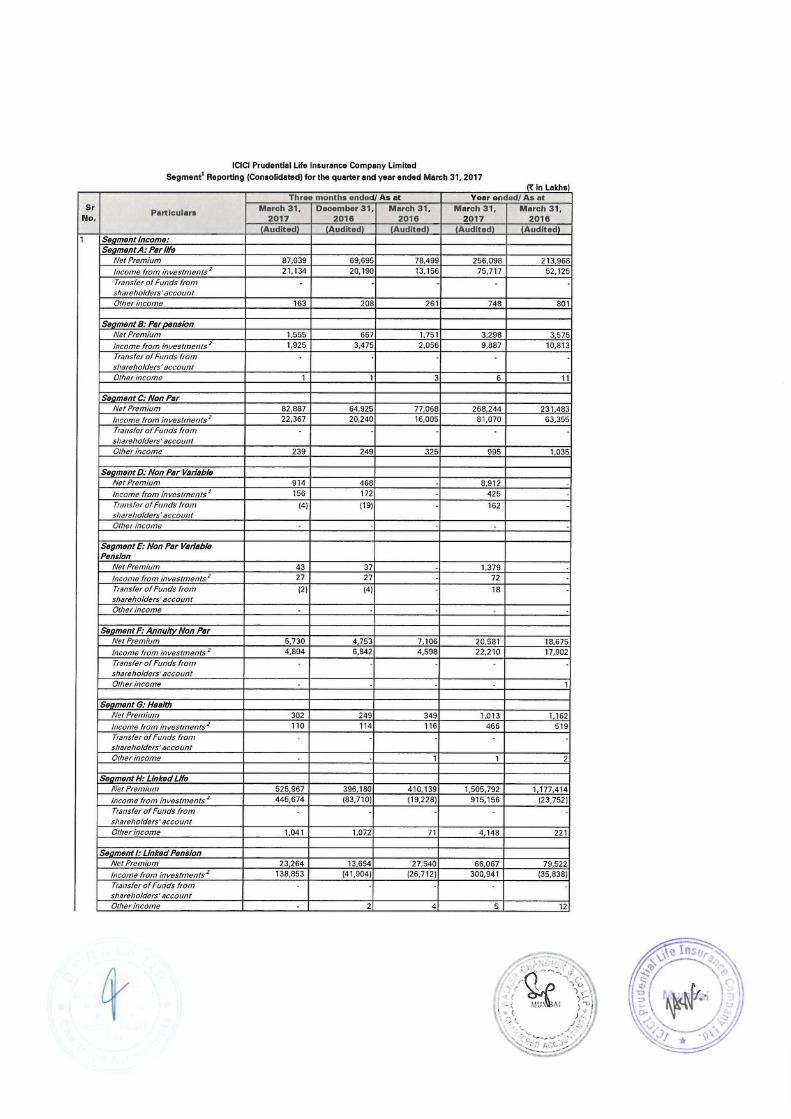
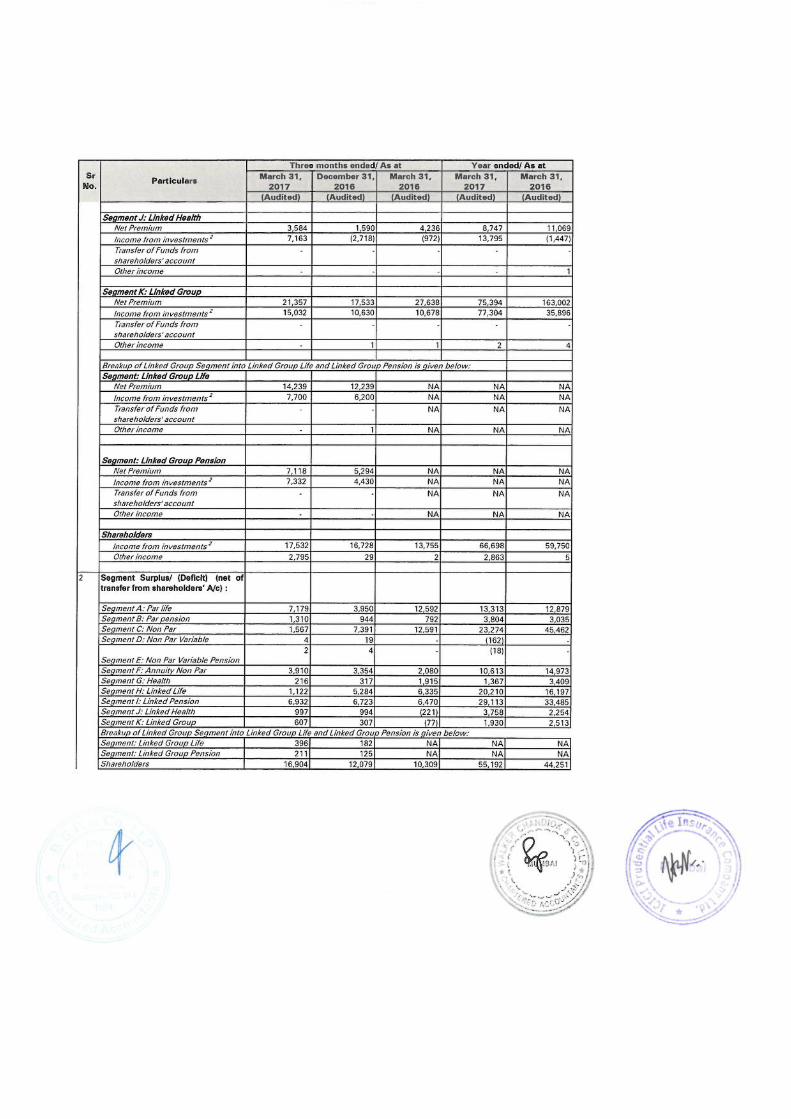
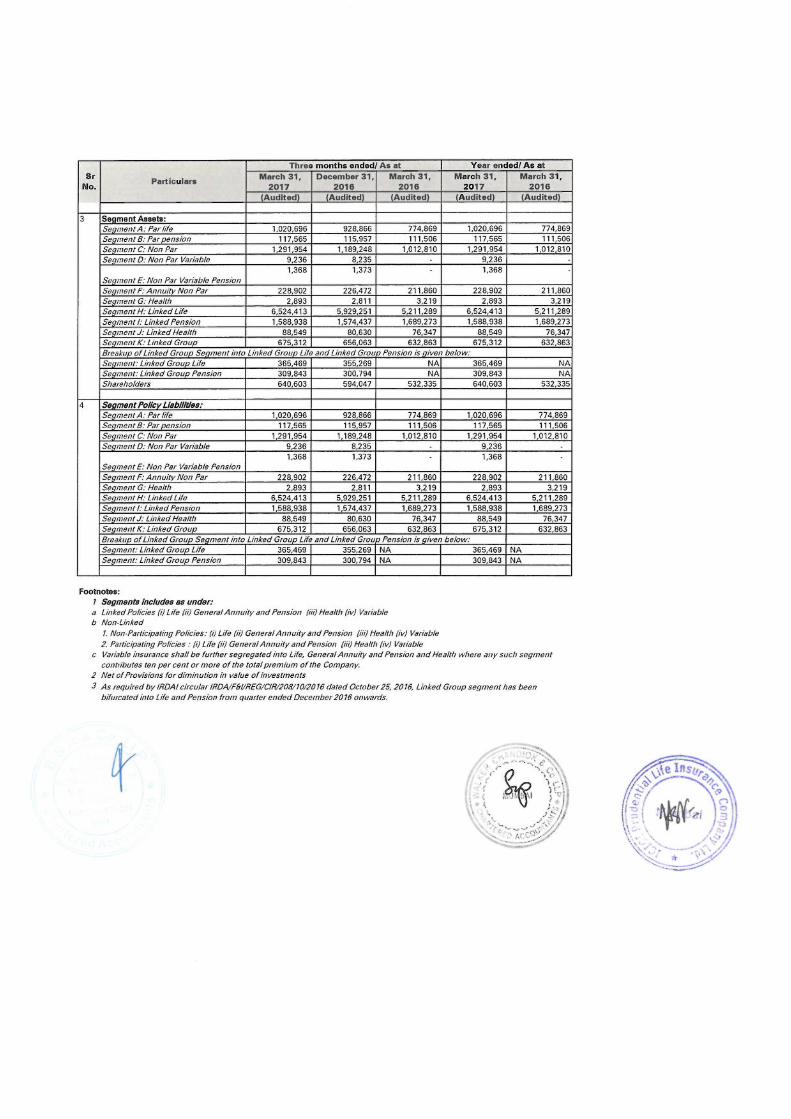
ICICI Prudential Life Insurance Company Limited
in terms of APE recorded a growth of 87.1% rising from ` 1.39 billion in FY2016 to ` 2.60
billion in FY2017.
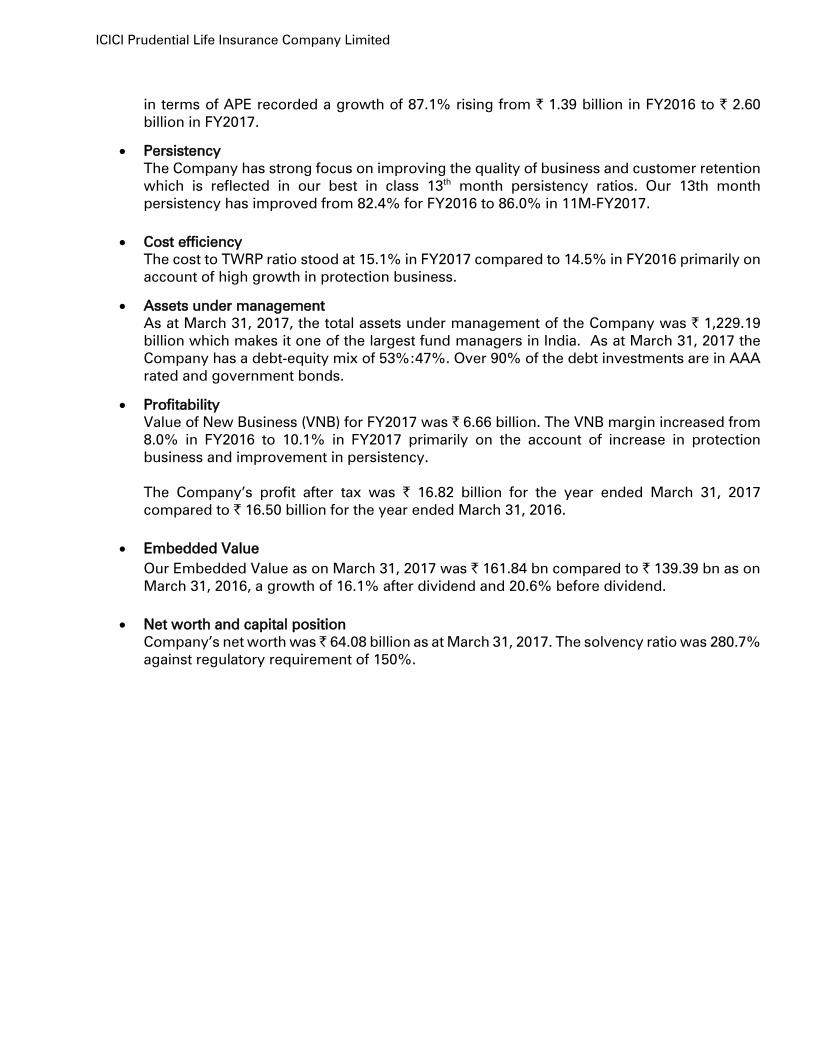
Persistency
The Company has strong focus on improving the quality of business and customer retention
which is reflected in our best in class 13th
month persistency ratios. Our 13th month
persistency has improved from 82.4% for FY2016 to 86.0% in 11M-FY2017.
Cost efficiency
The cost to TWRP ratio stood at 15.1% in FY2017 compared to 14.5% in FY2016 primarily on
account of high growth in protection business.
Assets under management
As at March 31, 2017, the total assets under management of the Company was ` 1,229.19
billion which makes it one of the largest fund managers in India. As at March 31, 2017 the
Company has a debt-equity mix of 53%:47%. Over 90% of the debt investments are in AAA
rated and government bonds.
Profitability
Value of New Business (VNB) for FY2017 was ` 6.66 billion. The VNB margin increased from
8.0% in FY2016 to 10.1% in FY2017 primarily on the account of increase in protection
business and improvement in persistency.
The Company’s profit after tax was ` 16.82 billion for the year ended March 31, 2017
compared to ` 16.50 billion for the year ended March 31, 2016.
Embedded Value
Our Embedded Value as on March 31, 2017 was ` 161.84 bn compared to ` 139.39 bn as on
March 31, 2016, a growth of 16.1% after dividend and 20.6% before dividend.
Net worth and capital position
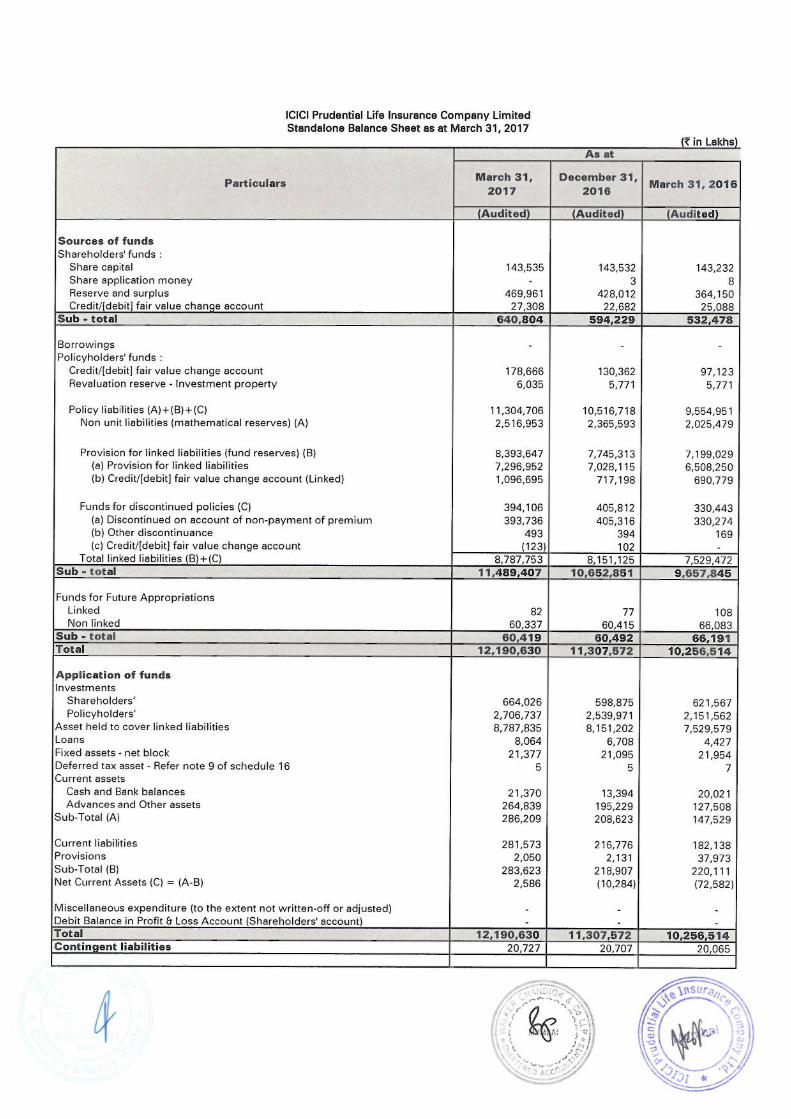
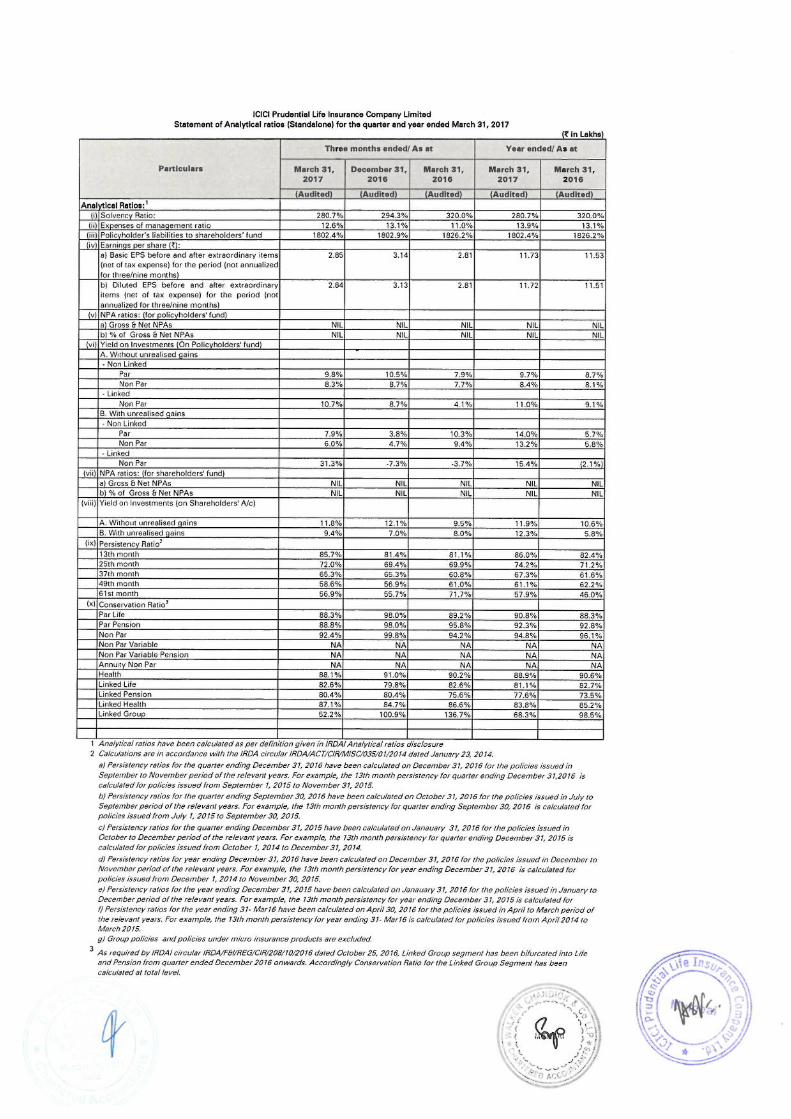
Company’s net worth was ̀ 64.08 billion as at March 31, 2017. The solvency ratio was 280.7%
against regulatory requirement of 150%.
ICICI Prudential Life Insurance Company Limited
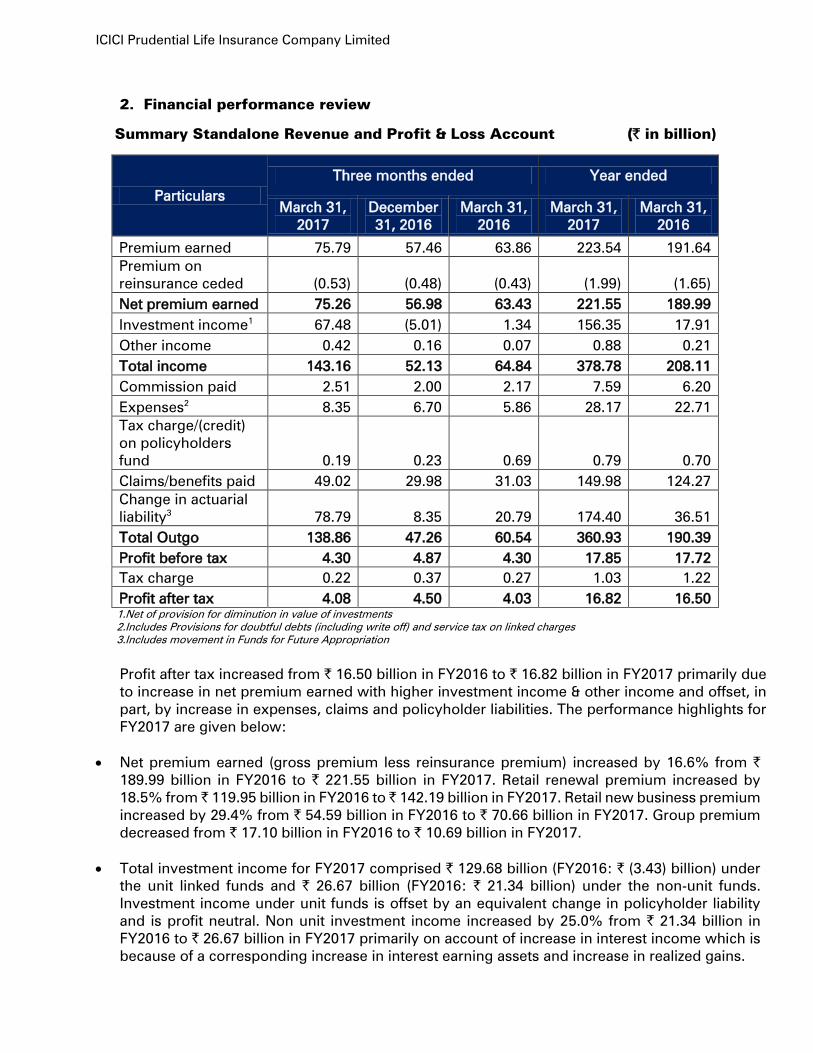
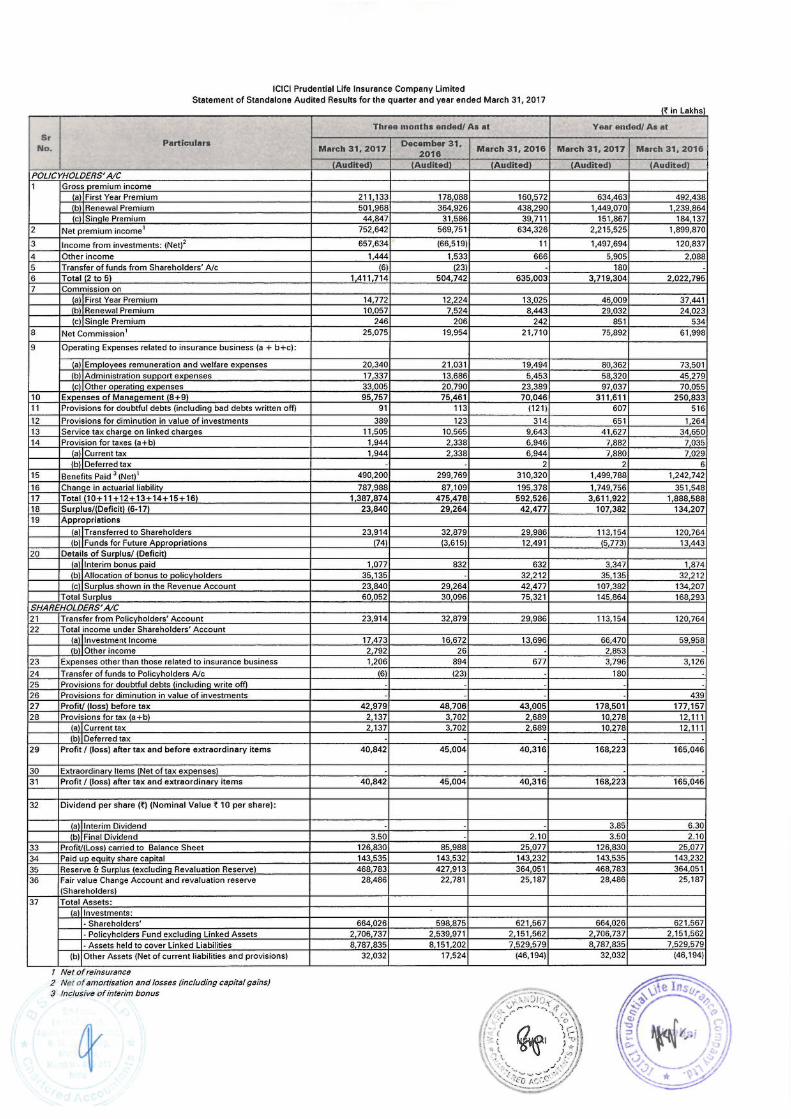
2. Financial performance review
Summary Standalone Revenue and Profit & Loss Account (` in billion)
Particulars
Three months ended Year ended
March 31,
2017
December
31, 2016
March 31,
2016
March 31,
2017
March 31,
2016
Premium earned 75.79 57.46 63.86 223.54 191.64
Premium on
reinsurance ceded (0.53) (0.48) (0.43) (1.99) (1.65)
Net premium earned 75.26 56.98 63.43 221.55 189.99
Investment income1
67.48 (5.01) 1.34 156.35 17.91
Other income 0.42 0.16 0.07 0.88 0.21
Total income 143.16 52.13 64.84 378.78 208.11
Commission paid 2.51 2.00 2.17 7.59 6.20
Expenses2
8.35 6.70 5.86 28.17 22.71
Tax charge/(credit)
on policyholders
fund 0.19 0.23 0.69 0.79 0.70
Claims/benefits paid 49.02 29.98 31.03 149.98 124.27
Change in actuarial
liability3
78.79 8.35 20.79 174.40 36.51
Total Outgo 138.86 47.26 60.54 360.93 190.39
Profit before tax 4.30 4.87 4.30 17.85 17.72
Tax charge 0.22 0.37 0.27 1.03 1.22
Profit after tax 4.08 4.50 4.03 16.82 16.50
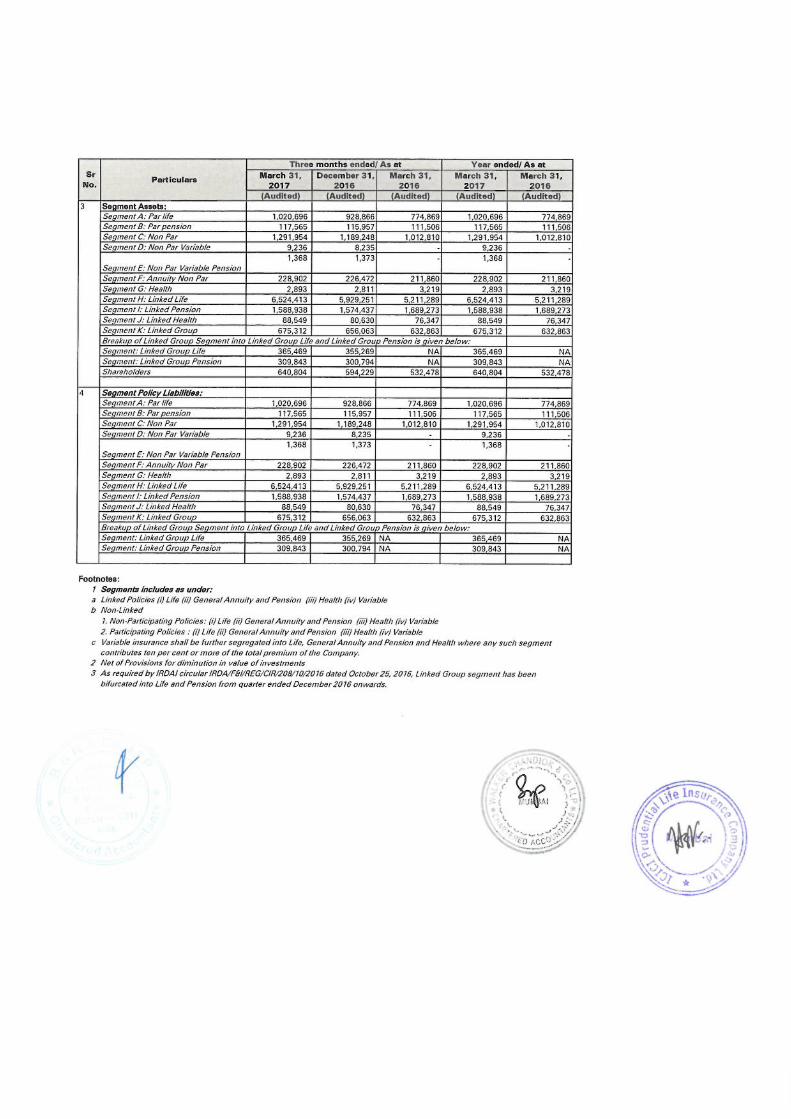
1.Net of provision for diminution in value of investments
2.Includes Provisions for doubtful debts (including write off) and service tax on linked charges
3.Includes movement in Funds for Future Appropriation
Profit after tax increased from ` 16.50 billion in FY2016 to ` 16.82 billion in FY2017 primarily due
to increase in net premium earned with higher investment income & other income and offset, in
part, by increase in expenses, claims and policyholder liabilities. The performance highlights for
FY2017 are given below:
Net premium earned (gross premium less reinsurance premium) increased by 16.6% from `189.99 billion in FY2016 to ` 221.55 billion in FY2017. Retail renewal premium increased by
18.5% from ̀ 119.95 billion in FY2016 to ̀ 142.19 billion in FY2017. Retail new business premium
increased by 29.4% from ` 54.59 billion in FY2016 to ` 70.66 billion in FY2017. Group premium
decreased from ` 17.10 billion in FY2016 to ` 10.69 billion in FY2017.
Total investment income for FY2017 comprised ` 129.68 billion (FY2016: ` (3.43) billion) under
the unit linked funds and ` 26.67 billion (FY2016: ` 21.34 billion) under the non-unit funds.
Investment income under unit funds is offset by an equivalent change in policyholder liability
and is profit neutral. Non unit investment income increased by 25.0% from ` 21.34 billion in
FY2016 to ` 26.67 billion in FY2017 primarily on account of increase in interest income which is
because of a corresponding increase in interest earning assets and increase in realized gains.
ICICI Prudential Life Insurance Company Limited
Other income increased from ` 0.21 billion in FY2016 to ` 0.88 billion in FY2017. Pursuant to
IRDAI circular on “Handling of unclaimed amounts pertaining to policyholders”, the Company
has created a single segregated fund to manage all the unclaimed monies with effect from April
1, 2016. Income earned by the fund was ` 0.40 billion in FY2017. This income is offset by an
equivalent change in benefits paid (interest payable on unclaimed amounts) and is therefore
profit neutral. Also, the Company has accounted for interest on income tax refund amounting to
` 0.28 billion in FY2017.
Commission expense increased by 22.4% from ` 6.20 billion in FY2016 to ` 7.59 billion in
FY2017. New Business Commission has increased from ` 3.80 billion in FY2016 to ` 4.69 billion
in FY2017. Renewal Commission has increased from ` 2.40 billion in FY2016 to ` 2.90 billion in
FY2017. The increase in commission expense is broadly in line with the change in product mix
and increase in premium.
Operating expenses increased by 24.0% from ` 22.71 billion in FY2016 to ` 28.17 billion in
FY2017 on the back of growth in new business APE of 28.1% and reflects increased emphasis
on protection business and continued focus on building distribution.
Claims and benefit payouts increased by 20.7% from ̀ 124.27 billion in FY2016 to ̀ 149.98 billion
in FY2017 primarily on account of increase in maturity claims by ̀ 17.92 billion from ̀ 4.91 billion
in FY2016 to ̀ 22.83 billion in FY2017 and increase in surrender claims by ̀ 5.87 billion in FY2017.
Change in actuarial liability, including funds for future appropriation, increased from ` 36.51
billion in FY2016 to ` 174.40 billion in FY2017. Fund reserve, which represents liability carried on
account of units held by unit linked policyholders, increased by ` 5.19 billion in FY2016 as
compared to an increase of ` 125.83 billion in FY2017. The increase in fund reserves is primarily
due to a direct offset of an increase in premium and investment income net of benefit outgo in
the linked funds. Non-unit reserve increased by ` 29.96 billion in FY2016 as compared to an
increase of ` 49.15 billion in FY2017 reflecting broadly the increase in premium and investment
income net of benefit outgo.
Disclaimer
Except for the historical information contained herein, statements in this release which contain words or phrases such as
'will', ‘expected to’, etc., and similar expressions or variations of such expressions may constitute 'forward-looking
statements'. These forward-looking statements involve a number of risks, uncertainties and other factors that could cause
actual results, opportunities and growth potential to differ materially from those suggested by the forward-looking
statements. These risks and uncertainties include, but are not limited to, the actual growth in demand for insurance and
other financial products and services in the countries that we operate or where a material number of our customers reside,
our ability to successfully implement our strategy, including our use of the Internet and other technology our exploration
of merger and acquisition opportunities, our ability to integrate mergers or acquisitions into our operations and manage
the risks associated with such acquisitions to achieve our strategic and financial objectives, our growth and expansion in
domestic and overseas markets, technological changes, our ability to market new products, the outcome of any legal, tax
or regulatory proceedings in India and in other jurisdictions we are or become a party to, the future impact of new
accounting standards, our ability to implement our dividend policy, the impact of changes in insurance regulations and
other regulatory changes in India and other jurisdictions on us. ICICI Prudential Life insurance undertakes no obligation to
update forward-looking statements to reflect events or circumstances after the date thereof.
This release does not constitute an offer of securities.
For investor queries please call Vikas Gupta at 91-22-40391600 (Ext: 1897) or email [email protected].
1 billion = 100 crore
ICICI Prudential Life Insurance Company Limited

1
ICICI Prudential Life Insurance Company Limited Embedded Value Results This report on Embedded Value results as at March 31, 2017 has been prepared by the Company and the results presented in the report have been reviewed by Milliman Advisors LLP. 1 Basis of preparation The Embedded Value (EV) is a measure of the consolidated value of the shareholders’ interest in the life insurance business. The EV results have been prepared based on the Indian Embedded Value (IEV) methodology and principles as set out in Actuarial Practice Standard 101 (APS10) issued by the Institute of Actuaries of India (IAI). Since APS10 is applicable for the limited purpose of an Initial Public Offering (IPO), compliance with APS10 is limited to the methodology and principles used to develop the IEV Results presented in this report. The IEV methodology is broadly in line with the Market Consistent Embedded Value2 (MCEV) principles used in Europe. A detailed description of the IEV methodology is provided in section 3.
1 The Actuarial Practice Standard 10 for the IEV method is available at http://www.actuariesindia.org/downloads/APS/APS_10_modification_ver1_02_28_03_2015.pdf 2 The MCEV principles as defined by the CFO forum are available at http://www.cfoforum.nl/downloads/MCEV_Principles_and_Guidance_October_2009.pdf

2
2 Key results 2.1 Value of new business (VNB)
New business details ( bn) FY2016 FY2017 Value of New Business (VNB) 4.12 6.66 New Business Margin (VNB/APE) 8.0% 10.1% Single Premium 15.38 17.95 Regular Premium 50.16 64.45 Annual Premium Equivalent (APE) 51.70 66.25 Protection 1.39 2.60 Savings 50.31 63.64
Components of VNB ( bn) As at March 31, 2016 As at March 31, 2017 VNB before TVFOG, CRNHR, FC 5.03 7.93 TVFOG in respect of new business (0.11) (0.12) CRNHR in respect of new business (0.55) (0.79) FC in respect of new business (0.24) (0.36) Value of new business 4.12 6.66
2.2 IEV Components of IEV ( bn) As at March 31, 2016 As at March 31, 2017 Free surplus (FS) 35.28 39.73 Required capital (RC) 19.85 27.83 Adjusted net worth (ANW) 55.14 67.56 Present value of future profits (PVFP) 88.72 99.74 Time value of financial options and guarantees (TVFOG) (0.38) (0.52) Cost of residual non-hedgeable risks (CRNHR) (2.45) (3.10) Frictional cost of required capital (FC) (1.63) (1.85) Value of in-force business (VIF) 84.25 94.28 Indian embedded value (IEV) 139.39 161.84 IEV operating earnings (EVOP) 21.22 22.95 Return on Embedded Value (ROEV) 15.3% 16.5% Growth in IEV 0.8% 16.1%
ICICI Prudential Life Insurance Company Limited
3
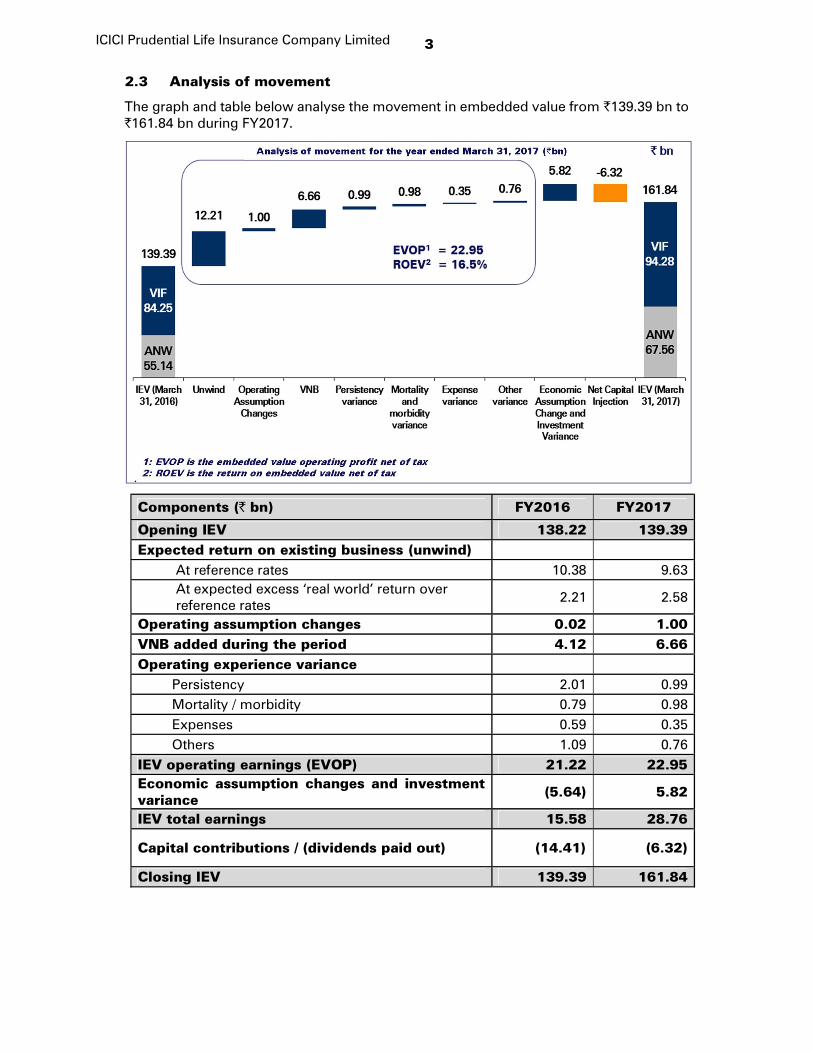
2.3 Analysis of movement The graph and table below analyse the movement in embedded value from 139.39 bn to 161.84 bn during FY2017.
Components ( bn) FY2016 FY2017 Opening IEV 138.22 139.39 Expected return on existing business (unwind) At reference rates 10.38 9.63 At expected excess ‘real world’ return over reference rates 2.21 2.58 Operating assumption changes 0.02 1.00 VNB added during the period 4.12 6.66 Operating experience variance Persistency 2.01 0.99 Mortality / morbidity 0.79 0.98 Expenses 0.59 0.35 Others 1.09 0.76 IEV operating earnings (EVOP) 21.22 22.95 Economic assumption changes and investment variance (5.64) 5.82 IEV total earnings 15.58 28.76 Capital contributions / (dividends paid out) (14.41) (6.32) Closing IEV 139.39 161.84
ICICI Prudential Life Insurance Company Limited
4
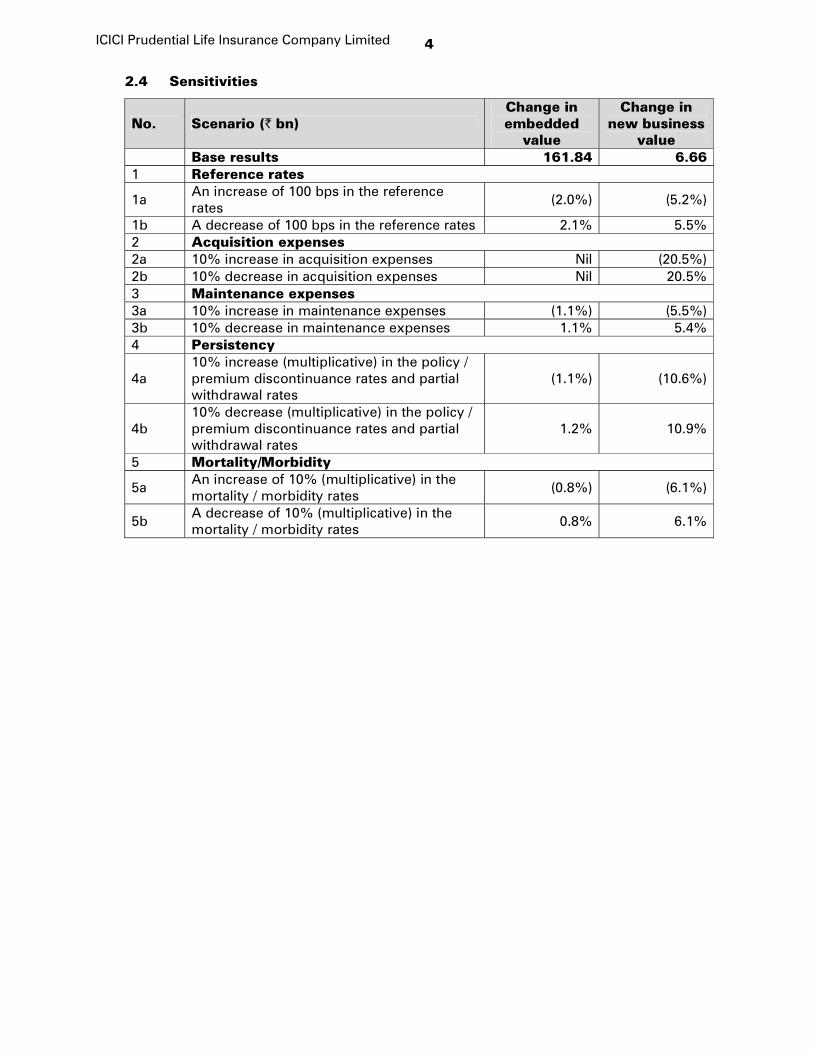
2.4 Sensitivities No. Scenario ( bn) Change in embedded value
Change in new business value Base results 161.84 6.66 1 Reference rates 1a An increase of 100 bps in the reference rates (2.0%) (5.2%) 1b A decrease of 100 bps in the reference rates 2.1% 5.5% 2 Acquisition expenses 2a 10% increase in acquisition expenses Nil (20.5%) 2b 10% decrease in acquisition expenses Nil 20.5% 3 Maintenance expenses 3a 10% increase in maintenance expenses (1.1%) (5.5%) 3b 10% decrease in maintenance expenses 1.1% 5.4% 4 Persistency 4a 10% increase (multiplicative) in the policy / premium discontinuance rates and partial withdrawal rates (1.1%) (10.6%)
4b 10% decrease (multiplicative) in the policy / premium discontinuance rates and partial withdrawal rates 1.2% 10.9% 5 Mortality/Morbidity 5a An increase of 10% (multiplicative) in the mortality / morbidity rates (0.8%) (6.1%) 5b A decrease of 10% (multiplicative) in the mortality / morbidity rates 0.8% 6.1%
ICICI Prudential Life Insurance Company Limited
5
3 Methodology The IEV consists of the two following components: Adjusted net worth (ANW), consisting of:
Free surplus (FS) allocated to the covered business; and Required capital (RC).
Value of in-force covered business (VIF). 3.1 Covered business The business covered under the IEV results (covered business) includes all business that has been written by the Company including the life assurance and pensions business, accident and health-insurance business and group business. The business written by ICICI Prudential Pension Funds Management Co. Ltd., a subsidiary of ICICI Prudential which writes pensions fund management business, is not included as covered business. The value of ICICI Prudential Pension Funds Management Co. Ltd is reflected in ANW based on the value at which it is carried in the audited financial statements of the Company, which is 269.87 mn at March 31, 2017. 3.2 Required capital (RC) RC is the value of assets attributed to the covered business over and above that which is required to back the liabilities for covered business, the distribution of which to shareholders is restricted. The level of RC is set equal to the amount required to be held to meet supervisory requirements or otherwise encumbered by supervisory or legal restrictions that prevent its distribution. The amount of RC is presented from the shareholders’ perspective and is net of the funds for future appropriation (FFAs). 3.3 Free surplus (FS) The FS is the market value of any assets allocated to, but not required to support, the in-force covered business as at the valuation date. The FS has been determined as the adjusted net worth of the Company, less the RC as defined above. The adjusted net worth of the Company is calculated as the net shareholders’ funds as per the audited financial statements, adjusted so as to revalue to market value those assets and those liabilities that are dependent on asset values, which are not at market value in the audited financial statements. The mark to market adjustment is net of tax applicable. The Company has no subordinated or contingent debt. The FFAs, which comprise all funds which have not been explicitly allocated either to policyholders or to shareholders at the valuation date, are reported as policyholder funds. There are separate FFAs for unit-linked and for participating business. The shareholders have a 10% interest in the non-linked FFA accrued in respect of participating business. The unit-linked FFA represents amounts that will accrue to shareholders in respect of policies that have lapsed, unless the policyholder pays the missing premiums. The values of the shareholders’ interests in the FFA are included in the VIF, at their market value, and therefore do not form part of the ANW.
ICICI Prudential Life Insurance Company Limited
6
3.4 Value of in-force business (VIF) The VIF represents the present value of the shareholders’ interest in the earnings distributable from the assets allocated to the business after sufficient allowance for the aggregate risks in the business. The VIF consists of the following components:
the present value of future profits (PVFP); adjusted for the time value of financial options and guarantees (TVFOG); the frictional costs of required capital (FC); and the cost of residual non-hedgeable risks (CRNHR).
Present value of future profits (PVFP) The PVFP is the present value of projected distributable profits to shareholders arising from the in-force covered business, determined by projecting the post taxation shareholder cash flows from the in-force covered business and the assets backing the associated liabilities. The distributable profits also include the release to shareholders of the amounts from the FFA. For products with reviewable rates and charges, the projection of future cash flows assumes that the rates and charges as at the valuation date remain unchanged. The projection of future distributable profits arising from the covered business is carried out using best estimate non-economic assumptions and market consistent economic assumptions. Distributable profits are determined by reference to liabilities determined in accordance with the statutory requirements for life insurance companies. The Company holds ‘global reserves’ calculated outside of its actuarial models as at the valuation date. Wherever appropriate, the shareholders’ interest in the assets backing such global reserves is calculated by assuming a suitable release pattern of such reserves. VIF from one year renewable group term business is reported considering revenue account profitability. The VIF is not included in the closing VIF and is included in VNB instead. Time value of financial options and guarantees (TVFOG) The TVFOG reflects the value of the additional cost to shareholders that may arise from the embedded financial options and guarantees attaching to the covered business. The intrinsic value of such options and guarantees is reflected in the PVFP. A stochastic approach is used to determine the TVFOG using methods and assumptions consistent with the underlying embedded value. The economic assumptions used in determining the TVFOG ensure that the projected cashflows are valued in line with the price of similar cash flows that are traded in the capital markets. Frictional cost (FC) The VIF includes an allowance for the FC of RC for the covered business. These FCs represent investment management expenses and taxation costs associated with holding the RC. The investment costs have been reflected as an explicit reduction from the gross investment return. Cost of residual non-hedgeable risk (CRNHR) The CRNHR is an allowance for risks to shareholder value to the extent that these are not already allowed for in the TVFOG or the PVFP. In particular, the CRNHR makes allowance for:
ICICI Prudential Life Insurance Company Limited
7
asymmetries in the impact of the risks on shareholder value; and risks that are not allowed for in the TVFOG or the PVFP (e.g. operational risk). The CRNHR reflects operational risk, catastrophe mortality/morbidity risk and mass lapsation risk. The CRNHR has been determined using a cost of capital approach. The CRNHR is the present value of a notional cost of capital charge levied on the projected capital in respect of the residual non-hedgeable risks. Allowance has been made for diversification benefits among the non-hedgeable risks, other than the operational risk. The cost of capital charge is assumed to be 4% per annum. 3.5 New business and renewals The VIF includes the value of expected renewal premiums on the in-force business, including any foreseeable variations in the level of renewal premiums, but excludes any value relating to future new business (i.e. the new business that may be written after the applicable valuation date). The VNB reflects the additional value to shareholders created through the activity of writing new business over the stated period ending on the valuation date, and includes the value of expected renewal premiums on that new business. The new business comprises both individual and group policies sold during the reporting period, including the expected renewal premiums and expected future contractual alterations to those contracts. It also includes the non-contractual single premium payments received during the reporting period. The VNB is calculated in the same way as the VIF, with appropriate allowance for changes in the ANW during the reporting period. The VNB is determined as at March 31, 2017 and takes into account acquisition commissions and acquisition expenses at the unit cost level incurred in the full year to March 31, 2017.
ICICI Prudential Life Insurance Company Limited

8
3.6 Analysis of movement of IEV A brief description of the various components is provided below Components Description
Expected return on existing business (1) Expected investment income at opening reference rate on VIF and ANW; and (2) Expected excess ‘real world’ investment return over the opening reference rate on VIF and ANW.
Operating assumption changes This is the impact of the update of non-economic assumptions both on best estimate and statutory bases to those adopted in the closing IEV.
VNB added during the period This is as described in section 3.5 above
Operating experience variance
The variance arising from discontinuance and mortality is analysed at a policy level, by considering the actual change in the policy status from the opening IEV to the closing IEV dates and captures the difference between the actual and expected experience and is calculated in the following order: a. Discontinuance rates b. Mortality / morbidity rates c. Expenses
Economic assumption changes and Investment variance
Economic assumption changes reflect the update of the reference rate yield curve, inflation and valuation economic assumptions from opening IEV to closing IEV. The investment variance is the difference between the actual investment return and the expected ‘real world’ rates for existing business as at March 31, 2016 and the closing and opening reference rates for new business written during FY2016-17.
Capital contributions / (dividends paid out) These are the actual capital infusions / dividends paid out to the shareholders, including the dividend distribution tax incurred during the period.
3.7 Sensitivities Sensitivity analyses are carried out for one parameter at a time and do not include changes in other parameters not explicitly mentioned as part of the sensitivity. The key assumption changes represented by each of the sensitivities and their impact on IEV and VNB are provided in section 2.
ICICI Prudential Life Insurance Company Limited
9
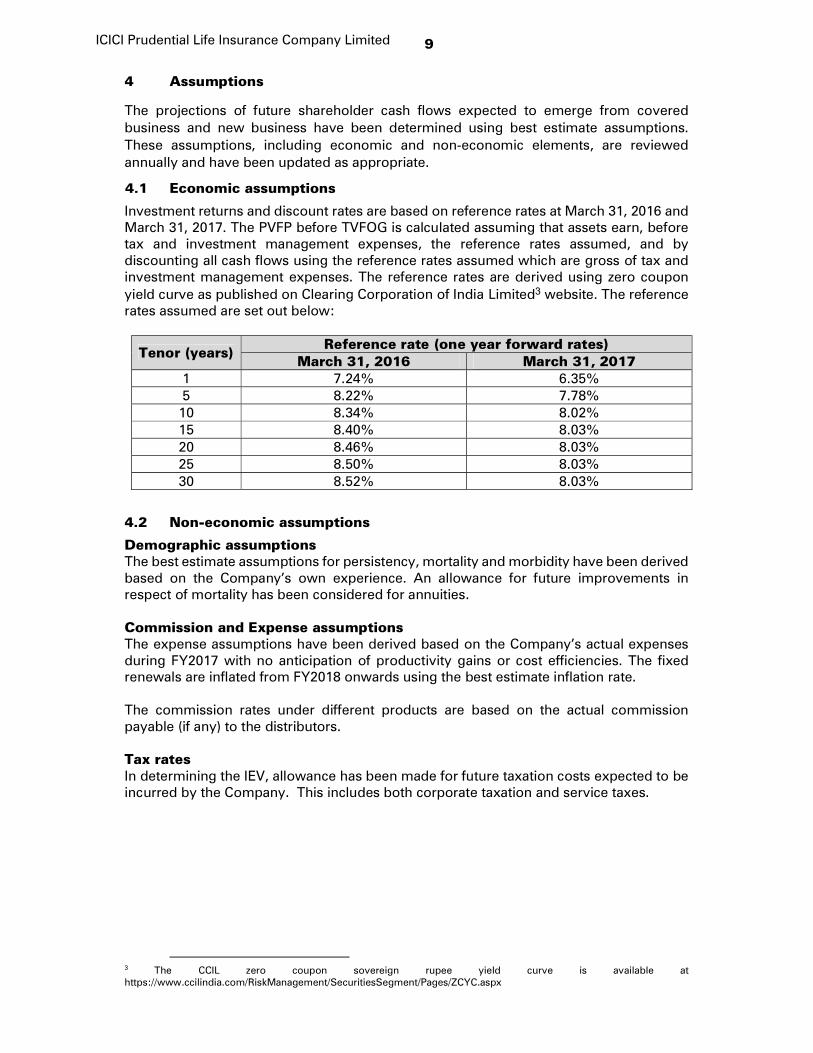
4 Assumptions The projections of future shareholder cash flows expected to emerge from covered business and new business have been determined using best estimate assumptions. These assumptions, including economic and non-economic elements, are reviewed annually and have been updated as appropriate. 4.1 Economic assumptions Investment returns and discount rates are based on reference rates at March 31, 2016 and March 31, 2017. The PVFP before TVFOG is calculated assuming that assets earn, before tax and investment management expenses, the reference rates assumed, and by discounting all cash flows using the reference rates assumed which are gross of tax and investment management expenses. The reference rates are derived using zero coupon yield curve as published on Clearing Corporation of India Limited3 website. The reference rates assumed are set out below:
Tenor (years) Reference rate (one year forward rates) March 31, 2016 March 31, 2017
1 7.24% 6.35% 5 8.22% 7.78%
10 8.34% 8.02% 15 8.40% 8.03% 20 8.46% 8.03% 25 8.50% 8.03% 30 8.52% 8.03%
4.2 Non-economic assumptions Demographic assumptions The best estimate assumptions for persistency, mortality and morbidity have been derived based on the Company’s own experience. An allowance for future improvements in respect of mortality has been considered for annuities. Commission and Expense assumptions The expense assumptions have been derived based on the Company’s actual expenses during FY2017 with no anticipation of productivity gains or cost efficiencies. The fixed renewals are inflated from FY2018 onwards using the best estimate inflation rate. The commission rates under different products are based on the actual commission payable (if any) to the distributors. Tax rates In determining the IEV, allowance has been made for future taxation costs expected to be incurred by the Company. This includes both corporate taxation and service taxes.
3 The CCIL zero coupon sovereign rupee yield curve is available at https://www.ccilindia.com/RiskManagement/SecuritiesSegment/Pages/ZCYC.aspx
ICICI Prudential Life Insurance Company Limited
10
Milliman Advisors LLP B/712, 215 ATRIUM Chakala, Andheri-Kurla Road Andheri (E), Mumbai 400 059 India Tel + 91 (22) 6784 8484 Fax + 91 (22) 6784 8401 milliman.com LLPIN: AAF-5603 R.O.: B/712, 215 ATRIUM, Chakala, Andheri-Kurla Road, Andheri (E), Mumbai 400 059
24 April 2017 The Board of Directors ICICI Prudential Life Insurance Company Limited ICICI PruLife Towers Appasaheb Maratha Marg Prabhadevi, Mumbai - 400 025 Re: Milliman’s opinion on the IEV results as at 31 March 2017 Dear Sirs Introduction ICICI Prudential Life Insurance Company Limited (‘ICICI Prudential’, ‘the Company’) has prepared an Indian Embedded Value (IEV) as at 31 March 2017 and Value of New Business (VNB) for new business sold during the year ending 31 March 2017 (together ‘the Results’), in line with the methodology and principles set out in the Actuarial Practice Standard 10 (APS10) issued by the Institute of Actuaries of India. The Results along with the methodology and assumptions that have been used to prepare the Results have been summarized by the Company in this Annual Report. Scope of services Milliman Advisors LLP (‘Milliman’, ‘we’, ‘us’, ‘our’) has been engaged by ICICI Prudential Life Insurance Company Limited (‘ICICI Prudential’, ‘the Company’) to carry out a review and certification of the Results. Our scope of work includes the following:
a review of the methodology and assumptions used by the Company in developing the Results for compliance with the relevant IEV principles set out in APS10, including a review of process used to conduct the analysis of movement of IEV and various sensitivity analyses;
a review of the Company’s actuarial models used to develop the Results for a selection of model points covering the more material products comprising the VIF and VNB; and
a detailed review of the aggregation templates used by the Company to develop the company level results.
11
Opinion Based on the work carried out and subject to the reliances and limitations mentioned below, we are of the opinion that the Results have been developed in all material respects in accordance with the methodology and principles set out in APS10. In particular:
the methodology used to develop the Results is reasonable and in line with APS10; the assumptions (economic and non-economic) used to develop the Results have largely
been developed in line with the requirements of APS10, using the Company’s operating experience (for non-economic assumptions) and are reasonable;
the Results have been prepared materially in accordance with the methodology and assumptions described in the Annual Report and with the accounting information presented in the financial statements;
the Results have been prepared materially in accordance with the requirements of APS10. Reliances and Limitations This Opinion has been prepared solely for use by ICICI Prudential for inclusion in this Annual Report. It should not be relied upon for any other purpose. Milliman does not intend to create a legal duty to any third party recipient of its work. We have relied on information supplied by the management and staff of ICICI Prudential. Reliance was placed on, but not limited to, the general accuracy of all the information provided to us. We have obtained a management representation letter from ICICI Prudential, stating that, to the best of ICICI Prudential’s knowledge, the data and information provided to us is accurate and complete and that there are no material inaccuracies or omissions therein. An actuarial assessment of the components of value of a life insurance company will not necessarily be consistent with the value of a life insurance company or a portfolio in the open market and should not be interpreted in that manner. The Results are based on a series of assumptions as to future operating experience. It should be recognised that actual experience will differ from these assumptions on account of changes in the operating and economic environment and natural variations in experience. To the extent that actual experience is different from the assumptions, the future projected profits from which the Results are derived will also differ. The Annual Report includes various sensitivity results to illustrate how vulnerable the Results are to changes in assumptions for the key risks. The Results shown are presented at the valuation dates stated in this Report and no warranty is given by Milliman that future experience after these valuation dates will be in line with the assumptions made. The Results have been determined on a going concern basis, and assume a stable economic, legal and regulatory environment going forward. Any change in the general operating environment would add a high degree of uncertainty to the Results. Unless explicitly stated, the Results do not consider any external (including regulatory) developments after the valuation date of 31 March 2017. Kind Regards, Richard Holloway FIAI Partner