
VLFV 7KLVMRXUQDOLV WKH2ZQHU 6RFLHWLHV · Largo D. Dinis, Rua Larga, 3004-535 Coimbra, Portugal 4...
14
Supplementary information for Fluorescence of nitrobenzoxadiazole (NBD) labeled lipids in model membranes is connected not to lipid mobility, but to probe location Mariana Amaro 1 , Hugo A. L. Filipe 2, 3, 4 , J. P. Prates Ramalho 5 , Martin Hof 1, *, and Luís M. S. Loura 2, 4, 6, * 1 Department of Biophysical Chemistry, J. Heyrovský Institute of Physical Chemistry of the Academy of Sciences of the Czech Republic, v.v.i., Dolejskova 3, 182 23 Prague, Czech Republic 2 Centro de Química de Coimbra, Largo D. Dinis, Rua Larga, 3004-535 Coimbra, Portugal 3 Departamento de Química, Faculdade de Ciências e Tecnologia, Universidade de Coimbra, Largo D. Dinis, Rua Larga, 3004-535 Coimbra, Portugal 4 Centro de Neurociências e Biologia Celular, Universidade de Coimbra, 3004-504 Coimbra, Portugal 5 Departamento de Química and Centro de Química de Évora, Escola de Ciências e Tecnologia, Universidade de Évora, Rua Romão Ramalho, 59, 7000-671 Évora, Portugal 6 Faculdade de Farmácia, Universidade de Coimbra, Pólo das Ciências da Saúde, Azinhaga de Santa Comba, P-3000-548 Coimbra, Portugal * Corresponding authors M.H.: Telephone: +420-266053264; Fax: +420-286582677; E-mail [email protected] L.M.S.L.: Telephone: +351-239488485; Fax: +351-239827126; E-mail: [email protected] Electronic Supplementary Material (ESI) for Physical Chemistry Chemical Physics. This journal is © the Owner Societies 2015
Transcript of VLFV 7KLVMRXUQDOLV WKH2ZQHU 6RFLHWLHV · Largo D. Dinis, Rua Larga, 3004-535 Coimbra, Portugal 4...

Supplementary information for
Fluorescence of nitrobenzoxadiazole (NBD) labeled lipids in model membranes is connected
not to lipid mobility, but to probe location
Mariana Amaro 1, Hugo A. L. Filipe 2, 3, 4, J. P. Prates Ramalho 5, Martin Hof 1,*, and Luís M. S.
Loura 2, 4, 6,*
1 Department of Biophysical Chemistry, J. Heyrovský Institute of Physical Chemistry of the
Academy of Sciences of the Czech Republic, v.v.i., Dolejskova 3, 182 23 Prague, Czech
Republic
2 Centro de Química de Coimbra, Largo D. Dinis, Rua Larga, 3004-535 Coimbra, Portugal
3 Departamento de Química, Faculdade de Ciências e Tecnologia, Universidade de Coimbra,
Largo D. Dinis, Rua Larga, 3004-535 Coimbra, Portugal
4 Centro de Neurociências e Biologia Celular, Universidade de Coimbra, 3004-504 Coimbra,
Portugal
5 Departamento de Química and Centro de Química de Évora, Escola de Ciências e Tecnologia,
Universidade de Évora, Rua Romão Ramalho, 59, 7000-671 Évora, Portugal
6 Faculdade de Farmácia, Universidade de Coimbra, Pólo das Ciências da Saúde, Azinhaga de
Santa Comba, P-3000-548 Coimbra, Portugal
* Corresponding authors
M.H.: Telephone: +420-266053264; Fax: +420-286582677; E-mail [email protected]
L.M.S.L.: Telephone: +351-239488485; Fax: +351-239827126; E-mail: [email protected]
Electronic Supplementary Material (ESI) for Physical Chemistry Chemical Physics.This journal is © the Owner Societies 2015

2
1. Supplementary tables
Table S1. Atomic charges used for NBD-PS. Identically to the host lipid, acyl-chain CHn united
atoms (unnumbered in Fig. 1C) were modeled with zero charge.
Atom Charge Atom Charge Atom Charge Atom Charge Atom Charge
N1 -0.28 O8 -0.56 C15 0.16 C22 0.31 C44 0.92
C2 0.02 N9 -0.34 C16 0.24 C23 0.32 O45 -0.61
C3 -0.08 C10 0.33 O17 -0.51 O24 -0.68 C65 0.70
C4 -0.02 C11 0.45 P18 1.21 C25 0.82 O66 -0.73
C5 -0.22 O12 -0.04 O19 -0.78 O26 -0.68 O67 -0.73
N6 0.81 N13 -0.25 O20 -0.78 C42 0.25
O7 -0.60 H14 0.32 O21 -0.49 O43 -0.48
Table S2. Atomic charges used for NBD-PSH. Identically to the host lipid, acyl-chain CHn
united atoms (unnumbered in Fig. 1C) were modeled with zero charge.
Atom Charge Atom Charge Atom Charge Atom Charge Atom Charge
N1 0.20 O8 -0.48 C15 -0.14 C22 0.31 C46 0.92
C2 -0.09 N9 -0.34 C16 0.36 C23 0.32 O47 -0.61
C3 -0.10 C10 0.43 O17 -0.50 O24 -0.68 C65 0.63
C4 0.10 C11 0.36 P18 1.16 C25 0.82 O66 -0.50
C5 -0.29 O12 0.04 O19 -0.71 O26 -0.68 O67 -0.52
N6 0.80 N13 -0.31 O20 -0.71 C44 0.25 H68 0.30
O7 -0.51 H14 0.07 O21 -0.42 O45 -0.48

3
Table S3. Calculated absorption data of NBD-C2 in different solvents and main orbitals involved in the transition. Experimental data (Exp)
is taken from references for (NBD-C3) 1 and (NBD-C1)
2.
PCM-PBE0/6-
31+G(d)
PCM-PBE0/6-
311+G(d,p)
SMD-M06/6-
31+G(d)
SMD-M06/6-
311+G(d,p)
Solvent State λ (nm) f λ (nm) f λ (nm) f λ (nm) f Exp Major MO → MO
transitions
Cyclohexane S1 407 0.37 411 0.36 413 0.35 415 0.34
425a
425b HOMO->LUMO (98%)
HOMO->L+1 (2%)
S3 306 0.22 308 0.22 308 0.21 309 0.21 305a HOMO->L+1 (97%)
HOMO->LUMO (2%)
Tetrahydrofuran S1 416 0.39 420 0.38 422 0.35 425 0.35
457a
454b HOMO->LUMO (97%)
HOMO->L+1 (3%)
S3 316 0.25 318 0.25 317 0.25 319 0.25 325a HOMO->L+1 (96%)
HOMO->LUMO (3%)
Acetone S1 417 0.38 421 0.37 424 0.34 427 0.34
461a
456b HOMO->LUMO (96%)
HOMO->L+1 (3%)
S3 318 0.26 320 0.26 320 0.26 322 0.26 332a HOMO->L+1 (96%)
HOMO->LUMO (3%)
Dimethylsulphoxide S1 420 0.41 424 0.40 425 0.35 429 0.35
478a
474b HOMO->LUMO (96%)
HOMO->L+1 (3%)
S2 320 0.26 323 0.27 321 0.26 323 0.26 343a HOMO->L+1 (96%)
HOMO->LUMO (3%)
Ethanol S1 417 0.38 421 0.38 425 0.39 428 0.39
464a
459b HOMO->LUMO (96%)
HOMO->L+1 (4%)
S2 319 0.26 321 0.27 326 0.26 328 0.26 331a HOMO->L+1 (95%)
HOMO->LUMO (4%)
Water S1 417 0.38 421 0.37 425 0.39 429 0.39
482a
478b HOMO->LUMO (95%)
HOMO->L+1 (4%)
S3 319 0.26 321 0.27 328 0.26 330 0.26 348a HOMO->L+1 (95%)
HOMO->LUMO (4%)
f: oscillator strength
(1) Fery-Forgues, S.; Fayet, J.-P.; Lopez, A. J. Photochem. Photobiol. A Chem. 1993, 70, 229.
(2) Uchiyama, S.; Santa, T.; Imai, K. J. Chem. Soc. Perkin Trans. 2 1999, 2525.

4
Table S4. Calculated emission data of NBD-C2 in several solvents. Experimental data is taken from references for (NBD-C3) 1 and (NBD-
C1) 2.
PCM-PBE0/6-
31+G(d)
PCM-PBE0/6-
311+G(d,p)
SMD-M06/6-
31+G(d)
SMD-M06/6-
311+G(d,p) Experimental
Solvent λ (nm) λ (nm) λ (nm) λ (nm) λ (nm)
Cyclohexane 466 471 473 477 495a
499b
Tetrahydrofuran 484 489 495 499 525a
516b
Acetone 489 495 501 505 529a
521b
Dimethylsulphoxide 491 496 504 508 545a
532b
Ethanol 490 495 500 505 537a
524b
Water 491 497 503 508 566a
541b
(1) Fery-Forgues, S.; Fayet, J.-P.; Lopez, A. J. Photochem. Photobiol. A Chem. 1993, 70, 229.
(2) Uchiyama, S.; Santa, T.; Imai, K. J. Chem. Soc. Perkin Trans. 2 1999, 2525.

5
Table S5. Dipole moments (µ /D) of NBD-C2 in different solvents and in the gas phase, with different solvent models and different basis
sets.
Solvent
PCM-B3LYP/6-
31+G(d)
SMD-B3LYP/6-
31+G(d) PCM-PBE0/6-31+G(d)
PCM-PBE0/6-
311+G(d,p)
µg µe ∆µ µg µe ∆µ µg µe ∆µ µg µe ∆µ
Cyclohexane 12.24 14.38 2.14 12.11 14.33 2.22 12.16 14.30 2.14 12.20 14.34 2.13
Tetrahydrofuran 14.47 16.40 1.93 14.06 16.29 2.23 14.34 16.28 1.94 14.40 16.33 1.94
Acetone 15.16 16.96 1.80 14.76 16.89 2.12 15.02 16.83 1.81 15.08 16.89 1.81
Dimethylsulphoxi
de 15.40 17.15 1.75 14.87 17.03 2.16 15.25 17.01 1.76 15.32 17.08 1.76
Ethanol 15.22 17.01 1.79 15.91 17.54 1.62 15.08 16.88 1.80 15.14 16.94 1.80
Water 15.47 17.21 1.74 16.34 17.81 1.47 15.33 17.07 1.75 15.39 17.14 1.75
Gas phase B3LYP/6-31+G(d) PBE0/6-31+G(d) PBE0/6-311+G(d,p)
10.27 12.33 2.05 10.23 12.28 2.05 10.26 12.30 2.04
(µg) dipole moment of the ground state
(µe) dipole moment of the excited state
∆µ = µg - µe
6
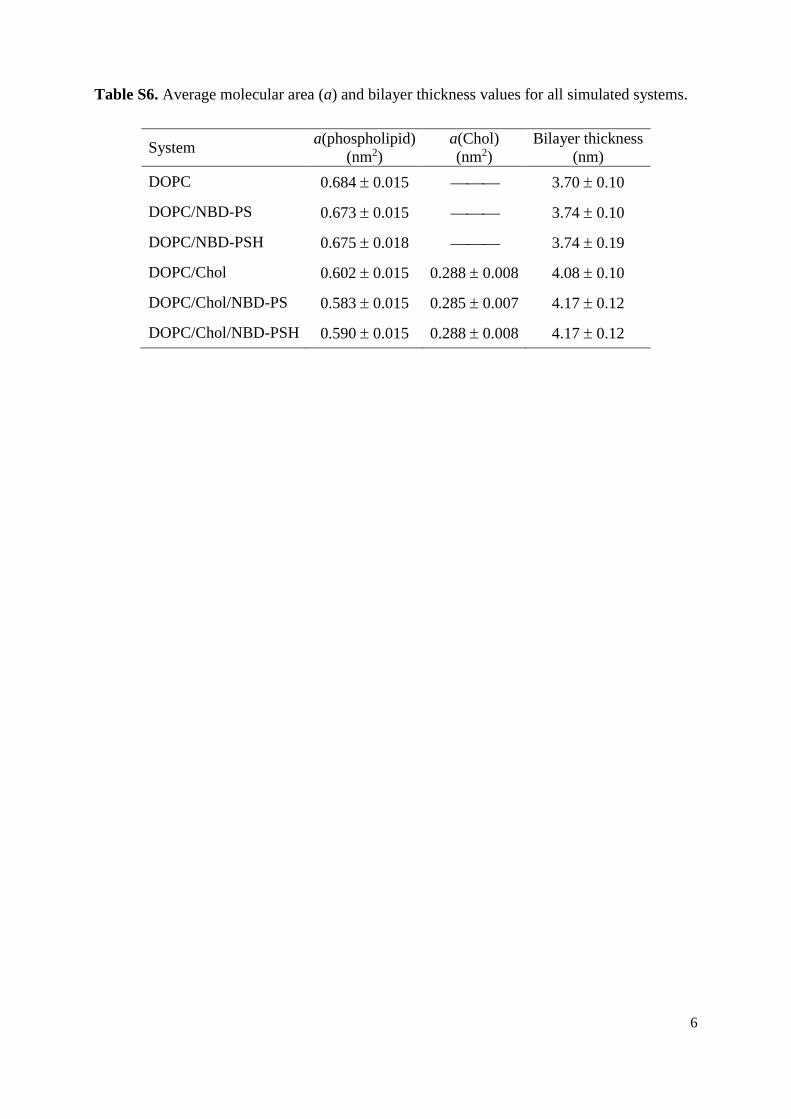
Table S6. Average molecular area (a) and bilayer thickness values for all simulated systems.
System a(phospholipid)
(nm2)
a(Chol)
(nm2)
Bilayer thickness
(nm)
DOPC 0.684 0.015 3.70 0.10
DOPC/NBD-PS 0.673 0.015 3.74 0.10
DOPC/NBD-PSH 0.675 0.018 3.74 0.19
DOPC/Chol 0.602 0.015 0.288 0.008 4.08 0.10
DOPC/Chol/NBD-PS 0.583 0.015 0.285 0.007 4.17 0.12
DOPC/Chol/NBD-PSH 0.590 0.015 0.288 0.008 4.17 0.12

7
2. Supplementary figures
HOMO LUMO
S0→S1 →
HOMO LUMO+1
S0→S3 →
Figure S1. Plot of the orbitals mainly involved in the two lowest energy transitions of NBD-
C2 in solution.
Figure S2. Representation of the calculated ground and excited state dipole moment vectors
(labeled as g and e), as well as its vector difference (red arrow), for NBD-C2 in
cyclohexane (left) and water (right).

8
500 520 540 560 580 600 6200
5
10
wavelength(nm)
pH5
I (a
.u.)
Blue shift with
time after excitation pH7
0.3 ns
1.3 ns
0.09 ns
50 ns
0.01 ns
Figure S3. Selected time-resolved emission spectra (TRES) of NBD-PS in DOPC LUVs at
pH 5, 20ºC. TRES were generated from 0.01ns to 50ns in a logarithmic time-scale of 100
steps. The grey vertical line is positioned at the maxima of the first generated spectra and is
meant to be a guide for the eye. The dashed vertical line is the equivalent for NBD-PS in
DOPC at pH 7, 20ºC (shown as Figure 7 in the main text). The dashed line is displayed to
illustrate the how, at pH 5, the first generated spectrum is already shifted to shorter
wavelengths compared to pH 7.
530 550 570 590 610
4.9
5.2
5.5
5.8
6.1
DOPC pH 7
pH 5
<>
(ns)
wavelength(nm)
Figure S4. Amplitude-averaged lifetime values calculated from the 3-exponential fits of the
lifetime decays of NBD-PS (T = 20ºC) in DOPC and DOPC/Chol, at both pH 5 and pH 7. The
average lifetimes were calculated as , where .
9
0.62
0.64
0.66
0.68
0.70
0.72
0 50 100 150 200 250 300t /ns
a /nm2
DOPC DOPC/NBD-PS DOPC/NBD-PSH
A
0.20
0.30
0.40
0.50
0.60
0 100 200 300 400t /ns
a /nm2
DOPC/Chol (phospholipid) DOPC/Chol/NBD-PS (phospholipid)
DOPC/Chol/NBD-PSH (phospholipid) DOPC/Chol (sterol)
DOPC/Chol/NBD-PS (sterol) DOPC/Chol/NBD-PSH (sterol)
B
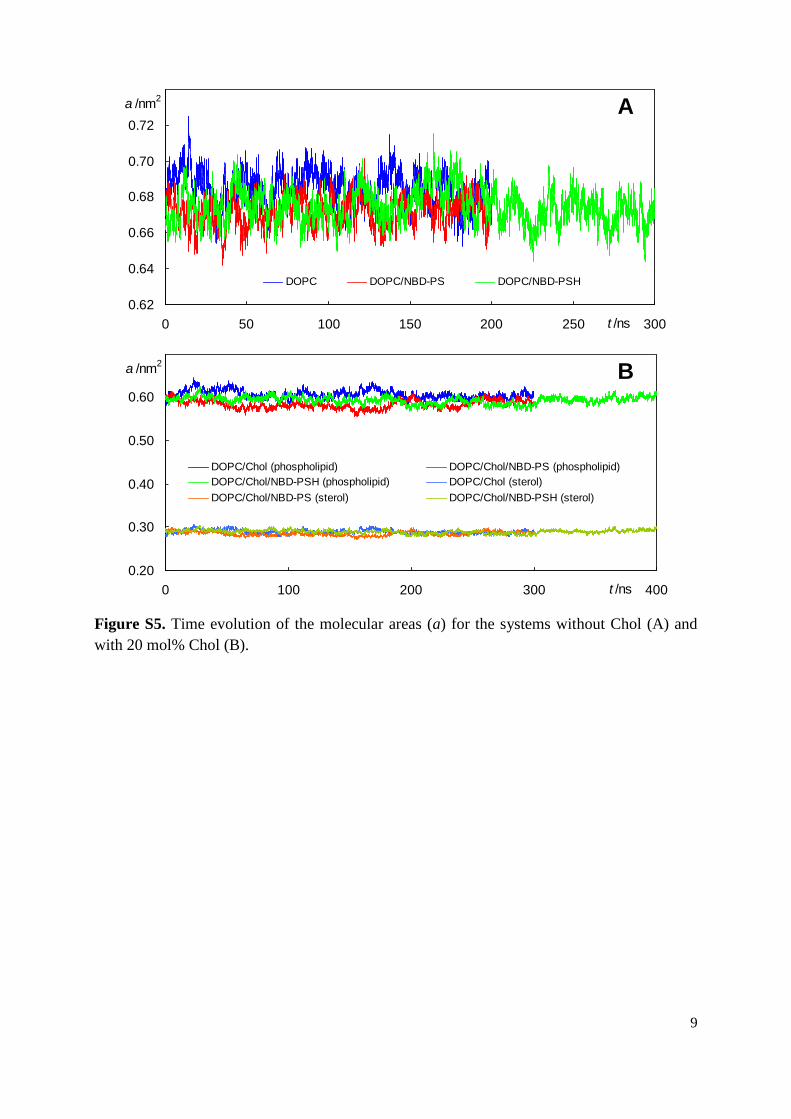
Figure S5. Time evolution of the molecular areas (a) for the systems without Chol (A) and
with 20 mol% Chol (B).

10
-3
-2
-1
0
1
2
0 50 100 150 200t /ns
z /nm
A
-3
-2
-1
0
1
2
0 50 100 150 200 250 300t /ns
B
-4
-2
0
2
0 50 100 150 200 250 300
z /nm
t /ns
C
-4
-2
0
2
0 50 100 150 200 250 300 350 400t /ns
D
Figure S6: Time evolutions of the transverse position z of the fluorophore center of mass, for the 4 individual NBD-PS or NBD-PSH probes in
each system (from A to D: DOPC/NBD-PS, DOPC/NBD-PSH, DOPC/Chol/NBD-PS, DOPC/Chol/NBD-PSH).

11
Figure S7. Final structures of all simulated systems. From A to F: DOPC, DOPC/NBD-PS,
DOPC/NBD-PSH, DOPC/Chol, DOPC/Chol/NBD-PS, DOPC/Chol/NBD-PSH.
A D
B E
C F

12
0.0
0.2
0.4
0.6
NH-H2O H2O-N1 H2O-N6 H2O-O7 H2O-O8 H2O-N9 H2O-O12 H2O-N13
f NBD-PS/DOPC NBD-PSH/DOPC NBD-PS/DOPC/Chol NBD-PSH/DOPC/Chol
Figure S8. H-bonding between the NBD NH (donors) and H2O O (acceptors) atoms (far left),
and between H2O (donors) and all NBD fluorophore nitrogen and oxygen atoms. For NBD atom
numbering, see Fig. 1D. f denotes the fraction of configurations for which H-bonds are formed
(relative to the maximal theoretical number).

13
0.1
0.2
0.3
0.4
0.5
1.0 1.5 2.0 2.5 3.00.0
0.1
0.2
0.3
0.4
0.5
1.0 1.5 2.0 2.5 3.0
f (n
=0)
A
B
5
10
15
20
/k
g m
-3
f (n
=0)
z/nm
C
z/nm
D
0
5
10
15
20
/k
g m
-3
Figure S9. Fraction f(n = 0) of conformations for which no H-bonding is observed (magenta
line), as a function of the transverse location of the fluorophore centre of mass relative to the
bilayer midplane (z), for the (A) DOPC/NBD-PS, (B) DOPC/NBD-PSH, (C) DOPC/Chol/NBD-
PS, and (D) DOPC/Chol/NBD-PSH systems. The dotted blue line represents the average DOPC
phosphorus atom location in each system, while the black curve is the NBD mass distribution
profile (z).

14
0
200
400
600
800
1000
0.0 0.5 1.0 1.5 2.0 2.5
DOPC I = 150 mM Water I = 150 mM NBD*20 I = 150 mM
DOPC I = 0 Water I = 0 NBD*20 I = 0
z /nm
/kgm-3
0
200
400
600
800
1000
0.0 0.5 1.0 1.5 2.0 2.5 3.0
DOPC I = 150 mM Chol I = 150 mM Water I = 150 mM NBD*20 I = 150 mM
DOPC I = 0 Chol I = 0 Water I = 0 NBD*20 I = 0
z /nm
/kgm-3
0
200
400
600
800
1000
0.0 0.5 1.0 1.5 2.0 2.5 3.0
DOPC I = 150 mM Chol I = 150 mM Water I = 150 mM NBD*20 I = 150 mM DOPC I = 0 Chol I = 0 Water I = 0 NBD*20 I = 0
Figure S10. Mass density profiles of host lipid, water and NBD fluorophore, simulated in the absence (I = 0) and presence (I = 150 mM) of
added NaCl, for the (A) DOPC/NBD-PS, (B) DOPC/NBD-PSH, (C) DOPC/Chol/NBD-PS, and (D) DOPC/Chol/NBD-PSH systems.
A
B
C
D


