Vix Strategy
15
Lisa Majmin INTERNATIONAL FINANCE CORP 247886 EUROPEAN INVESTMENT STRATEGY January 9, 2014 In this Issue: F Low Volatility Doesn’t Last ............ 2 F Why Stability Is Unstable ................. 3 F The Best Way To Trade Volatility ........ 4 F Is There Too Much Complacency In The Euro Area? ............... 5 WEEKLY REPORT Is Stability Unstable? Periodical [email protected] • TEL 514.499.9550 • www.bcaresearch.com Copyright © 2014 BCA Research Inc. All Rights Reserved. Refer to last page. 1 Periods of low stock market volatility sow the seeds of their own destruction, because they encourage complacency and an under-pricing of risk. Buy the near month VIX contract and simultaneously sell the far month contract when the futures curve is upwardly sloping (taking into account the bid-offer spreads). Two important indicators will track whether the euro area’s main imbalances are correcting: higher labour cost inflation in Germany compared to the other major euro area economies, and a converging distribution of bank lending rates across the euro area. Maintain a holding in the aggregate euro area sovereign bond… …and a long Eurostoxx, short S&P 500 equity market pair trade. 50 40 30 20 10 1915 1925 1935 1945 1955 1965 1975 1985 1995 2005 50 40 30 20 10 VOLATILITY OF DOW JONES INDEX* % % *ANNUALISED STANDARD DEVIATION OF MONTHLY RETURNS OVER ROLLING 12-MONTH PERIODS. CHART OF THE WEEK Volatility Has Mean-Reverted For A Century © BCA Research 2014
-
Upload
lisa-majmin -
Category
Documents
-
view
89 -
download
6
description
BCA - using volatility to
Transcript of Vix Strategy

Lisa Majmin INTERNATIONAL FINANCE CORP 247886
EUROPEAN INVESTMENT STRATEGY
January 9, 2014
In this Issue: F Low Volatility Doesn’t Last ............ 2
F Why Stability Is Unstable ................. 3
F The Best Way To Trade Volatility ........ 4
F Is There Too Much Complacency In The Euro Area? ............... 5
WEEKLY REPORT Is Stability Unstable?
Periodical
[email protected] • TEL 514.499.9550 • www.bcaresearch.com Copyright © 2014 BCA Research Inc. All Rights Reserved. Refer to last page. 1
Periods of low stock market volatility sow the seeds of their own destruction, because they encourage complacency and an under-pricing of risk.
Buy the near month VIX contract and simultaneously sell the far month contract when the futures curve is upwardly sloping (taking into account the bid-offer spreads).
Two important indicators will track whether the euro area’s main imbalances are correcting: higher labour cost inflation in Germany compared to the other major euro area economies, and a converging distribution of bank lending rates across the euro area.
Maintain a holding in the aggregate euro area sovereign bond…
…and a long Eurostoxx, short S&P 500 equity market pair trade.
50
40
30
20
10
1915 1925 1935 1945 1955 1965 1975 1985 1995 2005
50
40
30
20
10
VOLATILITY OFDOW JONES INDEX*
% %
*ANNUALISED STANDARD DEVIATION OF MONTHLY RETURNS OVER ROLLING 12-MONTH PERIODS.
chart of the week
Volatility Has Mean-Reverted For A Century
© BCA Research 2014

Lisa Majmin INTERNATIONAL FINANCE CORP 247886
european investment strategy - weekly report january 9, 2014BCa researCh inC.
[email protected] • TEL 514.499.9550 • www.bcaresearch.com Copyright © 2014 BCA Research Inc. All Rights Reserved. Refer to last page. 2
20
15
10
5
1964 1969 1974 1979 1984 1989 1994 1999 2004 2009 2014
20
15
10
5
VOLATILITY OFFTSE ALL SHARE INDEX*
% %
*ANNUALISED STANDARD DEVIATION OF MONTHLY RETURNS OVER ROLLING 12-MONTH PERIODS.
chart 2
Stock Market Volatility Has No Trend In The U.K.
© BCA Research 2014
Low Volatility Doesn’t Last
If there is a universal truth in economics and financial markets it is that periods of subdued volatility do not last. This is true for the economy, but it is especially true for the stock market.
Volatility has no long-term trend and always and inevitably mean-reverts. Furthermore, this result is remarkably consistent across different geographies and economic eras spanning years, decades and even centuries1 (Chart of the Week, Chart 2 and Chart 3).
Nevertheless, the powerful evidence of volatility’s long-term constancy does not prevent a com-mon delusion. An extended period of low volatility has frequently seduced leading politicians and economists into complacency – that economic and financial market instability has been conquered.
Barely a week before the Great Crash of 1929, Yale University’s Professor of Economics Irving Fisher famously predicted that “stocks have reached what looks like a permanently higher plateau”. More recently, Ben Bernanke’s self-congratulatory 2004 speech titled The Great Moderation claimed that recessions had become less severe because of “improved-monetary policy”. And Britain’s former Chancellor and Prime Minister, Gordon Brown, infamously boasted in 2007 that “we will never return to the old boom and bust”.
1 G. William Schwert of the University of Rochester shows stock market volatility going back to 1802 at www.schwert.ssb.rochester.edu/volatility.htm
Periods of subdued volatility do not last.

Lisa Majmin INTERNATIONAL FINANCE CORP 247886
european investment strategy - weekly report january 9, 2014BCa researCh inC.
[email protected] • TEL 514.499.9550 • www.bcaresearch.com Copyright © 2014 BCA Research Inc. All Rights Reserved. Refer to last page. 3
40
35
30
25
20
15
10
5
1975 1980 1985 1990 1995 2000 2005 2010
40
35
30
25
20
15
10
5
VOLATILITY OFEURO AREA EQUITY INDEX*
% %
*ANNUALISED STANDARD DEVIATION OF MONTHLY RETURNS OVER ROLLING 12-MONTH PERIODS.
chart 3
Stock Market Volatility Has No Trend In The Euro Area
© BCA Research 2014
Why Stability Is UnstableOf course, in each case volatility did mean-revert with a vengeance, and an excellent explanation why comes from Hyman Minsky’s Financial Instability Hypothesis. Put simply, periods of low vola-tility sow the seeds of their own destruction, because they encourage complacency and an under-pricing of risk.
As a period of stability extends, more and more people – including policymakers – become convinced that it is permanent. This allows valuations of revenue streams to become richer, and financing arrangements to become riskier.
The Minsky cycle begins with hedge finance when borrowers’ expected revenues are sufficient to repay interest and loan principal. It then moves on to speculative finance when revenues cover interest. And it escalates to Ponzi finance when revenues are insufficient to cover interest payments – bor-rowers are entirely dependent on capital gains to meet their obligations. The cycle ends violently with a so-called Minsky moment – a small drop in asset prices that tips the marginal Ponzi financed borrower into insolvency and triggers a widespread corrective phase of de-levering and re-pricing.
Although Minsky focussed his instability hypothesis on the economy, we can draw very strong paral-lels in the stock market. An unusually extended period of subdued volatility – like now – encourages an under-pricing of risk for three reasons:
Volatility has no long-term trend and always and inevitably mean-reverts.

Lisa Majmin INTERNATIONAL FINANCE CORP 247886
european investment strategy - weekly report january 9, 2014BCa researCh inC.
[email protected] • TEL 514.499.9550 • www.bcaresearch.com Copyright © 2014 BCA Research Inc. All Rights Reserved. Refer to last page. 4
1. Many asset allocation models – such as mean-variance optimisers – use past vola-tility as a predictor of future equity market risk, but tend to put a much greater weight on recent history than on distant history. In other words, just as Minsky points out, investors complacently expect the low recently experienced volatility to persist indefinitely and forget the long-term mean reversion.
2. This expectation of low volatility, and hence smaller drawdowns, emboldens equity investors to take on greater leverage. For example, note that NYSE margin debt (as a share of GDP) is approaching an all-time high.
3. Subdued volatility normally implies an extended uptrend in stock prices. And in an industry where calendar quarter perfor-mance determines your livelihood, fund managers simply cannot afford to be under-invested – irrespective of their long-term view of valuations. As more and more long-term bears are forced to capitulate, there is no longer a healthy balance of views to price equity market risk.
The Best Way To Trade VolatilityDoes all of this mean investors should buy volatility today? For those wanting insurance for an imminent large spike in risk, the answer is perhaps yes. But for anybody looking for a profitable investment opportunity, it’s not that simple. Unlike most financial and physical assets, it is impos-sible to buy or sell the spot volatility indices like the VSTOXX, VDAX or VIX. Instead, investors have to buy derivatives of these indices – either futures or options. And unfortunately, this means they will be exposed to the pricing vagaries of these derivative instruments.
Specifically, when spot volatility is low everybody expects it to rise. Hence, the futures price is in contango, which is to say more expensive than the spot price. Indeed, the lower the spot, the greater the contango. Such an upward sloping futures curve can make a buy-and-hold volatility strategy prohibitively expensive. For example, if spot volatility stayed unchanged for a month, the one-month future contract would roll down the curve and expire at a loss. Clearly, repeating this strategy month after month would make it a very costly trade.
Periods of low volatility sow the seeds of their own destruction, because they encourage complacency and an under-pricing of risk.
1.3
1.2
1.1
1.0
.9
.8
.7
2008 2009 2010 2011 2012 2013 2014
1.3
1.2
1.1
1.0
.9
.8
.7
706050
40
30
20
706050
40
30
20
VIX FUTURES:FAR-MONTH / NEAR-MONTH
VIX SPOT INDEX
chart 4
When Volatility Spikes, The Futures Curve Inverts Sharply...
© BCA Research 2014

Lisa Majmin INTERNATIONAL FINANCE CORP 247886
european investment strategy - weekly report january 9, 2014BCa researCh inC.
[email protected] • TEL 514.499.9550 • www.bcaresearch.com Copyright © 2014 BCA Research Inc. All Rights Reserved. Refer to last page. 5
Luckily, there is a much better way to trade volatility. Whenever the futures curve is upwardly sloping (after taking into account bid-offer spreads), investors shouldn’t trade volatility per se, but instead trade the steepness of the volatil-ity futures curve. In practical terms this means buying the near month futures contract while simultaneously selling the far month contract.
The theory behind this strategy is that when risk eventually flares up, the futures curve tends to invert sharply – go into backwardation – as a market in panic puts much higher value on immediate protection (Chart 4 and Chart 5). So the gain on the long near position is much greater than any loss on the short far position. On the other hand, if volatility remains low, the monthly expense is minimised as both the long and short positions roll down the futures curve by near identical amounts. Therefore, with or without an imminent spike in risk, the strategy leaves open the possibility of large profits while reducing the penalising monthly rollover costs.
We are opening this strategy today on the VIX in preference to our current position on the VSTOXX, which we are closing at a small profit.
Is There Too Much Complacency In The Euro Area?If stability sows the seeds of its own destruction, then the euro area might seem the top candidate for trouble. Over the last few years, euro area policy makers have pushed through painful but es-sential structural adjustments only when under intense pressure from financial markets. But with a fledgling recovery underway in the economy and a long period of calm in the markets, is the structural progress at risk of stalling in 2014?
To answer this question, it is necessary to to define progress. First, it is important to recognise that the aggregate euro area remains relatively balanced. Indeed, as Mario Draghi recently pointed out:2
“If you look at the euro area from a distance, you see that the fundamentals in this area are prob-ably the strongest in the world. This is the area that has the lowest budget deficit in the world. Our aggregate public deficit is actually a small surplus. We have a small primary surplus of 0.7%, compared with, I think, a deficit of 6 or 7% deficit in US and 8% in Japan. This is the area with
70
60
50
40
30
20
2008 2009 2010 2011 2012 2013 2014
1.4
1.3
1.2
1.1
1.0
.9
.8
VIX SPOT INDEX (LS)VIX FUTURES:
NEAR-MONTH / FAR-MONTH (RS)
chart 5
...The Near-Month Volatility Future Rises More Than The Far-Month
© BCA Research 2014
2 At the ECB’s November Press Conference
In a market panic, investors want immediate protection.

Lisa Majmin INTERNATIONAL FINANCE CORP 247886
european investment strategy - weekly report january 9, 2014BCa researCh inC.
[email protected] • TEL 514.499.9550 • www.bcaresearch.com Copyright © 2014 BCA Research Inc. All Rights Reserved. Refer to last page. 6
78
76
74
72
70
68
66
64
2000 2002 2004 2006 2008 2010 2012 2014
78
76
74
72
70
68
66
64
EMPLOYMENT TO POPULATION RATE*:U.S.EURO AREA
% %
*EMPLOYMENT AS A PERCENTAGE OF POPULATION AGED 15-64.SOURCE: OECD.
140
130
120
110
100
90
80
1998 2000 2002 2004 2006 2008 2010 2012 2014 2016
140
130
120
110
100
90
80
HARMONISED COMPETITIVENESS INDICATORSBASED ON GDP DEFLATORS
SOURCE: ECB HARMONISED COMPETITIVENESS INDICATORSBASED ON GDP DEFLATORS RELATIVETO TOP 20 TRADING PARTNERS;REBASED TO Q1 1999 = 100.
150
140
130
120
110
100
2000 2002 2004 2006 2008 2010 2012 2014
150
140
130
120
110
100
TOTAL LABOUR COST*
* REBASED TO Q2 2000 = 100.
chart 6
Euro Area Employment To Population Is Better Than Ten Years Ago
chart 7
The Main Euro Area Imbalances Are Internal
chart 8
The Competitiveness Gap Between Germany And The Rest Must Narrow
© BCA Research 2014 © BCA Research 2014
© BCA Research 2014
the highest current account surplus. And it is also the area with one of the lowest – if not the lowest – inflation rate.”
Even the euro area’s weak suit, employment, does not appear so bad based on the employ-ment to population rate (Chart 6) – which takes into account the euro area’s structurally rising participation rate.
Therefore, the main euro area imbalances that must be corrected are not external, but internal. Specifically, to justify a common exchange rate and interest rate for euro area nations, the com-petitiveness gap between Germany and the other major economies must continue to narrow (Chart 7 and Chart 8). Just as important, the fragmenta-tion of the financial system – which has created a large disparity in financial conditions across the euro area – must continue to reverse.
The euro area’s weak suit, employment, does not appear so bad based on the employment to population rate.
Convergence
Spain
Less competitive
Germany
More competitive
Spain
Germany
Productivity plus inflation
Italy
France

Lisa Majmin INTERNATIONAL FINANCE CORP 247886
european investment strategy - weekly report january 9, 2014BCa researCh inC.
[email protected] • TEL 514.499.9550 • www.bcaresearch.com Copyright © 2014 BCA Research Inc. All Rights Reserved. Refer to last page. 7
6
5
4
3
2
1
0
2008 2009 2010 2011 2012 2013 2014
6
5
4
3
2
1
0
LABOUR COSTINFLATION (1-YEAR)*
% %
*SOURCE: ECB.
7.0
6.5
6.0
5.5
5.0
4.5
4.0
3.5
2008 2009 2010 2011 2012 2013 2014 2015
7.0
6.5
6.0
5.5
5.0
4.5
4.0
3.5
BANK LENDING RATE*
% %
* 1-5 YEAR LOANS UP TO A MILLION EUROS; SOURCE: ECB.
chart 9
Higher Wage Inflation In Germanychart 10
Financial Fragmentation Is Reversing
© BCA Research 2014 © BCA Research 2014
Hence, two important indicators will encapsulate the euro area’s on-going adjustment through 2014 and beyond: higher labour cost inflation in Germany compared to the other major euro area econo-mies (Chart 9), and a converging distribution of bank lending rates across the euro area (Chart 10). As long as these two indicators confirm that the euro area’s internal imbalances are correcting, we will maintain our holding in euro area sovereign bonds and our long Eurostoxx, short S&P 500 equity market pair trade.
Dhaval Joshi, Managing Editor [email protected]
Francesca Beausang, Associate Editor [email protected]
The euro area needs higher labour cost inflation in Germany, and a converging distribution of bank lending rates. Germany
Italy
Spain
France
Spain
Italy
Netherlands
Germany
France

Lisa Majmin INTERNATIONAL FINANCE CORP 247886
[email protected] • TEL 514.499.9550 • www.bcaresearch.com Copyright © 2014 BCA Research Inc. All Rights Reserved. Refer to last page. 8
BCA ReseARCh InC. euRopeAn Investment stRAtegy - weekly RepoRt jAnuARy 9, 2014
Recommendations
* PLEASE SEE THE AUGUST 4, 2011 REPORT FOR MORE DETAILS.
equity positions initiation Date
return (%) Comments
Long poLIsh And CzECh EquITIEs (50:50) vERsus EuRopE 07-nov-13 -2.1 20% ExposuRE
Long gREEK EquITIEs vERsus EuRo AREA 17-oCT-13 0.2 25% ExposuRE
Long EuRo AREA TELECoMs vERsus MARKET 08-Aug-13 9.7
Long nEThERLAnds EquITIEs / shoRT u.K. EquITIEs 28-MAR-13 9.9
shoRT u.K. ConsuMER sERvICEs vERsus ThE MARKET 7-MAR-13 -11.1
Long gERMAn ConsuMER sERvICEs vERsus ThE MARKET 24-JAn-13 13.0
Long EuRo AREA LARgE CAps / shoRT EuRo AREA sMALL CAps 01-nov-12 -12.2
Long EuRo AREA EquITIEs / shoRT u.s. EquITIEs 20-sEp-12 4.8InCLudEs CuRREnCy ExposuRE
Long IRIsh EquITIEs / shoRT spAnIsh EquITIEs 12-ApR-12 -1.7
Long gERMAn REAL EsTATE EquITIEs / shoRT EuRo AREA EquITIEs 5-ApR-12 -9.9
Long gERMAn & ITALIAn EquITIEs / shoRT FREnCh & spAnIsh EquITIEs 8-MAR-12 0.9 InCLudEs ITALy vERsus spAIn FRoM 01 MAR 2012
Long pERsonAL pRoduCTs vERsus MARKET 22-dEC-11 23.3
Long CoMpuTER hARdWARE vERsus MARKET 22-dEC-11 -1.4
Long sWIss EquITIEs / shoRT EuRo AREA EquITIEs 8-sEp-11 2.9
Long hEALThCARE vERsus MARKET 14-ApR-11 37.8
Long doW JonEs LuxuRy IndEx / shoRT EuRo sToxx 14-ApR-11 26.1
bonD anD interest rate positions initiation Date
return (%) Comments
Long ovER 10-yEAR AggREgATE EuRo AREA Bond 28-nov-13 0.2 WEIghTEd By IssuE sIzE
Long 5-yEAR gERMAn InFLATIon BREAKEvEn 14-nov-13 0.0
Long 10-yEAR poRTuguEsE Bonds vERsus EuRo AREA 24-oCT-13 5.8
ovER 10-yEAR Bonds: Long u.s. / shoRT gERMAny 25-JuL-13 0.3
Long JunE 2014 3M sTERLIng FuTuRE 04-JuL-13 0.4 LEvEREd 5 TIMEs
Long 10-yEAR u.K. gILTs / shoRT 10-yEAR sWEdIsh Bonds 14-FEB-13 -0.9
ITALIAn govT. Bonds: 2-10 yEAR FLATTEnER 27-sEp-12 2.8
Long sWIss And ITALIAn 10-yEAR Bonds (50:50 RATIo) 9-Aug-12 10.9
Long u.K. A-RATEd CoRpoRATE Bonds 13-oCT-11 12.5
CurrenCy anD other positions initiation Date
return (%) Comments
shoRT TuRKIsh LIRA / Long u.s. doLLAR 07-nov-13 6.5
shoRT MARCh 2014 EuRo / doLLAR CALL opTIon sTRIKE 1.45 31-oCT-13 0.8 LEvEREd 3 TIMEs
shoRT sovEREIgn yIELd spREAd FuTuREs (ITALy vs. gERMAny) 3-nov-12 2.7
Long vIx (s&p 500) / shoRT vdAx (dAx) (10% ExposuRE) 20-oCT-11 4.4ExposuRE CuT on 27 sEp 2012
pRoTECToR poRTFoLIo* 4-Aug-11 20.0
Lisa Majmin INTERNATIONAL FINANCE CORP 247886
[email protected] • TEL 514.499.9550 • www.bcaresearch.com Copyright © 2014 BCA Research Inc. All Rights Reserved. Refer to last page. 9
BCA ReseARCh InC. euRopeAn Investment stRAtegy - weekly RepoRt jAnuARy 9, 2014
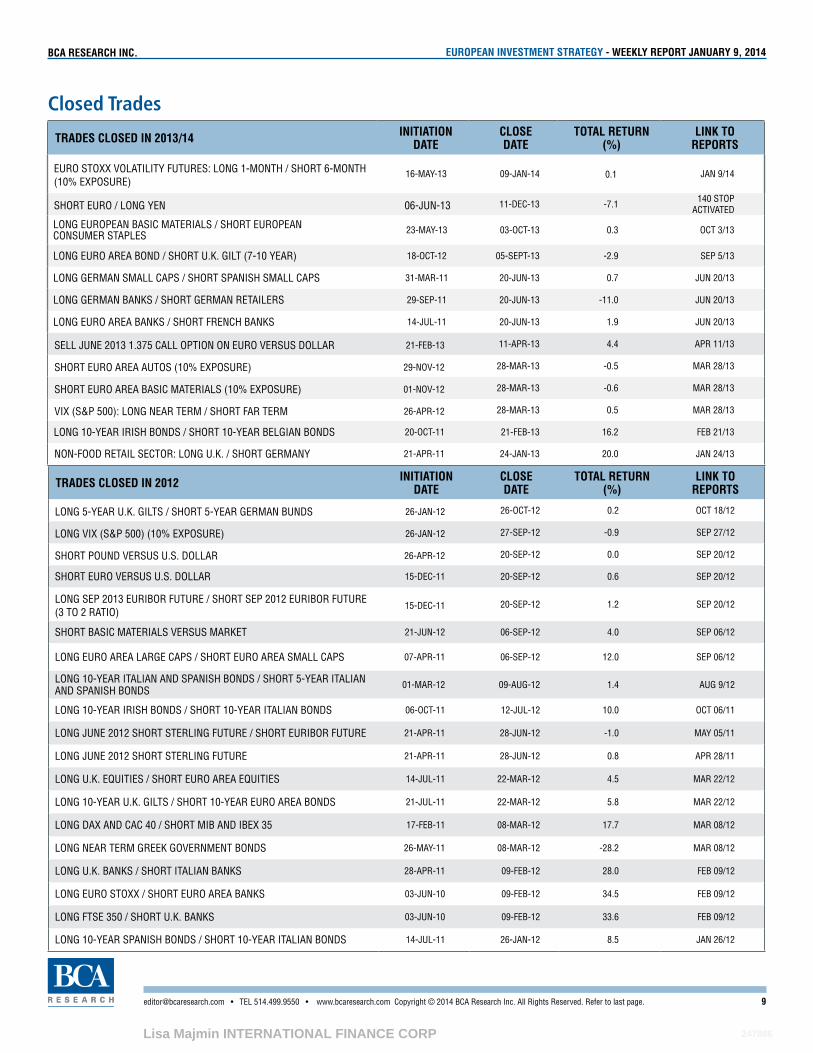
Closed Trades
traDes CLoseD in 2012 initiation Date
CLose Date
totaL return (%)
LinK to reports
Long 5-yEAR u.K. gILTs / shoRT 5-yEAR gERMAn Bunds 26-JAn-12 26-oCT-12 0.2 oCT 18/12
Long vIx (s&p 500) (10% ExposuRE) 26-JAn-12 27-sEp-12 -0.9 sEp 27/12
shoRT pound vERsus u.s. doLLAR 26-ApR-12 20-sEp-12 0.0 sEp 20/12
shoRT EuRo vERsus u.s. doLLAR 15-dEC-11 20-sEp-12 0.6 sEp 20/12
Long sEp 2013 EuRIBoR FuTuRE / shoRT sEp 2012 EuRIBoR FuTuRE (3 To 2 RATIo)
15-dEC-11 20-sEp-12 1.2 sEp 20/12
shoRT BAsIC MATERIALs vERsus MARKET 21-Jun-12 06-sEp-12 4.0 sEp 06/12
Long EuRo AREA LARgE CAps / shoRT EuRo AREA sMALL CAps 07-ApR-11 06-sEp-12 12.0 sEp 06/12
Long 10-yEAR ITALIAn And spAnIsh Bonds / shoRT 5-yEAR ITALIAn And spAnIsh Bonds 01-MAR-12 09-Aug-12 1.4 Aug 9/12
Long 10-yEAR IRIsh Bonds / shoRT 10-yEAR ITALIAn Bonds 06-oCT-11 12-JuL-12 10.0 oCT 06/11
Long JunE 2012 shoRT sTERLIng FuTuRE / shoRT EuRIBoR FuTuRE 21-ApR-11 28-Jun-12 -1.0 MAy 05/11
Long JunE 2012 shoRT sTERLIng FuTuRE 21-ApR-11 28-Jun-12 0.8 ApR 28/11
Long u.K. EquITIEs / shoRT EuRo AREA EquITIEs 14-JuL-11 22-MAR-12 4.5 MAR 22/12
Long 10-yEAR u.K. gILTs / shoRT 10-yEAR EuRo AREA Bonds 21-JuL-11 22-MAR-12 5.8 MAR 22/12
Long dAx And CAC 40 / shoRT MIB And IBEx 35 17-FEB-11 08-MAR-12 17.7 MAR 08/12
Long nEAR TERM gREEK govERnMEnT Bonds 26-MAy-11 08-MAR-12 -28.2 MAR 08/12
Long u.K. BAnKs / shoRT ITALIAn BAnKs 28-ApR-11 09-FEB-12 28.0 FEB 09/12
Long EuRo sToxx / shoRT EuRo AREA BAnKs 03-Jun-10 09-FEB-12 34.5 FEB 09/12
Long FTsE 350 / shoRT u.K. BAnKs 03-Jun-10 09-FEB-12 33.6 FEB 09/12
Long 10-yEAR spAnIsh Bonds / shoRT 10-yEAR ITALIAn Bonds 14-JuL-11 26-JAn-12 8.5 JAn 26/12
traDes CLoseD in 2013/14 initiation Date
CLose Date
totaL return (%)
LinK to reports
EuRo sToxx voLATILITy FuTuREs: Long 1-MonTh / shoRT 6-MonTh (10% ExposuRE)
16-MAy-13 09-JAn-14 0.1 JAn 9/14
shoRT EuRo / Long yEn 06-Jun-13 11-dEC-13 -7.1 140 sTop ACTIvATEd
Long EuRopEAn BAsIC MATERIALs / shoRT EuRopEAn ConsuMER sTApLEs 23-MAy-13 03-oCT-13 0.3 oCT 3/13
Long EuRo AREA Bond / shoRT u.K. gILT (7-10 yEAR) 18-oCT-12 05-sEpT-13 -2.9 sEp 5/13
Long gERMAn sMALL CAps / shoRT spAnIsh sMALL CAps 31-MAR-11 20-Jun-13 0.7 Jun 20/13
Long gERMAn BAnKs / shoRT gERMAn RETAILERs 29-sEp-11 20-Jun-13 -11.0 Jun 20/13
Long EuRo AREA BAnKs / shoRT FREnCh BAnKs 14-JuL-11 20-Jun-13 1.9 Jun 20/13
sELL JunE 2013 1.375 CALL opTIon on EuRo vERsus doLLAR 21-FEB-13 11-ApR-13 4.4 ApR 11/13
shoRT EuRo AREA AuTos (10% ExposuRE) 29-nov-12 28-MAR-13 -0.5 MAR 28/13
shoRT EuRo AREA BAsIC MATERIALs (10% ExposuRE) 01-nov-12 28-MAR-13 -0.6 MAR 28/13
vIx (s&p 500): Long nEAR TERM / shoRT FAR TERM 26-ApR-12 28-MAR-13 0.5 MAR 28/13
Long 10-yEAR IRIsh Bonds / shoRT 10-yEAR BELgIAn Bonds 20-oCT-11 21-FEB-13 16.2 FEB 21/13
non-Food RETAIL sECToR: Long u.K. / shoRT gERMAny 21-ApR-11 24-JAn-13 20.0 JAn 24/13
Lisa Majmin INTERNATIONAL FINANCE CORP 247886
[email protected] • TEL 514.499.9550 • www.bcaresearch.com Copyright © 2014 BCA Research Inc. All Rights Reserved. Refer to last page. 10
BCA ReseARCh InC. euRopeAn Investment stRAtegy - weekly RepoRt jAnuARy 9, 2014
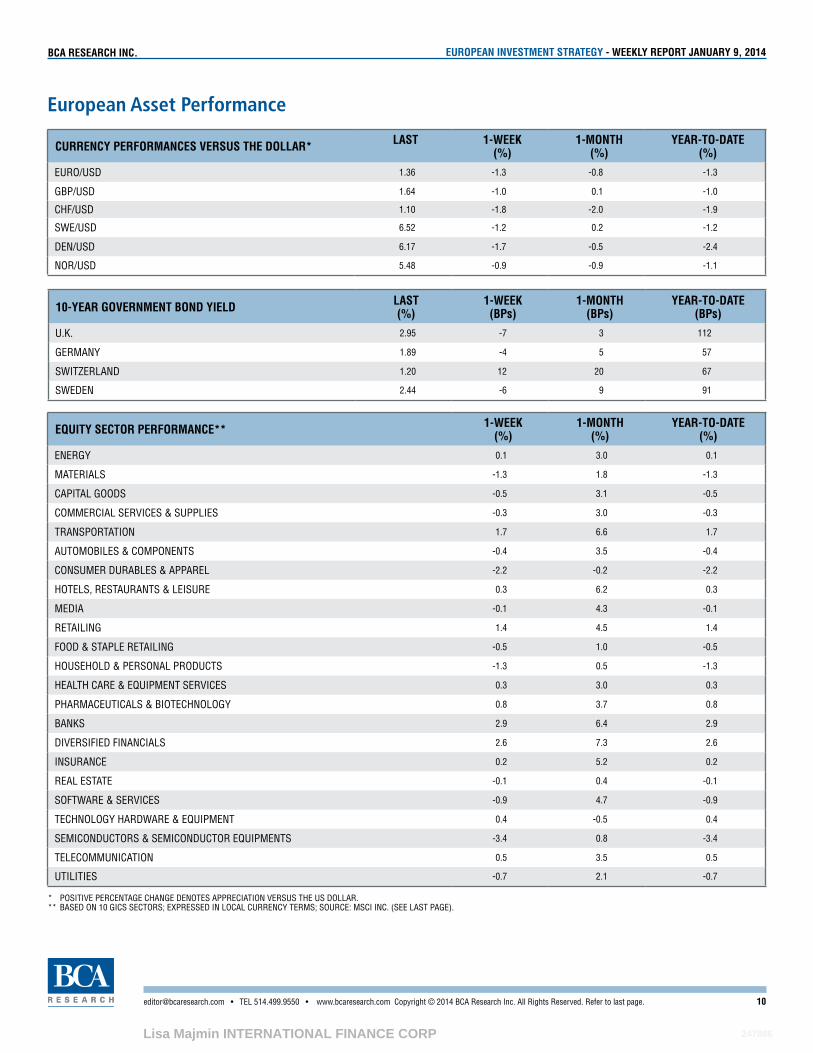
European Asset Performance
CurrenCy perFormanCes Versus the DoLLar* Last 1-WeeK (%)
1-month (%)
year-to-Date (%)
EuRo/usd 1.36 -1.3 -0.8 -1.3
gBp/usd 1.64 -1.0 0.1 -1.0
ChF/usd 1.10 -1.8 -2.0 -1.9
sWE/usd 6.52 -1.2 0.2 -1.2
dEn/usd 6.17 -1.7 -0.5 -2.4
noR/usd 5.48 -0.9 -0.9 -1.1
10-year GoVernment bonD yieLD Last (%)
1-WeeK (bps)
1-month (bps)
year-to-Date (bps)
u.K. 2.95 -7 3 112
gERMAny 1.89 -4 5 57
sWITzERLAnd 1.20 12 20 67
sWEdEn 2.44 -6 9 91
equity seCtor perFormanCe** 1-WeeK (%)
1-month (%)
year-to-Date (%)
EnERgy 0.1 3.0 0.1
MATERIALs -1.3 1.8 -1.3
CApITAL goods -0.5 3.1 -0.5
CoMMERCIAL sERvICEs & suppLIEs -0.3 3.0 -0.3
TRAnspoRTATIon 1.7 6.6 1.7
AuToMoBILEs & CoMponEnTs -0.4 3.5 -0.4
ConsuMER duRABLEs & AppAREL -2.2 -0.2 -2.2
hoTELs, REsTAuRAnTs & LEIsuRE 0.3 6.2 0.3
MEdIA -0.1 4.3 -0.1
RETAILIng 1.4 4.5 1.4
Food & sTApLE RETAILIng -0.5 1.0 -0.5
housEhoLd & pERsonAL pRoduCTs -1.3 0.5 -1.3
hEALTh CARE & EquIpMEnT sERvICEs 0.3 3.0 0.3
phARMACEuTICALs & BIoTEChnoLogy 0.8 3.7 0.8
BAnKs 2.9 6.4 2.9
dIvERsIFIEd FInAnCIALs 2.6 7.3 2.6
InsuRAnCE 0.2 5.2 0.2
REAL EsTATE -0.1 0.4 -0.1
soFTWARE & sERvICEs -0.9 4.7 -0.9
TEChnoLogy hARdWARE & EquIpMEnT 0.4 -0.5 0.4
sEMIConduCToRs & sEMIConduCToR EquIpMEnTs -3.4 0.8 -3.4
TELECoMMunICATIon 0.5 3.5 0.5
uTILITIEs -0.7 2.1 -0.7
* posITIvE pERCEnTAgE ChAngE dEnoTEs AppRECIATIon vERsus ThE us doLLAR. ** BAsEd on 10 gICs sECToRs; ExpREssEd In LoCAL CuRREnCy TERMs; souRCE: MsCI InC. (sEE LAsT pAgE).

Lisa Majmin INTERNATIONAL FINANCE CORP 247886
[email protected] • TEL 514.499.9550 • www.bcaresearch.com Copyright © 2014 BCA Research Inc. All Rights Reserved. Refer to last page. 11
BCA ReseARCh InC. euRopeAn Investment stRAtegy - weekly RepoRt jAnuARy 9, 2014
European Asset Performance
Country equity perFormanCe - LarGe Cap*1-WeeK ChanGe
(%)
1-month ChanGe
(%)
year-to-Date ChanGe
(%)u.K. -0.1 2.5 -0.1
sWITzERLAnd 1.4 3.2 1.4
FRAnCE -0.8 3.3 -0.8
gERMAny -0.5 3.4 -0.5
nEThERLAnds -0.1 3.8 -0.1
AusTRIA 3.9 4.3 3.9
ITALy 2.7 6.3 2.7
spAIn 2.5 6.8 2.5
poRTugAL 2.1 2.8 2.1
IRELAnd 4.6 8.9 4.6
BELgIuM -0.5 3.3 -0.5
FInLAnd 0.5 1.8 0.5
dEnMARK 3.8 6.7 3.8
noRWAy -0.1 1.5 -0.1
sWEdEn -0.4 3.4 -0.4
Country equity perFormanCe - smaLL Cap*1-WeeK ChanGe
(%)
1-month ChanGe
(%)
year-to-Date ChanGe
(%)u.K. 0.4 5.5 0.4
sWITzERLAnd 1.9 5.8 1.9
FRAnCE 1.6 3.1 1.6
gERMAny 1.8 4.0 1.8
nEThERLAnds 1.5 5.1 1.5
AusTRIA 3.4 3.8 3.4
ITALy 3.2 6.9 3.2
spAIn 4.6 10.1 4.6
poRTugAL 8.2 14.0 8.2
IRELAnd 0.6 6.2 0.6
BELgIuM 0.0 3.4 0.0
FInLAnd -0.2 3.1 -0.2
dEnMARK 5.4 9.7 5.4
noRWAy -0.6 3.2 -0.6
sWEdEn 0.8 4.2 0.8
* ExpREssEd In LoCAL CuRREnCy TERMs; souRCE: MsCI InC. (sEE LAsT pAgE).

Lisa Majmin INTERNATIONAL FINANCE CORP 247886
[email protected] • TEL 514.499.9550 • www.bcaresearch.com Copyright © 2014 BCA Research Inc. All Rights Reserved. Refer to last page. 12
BCA ReseARCh InC. euRopeAn Investment stRAtegy - weekly RepoRt jAnuARy 9, 2014
Indicators To Watch - Bond Yields
8
7
6
5
4
3
2
1
0
2010 2011 2012 2013
8
7
6
5
4
3
2
1
0
JUL JAN JUL JAN JUL JAN JUL JAN
2-YEAR GOVERNMENT BOND YIELD:GERMANYBELGIUMSPAINITALY
% %
2.5
2.0
1.5
1.0
.5
0
2010 2011 2012 2013
2.5
2.0
1.5
1.0
.5
0
JUL JAN JUL JAN JUL JAN JUL JAN
2-YEAR GOVERNMENT BOND YIELD:GERMANYFRANCENETHERLANDS
% %
2.5
2.0
1.5
1.0
.5
0
2010 2011 2012 2013
2.5
2.0
1.5
1.0
.5
0
JUL JAN JUL JAN JUL JAN JUL JAN
2-YEAR GOVERNMENT BOND YIELD:GERMANYFINLAND (3-YEAR)AUSTRIA
% %
22
20
18
16
14
12
10
8
6
4
2
0
2010 2011 2012 2013
22
20
18
16
14
12
10
8
6
4
2
0
JUL JAN JUL JAN JUL JAN JUL JAN
2-YEAR GOVERNMENT BOND YIELD:GERMANYPORTUGALIRELAND
% %
© BCA Research 2014
© BCA Research 2014
© BCA Research 2014
© BCA Research 2014
Lisa Majmin INTERNATIONAL FINANCE CORP 247886
[email protected] • TEL 514.499.9550 • www.bcaresearch.com Copyright © 2014 BCA Research Inc. All Rights Reserved. Refer to last page. 13
BCA ReseARCh InC. euRopeAn Investment stRAtegy - weekly RepoRt jAnuARy 9, 2014
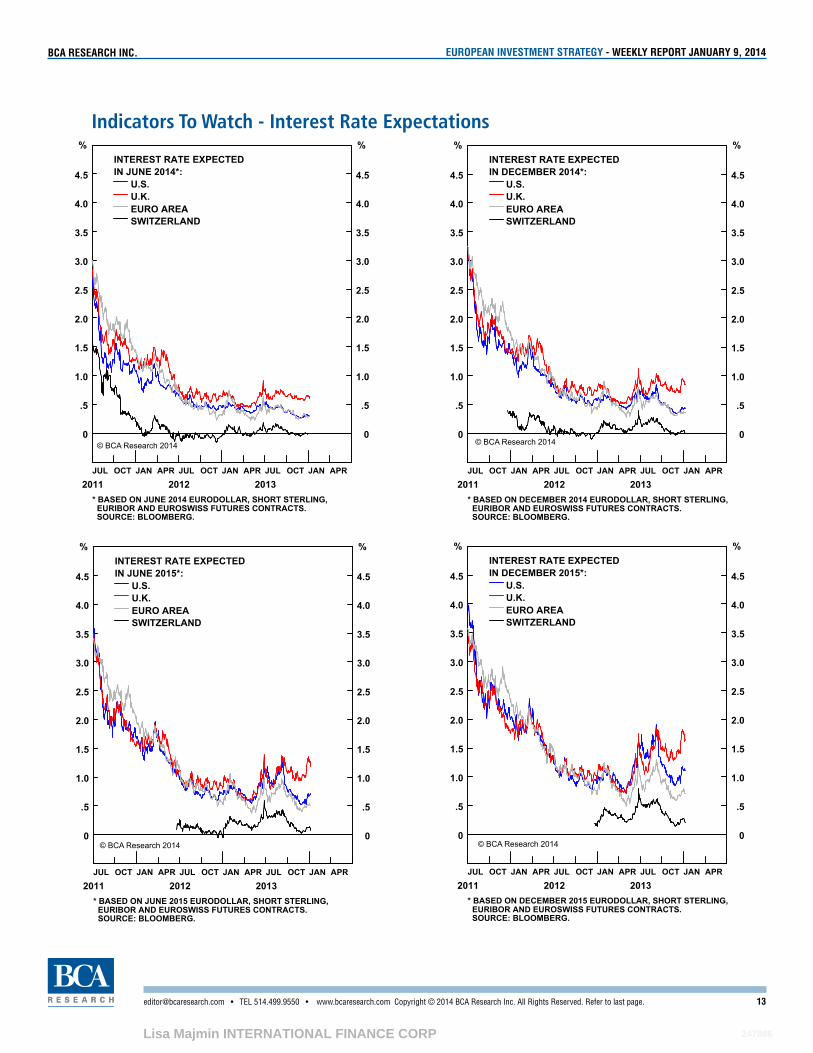
Indicators To Watch - Interest Rate Expectations
4.5
4.0
3.5
3.0
2.5
2.0
1.5
1.0
.5
0
2011 2012 2013
4.5
4.0
3.5
3.0
2.5
2.0
1.5
1.0
.5
0
JUL OCT JAN APR JUL OCT JAN APR JUL OCT JAN APR
INTEREST RATE EXPECTEDIN JUNE 2014*:
U.S.U.K.EURO AREASWITZERLAND
% %
* BASED ON JUNE 2014 EURODOLLAR, SHORT STERLING, EURIBOR AND EUROSWISS FUTURES CONTRACTS. SOURCE: BLOOMBERG.
4.5
4.0
3.5
3.0
2.5
2.0
1.5
1.0
.5
0
2011 2012 2013
4.5
4.0
3.5
3.0
2.5
2.0
1.5
1.0
.5
0
JUL OCT JAN APR JUL OCT JAN APR JUL OCT JAN APR
INTEREST RATE EXPECTEDIN DECEMBER 2014*:
U.S.U.K.EURO AREASWITZERLAND
% %
* BASED ON DECEMBER 2014 EURODOLLAR, SHORT STERLING, EURIBOR AND EUROSWISS FUTURES CONTRACTS. SOURCE: BLOOMBERG.
4.5
4.0
3.5
3.0
2.5
2.0
1.5
1.0
.5
0
2011 2012 2013
4.5
4.0
3.5
3.0
2.5
2.0
1.5
1.0
.5
0
JUL OCT JAN APR JUL OCT JAN APR JUL OCT JAN APR
INTEREST RATE EXPECTEDIN JUNE 2015*:
U.S.U.K.EURO AREASWITZERLAND
% %
* BASED ON JUNE 2015 EURODOLLAR, SHORT STERLING, EURIBOR AND EUROSWISS FUTURES CONTRACTS. SOURCE: BLOOMBERG.
4.5
4.0
3.5
3.0
2.5
2.0
1.5
1.0
.5
0
2011 2012 2013
4.5
4.0
3.5
3.0
2.5
2.0
1.5
1.0
.5
0
JUL OCT JAN APR JUL OCT JAN APR JUL OCT JAN APR
INTEREST RATE EXPECTEDIN DECEMBER 2015*:
U.S.U.K.EURO AREASWITZERLAND
% %
* BASED ON DECEMBER 2015 EURODOLLAR, SHORT STERLING, EURIBOR AND EUROSWISS FUTURES CONTRACTS. SOURCE: BLOOMBERG.
© BCA Research 2014
© BCA Research 2014© BCA Research 2014
© BCA Research 2014

Lisa Majmin INTERNATIONAL FINANCE CORP 247886
european investment strategy - weekly report january 9, 2014BCa researCh inC.
[email protected] • TEL 514.499.9550 • www.bcaresearch.com Copyright © 2014 BCA Research Inc. All Rights Reserved. Refer to last page. 14
Archive Of Previous ReportsPlease click on the links below to view reports:
1. 2014: Now Here Comes The Hard Part... - December 19, 2013
2. Three Surprising Facts From Europe - December 12, 2013
3. U.K. Recovery: Not What You Think - December 5, 2013
4. Don’t Ignore Doctor Copper - November 28, 2013
5. 10 Important Charts: The Update - November 21, 2013
6. The Return Of The D-Word - November 14, 2013
7. Look East - November 7, 2013
8. Is The Euro’s Strength Hurting? - October 31, 2013
9. Credit And Growth, Chicken And Egg - October 24, 2013
10. The Unloved Bargain - October 17, 2013
11. The Price Is Wrong - October 10, 2013
12. The Signal And The Political Noise - October 3, 2013
13. The 10-Year Profit Warning - September 19, 2013
14. Defragmentation - September 12, 2013
15. Will The Grinch Steal Christmas? - September 5, 2013
16. Taper Risk: 3 Surprising Results - August 29, 2013
17. 10 Charts To Watch Closely - August 15, 2013
18. Where Are All The Bargains? - August 8, 2013
19. The Ugly Contest - August 1, 2013
20. German Assets To Sell... And To Buy - July 25, 2013
21. Reassessing Europe’s Solvency - July 18, 2013
22. Solving The U.K. Productivity Puzzle - July 11, 2013
23. Avoiding The Landmines - July 4, 2013
24. The 2013 Oddity - June 27, 2013
25. Meeting With A Devil’s Advocate - June 20, 2013
26. Embrace Deflation...It’s The Norm - June 13, 2013
27. The Big Battle: Credit Versus Money - June 6, 2013
28. Europe And The Three Tail-Risks - May 30, 2013
29. Are The Prices Right?, May 23, 2013
30. Follow The Money Impulse - May 16, 2013
Editorial Board
dhaval Joshi, Managing [email protected]
F Ian MacFarlane, Managing Editor F Mark McClellan, Managing Editor F Francesca Beausang-Hunter, Associate Editor F Aleksandra Buimistere, Research Assistant

Lisa Majmin INTERNATIONAL FINANCE CORP 247886
[email protected] • TEL 514.499.9550 • www.bcaresearch.com Copyright © 2014 BCA Research Inc. All Rights Reserved. Refer to last page. 15
Copyright 2014, BCA Research Inc. All rights reserved.The text, images and other materials contained or displayed on any BCA Research Inc. product, service, report, e-mail or web site are proprietary to BCA Research Inc. and constitute valuable intellectual property. No material from any part of any BCA Research Inc. web site may be downloaded, transmitted, broadcast, transferred, assigned, reproduced or in any other way used or otherwise disseminated in any form to any person or entity, without the explicit written consent of BCA Research Inc. All unauthorized reproduction or other use of material from BCA Research Inc. shall be deemed willful infringement(s) of BCA Research Inc. copyright and other proprietary and intellectual property rights, including but not limited to, rights of privacy. BCA Research Inc. expressly reserves all rights in connection with its intellectual property, including without limitation the right to block the transfer of its products and services and/or to track usage thereof, through electronic track-ing technology, and all other lawful means, now known or hereafter devised. BCA Research Inc. reserves the right, without further notice, to pursue to the fullest extent allowed by the law any and all criminal and civil remedies for the violation of its rights.
Non-residents of Canada confirm that they do not, and have never had the right to use any of BCA Research Inc.’s materials in Canada, and agree that they have not and never will use any of the materials in Canada unless they acquire this right by paying the applicable Canadian and Quebec sales taxes. All unauthorized use of the materials in Canada shall be deemed willful infringement of BCA Research Inc. copyright and other proprietary and intellectual property rights.
While BCA will use its reasonable best efforts to provide accurate and informative Information Services to Subscriber, BCA cannot guarantee the accuracy, relevance and/or completeness of the Information Services, or other information used in connection therewith. BCA, its affiliates, shareholders, directors, officers, and employees shall have no liability, contingent or otherwise, for any claims or dam-ages arising in connection with (i) the use by Subscriber of the Information Services and/or (ii) any errors, omissions or inaccuracies in the Information Services. The Information Services are provided for the benefit of the Subscriber. It is not to be used or otherwise relied on by any other person. Some of the data contained in this publication may have been obtained from Thom-son Reuters; Real Capital Analytics, Inc.; Reis Services, LLC; CBRE, Inc.; Barclays or from Standard and Poor’s (“S&P”). Copyright © 2014 The McGraw-Hill Companies, Inc., S&P is a division of The McGraw-Hill Companies, Inc. All rights reserved.
As well, some of the data contained in this publication may have been obtained from MSCI Inc. Neither MSCI Inc. nor any other party involved in or related to compiling, computing or creating the MSCI Inc. data makes any express or implied warranties or representations with respect to such data (or the results to be obtained by the use thereof), and all such parties hereby expressly disclaim all warranties of originality, accuracy, completeness, merchantability or fitness for a particular purpose with respect to any of such data. Without limiting any of the foregoing, in no event shall MSCI Inc., any of its affiliates or any third party involved in or related to compiling, computing or creating the data have any liability for any direct, indirect, special, punitive, consequential or any other damages (including lost profits) even if notified of the possibility of such damages. No further distribution or dissemination of the MSCI Inc. data is permitted without MSCI Inc.’s express written consent.
GLOBAL OFFICES
Head Office – Montreal, Canada1002 Sherbrooke Street West, Suite 1600Montreal, Quebec, Canada H3A 3L6TEL 1.800.724.2942 (514.499.9550)FAX 1.800.843.1763 (514.843.1763)
London, U.K.29 Ludgate HillLondon, U.K. EC4M 7JRTEL +44 (0)207 556 6008FAX +44 (0)20 7827 6413
New York, U.S.A.225 Park Avenue South, 6th FloorNew York, NY 10003TEL 212 224 3972FAX 212 224 3861
Los Angeles, U.S.A.633 West 5th Street, 28th Floor Los Angeles, CA 90071 TEL 213 223 2226 FAX 213 223 2317
Hong Kong18/F, 248 Queen’s Road EastHong KongTEL +852 2912 8055FAX +852 2842 7007
Sydney, AustraliaLevel 34, 50 Bridge Street Sydney 2000AustraliaTEL +612 8216 0965TEL +612 8216 0966
Buenos Aires, ArgentinaNicaragua 5993 5th Floor, apt. 12 (C1414BQM) Buenos Aires - Argentina TEL 1 347 571 9061 TEL 1 347 809 6760

![TUGAS I [VIX]](https://static.fdocuments.net/doc/165x107/55cf97fc550346d03394db12/tugas-i-vix.jpg)