Vivek Chandra - Texas LNG - Relative attractiveness of US LNG exports - Is the threat to Australian...
17
August 2015 www.txlng.com The Relative Attractiveness of US LNG exports – Is the threat to Australian projects real? CONFIDENTIAL Copyright © Texas LNG Brownsville LLC SEAAOC 2015 VIVEK CHANDRA CEO, TEXAS LNG [email protected]
-
Upload
informa-australia -
Category
Business
-
view
659 -
download
1
Transcript of Vivek Chandra - Texas LNG - Relative attractiveness of US LNG exports - Is the threat to Australian...

August 2015 www.txlng.com
The Relative Attractiveness of US LNG exports –Is the threat to Australian projects real?
CONFIDENTIAL
Copyright © Texas LNG Brownsville LLC
SEAAOC 2015
VIVEK CHANDRACEO, TEXAS [email protected]

Ingredients of a ‘Successful’ LNG Project
2
• Reserve life
• NGL Content
• CO2 Content
• Field Access
• Reservoir quality
• Distance from
field to plant
• Upstream costs
• Govt Support
• Security
• Native rights
• Fiscal stability
• Environmental
permits - status
and issues
• Labor costs /
availability
• Technology Risk
• Contractor
Experience
• Infrastructure
required
• Engineering
Stage
• Total Capex/ton
• Overall
complexity
• Operator
Experience
• Partner Experience
• Partner Alignment
• Buyer type (enduser
vs trader)
• Buyer experience
• Marketing stage
UpstreamAbove
GroundTechnical
Company & Market
Not all projects are the same – beware of broad brush!!

US Gulf Coast Projects have most of the important characteristics – and a very large advantage over Australian projects
3
• Long Reserve
life
• Good NGL
Content
• Low CO2
Content
• Easy Field
Access
• Good Reservoir
quality
• Short Distance
from field to
plant
• Low Upstream
costs
• Good Govt
Support
• Good Security
• No Native
rights issues
• Fiscal
stability
• Ease of
Environmental
permits
• Low Labor
costs /
availability
• Low Technology
Risk
• Solid Contractor
Experience
• Limited new
Infrastructure
required
• Advanced
Engineering
Stage
• Low total
Capex/ton
• Low Overall
complexity
• Good Operator
Experience
• Good Partner
Experience
• Good Partner
Alignment
• Buyer type
(enduser vs
trader)
• Good Buyer
experience
• Marketing stage

The US Gulf Coast is really the only source of sufficient incremental volumes that can be delivered at competitive prices
Legacy Projects Expansions ‘Coming Soon’ greenfield
Giant Greenfield Modest Greenfield
US Gulf Coast
4
<$7 /MMBtu >$14 /MMBtu
Unknown!! >$11 /MMBtu~$9-10/MMBtu
Prices are estimated delivered prices to North Asia

Texas LNG is an independent US LNG export project located in Brownsville, Texas which will begin production of 2 MTA of LNG in 2020
We are a credible alternative to the ‘status-quo’ where few LNG suppliers control the market and the customer is taken for granted.
We will encourage flexible terms, no destination restrictions, & delivered prices based on ‘gas-on-gas’ economics and true costs under a transparent tolling pricing model.
Our project will leverage Asian shipyards to reduce capex and thus offer the best price and terms for our tolling customers.
Project total capacity will be 4 MTA, divided in two equal volume Phases. Phase 1 will begin production in 2020.
We will be able to supply LNG at prices competitive to other US Gulf Coast
projects – the lowest costs incremental LNG supplier for global markets

Texas LNG Fact SheetCapacity Phase 1: 2 Million Tonnes per year (MTA) from 2020
Phase 2: 2 MTA additional capacity based on market demand
Export Approvals (DOE) June 2014 (FTA), Non-FTA pending
FERC (Federal Energy Regulatory Commission) Permit Status Pre-Filing commenced on April 14, 2015: Docket No. PF15-14-000Filed Draft Resource Reports 1 & 10 on May 14, 2015All Draft Resource Reports to be filed by 4Q 2015
Engineering & Commercial MilestonesConceptual Design StudyPreliminary Front End Engineering Design (pre-FEED)Front End Engineering Design (FEED)Detailed EngineeringFinal Investment DecisionLNG Production
May 2014June 2014 – October 2014November 2014 – November 2015December 2015 - Late 2016Late 2016 / early 2017 (based on FERC approvals)2020
Engineering Partners Samsung Engineering (also equity partner)
Liquefaction Process Air Products (APCI): Proven C3MR Process
Gas Pre-Treatment Process Honeywell (UOP)
Environmental Advisers Natural Resource Group. LLC
Development Capital Financier Third Point LLC
Financial Advisers BNP Paribas
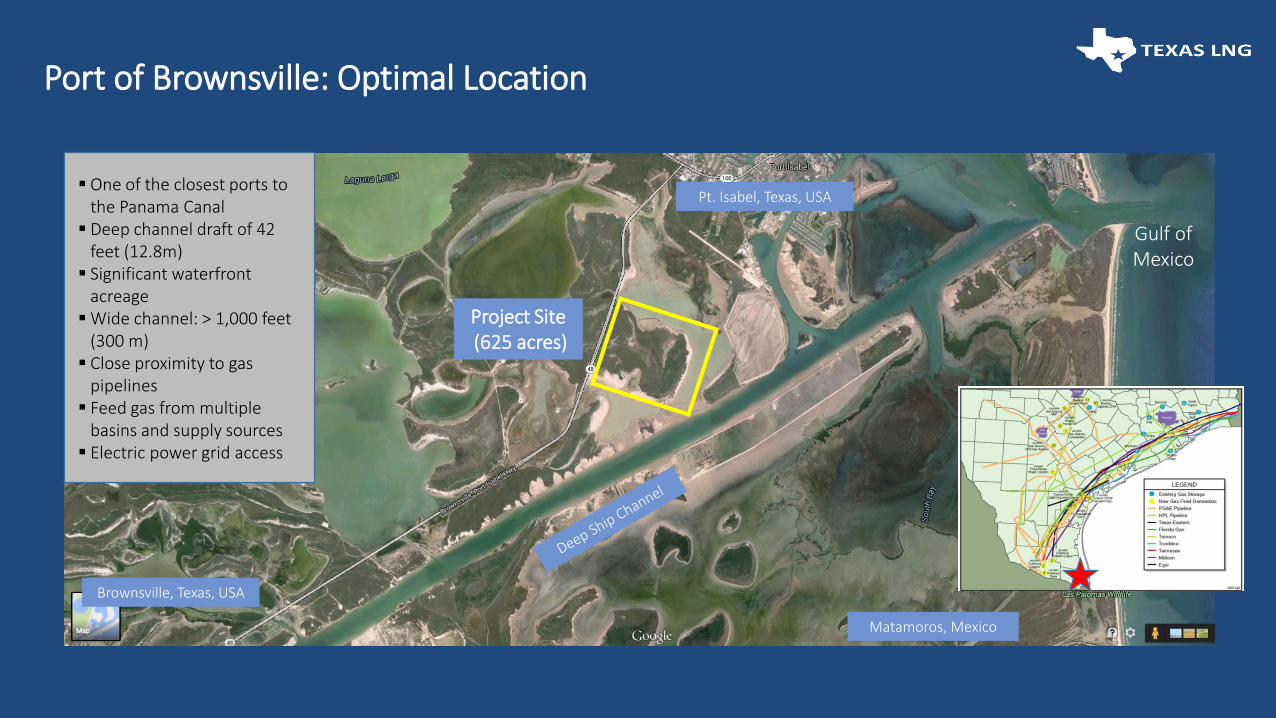
Port of Brownsville: Optimal Location
Brownsville, Texas, USA
Matamoros, Mexico
Gulf of Mexico
Pt. Isabel, Texas, USA
Project Site(625 acres)
One of the closest ports to the Panama Canal
Deep channel draft of 42 feet (12.8m)
Significant waterfront acreage
Wide channel: > 1,000 feet (300 m)
Close proximity to gas pipelines
Feed gas from multiple basins and supply sources
Electric power grid access

Project Concept
Note: This artist impression is a representation of the Texas LNG project and should not be relied upon for any purpose. Actual project configuration may be different than shown in this image.

Samsung Engineering: Equity Owner and Responsible for Project Engineering and Construction
Conceptual Study
Pre-FEED FEED Detailed Engineering
Completed in May 2014
June – Oct 2014.
13,000+ man-hours
Begun in Nov 2014
Estimated: Late 2015
EPC
Estimated: Late 2016/early 2017
Over 100,000 engineering man-hours completed (July 2015) 90+ engineers engaged in Korea and USA.Samsung Engineering will execute the EPC phase on lump-sum basis.Modular construction – most likely in Asia shipyard
Current Phase
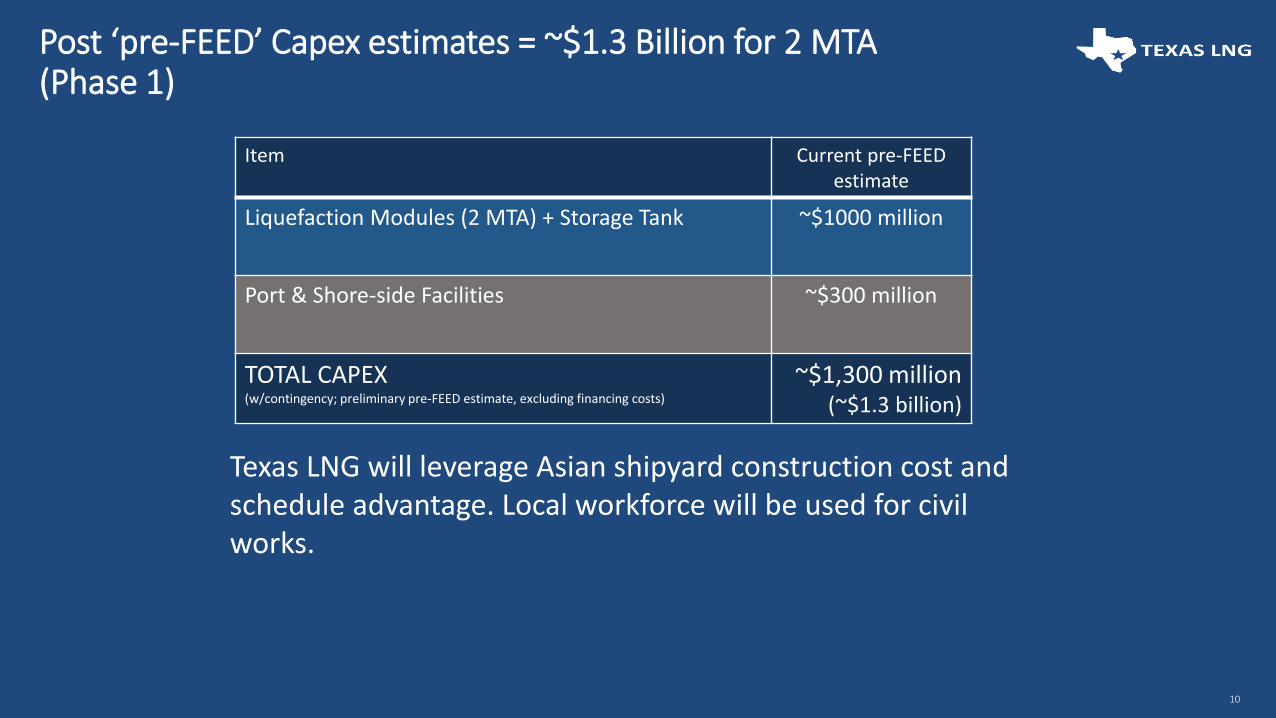
Post ‘pre-FEED’ Capex estimates = ~$1.3 Billion for 2 MTA (Phase 1)
10
Item Current pre-FEED estimate
Liquefaction Modules (2 MTA) + Storage Tank ~$1000 million
Port & Shore-side Facilities ~$300 million
TOTAL CAPEX(w/contingency; preliminary pre-FEED estimate, excluding financing costs)
~$1,300 million(~$1.3 billion)
Texas LNG will leverage Asian shipyard construction cost and schedule advantage. Local workforce will be used for civil works.

Texas LNG = $650 million/MTPA
All Existing ProjectsMainly Future Projects
Source: DB report “US LNG exports: from spectre to emerging reality” Feb 2012
Controlled shipyard environment will reduce Texas LNG’s Capex costs
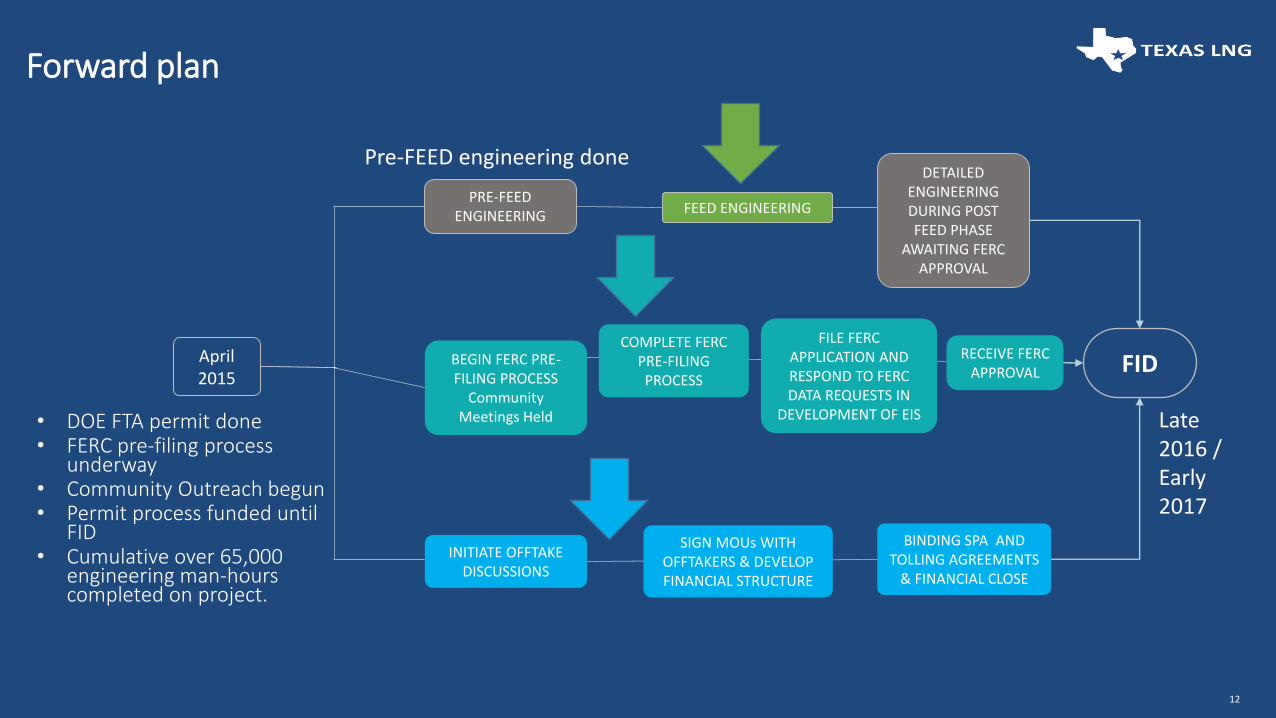
Forward plan
12
COMPLETE FERC PRE-FILING PROCESS
April 2015
BEGIN FERC PRE-FILING PROCESS
Community Meetings Held
PRE-FEED ENGINEERING
FEED ENGINEERING
DETAILED ENGINEERING DURING POST FEED PHASE
AWAITING FERC APPROVAL
RECEIVE FERC APPROVAL FID
• DOE FTA permit done• FERC pre-filing process
underway• Community Outreach begun• Permit process funded until
FID• Cumulative over 65,000
engineering man-hours completed on project.
INITIATE OFFTAKE DISCUSSIONS
SIGN MOUs WITH OFFTAKERS & DEVELOP FINANCIAL STRUCTURE
BINDING SPA AND TOLLING AGREEMENTS
& FINANCIAL CLOSE
Pre-FEED engineering done
Late2016 / Early 2017
FILE FERC APPLICATION AND RESPOND TO FERC DATA REQUESTS IN
DEVELOPMENT OF EIS

Australia (Queensland) $/MMBtu
Liquefaction $ 6.50 Feed Gas @ plant $ 7.00
Shipping Costs $ 1.50 Total Delivered Price $ 15.00
Typical Australia contract terms vs Texas LNG model
13
Texas LNG $/MMBtu
Feed Gas assumed price $ 3.00 Pipeline Tariff* $ 0.40Capacity Fee* (rise with inflation) $ 2.80 Liquefaction Charge* (rise with inflation) $ 0.45
Shipping estimated Asia/ Europe $ 2.10 / $1.25
Total Delivered Price* Asia / Europe $ 8.75 / $7.90
Take or Pay portion
Australian LNG project Take or Pay = $13.50
Take or Pay
Texas LNG’s Take or Pay = $2.80*
Liq
ue
faction
Tolling
Feed Gas
Fe
ed
Ga
sOperating Charge
Shipping
Shipping$
/MM
Btu
Delivered to North Asia: $15/MMBtu Delivered to North Asia: $ 8.75 /MMBtu estimatedDelivery to Europe: $7 .90 /MMBtu estimated
Pipeline
* Texas LNG charges based on current CAPEX and OPEX pre-FEED estimates and may be adjusted as project development continues
To TXLNG
[Pre-Oil Price collapse of 2014/2015]

14
Regional characteristics
Expensive
Labour
High Cost
E&P
Aboriginal
land
issuesUncertain
tax environment
Insistence on
inflexible
contract
terms
High
shipping
costs
Ongoing
drilling and
other
upstream
capex
High
capex/
tonne
costs
Eastern Australia
Western Australia
Well
productivity
inconsistent
Reserves
issues
US Gulf
Coast
*Global LNG Shipping costs have dropped significantly over past 12 months
Oil price
contracts
only

The US LNG exports tidal wave is real – and growing
15
First Phase:Sabine Pass [17]
Second Phase:
Cameron [12]Freeport [13]Corpus Christi [13]Cove Point [5]
Third Phase:Texas LNG [2+2]Trunkline [15]Golden Pass[8]Magnolia [8]Oregon [9]Jordan Cove [6]Others
2015-2016
2017-2019
2020+
Only projects that have begun the FERC process are credible

So, is the US threat to Australian projects real?
16
YES !
Let’s hope that the situation is not be as bad as predicted by a recent Harvard University study that stated…
“after the plunge of oil and LNG prices in Asia, the Australian
LNG chapter risks becoming one of the worst investment stories of the last few decades in the oil and gas sector.”
Source: “Falling Short: A Reality Check for Global LNG Exports" by Leonardo Maugeri, Harvard Kennedy School, December 2014

Disclaimer
Cautionary Statement:
The information and materials in this document are ; Provided for informational purposes only and are subjectto addition, deletion and modification without notice at the sole discretion of Texas LNG LLC and Texas LNGBrownsville LLC.; Not warranted or guaranteed to be correct, complete or up-to-date. The information andmaterials could include technical inaccuracies and other errors. ; Provided “As Is” without any representation orwarranties of any kind. No liability, direct or consequential, of any kind arising from the use of information andmaterials contained in this document or linked website is accepted. ; Not to be considered or to be constitutedas investment advice or as any type of offer, offer, invitation, solicitation or recommendation in relation to thepurchase or sale of any type of financial instruments or security in any jurisdiction.
Any forward looking statements contained in the information and materials in this document are onlypredictions and are subject to risks, uncertainties and assumptions, many of which are outside the control ofTexas LNG LLC or Texas LNG Brownsville LLC or its officers or representatives. These risks, uncertainties andassumptions include commodity prices, currency fluctuations, economic and financial market conditions invarious countries and regions, environmental risks and legislative, fiscal or regulatory developments, politicalrisks, project delay or advancement, approvals and cost estimates. Actual values, results or events may bematerially different to those expressed or implied in this document. Given these uncertainties, readers arecautioned not to place reliance on forward looking statements .
Readers are strongly advised to complete their own investigations to the accuracy and completeness of thecontents of this or any other communication or document, written or oral, provided by or referred to by TexasLNG LLC or Texas LNG Brownsville LLC or its officers or representatives.
17