Vitamin D status in Indians - ILSI...
64
Vitamin D status in Vitamin D status in Indians Indians Maj Maj Gen. R.K. Gen. R.K. Marwaha Marwaha (AMC) (AMC) Addl Addl Director and Head Director and Head Endocrine and Thyroid Research Centre Endocrine and Thyroid Research Centre Institute of Nuclear Medicine and Allied Sciences Institute of Nuclear Medicine and Allied Sciences New Delhi. New Delhi.
Transcript of Vitamin D status in Indians - ILSI...

Vitamin D status in Vitamin D status in
IndiansIndians
MajMaj Gen. R.K. Gen. R.K. MarwahaMarwaha (AMC)(AMC)
AddlAddl Director and Head Director and Head
Endocrine and Thyroid Research CentreEndocrine and Thyroid Research Centre
Institute of Nuclear Medicine and Allied SciencesInstitute of Nuclear Medicine and Allied Sciences
New Delhi.New Delhi.
IntroductionIntroduction
�� Vitamin D is an important hormone necessary not Vitamin D is an important hormone necessary not only for maintaining calcium balance and only for maintaining calcium balance and safeguarding skeletal integrity but also essential safeguarding skeletal integrity but also essential for overall health and well being.for overall health and well being.
�� Profound effect on growth and development of Profound effect on growth and development of children and implication for adult bone health.children and implication for adult bone health.
�� Optimal bone mineral health during childhood Optimal bone mineral health during childhood and adolescence leads to adequate peak bone and adolescence leads to adequate peak bone mass which acts as a safeguard against mass which acts as a safeguard against osteoporosis and susceptibility to fractures at a osteoporosis and susceptibility to fractures at a later age.later age.
22

Cont..Cont..
�� Primarily acquired by exposure to sunlight.Primarily acquired by exposure to sunlight.
�� Food articles commonly consumed by Indians do Food articles commonly consumed by Indians do not provide adequate vitamin D. not provide adequate vitamin D.
�� No food articles are fortified in India.No food articles are fortified in India.
�� Nutritional rickets and vitamin D deficiency Nutritional rickets and vitamin D deficiency continues to exist as a major health problem in continues to exist as a major health problem in India.India.
33

Cont..Cont..
�� The most sensitive index in assessing vitamin D status The most sensitive index in assessing vitamin D status is 25(OH)D is 25(OH)D
(Hollis BW (Hollis BW CalcifCalcif Tissue Tissue IntInt; 1996; 58; 4; 1996; 58; 4--5)5)
�� Age, sex, pubertal status, latitude, season, race, Age, sex, pubertal status, latitude, season, race, pollution, sunscreen creams and ethnicity influence pollution, sunscreen creams and ethnicity influence 25(OH)D levels.25(OH)D levels.
�� Approximately 40Approximately 40--50% of total skeletal mass at 50% of total skeletal mass at maturity is accumulated during childhood and maturity is accumulated during childhood and adolescence.adolescence.
((Mora et al, 1999; Mora et al, 1999; CadoganCadogan et al, 1998)et al, 1998)
�� Life style determinants Life style determinants -- exercise, body composition, exercise, body composition, nutrition, calcium and Vitamin D intake affect bone nutrition, calcium and Vitamin D intake affect bone development.development.
44

Role of Vitamin D in our HealthRole of Vitamin D in our Health
�� It maintains blood calcium level in normal range which is vital It maintains blood calcium level in normal range which is vital for normal functioning of nervous system, bone growth and for normal functioning of nervous system, bone growth and achieving peak bone density.achieving peak bone density.
�� It is a potent immune system modulator and prevents It is a potent immune system modulator and prevents development of the autoimmune disorders.development of the autoimmune disorders.
�� It inhibits uncontrolled proliferation and stimulates It inhibits uncontrolled proliferation and stimulates differentiation of cells thereby preventing common cancers.differentiation of cells thereby preventing common cancers.
�� Plays a role in insulin secretion under conditions of increased Plays a role in insulin secretion under conditions of increased insulin demand. insulin demand.
Whiting J S and Calvo S M American Society of Nutritional Sciences, 2005
55

Pathway of Vitamin D SynthesisPathway of Vitamin D Synthesis
�� Solar UV RadiationSolar UV Radiation
�� (250(250--315 nm)315 nm)
�� ↓↓
�� Skin 7Skin 7--DHC (Pro D3) DHC (Pro D3) →→ Pre D3 Pre D3 →→ LumisterolLumisterol, , TachysterolTachysterol
�� (Thermal (Thermal isomerizationisomerization))
�� ↓↓
�� Dietary vitamin D Dietary vitamin D →→ Vitamin D3 Vitamin D3 →→ SuprasterolsSuprasterols
�� ↓↓
�� 25 hydroxylase25 hydroxylase
�� LIVERLIVER
�� ↓↓
�� 25(OH)D325(OH)D3
�� ↓↓
�� ↑↑Ca,Ca,↑↑Phos,Phos,↓↓PTHPTH→→(inhibit)(inhibit)→→11--alpha hydroxylase (promote)alpha hydroxylase (promote)←← ↑↑PTH,PTH,↓↓Ca,Ca,↓↓PhosPhos
�� KIDNEYKIDNEY
�� ↓↓
�� 1,25(OH)2D3 1,25(OH)2D3
�� ↓↓
�� Intestine, Bone, Parathyroid gland.Intestine, Bone, Parathyroid gland.
66

Normal levels of circulating 25(OH)D ?Normal levels of circulating 25(OH)D ?
�� Exact cutExact cut––offs for offs for ““deficiencydeficiency”” and and
““insufficiencyinsufficiency”” remain controversialremain controversial
�� Previous assessments based on Gaussian Previous assessments based on Gaussian
distribution of concentrations was grossly distribution of concentrations was grossly
inadequateinadequate
�� Threshold at which 25(OH)D induces an Threshold at which 25(OH)D induces an ↑↑ in in iPTHiPTH
concentration in adults range from 10concentration in adults range from 10--32ng/ml32ng/ml
�� Several classifications exist e.g. Lips P:Several classifications exist e.g. Lips P:
<5 <5 ng/mLng/mL -- severe severe hypovitaminosishypovitaminosis DD
55--10ng/mL 10ng/mL -- moderate moderate hypovitaminosishypovitaminosis DD
1010--20 20 ng/mLng/mL -- mild mild hypovitaminosishypovitaminosis D D 77

Normal levels of circulating Normal levels of circulating
25(OH)D25(OH)D
�� Functional indicators for defining Functional indicators for defining 25(OH)D adequacy (80 25(OH)D adequacy (80 nmolnmol//L,L, 32ng/ml) 32ng/ml) as the as the ““cutcut-- offoff””
�� Parathyroid hormone (PTH) Parathyroid hormone (PTH) ((ViethVieth R et al JCEM 2003)R et al JCEM 2003)
�� Calcium absorptionCalcium absorption(Heaney R et al (Heaney R et al J.AmJ.Am, Coll. , Coll. NutrNutr, 2003), 2003)
�� Bone Mineral Density Bone Mineral Density (Bischoff(Bischoff-- FerraiFerrai H et al H et al Am.JAm.J. Med. 2004) . Med. 2004)
88

Cont..Cont..
�� Growing body of evidence suggest that Growing body of evidence suggest that
serum 25(OH)D of <50 serum 25(OH)D of <50 nmolnmol/L or 20 /L or 20
ngng/ml may be associated with greater risk /ml may be associated with greater risk
of non skeletal chronic diseases.of non skeletal chronic diseases.((ZittermannZittermann A et al;2003,Holick MF et al 2004) A et al;2003,Holick MF et al 2004)
99

Deficiency Insufficiency Optimal
↕ ↕
SHORT LATENCY LONG LATENCY DISEASES :DISEASE : Loss of Calcitropic Effects• Rickets ● Osteoporosis ● Muscle pain and fatique• Osteomalacia ● Hypertension/ Cardiovascular Disease
Loss of Antiproliferative effects ● Cancer (breast, colon, prostrate)Loss of Immunomodulatory Effects ● Diabetes, Lupus etc.
SIGNIFICANCE OF VITAMIN D STATUS TO CHRONIC DISEASE
Whiting J S and Calvo S M American Society of Nutritional Sciences, 2005
1010
PREVALENCE OF VITAMIN D PREVALENCE OF VITAMIN D
INSUFFICIENCYINSUFFICIENCY
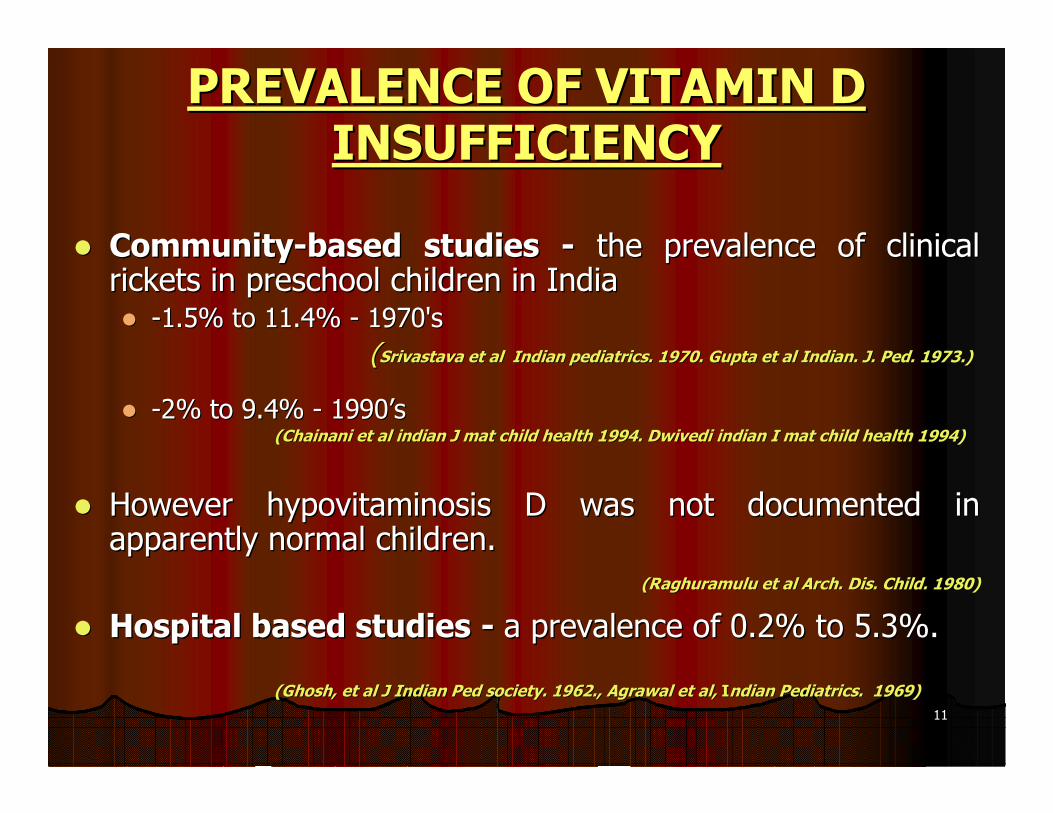
�� CommunityCommunity--based studies based studies -- the prevalence of clinical the prevalence of clinical rickets in preschool children in Indiarickets in preschool children in India�� --1.5% to 11.4% 1.5% to 11.4% -- 1970's 1970's
((SrivastavaSrivastava et al Indian pediatrics. 1970. Gupta et al Indian. J. et al Indian pediatrics. 1970. Gupta et al Indian. J. PedPed. 1973.). 1973.)
�� --2% to 9.4% 2% to 9.4% -- 19901990’’s s ((ChainaniChainani et al et al indianindian J mat child health 1994. J mat child health 1994. DwivediDwivedi indianindian I mat child health 1994)I mat child health 1994)
�� However However hypovitaminosishypovitaminosis D was not documented in D was not documented in apparently normal children.apparently normal children.
((RaghuramuluRaghuramulu et al Arch. Dis. Child. 1980)et al Arch. Dis. Child. 1980)
�� Hospital based studiesHospital based studies -- a prevalence of 0.2% to 5.3%.a prevalence of 0.2% to 5.3%.
((GhoshGhosh, et al J Indian , et al J Indian PedPed society. 1962., society. 1962., AgrawalAgrawal et al, et al, IIndian Pediatrics. 1969) ndian Pediatrics. 1969)
1111

PREVALENCE OF VITAMIN D INSUFFICIENCYPREVALENCE OF VITAMIN D INSUFFICIENCY
Vitamin D status in Asian immigrantsVitamin D status in Asian immigrants
�� In Asian migrants in the United Kingdom In Asian migrants in the United Kingdom -- prevalence of prevalence of rickets in children and adolescents rickets in children and adolescents -- 5% to 30% 5% to 30%
((GoelGoel KM et al Lancet, 1976; KM et al Lancet, 1976; DunniganDunnigan et al Scott Med. J, 1962; Holmes AM et al QJM, 1973)et al Scott Med. J, 1962; Holmes AM et al QJM, 1973)
�� Immigrant studies using biochemical and radiological Immigrant studies using biochemical and radiological parameters parameters -- 12.5% to 66% 12.5% to 66%
(Ford JA, Arch (Ford JA, Arch DisDis Child 1976; Child 1976; DunniganDunnigan MG Br Med J, 1981; Ford JA Br Med J 1972)MG Br Med J, 1981; Ford JA Br Med J 1972)
�� In children of Indian origin residing in South Africa, the In children of Indian origin residing in South Africa, the prevalence of knock knees and bow legs: 6.1 prevalence of knock knees and bow legs: 6.1 -- 19.4%19.4%
(Richardson BD (Richardson BD PostgradPostgrad Med. J 1975)Med. J 1975)
�� Incidence of rickets had come down in the immigrant Incidence of rickets had come down in the immigrant population population
((GoelGoel et al. Lancet 1981)et al. Lancet 1981)
1212
Vitamin D status in IndiansVitamin D status in Indians
�� Ever since the publication of Hodgkin et al on uncommon Ever since the publication of Hodgkin et al on uncommon
prevalence of vitamin D deficient prevalence of vitamin D deficient OsteomalaciaOsteomalacia among among
Punjabis in India as compared to those residing in UK, no Punjabis in India as compared to those residing in UK, no
systemic studies appeared assessing the vitamin D status of systemic studies appeared assessing the vitamin D status of
subjects living in tropical and subtropical latitudes of India subjects living in tropical and subtropical latitudes of India
till 1995. till 1995.
�� Systemic evaluation of 25(OH)D in apparently healthy Systemic evaluation of 25(OH)D in apparently healthy
Indian population was first carried out by Indian population was first carried out by GoswamiGoswami R et al R et al
in the year 2000 following a preliminary report of low in the year 2000 following a preliminary report of low
25(OH)D levels in patients with primary 25(OH)D levels in patients with primary
hyperparathyroidsmhyperparathyroidsm and 14 healthy controls.and 14 healthy controls.((HarinaryanHarinaryan CV et al. CV et al. ClinClin EndocrinolEndocrinol ((oxfoxf) 1995.)) 1995.)1313

Studies on vitamin D status in Studies on vitamin D status in
IndiansIndians
�� High prevalence of High prevalence of hypovitaminosishypovitaminosis D is D is
being increasingly recognized globally.being increasingly recognized globally.
�� Similarly widespread vitamin D deficiency Similarly widespread vitamin D deficiency
(74(74--96%) among apparently healthy 96%) among apparently healthy
Indians of all age groups and both sexes Indians of all age groups and both sexes
have been reported from India.have been reported from India.
1414

Vitamin D status in pregnancyVitamin D status in pregnancy
�� Recent limited data on vitamin D status in Recent limited data on vitamin D status in pregnant women in all 3 trimesters from pregnant women in all 3 trimesters from Delhi and Delhi and LucknowLucknow, reveal unexpectedly , reveal unexpectedly high prevalence (74high prevalence (74--98%) of 98%) of hypovitaminosishypovitaminosis D (25(OH)D < 20 D (25(OH)D < 20 ngng/dl)/dl)
�� The mean 25(OH)D values varied The mean 25(OH)D values varied from8.7from8.7±±4.3 to 144.3 to 14±±9.3 9.3 ngng/ml./ml.
SachanSachan A et A et al;AJCNal;AJCN 2005, 2005, SahuSahu M et M et al;Clinal;Clin EndocrinolEndocrinol 2009 (2009 (LucknowLucknow), ), GoswamiGoswami R et R et al;AJCNal;AJCN 2000 and 2000 and MarwahaMarwaha RK RK etaletal BJN. BJN.
1515

Vitamin D status in lactating mothersVitamin D status in lactating mothers
Vitamin D nutritional status of exclusively breast Vitamin D nutritional status of exclusively breast
fed infants and their mothersfed infants and their mothersSeth A and Seth A and MarwahaMarwaha RK et RK et al;JPEMal;JPEM 20092009
MotherMother--infant pairs studied : 180infant pairs studied : 180
�� Mean serum 25(OH)D: Mean serum 25(OH)D: 10.910.9±±5.8 5.8 ngng/ml /ml
((27.227.2±±14.6 14.6 nmolnmol/L)/L)
�� Prevalence of vitamin D deficiency (<20 Prevalence of vitamin D deficiency (<20 ngng/ml) : /ml) :
93.8%93.8%1616

Vitamin D status of Neonates and InfantsVitamin D status of Neonates and Infants
�� Clinical features of vitamin D deficiency : 3.9% (7/180)Clinical features of vitamin D deficiency : 3.9% (7/180)
�� High prevalence of low serum 25(OH)D levels in 80High prevalence of low serum 25(OH)D levels in 80--91% 91% infants 2 infants 2 --24 weeks old. 24 weeks old.
(Seth A & (Seth A & MarwahaMarwaha RK et al; JPEM 2009,Bhalala et al; Indian Pediatrics 2007)RK et al; JPEM 2009,Bhalala et al; Indian Pediatrics 2007)
�� Mean 25 (OH)D=11.55Mean 25 (OH)D=11.55±±8.3 8.3 ngng/ml. /ml.
�� Similar observation was made when cord blood was used.Similar observation was made when cord blood was used.((GoswamiGoswami R et al; AJCN 2000, R et al; AJCN 2000, SachanSachan A et al; AJCN 2005)A et al; AJCN 2005)
�� Significant correlation of 25(OH)D between mother infant Significant correlation of 25(OH)D between mother infant pairs has also been reported by several Indian studies.pairs has also been reported by several Indian studies.
((MarwahaMarwaha RK et al; JPEM 2009,Bhalala et al; Indian Pediatrics 2007 ,RK et al; JPEM 2009,Bhalala et al; Indian Pediatrics 2007 ,GoswamiGoswami R et al; R et al; AJCN 2000, AJCN 2000, SachanSachan A et al; AJCN 2005)A et al; AJCN 2005)
1717

Table: Comparison of studies on prevalence of Hypovitaminosis D
in neonates & infants in various countries.
Country Author & yr. of study
Study group Mean 25(OH)D % of hypovitaminosisD
Leeds Heckmatt JZ et al 1979
New born & young infants
36% (< 10 ng/ml)
U.A.E. Dawodu A et al 2003
Infants 82% (<10 ng/ml)
New Delhi, India Goswami R et al 2000
Newborns 6.686±4.2ng/ml
Lucknow, Delhi Bhatia VL et al 2005
Newborn Cord blood
8.4±5.7ng/ml 42.5% (<10ng/ml)
Netherlands Hoogenboezemet al 1989
Newborn Cord blood
22±1.8ng/ml
Pakistan (Study on hypocalcemicbabies and their mothers)
Atiq M et al 1998
Infants 7.5±3.3ng/ml
New Delhi, India
Marwaha et al 2009
Infants 11.55±8.3ng/ml 43.9% (<10ng/ml)1818

Vitamin D and bone mineral density status Vitamin D and bone mineral density status
of Healthy School Children in northern India of Healthy School Children in northern India MarwahaMarwaha RK & RK & TandonTandon N et al Am J N et al Am J ClinClin NutrNutr 20052005
�� Clinical vitamin D deficiency (G Clinical vitamin D deficiency (G VarumVarum & G & G ValgumValgum) was noted in ) was noted in 556/5137 (10.82%) subjects [LSES 556/5137 (10.82%) subjects [LSES –– 11.6%, USES 11.6%, USES –– 9.7% (P = 9.7% (P = 0.07)]0.07)]
�� Mean 25(OH)D value was 11.8Mean 25(OH)D value was 11.8±±7.2 7.2 ngng/ml/ml
�� Low 25(OH)D levels according to Lips criteria seen in 92% of LSELow 25(OH)D levels according to Lips criteria seen in 92% of LSES S
and 84% of USESand 84% of USES
�� 25(OH)D higher in boys than girls in both the groups (25(OH)D higher in boys than girls in both the groups (PP = 0.030 in = 0.030 in
LSES; LSES; PP = 0.015 in USES).= 0.015 in USES).
�� Secondary hyperparathyroidism was noted in only 11% subjects.Secondary hyperparathyroidism was noted in only 11% subjects.
1919

Objective:Objective:
�� To examine the role of lifestyle & diet on vitamin D status in To examine the role of lifestyle & diet on vitamin D status in
healthy school girls (6healthy school girls (6--18 yrs) from Delhi18 yrs) from Delhi
Study Design: Study Design:
�� Clinical and anthropometric assessment was done in 3127 Clinical and anthropometric assessment was done in 3127
girls, 6girls, 6--17yrs of age (LSES17yrs of age (LSES--1477 & USES1477 & USES--1650)1650)
�� Dietary, physical activity profile and biochemical assessment Dietary, physical activity profile and biochemical assessment
was randomly done in 193 LSES & 211 USES girlswas randomly done in 193 LSES & 211 USES girls
Vitamin D status of apparently healthy school girls Vitamin D status of apparently healthy school girls
from two different sociofrom two different socio--economic strata in Delhi: economic strata in Delhi:
Relation to nutrition & life styleRelation to nutrition & life stylePuriPuri S & S & MarwahaMarwaha RK et al BJN 2007RK et al BJN 2007
2020

RESULTSRESULTS
�� Clinical evidence of vitamin D deficiency was noted at Clinical evidence of vitamin D deficiency was noted at
11.5% subjects.11.5% subjects.
�� Mean serum 25(OH)D was 12.74 Mean serum 25(OH)D was 12.74 ±± 6.17 6.17 ngng/ml./ml.
�� Prevalence of biochemical Prevalence of biochemical hypovitaminosishypovitaminosis D (< 20ng/ml) D (< 20ng/ml)
was 90.8%.was 90.8%.
�� Significant correlation was found between 25(OH)D Significant correlation was found between 25(OH)D
concentration and estimated sun exposure (r=0.185, concentration and estimated sun exposure (r=0.185,
p<0.001) and between 25(OH)D and percentage of body p<0.001) and between 25(OH)D and percentage of body
surface area exposed (r=0.146, p=0.004)surface area exposed (r=0.146, p=0.004)
�� No significant association was found between Vitamin D No significant association was found between Vitamin D
intake and serum 25(OH)D levels (r=0.001,p=0.137)intake and serum 25(OH)D levels (r=0.001,p=0.137)2121

CONCLUSIONCONCLUSION
�� Life style related factors contribute Life style related factors contribute
significantly to the vitamin D status of significantly to the vitamin D status of
apparently healthy school girls.apparently healthy school girls.
�� In the absence of vitamin D fortification of In the absence of vitamin D fortification of
food, diet alone appears to have an food, diet alone appears to have an
insignificant role.insignificant role.
2222

Vitamin D status in Indian AdultsVitamin D status in Indian Adults
�� Title: Title:
Prevalence and significance of low 25(OH)D conc. in healthy subjPrevalence and significance of low 25(OH)D conc. in healthy subjects in ects in DelhiDelhi
GoswamiGoswami R et al R et al Am J Am J ClinClin NutrNutr 2000; 72:4722000; 72:472--55
�� Objective:Objective:
To assess 25(OH)D status & itTo assess 25(OH)D status & it’’s functional significance in apparently s functional significance in apparently healthy subjectshealthy subjects
�� Design:Design:
�� 123 healthy subjects in 5 different groups 123 healthy subjects in 5 different groups –– soldiers, physicians & soldiers, physicians & nurses, nurses, depigmenteddepigmented people, pregnant women & newborns from Delhi people, pregnant women & newborns from Delhi (Latitude 28.4(Latitude 28.4ºº N, Longitude 77.1N, Longitude 77.1ºº E) were evaluatedE) were evaluated
�� Subjects differed with respect to sunlight exposure, season of Subjects differed with respect to sunlight exposure, season of measurement, skin pigmentation and dietary Ca and measurement, skin pigmentation and dietary Ca and phytatephytate contentscontents
�� Serum Ca, PO4, SAP, 25(OH)D, Serum Ca, PO4, SAP, 25(OH)D, iPTHiPTH and 1,25(OH)and 1,25(OH)22D were measuredD were measured
2323

Cont..Cont..
�� ResultsResults:: All groups except soldiers with maximum All groups except soldiers with maximum
direct sunlight exposure had subnormal conc. of direct sunlight exposure had subnormal conc. of
25(OH)D 25(OH)D
�� The 25(OH)D deficient groups tended to an The 25(OH)D deficient groups tended to an
imbalance in bone mineral homeostasis when imbalance in bone mineral homeostasis when
exposed to winter weather andexposed to winter weather and ↓↓ dietary Ca with dietary Ca with
significantly low serum Ca and elevated significantly low serum Ca and elevated iPTHiPTH
concentrations, chemical concentrations, chemical osteomalaciaosteomalacia or both.or both.2424

�� Significant negative correlation between Significant negative correlation between
25(OH)D and 25(OH)D and iPTHiPTH
�� Significant inverse relation between Significant inverse relation between iPTHiPTH and and
calciumcalcium
Cont..Cont..
2525

Clinical characteristics, sun exposure and serum Clinical characteristics, sun exposure and serum concentration of Vitamin D and related variables in concentration of Vitamin D and related variables in
the study groupsthe study groups____________________________________________________________________________________________________________________________________________________________________________ ____________________________________________
VariablesVariables SoldiersSoldiers Physicians Physicians PhysiciansPhysicians Pregnant Pregnant NewborrnsNewborrns
(winter) and nurses and nurses women (summer) (winter) and nurses and nurses women (summer)
(winter) (summer) (summer) (winter) (summer) (summer)
(n= 31 M) (n=11M, 8F) (n=11M, 8F) (n=29 F) ((n= 31 M) (n=11M, 8F) (n=11M, 8F) (n=29 F) (n=16M, 13F)n=16M, 13F)________________________________________________________________________________________________________________________________________________________________
Calcium Calcium 1104 1104 ±± 666 879 666 879 ±± 165 879 165 879 ±± 165 345 165 345 ±± 78 78 --
Intake (mg/d)Intake (mg/d)
Sun exposure Sun exposure 370 370 ±± 30 25 30 25 ±± 5 25 5 25 ±± 5 25 5 25 ±±5 5 --
(min/d)(min/d)
25(OH)D 47.17 25(OH)D 47.17 ±±11.73 7.98 11.73 7.98 ±±3.49 17.97 3.49 17.97 ±±7.98 21.9 7.98 21.9 ±±10.73 16.72 10.73 16.72 ±±4.994.99
((nmolnmol/L)/L)
1,25(OH)D1,25(OH)D ND ND NDND 93.693.6++29.0 16.829.0 16.8++59 114.559 114.5++55.455.4
((pmolpmol/L)/L)
iPTHiPTH ((ngng/L)/L) 17.6 17.6 ±±4.8 38.8 4.8 38.8 ±±18.2 ND 18.2 ND NDND NDND
Total CalciumTotal Calcium 2.35 2.35 ±±0.17 2.17 0.17 2.17 ±±0.10 2.25 0.10 2.25 ±±0.3 1.16 0.3 1.16 ±±0.32 1.32 0.32 1.32 ±±0.320.32
((nmolnmol/L)/L)
ALK (KAU)ALK (KAU) 7.9 7.9 ±±3.0 6.4 3.0 6.4 ±±1.8 6.4 1.8 6.4 ±±2.3 14.0 2.3 14.0 ±±10.0 19.9 10.0 19.9 ±±15.315.32626

ConclusionsConclusions
�� Healthy subjects in Delhi are vitamin D Healthy subjects in Delhi are vitamin D
deficient because of inadequate sunlight deficient because of inadequate sunlight
exposure and skin pigmentation.exposure and skin pigmentation.
2727

2828

BMD in Healthy Indians, BMD in Healthy Indians, LucknowLucknow
�� 92 (67F, 25M) young healthy volunteers92 (67F, 25M) young healthy volunteers
�� Systemic disease/drugs Systemic disease/drugs –– excludedexcluded
�� Vitamin D and serum Vitamin D and serum iPTHiPTH (15) measured (15) measured
�� 74% had daily calcium intake <500 mg74% had daily calcium intake <500 mg
�� 67% had serum 25(OH)D levels < 15 67% had serum 25(OH)D levels < 15 ngng/ml/ml
�� BMD BMD –– spine and hipspine and hip
Arya V, Osteoporosis Int 20042929

Vitamin D and BMD in Healthy IndiansVitamin D and BMD in Healthy Indians
Arya V, Osteoporosis Int 2004
Correlation with 25(OH)D
Wards’ triangle r=0.50, p=0.020
Femoral neck r=0.46, p=0.037
Other sites not significant3030

High prevalence of low dietary calcium and low vitamin D High prevalence of low dietary calcium and low vitamin D
status in healthy south Indiansstatus in healthy south IndiansHarinarayanHarinarayan CV et al: Asia Pac J CV et al: Asia Pac J ClinClin NutrNutr 2004; 13 (4): 3592004; 13 (4): 359--365365
Objective:Objective: To document the dietary habits, serum calcium, To document the dietary habits, serum calcium,
25(OH)D & PTH in Indian Urban and rural population25(OH)D & PTH in Indian Urban and rural population
Methods:Methods:
�� 125 healthy urban & 191 rural subjects were evaluated 125 healthy urban & 191 rural subjects were evaluated
from from TirupatiTirupati, South Andhra Pradesh., South Andhra Pradesh.
�� Location (Latitude 13.4Location (Latitude 13.4ººN, longitude 77.2N, longitude 77.2ººE)E)
�� Cloud free sunlight for 8 Cloud free sunlight for 8 –– 10 Hours per day with little 10 Hours per day with little
seasonal variationseasonal variation
3131

RESULTSRESULTS
�� Daily intake of calcium in both rural (264 Daily intake of calcium in both rural (264 ±±1.9 1.9
mg/day) & urban (354 mg/day) & urban (354 ±± 4mg/day) subjects was 4mg/day) subjects was
low compared to RDA (400mg/day) by ICMRlow compared to RDA (400mg/day) by ICMR
�� Serum 25(OH)D (Serum 25(OH)D (ngng/ml) levels: /ml) levels:
> 20 in 31% cases> 20 in 31% cases
1010--20 in 54%20 in 54%
< 10 in 15% < 10 in 15%
�� 25(OH)D concentration in rural subjects were 25(OH)D concentration in rural subjects were
significantly higher than those of urban subjects significantly higher than those of urban subjects
(21(21±±0.46 0.46 vsvs 13.5213.52±±0.59 0.59 ngng/ml; p<0.001) in both /ml; p<0.001) in both
men and women.men and women.3232

25(OH)D Levels
<20ng/ml 20-30ng/ml >30ng/ml
Rural M 44% 39.5% 16.5%
F 70% 29% 1%
Urban M 62% 26% 12%
F 75% 19% 6%
3333

CONCLUSIONCONCLUSION
�� Low Ca & 25(OH)D concentration were Low Ca & 25(OH)D concentration were
associated with deleterious effects on bone associated with deleterious effects on bone
mineral homeostasis mineral homeostasis
�� Prospective longitudinal studies required to Prospective longitudinal studies required to
assess the effect on BMD, a surrogate marker assess the effect on BMD, a surrogate marker
for #risk and # ratesfor #risk and # rates
3434

Vitamin D status in apparently healthy adults in Vitamin D status in apparently healthy adults in
Kashmir Valley of Indian subcontinentKashmir Valley of Indian subcontinentZargarZargar et al Postgraduate Medical Journal 2007et al Postgraduate Medical Journal 2007
�� Total subjects studied Total subjects studied –– 92 ( M92 ( M--64, F64, F--28)28)
�� Location: Latitude(Location: Latitude(34.334.3ººN) Longitude (73.9N) Longitude (73.9ººE).E).
�� Vitamin D deficiency (25 (OH)D<20ng/dl) reported Vitamin D deficiency (25 (OH)D<20ng/dl) reported
in 83%.in 83%.
�� Mild Mild hypovitaminosishypovitaminosis D D –– 25%25%
�� Moderate Moderate hypovitaminosishypovitaminosis D D –– 33%33%
�� Severe Severe hypovitaminosishypovitaminosis D D –– 25%25%
�� Exposure to sunlight was inadequate in vitamin Exposure to sunlight was inadequate in vitamin
deficiency patients.deficiency patients.3535

Presence of 25(OH)D deficiency in a rural north Presence of 25(OH)D deficiency in a rural north
Indian village despite abundant sunshineIndian village despite abundant sunshineGoswamiGoswami R et al JAPI 2008.R et al JAPI 2008.
�� Design & Methods: Design & Methods:
A total of 57 subjects (32 males, 25 females) from A total of 57 subjects (32 males, 25 females) from
50/200 families from 50/200 families from AgotaAgota village 90 Km east of village 90 Km east of
Delhi were evaluated for serum 25(OH)D.Delhi were evaluated for serum 25(OH)D.
�� Location:Location: Latitude 28.5Latitude 28.5ººN and longitude 77.8N and longitude 77.8ººE.E.
�� Sun exposure:Sun exposure: Approx. 5 Hrs/day.Approx. 5 Hrs/day.
3636

ResultsResults�� The mean 25(OH)D values was 36.4The mean 25(OH)D values was 36.4±±22.5 22.5
nmolnmol/L./L.
�� The serum 25(OH)D values of males (44.2The serum 25(OH)D values of males (44.2±±24.4 24.4
nmolnmol/L) and females (26.9/L) and females (26.9±±15.9 15.9 nmolnmol/L) in rural /L) in rural
area were six and four fold higher than that of area were six and four fold higher than that of
the urban subjects ( 13.5the urban subjects ( 13.5±±3.0 3.0 nmolnmol/L)./L).
�� Only 18/57 subjects(31.5%, 15 males and 3 Only 18/57 subjects(31.5%, 15 males and 3
females) had serum 25(OH)D levels females) had serum 25(OH)D levels ≥≥50 50 nmolnmol/L./L.
3737

ConclusionConclusion
�� Longer sunshine exposure results in better Longer sunshine exposure results in better
25(OH)D status among subject residing in 25(OH)D status among subject residing in
rural areas as compared to urban rural areas as compared to urban
counterparts, yet 2/3 rd of the rural counterparts, yet 2/3 rd of the rural
subjects would remain 25(OH)D deficient subjects would remain 25(OH)D deficient
with values <49.9 with values <49.9 nmolnmol/L./L.
3838

Prevalence of vitamin D deficiency and its relationship with Prevalence of vitamin D deficiency and its relationship with
thyroid autoimmunity in Asian Indians : a community based thyroid autoimmunity in Asian Indians : a community based
surveysurveyGoswamiGoswami R, R, MarwahaMarwaha RK et al BJN 2009RK et al BJN 2009
�� Introduction:Introduction:
�� 25(OH)D deficiency has been linked with predisposition to autoim25(OH)D deficiency has been linked with predisposition to autoimmune mune
disorders like Type I DM, Multiple Sclerosis, Rheumatoid Arthritdisorders like Type I DM, Multiple Sclerosis, Rheumatoid Arthritis etc.is etc.((ArnsonArnson Y et al. Ann Rheum Y et al. Ann Rheum DisDis 2007,66:11372007,66:1137--1142. 1142. HolickHolick MF. NEJM 2007,357:266MF. NEJM 2007,357:266--281)281)
�� Objective:Objective:
�� To assess prevalence of vitamin D deficiencyTo assess prevalence of vitamin D deficiency
�� To assess relationship between serum 25(OH)D levels and thyroid To assess relationship between serum 25(OH)D levels and thyroid
autoimmunity.autoimmunity.
�� Methodology:Methodology:
�� A total of 642 subjects (244 m, 398 F), 16A total of 642 subjects (244 m, 398 F), 16--60 years old included 60 years old included
students, teachers and staff were evaluated for thyroid functionstudents, teachers and staff were evaluated for thyroid function (T3, T4 (T3, T4
and TSH), Thyroid autoimmunity by TPO and TSH), Thyroid autoimmunity by TPO AbAb, 25(OH)D and PTH., 25(OH)D and PTH.3939

ResultsResults
�� The mean serum 25(OH)D of the study subjects was 17.5The mean serum 25(OH)D of the study subjects was 17.5±±10.2 10.2
nmolnmol/L./L.
�� >96% had values <50 >96% had values <50 nmolnmol/L./L.
�� 87% of subjects had values 87% of subjects had values ≤≤25nmol/L.25nmol/L.
�� Biochemical Biochemical hyperparathyroidsmhyperparathyroidsm was present in only 28.5% subjects.was present in only 28.5% subjects.
�� Relationship between 25(OH)D and TPO Relationship between 25(OH)D and TPO AbAb was assessed with and was assessed with and
without controlling for age.without controlling for age.
�� Significant inverse correlation (rSignificant inverse correlation (r--0.08, p+0.04) was noted when 0.08, p+0.04) was noted when
adjusted for age.adjusted for age.
4040

ResultsResults
�� Secondary Secondary hyperparathyroidsmhyperparathyroidsm was significantly was significantly
higher (31%) in those with 25(OH)D levels higher (31%) in those with 25(OH)D levels ≤≤25 25
nmolnmol/L as compared to those (10.8%) with levels /L as compared to those (10.8%) with levels
>25 >25 nmolnmol/L./L.
�� Serum 25(OH)D values show only weak inverse Serum 25(OH)D values show only weak inverse
correlation with TPO correlation with TPO AbAb titrestitres..
4141

ConclusionConclusion
�� Presence of weak association and narrow Presence of weak association and narrow
range of serum 25(OH)D did not allow us to range of serum 25(OH)D did not allow us to
interpret the results in terms of quantitative interpret the results in terms of quantitative
cutcut--off values of serum 25(OH)D.off values of serum 25(OH)D.
�� Further studies in vitamin D sufficient Further studies in vitamin D sufficient
population with wider range of serum population with wider range of serum
25(OH)D levels are required to substantiate 25(OH)D levels are required to substantiate
the findings of the current study.the findings of the current study.4242

Impact of nutrition and Impact of nutrition and
physical activity on physical activity on
BMD in young healthy BMD in young healthy
Indian femaleIndian femaleMarwahaMarwaha RK et al RK et al
4343

Background:Background:
Peak bone mass is influenced by genetic, Peak bone mass is influenced by genetic,
nutrition lifestyle and hormonal factors. This nutrition lifestyle and hormonal factors. This
study was designed to evaluate the impact study was designed to evaluate the impact
of physical activity and nutrition on bone of physical activity and nutrition on bone
mineral metabolic parameters in young mineral metabolic parameters in young
sports persons.sports persons.
4444

Material & MethodsMaterial & Methods
•• 186 healthy female subjects (sports women 186 healthy female subjects (sports women –– 90, control 90, control ––
90) in the age group of 1890) in the age group of 18--20 yrs were selected from Delhi 20 yrs were selected from Delhi
colleges. Controls were age, weight and BMI matched.colleges. Controls were age, weight and BMI matched.
•• Detailed evaluation of anthropometry, biochemistry, Detailed evaluation of anthropometry, biochemistry,
25(OH)D, PTH, diet and lifestyle was carried out.25(OH)D, PTH, diet and lifestyle was carried out.
•• BMD at hip, forearm and lumbar regions were studied BMD at hip, forearm and lumbar regions were studied
using central DEXA.using central DEXA.
4545

ResultsResults
Sports Girls Controls
Physical activity (per day)
2-3 hrs Sedentary
Sunlight exposure (hrs/day)
2 1/2
Mean serum 25(OH)D (ng/ml)
21.3±7.6* 5.2±3.1*
iPTH (pg/ml) 35.3±17.6* 51.7±44.9*
ALP (IU/L) 194±51* 222.1±51.4*
Total calorie intake 2044 ± 629*(769 – 3690)
1429.5±274(729.4-2070.2)
* P <0.0014646

ResultsResults
Vitamin D deficiency
Sports girls Controls
Normal (>20 ng/ml)
51.6% 0%
Mild (10-20 ng/ml)
45.1% 17.3%
Moderate ( 5-10 ng/ml)
3.3% 38.5%
Severe (<5 ng/ml)
0% 54.2%
4747

Anthropometric ParametersAnthropometric ParametersVariable Control girls (n=96) Sports girls (n=90) Overall (n=186)
Age (years) 18.5±1.3
(17-21)
18.7±1.2
(16-22)
18.6 ± 1.3
(16-22)
Height (cm) 158.1±5.7
(143-171)
158.5 ± 5.7
(146 – 178)
157.4 ± 5.7
(143-178.5)
Weight (kg) 52.4±8.4
(37-79.3)
54.0 ± 9.1
(41.5 – 100.4)
53.2 ± 8.8
(37 – 100.4)
Body Mass Index
((kg/m2)
21±3.5
(13.8-31.6)
21.6 ± 3.1
(16.1 – 34.7)
21.2 ± 3.3
(13.8 – 34.7)
Values are given as Mean ± SD (range)
Significant differences against controls (Student’s t-test, independent data): ***P≤0.001.
ALP, Alkaline phosphatase; PTH, Parathyroid hormone
4848

BMD ParametersBMD Parameters
Parameter Control girls (n=96) Sports girls (n=90)
Total BMD (g/cm2) 1.07±0.087 1.13±0.1***
Total femur (g/cm2) 0.96±0.12 1.08±0.14***
Femur neck (g/cm2) 1.07±0.87 1.04±0.13
33% Radius (g/cm2) 0.60±0.09 0.65±0.55***
Lumber (L1-L4) (g/cm2) 1.07±0.13 1.18±0.14***
Values are given as Mean ± SDSignificant differences against controls (Student’s t-test, independent data): ***P≤0.001
4949

ConclusionConclusion
�� Physical activity, optimal nutrition and Physical activity, optimal nutrition and
adequate sun exposure are vital for adequate sun exposure are vital for
attaining peak bone mass.attaining peak bone mass.
�� Despite 2 hours of sun exposure and 30% Despite 2 hours of sun exposure and 30%
body surface area exposed, only 52% could body surface area exposed, only 52% could
achieve serum 25(OH)D levels beyond 20 achieve serum 25(OH)D levels beyond 20
ngng/ml./ml.
5050

Peak Bone Mineral Density of physically active healthy Indian mePeak Bone Mineral Density of physically active healthy Indian men n
with adequate nutrition and no known current constraints to bonewith adequate nutrition and no known current constraints to bone
mineralizationmineralizationMarwahaMarwaha RK & RK & TandonTandon N et al Journal of Clinical Densitometry 2009N et al Journal of Clinical Densitometry 2009
Objective:Objective:
To characterize peak bone density and To characterize peak bone density and
evaluate its determinants in a healthy evaluate its determinants in a healthy
cohort of young military personnel.cohort of young military personnel.
5151

Material & Methods:Material & Methods:
�� Total no. of Total no. of JawansJawans (21(21--40 yrs) enrolled: 47340 yrs) enrolled: 473
�� Study was conducted between November and December 2007.Study was conducted between November and December 2007.
�� The subjects underwent biochemical analysis for fasting glucose,The subjects underwent biochemical analysis for fasting glucose,thyroid profile, total and ionized Ca, POthyroid profile, total and ionized Ca, PO44, ALP, 25(OH)D and , ALP, 25(OH)D and iPTHiPTH..
�� Dietary assessment of total energy, protein, carbohydrate, calciDietary assessment of total energy, protein, carbohydrate, calcium, um, phytatephytate and and fibrefibre intake was made through 24 hrs recall of food intake.intake was made through 24 hrs recall of food intake.
�� The entire cohort underwent regular outdoor weight bearing physThe entire cohort underwent regular outdoor weight bearing physical ical activities and adequate sun exposure.activities and adequate sun exposure.
�� BMD of AP lumbar spine (L1BMD of AP lumbar spine (L1--L4), femur (neck, wards triangle and L4), femur (neck, wards triangle and trochantertrochanter) and forearm (total, ) and forearm (total, ultradistalultradistal and 33% radius) were and 33% radius) were measured using the prodigy oracle according to std. protocol.measured using the prodigy oracle according to std. protocol.
5252

ResultsResults
�� Intake of Calcium and protein exceeded recommended daily allowanIntake of Calcium and protein exceeded recommended daily allowance.ce.
�� Mean serum 25(OH)D levels was 34.09 Mean serum 25(OH)D levels was 34.09 ±±15.8 15.8 nmolnmol/L./L.
�� Prevalence of vitamin D deficiency (<50 Prevalence of vitamin D deficiency (<50 nmolnmol/L) was noted in 85% subjects./L) was noted in 85% subjects.
�� Peak BMD in femoral and lumbar regions were achieved by 30 yrs oPeak BMD in femoral and lumbar regions were achieved by 30 yrs of agef age--consistent with other studies.consistent with other studies.
�� Body weight was the strongest predictor of BMD at all measured Body weight was the strongest predictor of BMD at all measured sites which sites which reinforces the data from literature.reinforces the data from literature.
�� No correlation of BMD at different sites with serum 25(OH)D leveNo correlation of BMD at different sites with serum 25(OH)D levels as also ls as also reported earlier by various workers.reported earlier by various workers.
�� Peak BMD in this population was comparable to that reported in UPeak BMD in this population was comparable to that reported in US white males.S white males.
5353

Prevalence of vitamin D DeficiencyPrevalence of vitamin D Deficiency
Vitamin D levels (ng/ml) Percentage
<5 4.2%
5-10 25.2%
10-20 55.4%
>20 15.1%
5454

ConclusionConclusion
�� The present study shows that 85% of the The present study shows that 85% of the
healthy Indian adult men could not healthy Indian adult men could not
achieve normal serum 25(OH)D levels achieve normal serum 25(OH)D levels
despite adequate outdoor activities and despite adequate outdoor activities and
sun exposure.sun exposure.
5555

Vitamin D status of Senior Citizens of Vitamin D status of Senior Citizens of
DelhiDelhiMarwahaMarwaha RK et alRK et al
Total no. of subjects studied is 1400Total no. of subjects studied is 1400
Female:Female: 739 739
Male :Male : 661.661.
�� Mean 25(OH)D levelsMean 25(OH)D levels: Males: Males-- 9.79.7±±6.8, Females6.8, Females-- 9.69.6±±7.517.51
�� Mean PTH levels: MalesMean PTH levels: Males-- 57.757.7±±36.9, Females36.9, Females-- 57.557.5±±3737
�� Secondary hyperparathyroidism :Secondary hyperparathyroidism : 431 (30.7%)431 (30.7%)
Overall vitamin D deficiency [25(OH)D <20 Overall vitamin D deficiency [25(OH)D <20 ngng/dl] : 91.5%./dl] : 91.5%.
Mild Mild hypovitaminosishypovitaminosis D :D : 399(28.5%)399(28.5%)
Moderate Moderate hypovitaminosishypovitaminosis D :D : 474(33.8%)474(33.8%)
Severe Severe hypovitaminosishypovitaminosis D :D : 396(28.3%)396(28.3%)
No significant differences of vitamin D deficiency prevalence waNo significant differences of vitamin D deficiency prevalence was noted s noted in different sexes.in different sexes.
5656

ConclusionConclusion
�� Studies on bone mineral health from different parts of India Studies on bone mineral health from different parts of India indicate wide prevalence of vitamin D deficiency (VDD) in all indicate wide prevalence of vitamin D deficiency (VDD) in all age groups including neonates, infants, school children, age groups including neonates, infants, school children, pregnant / lactating women and adult males and females pregnant / lactating women and adult males and females residing in rural and urban India. residing in rural and urban India.
�� These have resulted due to poor sun exposure, dark skin These have resulted due to poor sun exposure, dark skin complexion, vegetarian food habits, sedentary life style and laccomplexion, vegetarian food habits, sedentary life style and lack k of vitamin D food fortification of vitamin D food fortification programmeprogramme..
�� SupranormalSupranormal serum parathyroid hormone values and low peak serum parathyroid hormone values and low peak bone mass in apparently healthy children and adults reported in bone mass in apparently healthy children and adults reported in various studies could be linked to various studies could be linked to hypovitaminoishypovitaminois D in Indians.D in Indians.
�� In such a scenario active intervention may be required in the In such a scenario active intervention may be required in the form of a national policy for vitamin D form of a national policy for vitamin D fortification/supplementation fortification/supplementation programmeprogramme in our country. in our country.
5757

5858

Impact of vitamin D Impact of vitamin D
deficiency on muscle deficiency on muscle
energy metabolism using energy metabolism using 3131 P NMR SpectroscopyP NMR Spectroscopy

ObjectiveObjective
�� To analyze muscle phosphate metabolism in To analyze muscle phosphate metabolism in
vitamin D deficient subjects using vitamin D deficient subjects using 3131 P P
Magnetic Resonance Spectroscopy and look Magnetic Resonance Spectroscopy and look
upon the effect of vitamin D upon the effect of vitamin D
supplementation on muscle metabolism.supplementation on muscle metabolism.
6060

MethodologyMethodology
�� Seventeen vitamin D deficient otherwise healthy Seventeen vitamin D deficient otherwise healthy
subjects performed plantar flexion exercise before subjects performed plantar flexion exercise before
and after three months of vitamin D and after three months of vitamin D
supplementation while lying supine in 1.5 T supplementation while lying supine in 1.5 T
magnetic resonance scanner using custom built magnetic resonance scanner using custom built
exercise device.exercise device.
�� MR Spectroscopy measurements of inorganic MR Spectroscopy measurements of inorganic
phosphate (Pi), phosphate (Pi), phosphocreatinephosphocreatine ((PCrPCr), ),
PhosphodiestersPhosphodiesters (PDE) and ATP of calf muscle (PDE) and ATP of calf muscle
were taken during rest, at the end of exercise and were taken during rest, at the end of exercise and
in the recovery phase.in the recovery phase.6161

ResultsResults
�� Baseline mean 25(OH)D levelBaseline mean 25(OH)D level-- 3.38 3.38 ngng/ml/ml
�� Post supplementation mean 25(OH)D levelPost supplementation mean 25(OH)D level--
32.2 32.2 ngng/ml/ml
�� Baseline mean Baseline mean iPTHiPTH levellevel-- 68.18 IU/ml68.18 IU/ml
�� Post supplementation mean Post supplementation mean iPTHiPTH levellevel--
56.6 IU/ml 56.6 IU/ml 6262

ResultsResults
�� Normal PCR/Pi ratio in normal people is Normal PCR/Pi ratio in normal people is
(8.5(8.5±±2.1)2.1)
�� PCR/Pi ratio in vitamin deficient subjects is PCR/Pi ratio in vitamin deficient subjects is
(5.7(5.7±±0.81)0.81)
�� PCR/Pi ratio in subjects supplemented with PCR/Pi ratio in subjects supplemented with
60000 IU of vitamin D60000 IU of vitamin D33 for three months for three months
showed significant increase to (6.66showed significant increase to (6.66±±0.89, 0.89,
p=<0.001)p=<0.001)6363

ConclusionConclusion
�� The present study concludes that vitamin D The present study concludes that vitamin D
deficiency has marked effect on muscle deficiency has marked effect on muscle
metabolism and vitamin D supplementation metabolism and vitamin D supplementation
improves muscle metabolism as shown by improves muscle metabolism as shown by
increased PCR/Pi post supplementation.increased PCR/Pi post supplementation.
6464