Chapter 2 Exploring The Unique Characteristics Of LSPR Biosensing

Visualizing the Size, Shape, Morphology, andLocalized Surface Plasmon Resonance ofIndividual Gold Nanoshells by Near-InfraredMultispectral Imaging Microscopy
Irena Mejac,† William W. Bryan,‡ T. Randall Lee,‡ and Chieu D. Tran*,†
Department of Chemistry, Marquette University, P.O. Box 1881, Milwaukee, Wisconsin 53201, and Department ofChemistry, University of Houston, 4800 Calhoun Road, Houston, Texas 77204
We have successfully utilized the newly developed near-infrared multispectral imaging (NIR-MSI) microscope toobserve and measure directly the localized surface plas-mon absorption (LSPR) of individual gold nanoshells. TheNIR-MSI is suited for this task because it can simulta-neously record spectral and spatial information of asample with high sensitivity (single pixel resolution) andhigh spatial resolution (∼0.9 µm/pixel). Importantly, theLSPR of individual nanoshells measured by the NIR-MSImicroscope agrees well with the spectra calculated theo-retically using Mie scattering for the nanoshells (i.e.,nanoshells with silica cores ∼800 nm in diameter andgold shell thicknesses of ∼35 nm). Additionally, the NIR-MSI microscope enables measurement of LSPR at differ-ent positions within a single nanoshell. LSPR spectra werefound to be distinct at various positions within a singlenanoshell. Since LSPR spectra are known to depend onthe shape and morphology of the nanoshells, these resultsseem to suggest that the individual nanoshells are notsmooth and well-defined, but are rather rough and inho-mogeneous. The LSPR spectra of single nanoshells inseveral different solvents were also examined using NIR-MSI and were found to depend on the dielectric constantof the medium. However, the relationship was discoveredto be more complex than simply following the Drudeequation. Specifically, when (λmax/fwhm)2 values of LSPRfor single gold nanoshells were plotted as a functionof 2n2 (or 2E) for nanoshells in six different solvents,a linear relationship was found for only three solvents:D2O, acetonitrile-d3, and ethyl acetate. Acetone-d6
showed a slight deviation, whereas formamide andpyridine-d5 exhibited distinctly different correlations.
The optical properties of noble metal nanoparticles are thesubject of intense interest because of their extensive use asfunctional materials in applications such as optical devices, energytransport, near-field scanning optical microscopy, surface-en-
hanced spectroscopies, and chemical and biochemical sensors.1-3
Noble metal nanoparticles exhibit a strong absorption band thatarises when the incident photon frequency is resonant with thecollective oscillation of the electrons and is known as the localizedsurface plasmon resonance (LSPR).1-3 The properties of the LSPRare controlled by the dielectric function of the constituent metaland the embedding medium, and also by the shape of thenanostructure.1-3 For nanoshells, the shell/core ratio is largelyresponsible for the plasmon resonance frequency supported bythis geometry.4-6
A number of groups have reported the absorption spectra ofnanoparticles and nanoshells prepared in water and in organicsolvents. However, comparison of the spectra is not easy becauseof differences in particle shape, size, distribution, and stability.Specifically, key structural parameters such as the aspect ratio,cap-end shape, and volume of the particles are frequently poly-disperse, leading to strong inhomogeneities in the optical re-sponse. This lack of monodispersity makes it difficult to comparenot only data obtained from different experiments but also dataderived from experiment and computation. As a consequence, itis difficult to analyze quantitatively the efficiency of the nanoshellsin applications such as those based on field-enhancement effects.
To overcome the inhomogeneous broadening inherent inensemble measurements, single-particle spectra are desired. Suchchallenges have prompted considerable efforts in the past fewyears to develop a technique that can measure the plasmon modesof single nanoparticles. Limited success has been made, includingthe use of such techniques as scanning near-field optical micros-copy (SNOM), dark field illumination (DF), high resolutionelectron energy loss spectroscopy, and spatial modulation spec-
* To whom correspondence should be addressed. E-mail: [email protected].
† Marquette University.‡ University of Houston.
(1) Willets, K. A.; Van Duyne, R. P. Annu. Rev. Phys. Chem. 2007, 58, 267–297.
(2) Skrabalak, S. E.; Chen, J.; Sun, Y.; Lu, X.; Au, L.; Cobley, C. M.; Xia, Y.Acc. Chem. Res. 2008, 41, 1587–1595.
(3) Sun, Y.; Xia, Y. Anal. Chem. 2002, 74, 5297–5305.(4) Westcott, S. L.; Oldenburg, S. J.; Lee, T. R.; Halas, N. J. Langmuir 1998,
14, 5396–5401.(5) Westcott, S. L.; Oldenburg, S. J.; Lee, T. R.; Halas, N. J. Chem. Phys. Lett.
1999, 300, 651–655.(6) Pham, T.; Jackson, J. B.; Halas, N. J.; Lee, T. R. Langmuir 2002, 18, 4915–
4920.(7) Klar, T.; Perner, M.; Grosse, S.; von Plessen, G.; Spirkl, W.; Feldman, J.
Phys. Rev. Lett. 1998, 80, 4249–4252.(8) Sonnichsen, C.; Franzl, T.; Wilk, T.; von Plessen, G.; Feldman, J.; Wilson,
O.; Mulvaney, P. Phys. Rev. 2002, 88, 077402.
Anal. Chem. XXXX, xxx, 000–000
10.1021/ac9007495 CCC: $40.75 XXXX American Chemical Society AAnalytical Chemistry, Vol. xxx, No. xx, Month XX, XXXX
Dow
nloa
ded
by W
ISC
ON
SIN
LIB
RA
RY
SE
RV
ICE
S on
Jul
y 29
, 200
9Pu
blis
hed
on J
uly
20, 2
009
on h
ttp://
pubs
.acs
.org
| do
i: 10
.102
1/ac
9007
495

troscopy to measure the absorption or scattering spectrum of asingle nanoparticle.7-10 However, apart from the serious technicalchallenges involved in these experiments, some techniques (e.g.,SNOM and DF techniques) are limited in their ability to resolvethe mode structure of the plasmon (e.g., of a metal nanorod ornanowire) spatially.7,8 The near-infrared (NIR) multispectral imag-ing microscope described herein offers a simple solution to thisproblem.
A multispectral imaging spectrometer is an instrument thatcan simultaneously record spectral and spatial information abouta sample.11 Unlike conventional imaging techniques, which relyon recording a single image using either single or multiwavelengthlight for illumination, the multispectral imaging technique recordsa series of several thousand images, each image at a specificwavelength. That is, it measures absorption spectra of a samplenot at a single position, as is the case for a conventionalspectrophotometer, but simultaneously at many different positionswithin a sample (by using a focal plane array detector rather thana single channel detector).11 Chemical composition and structureat different positions within a sample can be elucidated from suchimages.11 We have recently developed a novel near-infrared (NIR)multispectral imaging microscope that employs an acousto-optictunable filter (AOTF) for rapid spectral tuning and a microscopefor higher spatial resolution.12-20 The high sensitivity (single pixelresolution), fast temporal (milliseconds) and high spatial resolution(∼µm) of this imaging microscope, make it possible for us to usethis multispectral imaging microscope for studies and measure-ments that, to date, have not been possible using existingtechniques. These include photoinduced changes of a single unitmicrometer-size cell in temperature-sensitive liquid crystals as afunction of time and wavelength,16 and the determination ofmolecular state and distribution of fullerenes entrapped in sol-gelsamples.20
The information presented in the present manuscript is indeedprovocative and demonstrates that discrete gold nanoshells ∼1µm in diameter can be individually observed, and their LSPRspectra can be measured using multispectral imaging microscopy.Such considerations prompted us to initiate this study, which aimsto (1) develop novel synthetic methods to prepare novel goldnanoshells about ∼1 µm in diameter, (2) explore the use of themultispectral imaging microscope as a sensitive and effectivemethod to observe and characterize the gold nanoshells bymeasuring LSPR spectra at several different positions within asingle nanoshell, and also of many different single nanoshells ofthe same sample, and (3) determine the effect of dielectric functionof the medium by measuring LSPR spectra of single nanoshells
in different solvents, including D2O, acetonitrile-d3, acetone-d6,ethyl acetate, pyridine-d5, and formamide. The results of ourinitial investigation are reported herein.
EXPERIMENTAL SECTIONMaterials. All reagents were purchased and used as received
from the indicated suppliers: sodium hydroxide, ammoniumhydroxide (30% NH3), formaldehyde, nitric acid, hydrochloricacid (all from EM Science), tetrakis(hydroxymethyl)phospho-nium chloride (THPC, 80% in water), potassium carbonate,3-aminopropyltrimethoxysilane (APTMS; all from Aldrich),ethanol (Pharmco-Aaper), 0.80 µm silica microspheres (BangsLaboratories), D2O, acetone-d6, acetonitrile-d3, and pyridine-d5
(all from Cambridge Isotope Laboratories), and hydrogentetrachloroaurate(III) hydrate (Strem). Water was purified toa resistance of 18 MΩ (Milli-Q Reagent Water System;Millipore Corporation) and filtered through a 0.2 µm membranefilter to remove any impurities. All glassware and equipmentwere cleaned in an aqua regia solution (3:1, HCl/HNO3) andthen soaked in a saturated KOH/isopropyl alcohol base bath.
Preparation of Amine-Functionalized Silica Microspheresand Attachment of Gold Seeds. Amine-functionalized silicamicrospheres were prepared using an established proce-dure.4-6,21,22 Briefly, silica microspheres (0.1 g) were added toan ethanolic solution of ammonium hydroxide containing amino-propyltrimethoxysilane (APTMS; 2.0 mL). The solution was stirredfor 2 h and then refluxed for 1 h. The amine-functionalized silicamicrospheres were centrifuged at 2000 rpm for 1 h (RC-3BRefrigerated Centrifuge from Sorvall Instruments) and redispersedtwice in 50 mL of ethanol.
Small gold “seed” particles having diameters of 2-3 nm wereprepared using an established procedure,6,21,22 which is brieflydescribed here. To a 100 mL aqueous solution of sodiumhydroxide (1.0 mL, 0.024 g, 0.6 mmol) and THPC (24 µL ofTHPC in 2 mL of water) was quickly added an aliquot (4 mL)of 1 wt % aqueous HAuCl4 ·H2O. The mixture was stirred for30 min and then aged for 3 days in the refrigerator. Analiquot of amine-functionalized silica microspheres (0.5 mL)was then added to the aged colloidal gold solution, and themixture was allowed to react overnight to afford THPC gold-seeded silica microspheres.6,21-23
Growth of Gold Nanoshells.6,22,23 For the growth of goldnanoshells on the THPC gold-seeded silica microspheres, a basicsolution of gold salt (4 mL), which was prepared by dissolvingpotassium carbonate (0.05 g) in 200 mL of water and adding 4mL of a 1 wt % HAuCl4 ·H2O solution, was added to a 25 mLbeaker and stirred. An aliquot of purified gold-seeded silicamicrospheres (0.5 mL) was then added. After stirring themixture for 5 min, 0.05 mL of formaldehyde was added as areducing agent to form the gold shell.
As described in the preceding paragraph, the gold nanoshellswere prepared as an aqueous suspension (i.e., dispersed in H2O).To avoid complications from strong O-H absorbances, thewater was exchanged to D2O. This exchange was accomplishedby centrifuging 1 mL of the H2O solution of nanoshells at 2000
(9) N’Gom, M.; Ringnalda, J.; Mansfield, J. F.; Agarwal, A.; Kotov, N.; Zaluzec,N. J.; Norris, T. B. Nano Lett. 2008, 8, 3200–3204.
(10) Muskens, O. L.; Bachelier, G.; Fatti, N. D.; Vallee, F.; Brioude, A.; Jiang,X.; Pileni, M. P. J. Phys. Chem. C 2008, 112, 8917–8921.
(11) Morris, M. D. Microscopic and Spectroscopic Imaging of the Chemical State;Marcel Dekker: New York, 1993.
(12) Tran, C. D.; Cui, Y.; Smirnov, S. Anal. Chem. 1998, 70, 4701–4708.(13) Fischer, M.; Tran, C. D. Anal. Chem. 1999, 71, 953–959.(14) Fischer, M.; Tran, C. D. Anal. Chem. 1999, 71, 2255–2261.(15) Tran, C. D. J. Near-Infrared Spectrosc. 2000, 8, 87–99.(16) Khait, O.; Smirnov, S.; Tran, C. D. Anal. Chem. 2001, 73, 732–739.(17) Tran, C. D. Fresenius J. Anal. Chem. 2001, 369, 313–319.(18) Tran, C. D. Appl. Spectrosc. Rev. 2003, 38, 133–153.(19) Tran, C. D. Anal. Lett. 2005, 38, 735–752.(20) Tran, C. D.; Grishko, V. I.; Challa, S. J. Phys. Chem. B 2008, 112, 14548–
14559.
(21) Kim, J.-H.; Chung, H.-W.; Lee, T. R. Chem. Mater. 2006, 18, 4115–4120.(22) Kim, J.-H.; Bryan, W. W.; Lee, T. R. Langmuir 2008, 24, 11147–11152.(23) Kim, J.-H.; Lee, T. R. J. Biomed. Pharm. Eng. 2008, 2, 29–35.
B Analytical Chemistry, Vol. xxx, No. xx, Month XX, XXXX
Dow
nloa
ded
by W
ISC
ON
SIN
LIB
RA
RY
SE
RV
ICE
S on
Jul
y 29
, 200
9Pu
blis
hed
on J
uly
20, 2
009
on h
ttp://
pubs
.acs
.org
| do
i: 10
.102
1/ac
9007
495
rpm for 5 min at 22 °C. The supernatant was removed, and 1mL of D2O was then added. After centrifuging the sample againat 2000 rpm for 5 min, the supernatant was removed, and thenanoshells were then redispersed in 1 mL of D2O. An analogousprocedure was used to exchange H2O to acetonitrile-d3, acetone-d6, ethyl acetate, pyridine-d5, and formamide. Prior to eachmeasurement, the sample was briefly sonicated in a water bathfor 10-15 s.
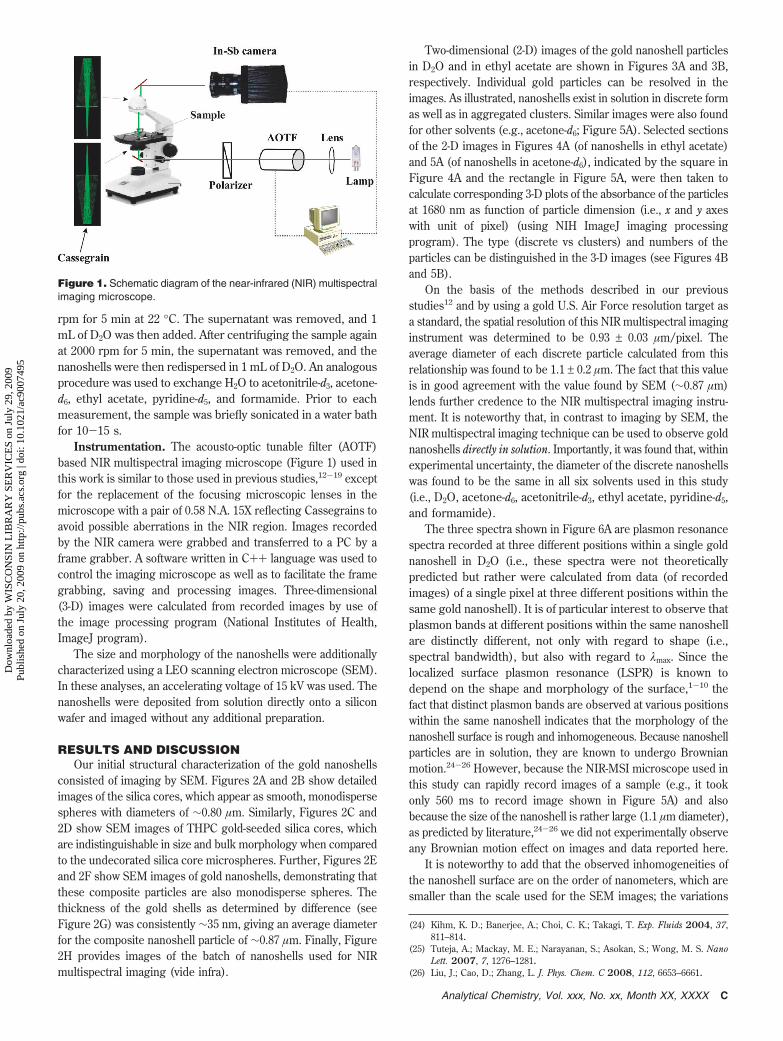
Instrumentation. The acousto-optic tunable filter (AOTF)based NIR multispectral imaging microscope (Figure 1) used inthis work is similar to those used in previous studies,12-19 exceptfor the replacement of the focusing microscopic lenses in themicroscope with a pair of 0.58 N.A. 15X reflecting Cassegrains toavoid possible aberrations in the NIR region. Images recordedby the NIR camera were grabbed and transferred to a PC by aframe grabber. A software written in C++ language was used tocontrol the imaging microscope as well as to facilitate the framegrabbing, saving and processing images. Three-dimensional(3-D) images were calculated from recorded images by use ofthe image processing program (National Institutes of Health,ImageJ program).
The size and morphology of the nanoshells were additionallycharacterized using a LEO scanning electron microscope (SEM).In these analyses, an accelerating voltage of 15 kV was used. Thenanoshells were deposited from solution directly onto a siliconwafer and imaged without any additional preparation.
RESULTS AND DISCUSSIONOur initial structural characterization of the gold nanoshells
consisted of imaging by SEM. Figures 2A and 2B show detailedimages of the silica cores, which appear as smooth, monodispersespheres with diameters of ∼0.80 µm. Similarly, Figures 2C and2D show SEM images of THPC gold-seeded silica cores, whichare indistinguishable in size and bulk morphology when comparedto the undecorated silica core microspheres. Further, Figures 2Eand 2F show SEM images of gold nanoshells, demonstrating thatthese composite particles are also monodisperse spheres. Thethickness of the gold shells as determined by difference (seeFigure 2G) was consistently ∼35 nm, giving an average diameterfor the composite nanoshell particle of ∼0.87 µm. Finally, Figure2H provides images of the batch of nanoshells used for NIRmultispectral imaging (vide infra).
Two-dimensional (2-D) images of the gold nanoshell particlesin D2O and in ethyl acetate are shown in Figures 3A and 3B,respectively. Individual gold particles can be resolved in theimages. As illustrated, nanoshells exist in solution in discrete formas well as in aggregated clusters. Similar images were also foundfor other solvents (e.g., acetone-d6; Figure 5A). Selected sectionsof the 2-D images in Figures 4A (of nanoshells in ethyl acetate)and 5A (of nanoshells in acetone-d6), indicated by the square inFigure 4A and the rectangle in Figure 5A, were then taken tocalculate corresponding 3-D plots of the absorbance of the particlesat 1680 nm as function of particle dimension (i.e., x and y axeswith unit of pixel) (using NIH ImageJ imaging processingprogram). The type (discrete vs clusters) and numbers of theparticles can be distinguished in the 3-D images (see Figures 4Band 5B).
On the basis of the methods described in our previousstudies12 and by using a gold U.S. Air Force resolution target asa standard, the spatial resolution of this NIR multispectral imaginginstrument was determined to be 0.93 ± 0.03 µm/pixel. Theaverage diameter of each discrete particle calculated from thisrelationship was found to be 1.1 ± 0.2 µm. The fact that this valueis in good agreement with the value found by SEM (∼0.87 µm)lends further credence to the NIR multispectral imaging instru-ment. It is noteworthy that, in contrast to imaging by SEM, theNIR multispectral imaging technique can be used to observe goldnanoshells directly in solution. Importantly, it was found that, withinexperimental uncertainty, the diameter of the discrete nanoshellswas found to be the same in all six solvents used in this study(i.e., D2O, acetone-d6, acetonitrile-d3, ethyl acetate, pyridine-d5,and formamide).
The three spectra shown in Figure 6A are plasmon resonancespectra recorded at three different positions within a single goldnanoshell in D2O (i.e., these spectra were not theoreticallypredicted but rather were calculated from data (of recordedimages) of a single pixel at three different positions within thesame gold nanoshell). It is of particular interest to observe thatplasmon bands at different positions within the same nanoshellare distinctly different, not only with regard to shape (i.e.,spectral bandwidth), but also with regard to λmax. Since thelocalized surface plasmon resonance (LSPR) is known todepend on the shape and morphology of the surface,1-10 thefact that distinct plasmon bands are observed at various positionswithin the same nanoshell indicates that the morphology of thenanoshell surface is rough and inhomogeneous. Because nanoshellparticles are in solution, they are known to undergo Brownianmotion.24-26 However, because the NIR-MSI microscope used inthis study can rapidly record images of a sample (e.g., it tookonly 560 ms to record image shown in Figure 5A) and alsobecause the size of the nanoshell is rather large (1.1 µm diameter),as predicted by literature,24-26 we did not experimentally observeany Brownian motion effect on images and data reported here.
It is noteworthy to add that the observed inhomogeneities ofthe nanoshell surface are on the order of nanometers, which aresmaller than the scale used for the SEM images; the variations
(24) Kihm, K. D.; Banerjee, A.; Choi, C. K.; Takagi, T. Exp. Fluids 2004, 37,811–814.
(25) Tuteja, A.; Mackay, M. E.; Narayanan, S.; Asokan, S.; Wong, M. S. NanoLett. 2007, 7, 1276–1281.
(26) Liu, J.; Cao, D.; Zhang, L. J. Phys. Chem. C 2008, 112, 6653–6661.
Figure 1. Schematic diagram of the near-infrared (NIR) multispectralimaging microscope.
CAnalytical Chemistry, Vol. xxx, No. xx, Month XX, XXXX
Dow
nloa
ded
by W
ISC
ON
SIN
LIB
RA
RY
SE
RV
ICE
S on
Jul
y 29
, 200
9Pu
blis
hed
on J
uly
20, 2
009
on h
ttp://
pubs
.acs
.org
| do
i: 10
.102
1/ac
9007
495

in surface morphology were not resolved in the SEM images. Aninvestigation that includes a side-by-side comparison of NIRmultispectral imaging with transmission electron microscopy(TEM) imaging of the surface morphology of gold nanoshells willbe the subject of a future report.
Because the size of the nanoshells (∼1.1 µm) is comparableto the spatial resolution of the NIR imaging instrument (0.93 µm),if single-pixel data are collected from the edge of a nanoshell ratherthan the center, the measurement will include not only the
absorbance of the nanoshell but also that of the solvent (note thatabsorbance by the solvent will be zero since the spectrum of thesolvent will be background-subtracted). Consequently, the calcu-lated absorbance spectrum will be an average of all of the data,with diminished peak intensities when compared to data collectedfrom the center of a nanoshell. However, we would anticipate nochanges in the position or shape of the λmax bands in theabsorbance spectra. This prediction is verified in Figure 6B,which shows three spectra calculated from one single position
Figure 2. Scanning electron microscope (SEM) images of (A,B) silica cores, (C,D) gold seeded silica cores, (E,F) complete gold nanoshells,(G) coated and uncoated gold nanoshells, and (H) analyzed gold nanoshells.
D Analytical Chemistry, Vol. xxx, No. xx, Month XX, XXXX
Dow
nloa
ded
by W
ISC
ON
SIN
LIB
RA
RY
SE
RV
ICE
S on
Jul
y 29
, 200
9Pu
blis
hed
on J
uly
20, 2
009
on h
ttp://
pubs
.acs
.org
| do
i: 10
.102
1/ac
9007
495

within a gold nanoshell in D2O. Again these spectra were notcalculated theoretically, but rather were calculated using data(of recorded images) of a single pixel (black) and the averageof a square of 3 × 3 pixels (green) and an average of a squareof 5 × 5 pixels (pink). Since only one spectrum was obtainedfor each case (single pixel, square of 3 × 3 or 5 × 5), they cannotbe correctly classified as “averaged spectra”. For example,while the spectrum obtained from a square of 3 × 3- pixel canbe considered as an averaged spectrum of 9 spectra calculatedfrom data of a single pixel not at the same single position but at9 different positions within a square of 3 × 3 pixel. As illustrated,the three spectra have the same shape and λmax. The onlydifference among them is their intensity. The fact that spectrataken from different positions (center vs edges) of a single Aunanoshell (Figure 6A) exhibit not only different intensities butalso shifts in λmax and changes in bandwidth (Figure 6A) isconsistent with variations in morphology across the surface of thenanoshell.
Interestingly, the value of λmax shifts and the width of theLSPR band narrows when a single gold nanoshell dispersedin D2O is transferred to acetonitrile-d3 (see Figure 6A vs Figure7B). Importantly, the dependency of the LSPR on the morphologyof the particle was also observed in acetonitrile-d3; namely, thespectra at three different positions within a single particle are
different (Figure 7B). Furthermore, the changes in λmax andspectral bandwidth of the LSPR are not specific to D2O andacetonitrile-d3, but are general, as they were observed for othersolvents as well, including ethyl acetate (Figure 7C), pyridine-d5 (Figure 7D), acetone-d6 (Figure 7E), and formamide (Figure7F). In fact, in formamide, the bandwidths of the LSPR bandsbecame so broad that they are about three to four times broaderthan those in ethyl acetate. For ease of comparison, the LSPRspectra of a single gold nanoshell in the six different solvents areplotted together in Figure 8.
As illustrated in Figures 6-8, the absorbance maximum forthe gold nanoshells appears roughly at 1700 nm. This value isconsistent with that calculated theoretically using Mie scatteringfor nanoshells having silica cores ∼800 nm in diameter and goldshell thicknesses of ∼35 nm.27,28 Furthermore, to our knowledge,the experimental results presented here offer the first directmeasurement of the LSPR of single gold nanoshells in solution.This type of measurement is not possible using conventional NIRspectrophotometers because in spectrophotometric measure-ments, the signal from the entire solution of many particles isdetected as an averaged signal by the single-channel detector.We were able to perform such measurements because our NIRmultispectral imaging microscope enables us to focus on and
(27) Mie, G. Ann. Phys. 1908, 25, 377–445.(28) Aden, A. L.; Kerker, M. J. Appl. Phys. 1951, 22, 1242–1246.
Figure 3. 2-D images at 1680 nm of gold nanoshells in D2O solution(A) and ethyl acetate solution (B). Nanoshell particles are in blue,green is background and the black line in the upper left-hand corneris a marking of the NIR camera.
Figure 4. (A) 2-D image of absorption at 1680 nm of gold nanoshellsin ethyl acetate solution; and (B) corresponding 3-D absorption imageof the drawn rectangular section in (A). Units for x, y, and z axes arepixel, pixel, and absorbance at 1680 nm, respectively (one pixelcorresponds to 0.93 µm).
EAnalytical Chemistry, Vol. xxx, No. xx, Month XX, XXXX
Dow
nloa
ded
by W
ISC
ON
SIN
LIB
RA
RY
SE
RV
ICE
S on
Jul
y 29
, 200
9Pu
blis
hed
on J
uly
20, 2
009
on h
ttp://
pubs
.acs
.org
| do
i: 10
.102
1/ac
9007
495

observe directly the NIR absorbance of a single individualnanoshell rather than the collective absorbance of multiplenanoshells in solution.
It has been theoretically predicted and experimentally verifiedthat for relatively small gold nanoparticles and nanoshells, thevariation of the maxima of the LSPR with the refractive index ofthe solvent can be treated within the framework of the Drudemodel.1,29,30 Specifically, the surface plasmon peak position, λ, isrelated to the refractive index of the surrounding medium (nm)by the relation
λ2 ) λp2(ε∞ + 2εm) (1)
where λp is the bulk metal plasmon wavelength, ε∞ is the highfrequency dielectric constant due to interband and coretransitions, and εm () n2) is the optical dielectric function ofthe medium. According to this equation, a plot of λ2 against2εm (or 2n2) should yield a straight line. Notably, we/othershave previously observed this correlation for nanoparticles andnanoshells that exhibit narrow LSPR bands.1-10 However, itwould be difficult to apply this equation without any modificationto particles that exhibit relatively broad plasmon resonance bands,
such as those in this study. When the LSPR bands are narrow,shifts in λmax can be easily and accurately determined. However,as illustrated in Figures 6 and 7, the absorbance bands of ourgold nanoshells are relatively broad. For example, values of thefull width at half-maximum (fwhm) of the LSPR bands of theparticles in formamide are as large as 300 nm. Such wide shiftsof the plasmon bands are difficult to predict accurately. As aconsequence, it has been proposed that for broad LSPR bands, itis more appropriate to consider a ratio of λmax and fwhm (i.e.,λmax/fwhm) rather than the λmax value alone.31,32
Correspondingly, Figure 9 shows plots of (λmax/fwhm)2 forsingle gold nanoshells as a function of 2n2 (or 2ε) in six differentsolvents. A linear relationship was found for only three solvents:D2O, acetonitrile-d3, and ethyl acetate. Acetone-d6 shows a slightdeviation, whereas formamide and pyridine-d5 exhibit distinctlydifferent correlations. Specifically, formamide and pyridine-d5
have 2n2 values of 4.21 and 4.56, respectively, which are muchhigher than those of D2O, acetonitrile, acetone, and ethylacetate, but their (λmax/fwhm)2 values are considerably lowerthan those of these four solvents. At present, we have no clear
(29) Mulvaney, P. Langmuir 1996, 12, 788–800.(30) Shosh, K. S.; Nath, S.; Kundu, S.; Esumi, K.; Pal, T. J. Phys. Chem. B 2004,
108, 13963–13971.
(31) Miller, M. M.; Lazarides, A. A. Abstract of Papers, 231st ACS NationalMeeting, Atlanta, GA, 2006.
(32) Miller, M. M.; Lazarides, A. A. J. Phys. Chem. B 2005, 109, 21556–21565.
Figure 5. (A) 2-D image of absorption a t 1680 nm of gold nanoshellsin acetone-d6 solution; and (B) corresponding 3-D absorption imageof the drawn square section in (A). Units for x, y, and z axes arepixel, pixel, and absorbance at 1680 nm, respectively (one pixelcorresponds to 0.93 µm).
Figure 6. Absorption spectra of a single gold nanoshell in D2O,calculated (A) from a single pixel at three different positions withinthe nanoshell and (B) calculated using data from a single pixel (black),an average of a square of 3 × 3 (green) and 5 × 5 (pink) pixel at thesame position.
F Analytical Chemistry, Vol. xxx, No. xx, Month XX, XXXX
Dow
nloa
ded
by W
ISC
ON
SIN
LIB
RA
RY
SE
RV
ICE
S on
Jul
y 29
, 200
9Pu
blis
hed
on J
uly
20, 2
009
on h
ttp://
pubs
.acs
.org
| do
i: 10
.102
1/ac
9007
495

rationalization for this deviation, but it is probably due to thenature of the solvents and their capacity to interact with andperhaps bind to the surface of the nanoshell. This effectobscures the expected correlation between the refractive indexof the solvent and the features of the LSPR bands. However, itis noteworthy to add that the non-linearity seen here is notnew as it has been previously observed by many groups forLSPR characterization of particles in response to solvent as wellas in adsorbates.33-36
In summary, we have successfully demonstrated for the firsttime that the NIR-MSI microscope can be successfully used toobserve and measure directly the LSPR spectra of individual goldnanoshells. By directly measuring surface plasmon spectra ofindividual nanoshells, any features in the LSPR spectra that arisefrom the polydispersity of the nanoshells, or from variations intheir aspect ratio, shape, and/or volume can be understood andinterpreted. As expected, the LSPR of individual nanoshellsmeasured by the NIR-MSI microscope agree well with the spectracalculated theoretically using Mie scattering for the nanoshellsin this study (i.e., nanoshells with silica cores ∼800 nm in diameterand gold shell thicknesses of ∼35 nm).24,25 Additionally, the NIR-MSI microscope also enables measurement of LSPR at different
(33) Thomas, K. G.; Zajicek, J.; Kamat, P. V. Langmuir 2002, 18, 3722–3727.(34) Ghosh, S. K.; Nath, S.; Kundu, S.; Esumi, K.; Pal, T. J. Phys. Chem. B 2004,
108, 13963–13971.(35) Ghosh, S. K.; Nath, S.; Kundu, S.; Esumi, K.; Pal, T. Appl. Spectrosc. 2005,
59, 844–847.(36) Sanghamitra, N. J. M.; Mazumdar, S. Langmuir 2008, 24, 3439–3445.
Figure 7. Absorption spectra at three different positions within the same single gold nanoshell in different solvents: (A) D2O; (B) acetonitrile-d3;(C) ethyl acetate; (D) pyridine-d5; (E) acetone-d6; and (F) formamide.
Figure 8. Absorption spectra of a single gold nanoshell in differentsolvents. Black: formamide; red: D2O; green: pyridine-d5; blue:acetone-d6; neon green: acetonitrile-d3and pink: ethyl acetate. Forclarity the spectra were shifted vertically.
Figure 9. Plot of the square of the ratio of absorption maximum tofull-width at half-maximum as a function of 2n2. Red square: D2O;neon green circle: acetonitrile-d3; blue triangle: acetone-d6; pinktriangle: ethyl acetate; black diamond: formamide; and green triangle:pyridine-d5.
GAnalytical Chemistry, Vol. xxx, No. xx, Month XX, XXXX
Dow
nloa
ded
by W
ISC
ON
SIN
LIB
RA
RY
SE
RV
ICE
S on
Jul
y 29
, 200
9Pu
blis
hed
on J
uly
20, 2
009
on h
ttp://
pubs
.acs
.org
| do
i: 10
.102
1/ac
9007
495

positions within a single nanoshell. This feature can be effectivelyused to characterize and to gain insight into the properties of thenanoshells. For example, we found that the LSPR spectra aredistinct at various positions within a single nanoshell. Since LSPRspectra are known to depend on the shape and morphology ofthe nanoshells, these observations seem to suggest that thenanoshells are not smooth and well-defined spheres as indicatedon the scale of the SEM technique, but are rather rough andinhomogeneous (i.e., the shape and morphology vary within asingle nanoshell).
Finally, the LSPR spectra of single nanoshells were found todepend on the dielectric constant of the medium. However, therelationship was determined to be more complex than simplyfollowing the Drude equation. Specifically, when (λmax/fwhm)2
values of LSPR for single gold nanoshells were plotted as afunction of 2n2 (or 2ε) for nanoshells in six different solvents,it was found that only three solvents exhibited a linearrelationship: D2O, acetonitrile-d3, and ethyl acetate. Acetone-d6 showed a slight deviation, whereas formamide and pyridine-
d5 exhibited distinctly different correlations. At present, we haveno clear rationalization for this deviation, but it is possiblylinked to the nature of the solvents and their capacity to interactwith and perhaps bind to the surface of the nanoshells. Thiseffect obscures the expected correlation between the refractiveindex of the solvent and the features of the LSPR bands.Experiments are now in progress to determine the origin ofthis deviation, and to use the NIR-MSI microscope to charac-terize other types of nanoparticles, including nanorods andnanocages.
ACKNOWLEDGMENTThe National Science Foundation (ECS-0404308), the Texas
Center for Superconductivity, and the Robert A. Welch Foundation(Grant E-1320) provided generous support for the work at theUniversity of Houston.
Received for review April 7, 2009. Accepted July 3, 2009.
AC9007495
H Analytical Chemistry, Vol. xxx, No. xx, Month XX, XXXX
Dow
nloa
ded
by W
ISC
ON
SIN
LIB
RA
RY
SE
RV
ICE
S on
Jul
y 29
, 200
9Pu
blis
hed
on J
uly
20, 2
009
on h
ttp://
pubs
.acs
.org
| do
i: 10
.102
1/ac
9007
495