
Visualizing the Landscape of Old-Time Tokyo · VISUALIZING THE LANDSCAPE OF OLD-TIME TOKYO ... maps...
8
VISUALIZING THE LANDSCAPE OF OLD-TIME TOKYO (EDO CITY) T. Fuse * and E. Shimizu Department of Civil Engineering, University of Tokyo, Hongo 7-3-1, Bunkyo-ku, Tokyo, 113-8656, Japan - (fuse, shimizu)@civil.t.u-tokyo.ac.jp Commission V, WG V/6 KEY WORDS: Historical maps, GIS, Geometric Correction, Visualization, Landscape ABSTRACT: Historical maps are precious materials, which show various spatial distribution of land use, streets and so on of the historical importance at the time the maps were produced. They may be a dependable source of information regarding concepts of city planning of the past. In analysis of historical maps, the most practical method is to compare them with the present ones, for instance, by overlaying them. However, the low precision, in the geometrical sense, of the historical maps makes the task of comparison very difficult. It is important to point out here that research on rubber sheeting, that is, geometric correction of maps for conflation of maps from different sources has recently made much progress. Using these procedures, geometric correction of historical maps should become possible. We address applied research on such an incorporation of historical maps into GIS. We performed rubber- sheeting of some historical maps to present map coordinate system in Japan by using the piecewise geometric transformation based on TIN and planar affine transformation. We can produce the bird's-eye view of old city by relating historical maps with the digital elevation model. Our ultimate goal is to reproduce landscape in old city from any viewpoint and any direction and to explore the past concepts of city planning and urban developments. Age-old historical maps, as well as present maps and geo-information, can be important elements of GIS if they are geometrically corrected to the present coordinate system. 1. INTRODUCTION Historical maps are precious materials, which show various spatial distribution of land use, streets and so on of the historical importance at the time the maps were produced. They may be a dependable source of information regarding concepts of city planning of the past. In analysis of historical maps, the most practical method is to compare them with the present ones, for instance, by overlaying them. However, the low precision, in the geometrical sense, of the historical maps makes the task of comparison very difficult. So far, overlaying historical maps on present maps has been done basically by hand (Kodama, et al., 1994). Such a method, however, has following drawbacks: (a) the work is not efficient; (b) original information on historical maps is lacking; (c) the method is not sometimes objective. It is important to point out here that research on rubber sheeting, that is, geometric correction of maps for conflation of maps from different sources has recently made much progress. Using these procedures, geometric correction of historical maps should become possible. It will make easy comparing and overlaying multiple maps from different time periods. Furthermore, it will give map-scales to the historical maps, which are not in general represented on the old maps, and if we allow ourselves to ignore the changes in terrain, it will make possible overlaying of contour lines on the historical maps. As a result, we can bring the points of view of quantitative consideration and three-dimensional visualization into analysis of historical map. The value of historical maps as historical materials will much increase. We have addressed applied research on such an incorporation of historical maps into GIS. We performed rubber-sheeting of some maps produced in Edo and Meiji period to present map coordinate system in Japan by using the piecewise geometric transformation based on Triangulated Irregular Network (TIN) and planar affine transformation. (The Edo period ran between 1603 and 1868, and Meiji period between 1868 and 1912. Edo was also the old name of Tokyo.) Since then, we have carried out applications, e.g., overlaying different maps from Edo period to the present, quantitative analyses of land use, and visualization of landscape of Edo. This paper shows the rubber- sheeting procedure and some examples which make use of historical maps. 2. RUBBER-SHEET TRANSFORMATION OF HISTORICAL MAPS The piecewise rubber sheeting based on TIN and planar affine transformation (White and Griffin, 1985; Saalfeld, 1985) has been very popular as a possible and effective map conflation technique (Doytsher, 2000). We applied this technique to the rubber sheeting of historical maps (Fuse, et al., 1998; Shimizu, et al., 1999; Shimizu and Fuse, 2003). More recently its implementations have been reported by Niederoest (2002) and Balletti (2000). The rubber sheeting process we used is as follows (Figure 1). 1. Identify control points on a historical map and a present one. The point geo-features which would have not moved from past to present are set as the control points, for instance, temples, shrines, parts of castles and so on. 2. Form a TIN over all the control points on the historical map and on the present one respectively. Check whether or not the relationship between both TINs is homeomorphic. If not, reform one or the other TIN by hand. With this, triangle pairs are created. 3. Perform a planar affine transformation for each triangle pair.
Transcript of Visualizing the Landscape of Old-Time Tokyo · VISUALIZING THE LANDSCAPE OF OLD-TIME TOKYO ... maps...
VISUALIZING THE LANDSCAPE OF OLD-TIME TOKYO (EDO CITY)
T. Fuse * and E. Shimizu
Department of Civil Engineering, University of Tokyo, Hongo 7-3-1, Bunkyo-ku, Tokyo, 113-8656, Japan - (fuse, shimizu)@civil.t.u-tokyo.ac.jp
Commission V, WG V/6
KEY WORDS: Historical maps, GIS, Geometric Correction, Visualization, Landscape ABSTRACT: Historical maps are precious materials, which show various spatial distribution of land use, streets and so on of the historical importance at the time the maps were produced. They may be a dependable source of information regarding concepts of city planning of the past. In analysis of historical maps, the most practical method is to compare them with the present ones, for instance, by overlaying them. However, the low precision, in the geometrical sense, of the historical maps makes the task of comparison very difficult. It is important to point out here that research on rubber sheeting, that is, geometric correction of maps for conflation of maps from different sources has recently made much progress. Using these procedures, geometric correction of historical maps should become possible. We address applied research on such an incorporation of historical maps into GIS. We performed rubber-sheeting of some historical maps to present map coordinate system in Japan by using the piecewise geometric transformation based on TIN and planar affine transformation. We can produce the bird's-eye view of old city by relating historical maps with the digital elevation model. Our ultimate goal is to reproduce landscape in old city from any viewpoint and any direction and to explore the past concepts of city planning and urban developments. Age-old historical maps, as well as present maps and geo-information, can be important elements of GIS if they are geometrically corrected to the present coordinate system.
1. INTRODUCTION
Historical maps are precious materials, which show various spatial distribution of land use, streets and so on of the historical importance at the time the maps were produced. They may be a dependable source of information regarding concepts of city planning of the past. In analysis of historical maps, the most practical method is to compare them with the present ones, for instance, by overlaying them. However, the low precision, in the geometrical sense, of the historical maps makes the task of comparison very difficult. So far, overlaying historical maps on present maps has been done basically by hand (Kodama, et al., 1994). Such a method, however, has following drawbacks: (a) the work is not efficient; (b) original information on historical maps is lacking; (c) the method is not sometimes objective. It is important to point out here that research on rubber sheeting, that is, geometric correction of maps for conflation of maps from different sources has recently made much progress. Using these procedures, geometric correction of historical maps should become possible. It will make easy comparing and overlaying multiple maps from different time periods. Furthermore, it will give map-scales to the historical maps, which are not in general represented on the old maps, and if we allow ourselves to ignore the changes in terrain, it will make possible overlaying of contour lines on the historical maps. As a result, we can bring the points of view of quantitative consideration and three-dimensional visualization into analysis of historical map. The value of historical maps as historical materials will much increase. We have addressed applied research on such an incorporation of historical maps into GIS. We performed rubber-sheeting of some maps produced in Edo and Meiji period to present map
coordinate system in Japan by using the piecewise geometric transformation based on Triangulated Irregular Network (TIN) and planar affine transformation. (The Edo period ran between 1603 and 1868, and Meiji period between 1868 and 1912. Edo was also the old name of Tokyo.) Since then, we have carried out applications, e.g., overlaying different maps from Edo period to the present, quantitative analyses of land use, and visualization of landscape of Edo. This paper shows the rubber-sheeting procedure and some examples which make use of historical maps.
2. RUBBER-SHEET TRANSFORMATION OF HISTORICAL MAPS
The piecewise rubber sheeting based on TIN and planar affine transformation (White and Griffin, 1985; Saalfeld, 1985) has been very popular as a possible and effective map conflation technique (Doytsher, 2000). We applied this technique to the rubber sheeting of historical maps (Fuse, et al., 1998; Shimizu, et al., 1999; Shimizu and Fuse, 2003). More recently its implementations have been reported by Niederoest (2002) and Balletti (2000). The rubber sheeting process we used is as follows (Figure 1). 1. Identify control points on a historical map and a present one.
The point geo-features which would have not moved from past to present are set as the control points, for instance, temples, shrines, parts of castles and so on.
2. Form a TIN over all the control points on the historical map and on the present one respectively. Check whether or not the relationship between both TINs is homeomorphic. If not, reform one or the other TIN by hand. With this, triangle pairs are created.
3. Perform a planar affine transformation for each triangle pair.

Figure 1. Piecewise rubber sheeting based on TIN and affine transformation
(a) original image (b) Affine transformation (c) Fifth-order polynomial transformation
Figure 2. Piecewise linear and non-linear transformation The advantages of this method are summarized as follows. 1. The topological relationship between features on the
historical map is maintained. This property is the most important one for the geometric correction of a map.
2. All control points are honoured, that is, the control points on the historical map perfectly coincide with those of the present one. This property is important for easy comparison between the historical map and the present one.
Historical maps are not precise in the geometrical sense. To be more correct, historical maps are imprecise in the sense of relative positions of features. However, the straightness of objects such as road and moats may have been mapped with a fair degree of accuracy. If that is true, it is desirable to keep straightness of objects on the rubber sheeting of historical maps. The affine transformation keeps linearity, and hence, straightness of streets and moats in a triangle is maintained. However linear objects across adjacent triangles may be bent. Figure 2 shows Tameike in Minato ward, Tokyo. A TIN was produced like in the Figure 2 (a). Figure 2 (b) shows the example that the street that would have been straight in Edo period undergoes bending. When we want to maintain straightness of a street, we need to specify the ends of the street as control points. However to specify the ends of all streets as control points is not feasible. The piecewise linear rubber sheeting method cannot avoid this problem. By the way, the piecewise nonlinear rubber sheeting algorithm has been suggested by Akima (1970, 1978). Instead of the affine transformation, this method employs the fifth order polynomial transformation with conditions such as continuity and smoothness of adjacent piecewise transformations. This method can avoid the sharp bending like a dogleg. However the linear features on the historical map are in general extremely distorted as shown in Figure 2 (c). We did not adopt this method because this characteristic is considered to be crucial in the sense that rubber sheeting extremely destroys primary or original information of a historical map.
3. APPLICATIONS
3.1 Comparison of Maps from Different Times
We performed rubber sheeting of the following maps from different times to the plane rectangular coordinate system of Tokyo. (a) Genroku-Edo-Zu map (1693, Edo period) (b) Tenpou-Edo-Zu map (1843, Edo period) (c) The original Tokyo 1:5,000 scale Survey Maps (1888, Meiji
period after Edo period) (d) Jissoku-Tokyo-Zu map (1892, Meiji period) (e) 1:10,000 topographic map (1909, Meiji period) (f) 1:10,000 topographic map (1930, Showa period after Meiji
period) (g) 1:10,000 topographic map (1955, Showa period) Figure 3 shows the results together with some of the Tokyo GIS data at the areas surrounding Tameike in Minato ward, Tokyo. Japanese word Tameike means ‘reservoir’ in English. Actually, there was large natural reservoir around there in Edo period as shown in Figure 3 (a) and (b). Tameike was filled in, around 1880. The maps from different times show us visually the history of urban developments. 3.2 Reproduction of Digital Elevation Model from a
Historical Map
There are no contour lines on the age-old maps produced in Edo period in Japan. The technique to represent landforms with contours was introduced into Japan in the early 1870s (after Edo period). The original Tokyo 1:5,000 scale Survey Maps produce by the Home Ministry (1888) is the oldest map, on which contour lines were drawn. In the map, there are two-meter-interval contour lines and point data of elevation. We digitized the contour lines and the point data, and then generated Digital Elevation Model (DEM) in those days. Figure 4 shows the DEM with five meter grid size.

(a) Genroku-Edo-Zu map (1693) (b) Tenpou-Edo-Zu map (1843) (c) The original Tokyo 1:5,000 scale Survey Maps (1888)
(d) Jissoku-Tokyo-Zu map (1892) (e) 1:10,000 topographic map (1909) (f) 1:10,000 topographic map (1930)
(g) 1:10,000 topographic map (1955) (d) Tokyo GIS data (1996)
Figure 3. Historical maps from different times

■ 0- 1m
■ 1- 5m
■ 5- 10m
■10-15m
■15-20m
■20-25m
■25-30m
■30-35m
■35-40m
Figure 4. DEM of Tokyo in 1888
Figure 5: Overlay of contours on historical map.
3.3 Analysis of Relationship between Land Use and
Topography
We overlaid the DEM on the historical maps for analyzing relationship between land use and topography. As an example, Figure 5 shows the geometrically corrected Man’en-Edo-Zu map (1860), overlaid with five-meter-interval contour lines. This area is Otowa in Bunkyo ward, Tokyo. With such an implementation, we can consider the relationship between land use and topography in Edo period. For instance, we can see that Edo government would have developed major streets by making use of gentle slope along the ridge line and drainage line. Also, Figure 5 shows that daimyos (feudal lords) had their residences, which were large land lots in the north of Kanda-gawa river, at good environmental slope which faces south. We can read seven types of land use from Man’en-Edo-Zu map; (1) daimyo (feudal lords), (2) hatamoto (direct retainers of the Shogun), (3) kumi (firemen), (4) chonin (commoners such as retailers and artisans), (5) temples and shrines, (6) streets, and (7) rivers. Figure 6 shows land use map of the same area as Figure 5 in 1860, which was produced by hand digitizing of lot boundaries.
Figure 6. Land use map in 1860
Using this data, quantitative analysis of relationships between land use and elevation becomes much easier. Over the whole Bunkyo ward we computed area ratio by elevation for each land use (Figure 7). We thought that higher rank people’s residences such as daimyo and hatamoto were located on higher land than
those of the lower rank people such as kumi and chonin. However, as far as Bunkyo ward is concerned, the remarkable difference was not found.
Figure 7. Land use area ratio by elevation
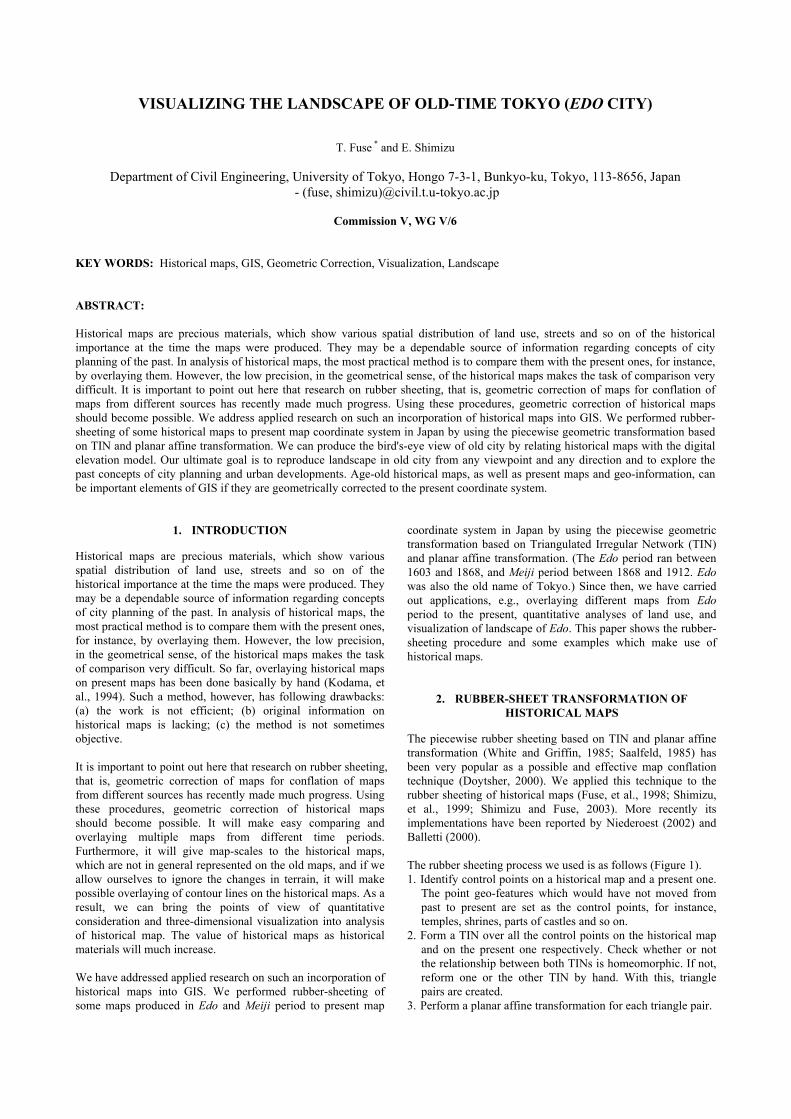
3.4 Reproduction of Bird’s-Eye View of Old Tokyo
We can produce the bird’s-eye view of old Tokyo by relating historical maps with the DEM. Figure 8 shows such an example; the bird’s-eye view of Edo using Tenpou-Edo-Zu map (1843). At the end of Edo period, Edo city was a huge, sprawling city with over one million inhabitants. We can get a feeling of the extensiveness and variety of land terrain of Edo city. The area which is spread between the Edo castle and Edo bay was reclaimed at the beginning of Edo period. We can see some canals in the plain spread in the right side of the figure, which were developed for shipping and reclamation of water front.
Figure 8. Bird’s-eye view of Edo city (1843)
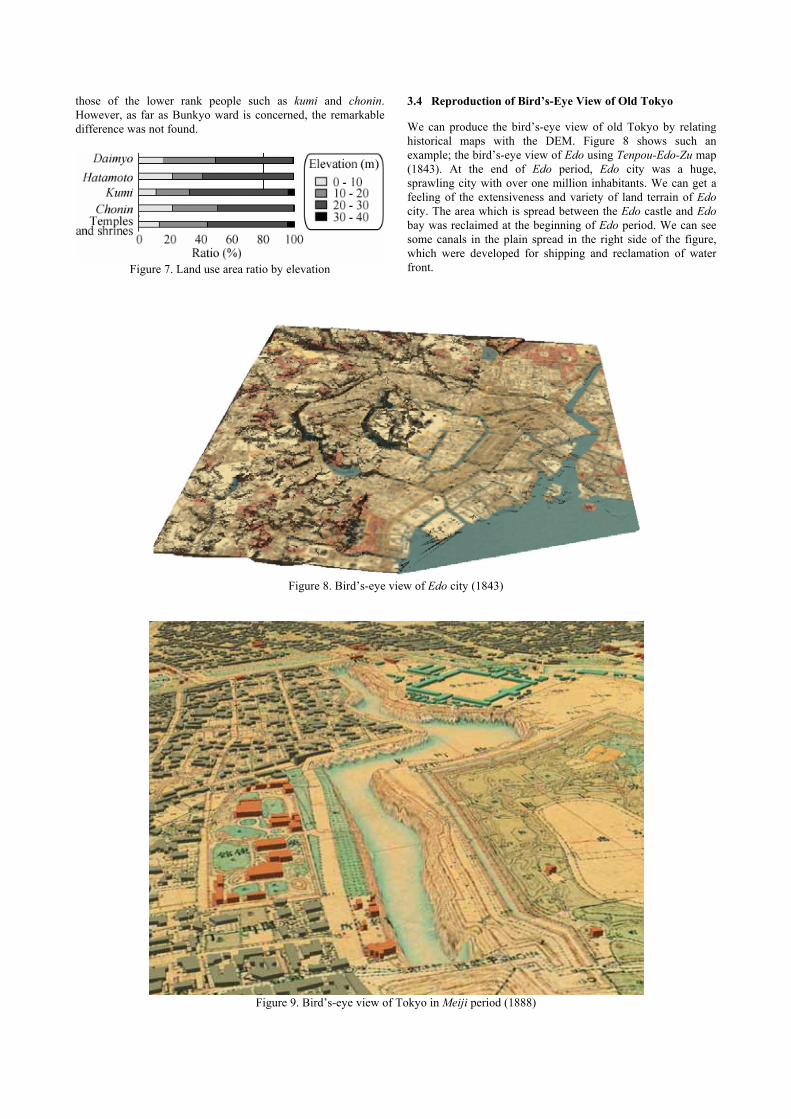
Figure 9. Bird’s-eye view of Tokyo in Meiji period (1888)

Figure 9 also shows an example; the bird’s-eye view of Tokyo in Meiji period using the original Tokyo 1:5,000 scale Survey Maps (1888). Each building is depicted with their shade in the map. Accordingly, the map is more suitable for fly-through animation of old Tokyo. In the figure, buildings are represented simple 3D models. 3.5 Reproduction of Landscape of Edo City
Since we can treat terrain data with historical maps and we can read land use from the historical maps, if we prepare CG contents corresponding to each land use, we can roughly visualize the landscape of Edo from any viewpoints. In addition, we can involve the distant view of mountains by integrating DEM data that are prepared in the extensive area including the area covered by the historical map. The 50-meter DEM data, which was produced by the Geographical Survey Institute, are available all over the country in Japan. Ukiyo-e (Japanese wood block print) artists created a lot of prints of landscapes of Edo. Among them, Ando Hiroshige (1797-1858), also known as Utagawa Hiroshige, is one of the most famous landscape artists. Hiroshige's work, along with Katsushika Hokusai’s, greatly influenced Western art. We attempted to reproduce the landscape depicted by Hiroshige’s
prints. Figure 10 (a) shows his famous print titled Nihonbashi-Yukibare (Nihonbashi, Clearing After Snow) from his series called Edo Meisho Hyakkei (One Hundred Famous Views of Edo). Nihonbashi (‘Japan bridge’ in English) area was the center of Edo. The fish market was located there, along with storehouses, and it was a great symbol of plenty and wealth for the Edo Shogunate. Figure 10 (b) shows the reproduction of landscape depicted by Nihonbashi-Yukibare. We can imagine that Hiroshige would have deformed the composition (relativepositions) of Nihonbashi, Edo castle and Mt. Fuji surely in order to include these three famous views in/from Edo in a sheet print. Our ultimate goal is to reproduce landscape in Edo from any viewpoint and any direction and to explore the past concepts of city planning and urban developments, which we may have forgotten in the developments of Tokyo placing too much emphasis on economic efficiency. Figure 11 shows a view from Edobashi (Edo bridge) toward Nihonbashi. This view was not depicted by any Ukiyo-e. It is say that the Tokyo Bay was also famous view from Edo. But we cannot find an Ukiyo-e which depicted the view. Figure 12 shows a townscape and a view of the Tokyo Bay from current Kasumigaseki, the center of government. Needless to say, we cannot now have a view of Mt. Fuji and Tokyo Bay.
(a) Nihonbashi-Yukibare (b) Reproduction of landscape
(c) Tenpou-Edo-Zu map (1843) (d) Current situation
Figure 10. Reproduction of landscape depicted by Hiroshige’s Ukiyo-e
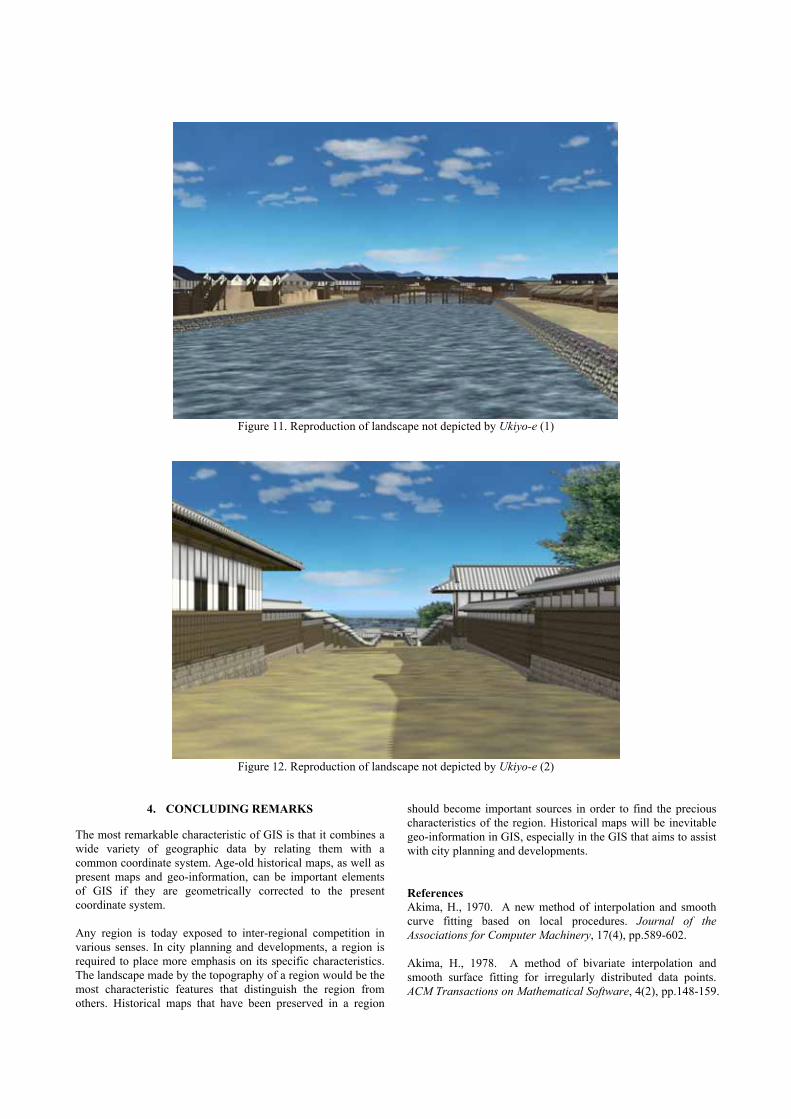
Figure 11. Reproduction of landscape not depicted by Ukiyo-e (1)
Figure 12. Reproduction of landscape not depicted by Ukiyo-e (2)
4. CONCLUDING REMARKS
The most remarkable characteristic of GIS is that it combines a wide variety of geographic data by relating them with a common coordinate system. Age-old historical maps, as well as present maps and geo-information, can be important elements of GIS if they are geometrically corrected to the present coordinate system. Any region is today exposed to inter-regional competition in various senses. In city planning and developments, a region is required to place more emphasis on its specific characteristics. The landscape made by the topography of a region would be the most characteristic features that distinguish the region from others. Historical maps that have been preserved in a region
should become important sources in order to find the precious characteristics of the region. Historical maps will be inevitable geo-information in GIS, especially in the GIS that aims to assist with city planning and developments. References Akima, H., 1970. A new method of interpolation and smooth curve fitting based on local procedures. Journal of the Associations for Computer Machinery, 17(4), pp.589-602. Akima, H., 1978. A method of bivariate interpolation and smooth surface fitting for irregularly distributed data points. ACM Transactions on Mathematical Software, 4(2), pp.148-159.

Balletti, C., 2000. Analytical and quantitative methods for the analysis of the geometrical content of historical cartography. International Archives of Photogrammetry and Remote Sensing, 33(B5), pp.30-37. Doytsher, Y., 2000. A rubber sheeting algorithm for non-rectangular maps. Computers & Geosciences, 26, pp.1001-1010. Fuse, T., Shimizu, E. and Morichi, S., 1998. A study on geometric correction of historical maps. International Archives of Photogrammetry and Remote Sensing, 32(5), pp.543-548. Kodama, K., Yoshihara, K., Tawara, M. and Nakagawa, K., 1994. The Map with Information in Edo Period, Asahi Newspaper: Tokyo. (in Japanese) Niederoest, J., 2002. Landscape as a historical object: 3D reconstruction and evaluation of a relief model from the 18th century. International Archives of Photogrammetry, Remote Sensing and Spatial Information Sciences, 34(5/W3), CD-ROM.
Saalfeld, A., 1985. A fast rubber-sheeting transformation using simplical coordinates. The American Cartographer, 12(2), pp.169-173. Shimizu, E., Fuse, T., and Shirai, K., 1999. Development of GIS integrated historical map analysis system. International Archives of Photogrammetry and Remote Sensing, 32(5-3W12), pp.79-84. Shimizu, E. and Fuse, T., 2003. Rubber-sheeting of historical maps in GIS and its application to landscape visualization of old-time cities: focusing on Tokyo of the past. Proceedings of the 8th International Conference on Computers in Urban Planning and Urban Management, 11A-3, CD-ROM. White, M.S. and Griffin, P., 1985. Piecewise linear rubber-sheet map transformations. The American Cartographer, 12(2), pp.123-131.