Visualizing Self- and Peer-assessment Data by a Self ... · PDF fileVisualizing Self- and...
10
International Journal of Computer Information Systems and Industrial Management Applications. ISSN 2150-7988 Volume 8 (2016) pp. 023–032 c MIR Labs, www.mirlabs.net/ijcisim/index.html Visualizing Self- and Peer-assessment Data by a Self-organizing Map for Inducing Awareness in Learners Yuta Ueki and Kei Ohnishi Graduate School of Computer Science and System Engineering, Kyushu Institute of Technology, 680-4 Kawazu, Iizuka, Fukuoka 820-8502, Japan [email protected], [email protected] Abstract: Self- and peer-assessments among learners are pre- sumed to motivate learners to increase their learning and intro- spection. The basis behind this effect is the awareness resulting from differences between a self-assessment result and the as- sessment results from others. Therefore, to enable learners to benefit from self- and peer-assessments, we need to easily visu- alize results that make them aware of some factor that could improve their learning ability. In this study, we designed a sys- tem to visualize self- and peer-assessment data, which are many and multi-dimensional data, in such a way that we can easily grasp an overview at first glance. We then developed an actu- al system using a self-organizing map (SOM) as a method for visualizing self- and peer-assessment data. In a comparison of the visualization method in our developed system, SOM, and a conventional method, a radar chart, we showed the usefulness of our visualization method, SOM, through a subjective evalua- tion test and a statistical hypothesis test. In addition, we carried out an experiment in which people wrote reports, then conduct- ed self- and peer-assessments of what they wrote by using the developed system. The experimental results showed that the vi- sualization of self- and peer-assessment data enabled people to become aware of some factor that helped them to improve their reports. Keywords: self-assessment, peer assessment, self-organizing map, visualization, awareness I. Introduction In the educational research field, studies on self-assessment [1] and peer-assessment [2] among learners in higher educa- tion have been attracting interest. Some studies investigate only self-assessment [3] or only peer-assessment [4][5], and some investigate both types [6][7][8][9][10]. Although the roles of self- and peer-assessments in higher education are different, they are considered to motivate learners to enhance learning and introspection. One of the reasons for the in- creased attention to self- and peer-assessments is the change in the learning perspective. That is, the traditional notion that teachers disseminate knowledge to learners is changing to the notion that learners construct knowledge through their social interactions. Self- and peer-assessment behaviors are just social interactions utilized in the process of constructing knowledge. In higher education, the simultaneous application of self- assessment and peer-assessment enhances learning and in- trospection of learners, as mentioned above. The basis be- hind this effect is awareness of the differences between self- and peer-assessment results. Therefore, to verify the learn- ing effects, it is necessary to show the results of self- and peer-assessments in a comprehensible way to the learners. In this study, we designed a system for visualizing many and multi-dimensional data of self- and peer-assessments in a way that learners can intuitively grasp the outline of the data. In addition, as an example of the designed sys- tem, we developed an actual system for visualizing self- and peer-assessment data on the “Fundamental Competen- cies for Working Persons” defined by the Ministry of Econo- my, Trade and Industry in Japan [11]. These competencies are the basic abilities required for various people to work together in the workplace and in local communities. Fur- thermore, we evaluated a method to visualize self- and peer- assessment data by conducting subjective evaluation tests for comparison with the conventional visualization method, which is a radar chart. In addition, we carried out an experi- ment in which people wrote reports, then conducted self- and peer-assessments of what they wrote by using the developed system. In the system developed in this study, we first map many and multi-dimensional self- and peer-assessment data to a two- dimensional space by a self-organizing map (SOM) [12] and draw the mapped data for visualization. SOM is a method for nonlinear data mapping from a high-dimensional space to a lower-dimensional space that maintains the relative po- sitions of the data as precisely as possible. Therefore, SOM can be used for visualization. The visualized map here is a set of units arranged in the two-dimensional space. A nu- merical vector with the same dimension as the original data is assigned to each unit. SOM updates the assigned vectors to the units, and each of the original data is finally mapped on a unit with its most similar vector. MIR Labs, USA
Transcript of Visualizing Self- and Peer-assessment Data by a Self ... · PDF fileVisualizing Self- and...
International Journal of Computer Information Systems and Industrial Management Applications.ISSN 2150-7988 Volume 8 (2016) pp. 023–032c© MIR Labs, www.mirlabs.net/ijcisim/index.html
Visualizing Self- and Peer-assessment Databy a Self-organizing Map
for Inducing Awareness in LearnersYuta Ueki and Kei Ohnishi
Graduate School of Computer Science and System Engineering,Kyushu Institute of Technology,
680-4 Kawazu, Iizuka, Fukuoka 820-8502, [email protected], [email protected]
Abstract: Self- and peer-assessments among learners are pre-sumed to motivate learners to increase their learning and intro-spection. The basis behind this effect is the awareness resultingfrom differences between a self-assessment result and the as-sessment results from others. Therefore, to enable learners tobenefit from self- and peer-assessments, we need to easily visu-alize results that make them aware of some factor that couldimprove their learning ability. In this study, we designed a sys-tem to visualize self- and peer-assessment data, which are manyand multi-dimensional data, in such a way that we can easilygrasp an overview at first glance. We then developed an actu-al system using a self-organizing map (SOM) as a method forvisualizing self- and peer-assessment data. In a comparison ofthe visualization method in our developed system, SOM, and aconventional method, a radar chart, we showed the usefulnessof our visualization method, SOM, through a subjective evalua-tion test and a statistical hypothesis test. In addition, we carriedout an experiment in which people wrote reports, then conduct-ed self- and peer-assessments of what they wrote by using thedeveloped system. The experimental results showed that the vi-sualization of self- and peer-assessment data enabled people tobecome aware of some factor that helped them to improve theirreports.Keywords: self-assessment, peer assessment, self-organizing map,visualization, awareness
I. Introduction
In the educational research field, studies on self-assessment[1] and peer-assessment [2] among learners in higher educa-tion have been attracting interest. Some studies investigateonly self-assessment [3] or only peer-assessment [4][5], andsome investigate both types [6][7][8][9][10]. Although theroles of self- and peer-assessments in higher education aredifferent, they are considered to motivate learners to enhancelearning and introspection. One of the reasons for the in-creased attention to self- and peer-assessments is the changein the learning perspective. That is, the traditional notionthat teachers disseminate knowledge to learners is changingto the notion that learners construct knowledge through their
social interactions. Self- and peer-assessment behaviors arejust social interactions utilized in the process of constructingknowledge.In higher education, the simultaneous application of self-assessment and peer-assessment enhances learning and in-trospection of learners, as mentioned above. The basis be-hind this effect is awareness of the differences between self-and peer-assessment results. Therefore, to verify the learn-ing effects, it is necessary to show the results of self- andpeer-assessments in a comprehensible way to the learners.In this study, we designed a system for visualizing manyand multi-dimensional data of self- and peer-assessmentsin a way that learners can intuitively grasp the outline ofthe data. In addition, as an example of the designed sys-tem, we developed an actual system for visualizing self-and peer-assessment data on the “Fundamental Competen-cies for Working Persons” defined by the Ministry of Econo-my, Trade and Industry in Japan [11]. These competenciesare the basic abilities required for various people to worktogether in the workplace and in local communities. Fur-thermore, we evaluated a method to visualize self- and peer-assessment data by conducting subjective evaluation testsfor comparison with the conventional visualization method,which is a radar chart. In addition, we carried out an experi-ment in which people wrote reports, then conducted self- andpeer-assessments of what they wrote by using the developedsystem.In the system developed in this study, we first map many andmulti-dimensional self- and peer-assessment data to a two-dimensional space by a self-organizing map (SOM) [12] anddraw the mapped data for visualization. SOM is a methodfor nonlinear data mapping from a high-dimensional spaceto a lower-dimensional space that maintains the relative po-sitions of the data as precisely as possible. Therefore, SOMcan be used for visualization. The visualized map here is aset of units arranged in the two-dimensional space. A nu-merical vector with the same dimension as the original datais assigned to each unit. SOM updates the assigned vectorsto the units, and each of the original data is finally mappedon a unit with its most similar vector.
MIR Labs, USA
Visualizing Self- and Peer-assessment Data by a Self-organizing Map for Inducing Awareness in Learners 24
The remainder of the paper is organized as follows. Sec-tion II describes related work. Section III shows our de-signed system for inducing the awareness of learners. Sec-tion IV shows the system developed according to the designdescribed in Section III. Section V shows the results of a sub-jective evaluation test for validating the visualization methodof the developed system. Section VI shows the system forconducting self- and peer-assessments of reports that peoplewrite and Section VII shows the experimental results to usethe system for self- and -peer-assessments of reports. Finally,conclusions are presented in Section VIII.
II. Related Work
We have recognized the importance of self- and peer-assessments in learning processes, as mentioned in SectionI. Therefore, in this study, we design and develop a systemfor visualizing self- and peer-assessment data for learners toeasily grasp an overview of the data at first glance. We expectthat such visualization induces some awareness related to theimprovement of learning ability. No studies have reportedsuch a system so far. The system designed and developed inthis study is a computer-assisted system for conducting self-and peer-assessments in the learning process. We describestudies on such a computer-assisted system below.Personal digital assistants (PDAs) were used as the platfor-m of a system for conducting self- and peer-assessments inone study [8]. This study explored the potential of apply-ing mobile technology to self- and peer-assessments. Thesystem itself is web-based. In the system implementation,a teacher and students first discuss and co-select assessmen-t criteria or scoring rubrics, and then the teacher enters thecriteria into the system. For example, the criteria could be“Oral communication”, “Ways of presentation”, and so on.Both the students and the teacher give scores for the criteria.Our developed system in this study also uses scores (numeri-cal values) for assessment. However, unlike the system usingPDAs, our system focuses on visualization of the scores, asmentioned above.In addition to the system using PDAs above, many web-based systems have been used for self- and peer-assessments.A web-based system for self- and peer-assessments on port-folios was developed [13]. In this system, students per-form portfolio creation, inspection, and self- and peer-assessments. The teachers review the portfolios that the s-tudents created and evaluate their learning performances. Inthis system, students and teachers give scores to assessmen-t rubrics as well as comments on the assessment rubrics.In [14], a web-based system for conducting self- and peer-assessments of digital competencies among teachers was de-veloped. Digital competencies are given as scores. In [15],a web-based system for reviewing videos recording medi-cal communication was developed. In the experiments us-ing the system, medical students recorded their consulta-tions with a simulated patient and then uploaded the videoto the web-based system. Then, they conducted self- andpeer-assessments of the recorded videos. Specifically, theymarked and annotated positive and negative events in therecorded videos. In this case, self- and peer-assessmentswere given as texts.Finally, although it is not a computer-assisted system for the
self- and peer-assessment system, a social network servicewas used to introduce, explain, and deliver self-assessmenttasks to students [16]. This interesting approach was pre-sented to motivate students to participate in self-assessmentin learning processes.Not only in the existing systems described above, mostmechanisms to allow people to conduct self- and peer-assessments would now be computer-assisted. In addition,as in the social network service used in [16], new emerg-ing technology will actively be utilized for systems related toself- and peer-assessments in the future. As the marking andannotation of recorded videos, new ways for assessment willbe utilized as well. In this study, we focus on visualizationof self- and peer-assessment data in consideration of humancognition and awareness. This consideration of human cog-nition and awareness is the main originality of this study.The contents from Sections I to V in this paper are similar toour previous conference paper [19]. Here, we add the resultsof experiments in which people actually used the system forvisualizing self- and peer-assessment data.
III. Designing a System for Visualizing Self-and Peer-assessment Data
A. Concept
The purpose of the system designed here is to make it easyfor people who are not statistics experts to become aware ofdata that would help them to improve themselves. self- andpeer-assessments are collected as the data. Self-assessmentis useful because people are forced to look back at what theywere. However, self-assessment has less objectivity. Assess-ment from others is also subjective, but would bring someobjectivity as the amount of assessment data increases. Inaddition, assessment from others often includes informationthat a person had not recognized about him or herself. Vi-sualization of the self- and peer-assessment data consideredhere helps people find such information not recognized bythe people themselves. Our visualizations of self- and peer-assessment data show the differences between self- and peer-assessment results and the positions of people in a commu-nity to which a person belongs. Unlike self-assessment, theassessment from others enables a person to realize his owncharacteristics that he or she would not notice only by self-assessment. The positions of the people reveal those whoare close or far from others in the community, so that a per-son might become aware of characteristics for his or her im-provement by referring to the positions of others to whom theperson is attracted.In addition, we assume that people in a community whoknow each other well would use the system. If people whodo not know each other well assess themselves mutually, thereliability of the obtained peer-assessment would be low andthe assessment results would not be acceptable to the peo-ple. Thus, this assumption is quite natural. Furthermore,an appropriate amount of self- and peer-assessment data isneeded for inducing the awareness of people. People cannotrecognize some tendency that might relate to their awarenesswith too much data or too little data. Therefore, we assumethe total number of self- and peer-assessment data is severalhundreds. Also, we consider the burdens on people to assess
25 Ueki and Ohnishi
others. If the number of people as targets for peer-assessmentis large, their burdens would become quite heavy.Shneiderman’s mantra, “Overview first, zoom and filter, thendetails-on-demand” [17], is famous in the data analysis field.It would be hard for us to understand the meaning of a largeamount of data just by looking at the data piece by piece.As this mantra says, when we have a large amount of datato analyze, we should first overview the large amount of da-ta. Then, based on the knowledge obtained by the overview,we examine the details of the data. The purpose of this s-tudy is not to analyze data but to visualize data in order toprovide people with some awareness or knowledge of them-selves. However, even for the purpose of this study, it wouldbe a benefit to show an overview of data to people first toinduce some awareness. In other words, it is necessary to vi-sualize data in such a way that people can generally or qual-itatively notice facts revealed by the data, for example, thefact that the self-assessment of the person concerned is quitefar from assessment of the person by others. Then, a supple-mentary mechanism for examining details of the data shouldalso be provided for the people. Here, it would not be goodto visualize data only in such a way that people can noticefacts quantitatively or in fine detail, for example, the fact thatthe difference between a self-assessment result of the personconcerned and a assessment result of the person from anotherperson is just one in terms of the score for a specific assess-ment object.
B. Design
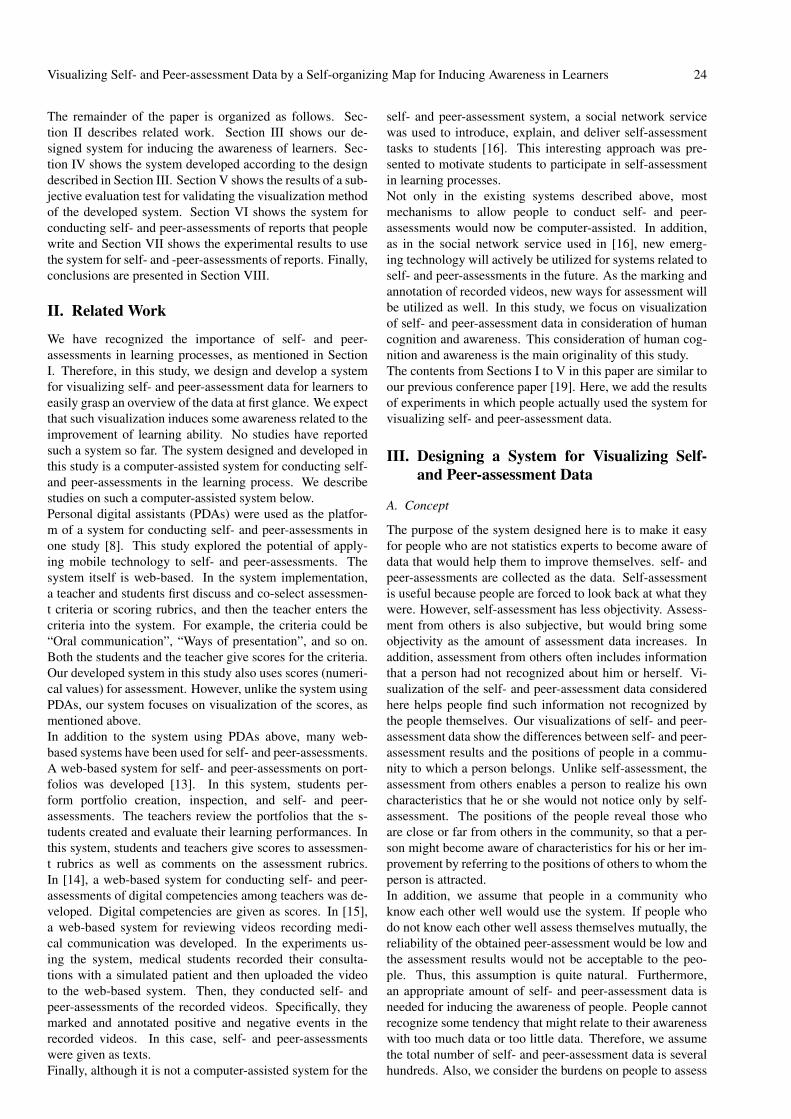
We designed the system by using components of unifiedmodeling language (UML), such as the use case diagram.The use case diagram for the system is shown in Figure 1.The use case descriptions for system functions, such as reg-istering assessment data, deleting assessment data, and view-ing assessment data, are also made, but are not shown heredue to space limitations. The main function of the systemhere is to visualize self- and peer-assessment data represent-ed as a multi-dimensional numerical vector. We concentratemainly on the main function and make other functions simpleso that they can satisfy the minimal requirements. The sys-tem has a function for collecting self- and peer-assessmentdata for visualization and a function for revising inputtedself- and peer-assessment data. Although it would be use-ful for people to mutually describe reasons for giving assess-ment data in natural language, we do not yet provide such afunction in the system. In the future, we will add the functionfor people to add comments or reasons for their assessmen-t in the system. Even without this function, it is possiblethat people in a community who assess each other can re-view the visualized self- and peer-assessment data in a face-to-face manner, because it is assumed that the people knoweach other well.
IV. Developing a System for Visualizing Self-and Peer-assessment Data
In this section, we show our developed system according tothe design described in Section III.
Figure. 1: Use case diagram of the designed system.
A. Perspectives of Self- and Peer-assessment
We have to determine concrete perspectives on the self- andpeer-assessment to develop a system for visualizing self- andpeer-assessment data. We used the assessment perspectivesfor “Fundamental Competencies for Working Persons” [11]defined by the Ministry of Economy, Trade and Industry,Japan in 2006. The definition of “Fundamental Competen-cies for Working Persons” is given as the basic abilities re-quired for various people in the workplace and in local com-munities to work together. The abilities consist of three com-petencies and 12 competency factors, as shown in Table V-A.The number of grades for all assessment perspectives is four,in which 0, 1, 2, and 3 mean “poor”, “fair”, “good”, and “ex-cellent”, respectively.People who are concerned with job hunting are suitable usersfor the system. For example, a group of university studentswho know each other well and are about to start job huntingor who are now job hunting are suitable users.
B. Implementation
We implemented our design shown in Section III as a webapplication system. The implemented system has the screentransitions shown in Figure 2. The implemented systemruns PHP 5.4.10 on the server and uses JavaScript for theclients’ web browsers. Also, it uses a batch learning SOM,in which initialization of the weight values of the self- andpeer-assessment data for visualization is done by principalcomponent analysis (PCA). The reasons for using SOM forthe visualization are as follows.
• It is not very difficult for users to understand how to seethe visualized data by SOM. Conventional ways, suchas a radar chart, are well known for visualizing dataand are probably easier for users to understand how touse them in comparison with SOM-based visualization;however, even such easy methods need to come withexplanations to the users about how to use them.
• Visualization by SOM would be suitable for overview-ing a large amount of data compared to, for example, aradar chart.
• We can intuitively understand the differences betweenself- and peer-assessment results as the distance rela-tions between them on the map formed by SOM.
Visualizing Self- and Peer-assessment Data by a Self-organizing Map for Inducing Awareness in Learners 26
Table 1: Fundamental Competencies for Working Persons.Ability to step forward (action)
Initiative Ability to initiate things proactivelyAbility to influence Ability to influence and involve othersExecution skill Ability to set goals and execute with conviction
Ability to think through (thinking)Ability to detect issues Ability to analyze status quo and clarify issuesPlanning skill Ability to clarify procedures to solve issues and prepareCreativity Ability to create new values
Ability to work in a team (teamwork)Ability to deliver messages Ability to delivery own opinions clearlyAbility to listen closely and carefully Ability to listen to other people’s opinions carefullyFlexibility Ability to appreciate different opinions and perspectivesAbility to grasp situations Ability to comprehend relationship between yourself and other people as well as things surrounding youAbility to apply rules and regulations Ability to comply with social rules and keep promises with othersAbility to control stress Ability to deal with the original cause of stress
• Visualization by SOM reveals relations between the en-tire assessment data, not just between data on a par-ticular assessment perspective. We think the relationsbetween the entire assessment data are more importantfor inducing user awareness. In addition, even if usersdesire visualization by SOM to show the relations be-tween data on a particular assessment perspective, thevisualization can represent the relations by using differ-ent colors of the units that form the map.
• SOM would more flexibly map self- and peer-assessment data that are not in a linear relationship thanwould a conventional method, such as PCA.
We implemented the functions below in the screen visualiz-ing self- and peer-assessment data (Figure 3).
• Function to visualize self- and peer-assessment data bySOM and color units of SOM by the U-matrix [18]. TheU-matrix assigns a color to each unit according to thedistance between the weight vector of the unit and theweight vectors of the unit’s neighbors. Lighter-coloredunits adjacent to each other have more similar weightvectors than do darker-colored ones.
• Function to color only assessment data given by a par-ticular assessor and also only assessment data for a par-ticular person. This function is intended to enable user-s to visually easily understand the differences betweenself- and peer-assessment data.
• Function to color assessment data for each assessmen-t perspective according to the assessment value. Thisfunction is intended to enable users to visually easilyobserve the differences between users with respect tothe focused assessment perspective. Darker-colored u-nits represent larger values for the focused assessmentperspective.
• Function to show the original detailed assessmen-t data when its corresponding data unit on the two-dimensional map formed by SOM is selected.
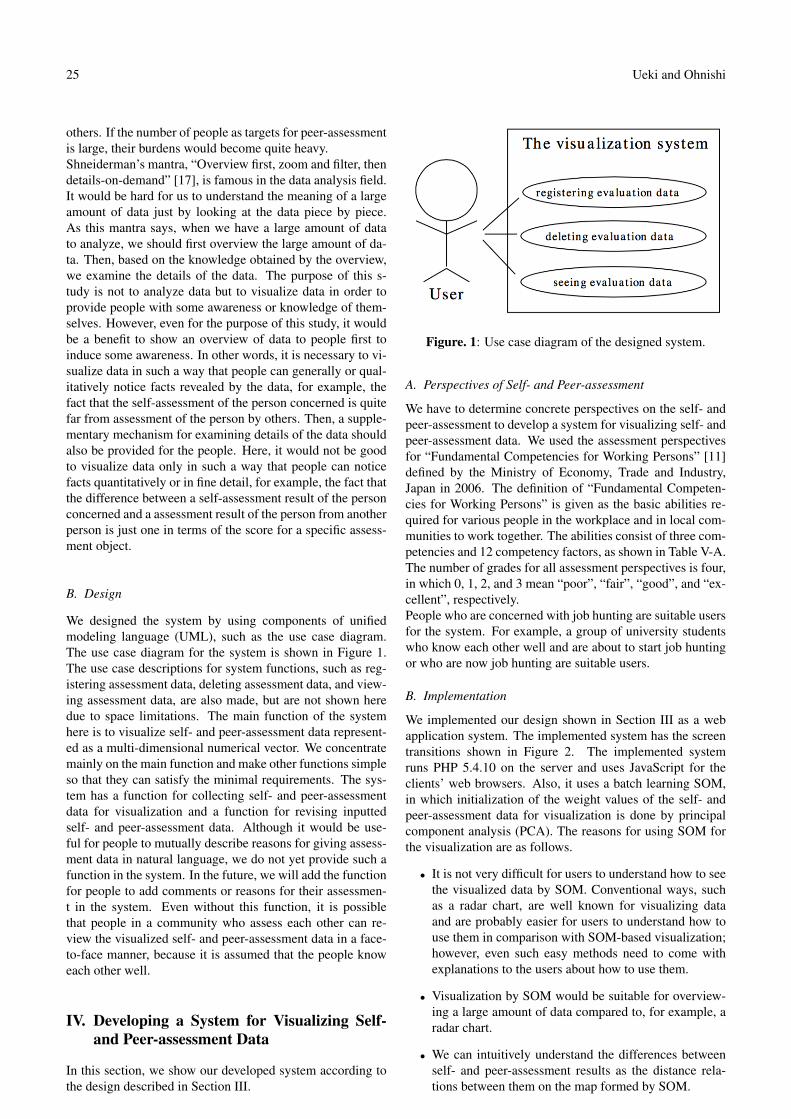
In Figure 3, which shows the assessment data visualized bySOM in the implemented system, the specific assessmentperspective, “Ability to deliver messages”, has been select-ed and colors of all units have been determined according to
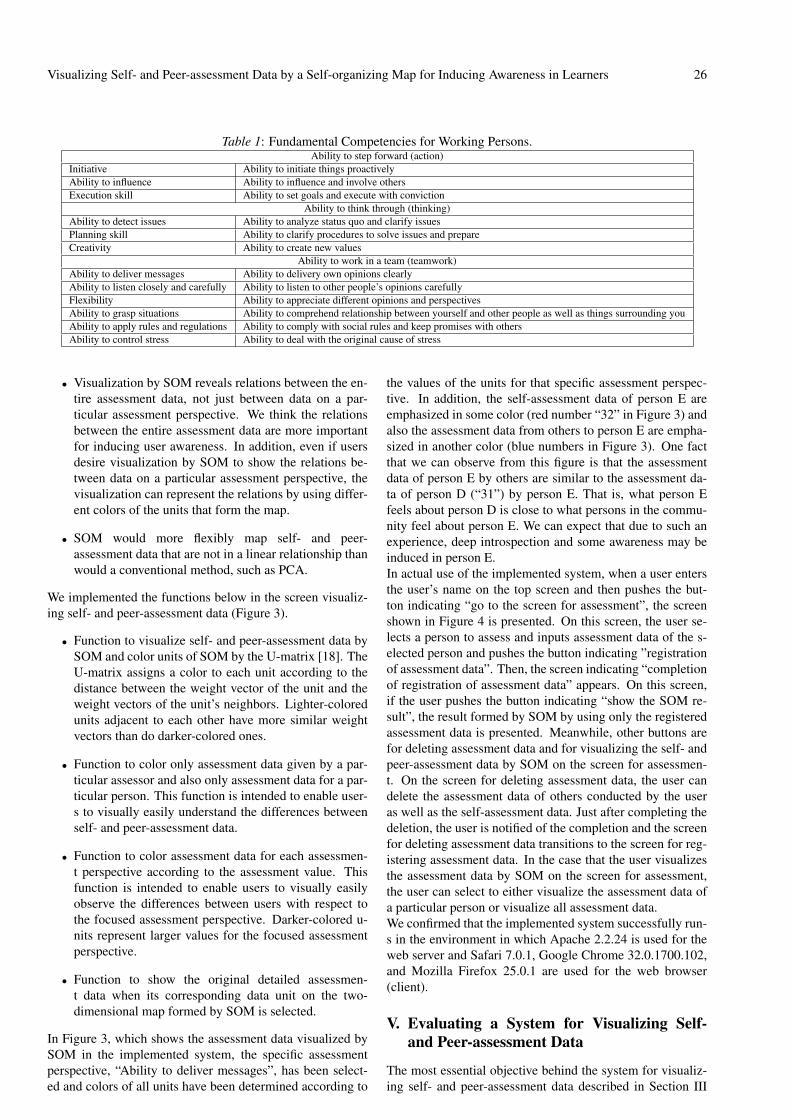
the values of the units for that specific assessment perspec-tive. In addition, the self-assessment data of person E areemphasized in some color (red number “32” in Figure 3) andalso the assessment data from others to person E are empha-sized in another color (blue numbers in Figure 3). One factthat we can observe from this figure is that the assessmentdata of person E by others are similar to the assessment da-ta of person D (“31”) by person E. That is, what person Efeels about person D is close to what persons in the commu-nity feel about person E. We can expect that due to such anexperience, deep introspection and some awareness may beinduced in person E.In actual use of the implemented system, when a user entersthe user’s name on the top screen and then pushes the but-ton indicating “go to the screen for assessment”, the screenshown in Figure 4 is presented. On this screen, the user se-lects a person to assess and inputs assessment data of the s-elected person and pushes the button indicating ”registrationof assessment data”. Then, the screen indicating “completionof registration of assessment data” appears. On this screen,if the user pushes the button indicating “show the SOM re-sult”, the result formed by SOM by using only the registeredassessment data is presented. Meanwhile, other buttons arefor deleting assessment data and for visualizing the self- andpeer-assessment data by SOM on the screen for assessmen-t. On the screen for deleting assessment data, the user candelete the assessment data of others conducted by the useras well as the self-assessment data. Just after completing thedeletion, the user is notified of the completion and the screenfor deleting assessment data transitions to the screen for reg-istering assessment data. In the case that the user visualizesthe assessment data by SOM on the screen for assessment,the user can select to either visualize the assessment data ofa particular person or visualize all assessment data.We confirmed that the implemented system successfully run-s in the environment in which Apache 2.2.24 is used for theweb server and Safari 7.0.1, Google Chrome 32.0.1700.102,and Mozilla Firefox 25.0.1 are used for the web browser(client).
V. Evaluating a System for Visualizing Self-and Peer-assessment Data
The most essential objective behind the system for visualiz-ing self- and peer-assessment data described in Section III
27 Ueki and Ohnishi
Figure. 2: Screen transitions in the implemented system.
Figure. 3: Screen for visualizing assessment data by SOM(SOM screen).
Figure. 4: Screen for assessment.
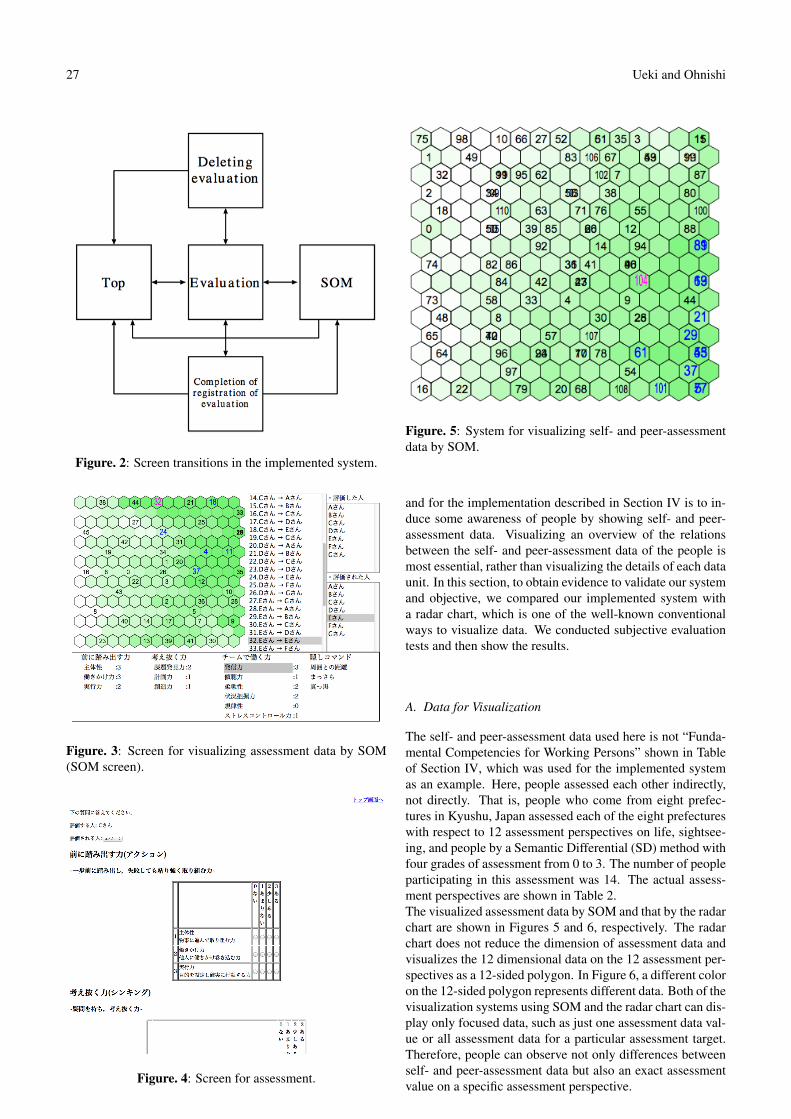
Figure. 5: System for visualizing self- and peer-assessmentdata by SOM.
and for the implementation described in Section IV is to in-duce some awareness of people by showing self- and peer-assessment data. Visualizing an overview of the relationsbetween the self- and peer-assessment data of the people ismost essential, rather than visualizing the details of each dataunit. In this section, to obtain evidence to validate our systemand objective, we compared our implemented system witha radar chart, which is one of the well-known conventionalways to visualize data. We conducted subjective evaluationtests and then show the results.
A. Data for Visualization
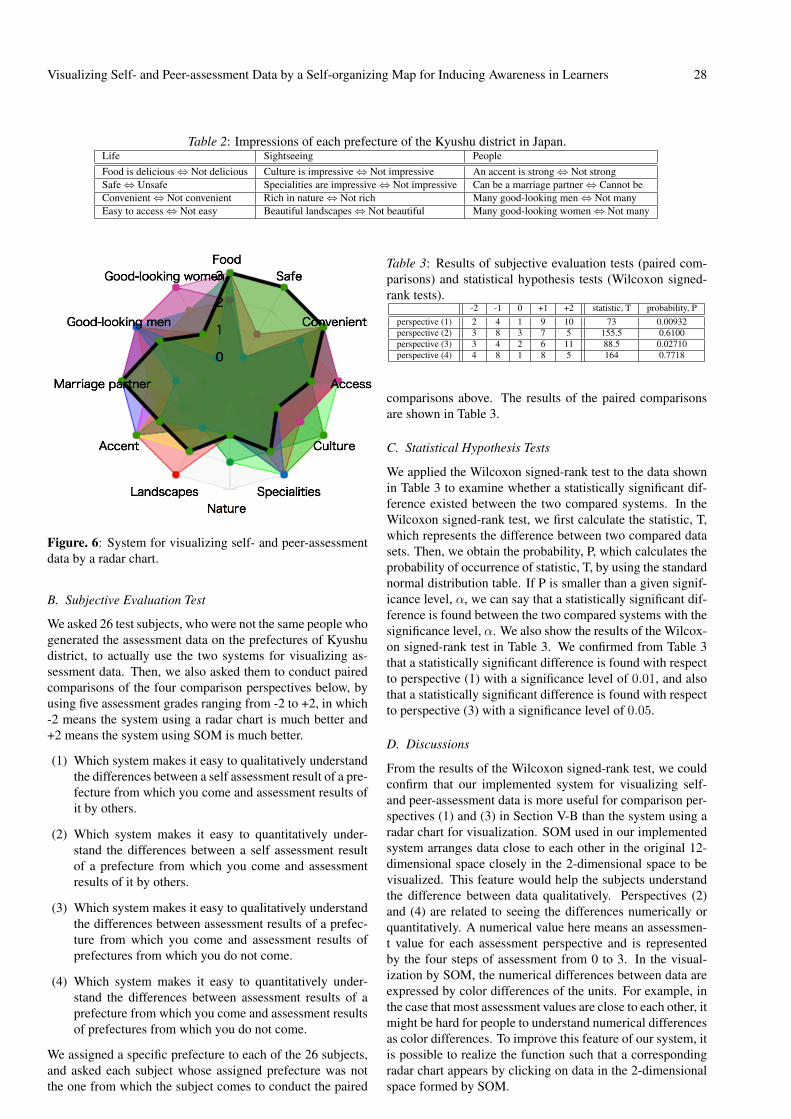
The self- and peer-assessment data used here is not “Funda-mental Competencies for Working Persons” shown in Tableof Section IV, which was used for the implemented systemas an example. Here, people assessed each other indirectly,not directly. That is, people who come from eight prefec-tures in Kyushu, Japan assessed each of the eight prefectureswith respect to 12 assessment perspectives on life, sightsee-ing, and people by a Semantic Differential (SD) method withfour grades of assessment from 0 to 3. The number of peopleparticipating in this assessment was 14. The actual assess-ment perspectives are shown in Table 2.The visualized assessment data by SOM and that by the radarchart are shown in Figures 5 and 6, respectively. The radarchart does not reduce the dimension of assessment data andvisualizes the 12 dimensional data on the 12 assessment per-spectives as a 12-sided polygon. In Figure 6, a different coloron the 12-sided polygon represents different data. Both of thevisualization systems using SOM and the radar chart can dis-play only focused data, such as just one assessment data val-ue or all assessment data for a particular assessment target.Therefore, people can observe not only differences betweenself- and peer-assessment data but also an exact assessmentvalue on a specific assessment perspective.
Visualizing Self- and Peer-assessment Data by a Self-organizing Map for Inducing Awareness in Learners 28
Table 2: Impressions of each prefecture of the Kyushu district in Japan.Life Sightseeing PeopleFood is delicious ⇔ Not delicious Culture is impressive ⇔ Not impressive An accent is strong ⇔ Not strongSafe ⇔ Unsafe Specialities are impressive ⇔ Not impressive Can be a marriage partner ⇔ Cannot beConvenient ⇔ Not convenient Rich in nature ⇔ Not rich Many good-looking men ⇔ Not manyEasy to access ⇔ Not easy Beautiful landscapes ⇔ Not beautiful Many good-looking women ⇔ Not many
Figure. 6: System for visualizing self- and peer-assessmentdata by a radar chart.
B. Subjective Evaluation Test
We asked 26 test subjects, who were not the same people whogenerated the assessment data on the prefectures of Kyushudistrict, to actually use the two systems for visualizing as-sessment data. Then, we also asked them to conduct pairedcomparisons of the four comparison perspectives below, byusing five assessment grades ranging from -2 to +2, in which-2 means the system using a radar chart is much better and+2 means the system using SOM is much better.
(1) Which system makes it easy to qualitatively understandthe differences between a self assessment result of a pre-fecture from which you come and assessment results ofit by others.
(2) Which system makes it easy to quantitatively under-stand the differences between a self assessment resultof a prefecture from which you come and assessmentresults of it by others.
(3) Which system makes it easy to qualitatively understandthe differences between assessment results of a prefec-ture from which you come and assessment results ofprefectures from which you do not come.
(4) Which system makes it easy to quantitatively under-stand the differences between assessment results of aprefecture from which you come and assessment resultsof prefectures from which you do not come.
We assigned a specific prefecture to each of the 26 subjects,and asked each subject whose assigned prefecture was notthe one from which the subject comes to conduct the paired
Table 3: Results of subjective evaluation tests (paired com-parisons) and statistical hypothesis tests (Wilcoxon signed-rank tests).
-2 -1 0 +1 +2 statistic, T probability, Pperspective (1) 2 4 1 9 10 73 0.00932perspective (2) 3 8 3 7 5 155.5 0.6100perspective (3) 3 4 2 6 11 88.5 0.02710perspective (4) 4 8 1 8 5 164 0.7718
comparisons above. The results of the paired comparisonsare shown in Table 3.
C. Statistical Hypothesis Tests
We applied the Wilcoxon signed-rank test to the data shownin Table 3 to examine whether a statistically significant dif-ference existed between the two compared systems. In theWilcoxon signed-rank test, we first calculate the statistic, T,which represents the difference between two compared datasets. Then, we obtain the probability, P, which calculates theprobability of occurrence of statistic, T, by using the standardnormal distribution table. If P is smaller than a given signif-icance level, α, we can say that a statistically significant dif-ference is found between the two compared systems with thesignificance level, α. We also show the results of the Wilcox-on signed-rank test in Table 3. We confirmed from Table 3that a statistically significant difference is found with respectto perspective (1) with a significance level of 0.01, and alsothat a statistically significant difference is found with respectto perspective (3) with a significance level of 0.05.
D. Discussions
From the results of the Wilcoxon signed-rank test, we couldconfirm that our implemented system for visualizing self-and peer-assessment data is more useful for comparison per-spectives (1) and (3) in Section V-B than the system using aradar chart for visualization. SOM used in our implementedsystem arranges data close to each other in the original 12-dimensional space closely in the 2-dimensional space to bevisualized. This feature would help the subjects understandthe difference between data qualitatively. Perspectives (2)and (4) are related to seeing the differences numerically orquantitatively. A numerical value here means an assessmen-t value for each assessment perspective and is representedby the four steps of assessment from 0 to 3. In the visual-ization by SOM, the numerical differences between data areexpressed by color differences of the units. For example, inthe case that most assessment values are close to each other, itmight be hard for people to understand numerical differencesas color differences. To improve this feature of our system, itis possible to realize the function such that a correspondingradar chart appears by clicking on data in the 2-dimensionalspace formed by SOM.
29 Ueki and Ohnishi
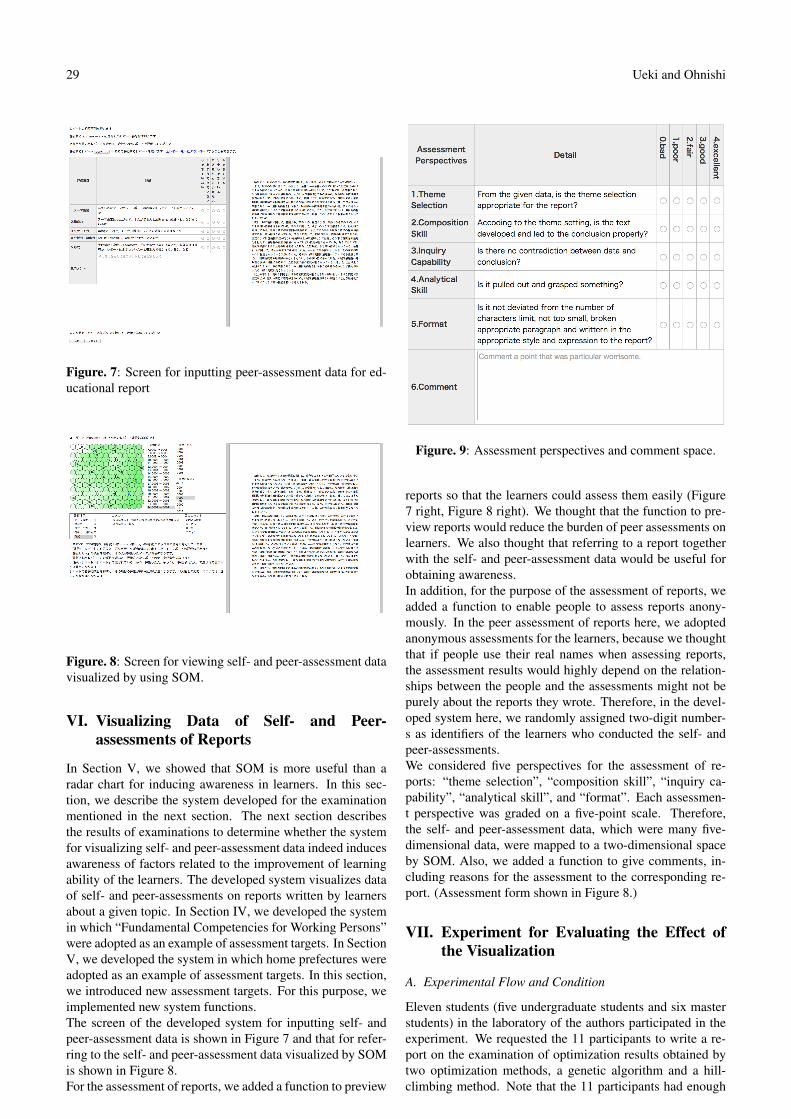
Figure. 7: Screen for inputting peer-assessment data for ed-ucational report
Figure. 8: Screen for viewing self- and peer-assessment datavisualized by using SOM.
VI. Visualizing Data of Self- and Peer-assessments of Reports
In Section V, we showed that SOM is more useful than aradar chart for inducing awareness in learners. In this sec-tion, we describe the system developed for the examinationmentioned in the next section. The next section describesthe results of examinations to determine whether the systemfor visualizing self- and peer-assessment data indeed inducesawareness of factors related to the improvement of learningability of the learners. The developed system visualizes dataof self- and peer-assessments on reports written by learnersabout a given topic. In Section IV, we developed the systemin which “Fundamental Competencies for Working Persons”were adopted as an example of assessment targets. In SectionV, we developed the system in which home prefectures wereadopted as an example of assessment targets. In this section,we introduced new assessment targets. For this purpose, weimplemented new system functions.The screen of the developed system for inputting self- andpeer-assessment data is shown in Figure 7 and that for refer-ring to the self- and peer-assessment data visualized by SOMis shown in Figure 8.For the assessment of reports, we added a function to preview
Figure. 9: Assessment perspectives and comment space.
reports so that the learners could assess them easily (Figure7 right, Figure 8 right). We thought that the function to pre-view reports would reduce the burden of peer assessments onlearners. We also thought that referring to a report togetherwith the self- and peer-assessment data would be useful forobtaining awareness.In addition, for the purpose of the assessment of reports, weadded a function to enable people to assess reports anony-mously. In the peer assessment of reports here, we adoptedanonymous assessments for the learners, because we thoughtthat if people use their real names when assessing reports,the assessment results would highly depend on the relation-ships between the people and the assessments might not bepurely about the reports they wrote. Therefore, in the devel-oped system here, we randomly assigned two-digit number-s as identifiers of the learners who conducted the self- andpeer-assessments.We considered five perspectives for the assessment of re-ports: “theme selection”, “composition skill”, “inquiry ca-pability”, “analytical skill”, and “format”. Each assessmen-t perspective was graded on a five-point scale. Therefore,the self- and peer-assessment data, which were many five-dimensional data, were mapped to a two-dimensional spaceby SOM. Also, we added a function to give comments, in-cluding reasons for the assessment to the corresponding re-port. (Assessment form shown in Figure 8.)
VII. Experiment for Evaluating the Effect ofthe Visualization
A. Experimental Flow and Condition
Eleven students (five undergraduate students and six masterstudents) in the laboratory of the authors participated in theexperiment. We requested the 11 participants to write a re-port on the examination of optimization results obtained bytwo optimization methods, a genetic algorithm and a hill-climbing method. Note that the 11 participants had enough

Visualizing Self- and Peer-assessment Data by a Self-organizing Map for Inducing Awareness in Learners 30
knowledge to understand and examine the results. We thenrequested them to conduct self- and peer-assessments for thereports they wrote.After the self- and peer-assessments, the 11 participants re-viewed the self- and peer-assessment results by using the sys-tem. Finally, we requested them to answer a free descriptivequestionnaire, from which we could obtain 10 answers. Thequestions were “What were you aware of regarding improve-ment of the report you wrote?”, “What made you aware ofthe improvement?”, and “If you became aware of the im-provement points from the visualization of the self- and peer-assessment data, please tell us which specific data or specificrelation between data made you aware of those.”
B. Results and Discussions
From the results of both the self- and peer-assessments usingthe system and the questionnaire, we consider the function-s that induced awareness of the improvement of the reportsfrom the participants, how the participants were aware of theimprovement points by using the functions, and the problemsof the system that should be solved.Most participants answered that concrete values of the fiveperspectives for assessing a report were useful for consid-ering the improvements of reports. Most students focusedon perspectives that were given small assessment values byothers for their reports, and then compared their reports toothers’ reports that were given larger values for the same per-spectives. For example, some participants became aware thatthe format of the report could be improved by looking at theresults of the self- and peer-assessments, as shown in Figure10. In Figure 10, the map formed by SOM and the units inthe map were colored according to the values of the “format”perspective. A darker color means a larger value. The num-ber “20” in the map is the self-assessment data of a partici-pant’s report and the numbers “11”, “14”, and “17” are thepeer-assessment data of the participant’s report from others.We can observe from the figure that the assessment valuesfor the “format” perspective of the participant’s report arenot good; that is, the corresponding units have light colors.Consequently, this participant could obtain clues on how toimprove the report format by referring to reports with largerassessment values for the “format” perspective.Several participants answered that visualization of the self-and peer-assessment data by using SOM was useful for ob-taining awareness for the improvement of reports. One par-ticipant became aware that some reports, whose positions inthe SOM map were close to the positions of the reports ofother participants, were indeed similar to each other in termsof composition, contents, conclusion, and so on. Anotherparticipant mentioned that the reasons for the assessment ofothers’ reports being close to the report of the participan-t were useful for considering improvements of the report.Also, participants would be able to find good and bad pointsmore easily in others’ similar reports than in their own report-s, because people can usually criticize others’ reports moreobjectively than their own reports.In addition, one participant became aware that the positionsof the assessment to the report of the participant from oth-ers in the map were separate from each other; that is, theassessment depended on the participants. Figure 11 shows
Figure. 10: SOM colored for the perspective “format”.
Figure. 11: Example of self- and peer-assessment data sepa-rately distributed.
that map. In the map, the number “24” is the self-assessmentdata for the report of the participant and the numbers “15”,“18”, and “21” are the assessment data for the reports of oth-ers. Due to this awareness, the participant further becameaware that the participant could obtain clues to improve thereport by examining other’s reports whose peer-assessmentdata were densely distributed in the map. Figure 12 is an ex-ample of such a map. In the map, the number “16” is theself-assessment data for the specific report and the numbers“7”, “10”, and “13” are the peer-assessment data for the samereport.As mentioned above, the answers from the participantsshowed that visualization of the peer- and self-assessmentdata could induce awareness of a factor related to improve-ment of the reports from other participants. However, thenumber of participants who obtained awareness was notmany. If we explained how to use the map of the self-

31 Ueki and Ohnishi
Figure. 12: Example of the self- and peer-assessment datadensely distributed.
and peer-assessment data formed by SOM more specifical-ly, for example, by giving examples on how to comprehendthe map, we think that more participants would have beenable to obtain awareness.
VIII. Conclusions
In this study, we designed a system for visualizing self- andpeer-assessment data and developed an actual system. Wecompared our visualization method using SOM with an ex-isting method using a radar chart through a subjective eval-uation test and a statistical hypothesis test. From the com-parison results, we were able to show the usefulness of ourvisualization method.In addition, we conducted an experiment in which partic-ipants used the actual developed system for validating theeffect of the visualization of self- and peer-assessment dataon inducing awareness related to improvement. Answers toquestions about the developed system after the experimentshowed that the people who participated in the experimen-t indeed felt that the visualization helped them obtain suchawareness.In future work, we will verify that people can actually im-prove their learning ability based on the awareness obtainedby using the system. For the verification, we need to first re-quest people to conduct learning and assessments repeatedlyand then observe the improvement of these people.
Acknowledgment
We are most grateful to Takuro Kawamura and Shogo Ya-mazaki for their system development and discussions.This work was supported by the Japan Society for the Pro-motion of Science through a Grant-in-Aid for Scientific Re-search (C) (25330289).
References
[1] R. L. Weaver II and H. W. Cotrell, “Peer evaluation: Acase study. Innovative Higher Education”, Vol. 11, pp.25–39, 1986.
[2] D. Boud, “The Role of Self-assessment in Studen-t Grading”, Assessment & Evaluation in Higher Edu-cation, Vol. 14, No. 1, pp.20–30, 1989.
[3] D. W. Chambers and E. E LaBarre, “The Effects ofStudent Self-Assessment on Learning in RemovableProsthodontics Laboratory”, Journal of Dental Educa-tion, Vol. 78, Issue 5, pp.668-690, 2014.
[4] M. J. M. Maas, D. M. A. Sluijsmans, P. J. van der Wees,Y. F. Heerkens, M. W. G. Nijhuis-van der Sanden, andC. P. M. van der Vleuten, “Why peer assessment helpsto improve clinical performance in undergraduate phys-ical therapy education: a mixed methods design”, BMCMedical Education, Vo.14, No.117, 2014.
[5] E. Vanderhoven, A. Raes, H. Montrieux, T. Rotsaert,and T. Schellens, “What if pupils can assess their peersanonymously? A quasi-experimental study”, Comput-ers & Education, Vol. 81, pp.123–132, 2015.
[6] A. L. Haas, R. W. Haas, and T. R. Wotruba, “The Useof Self Ratings and Peer Ratings to Evaluate Perfor-mances of Student Group Members”, Journal of Mar-keting Education, Vol. 20, No. 3, pp.200–209, 1998.
[7] M. Lejk and M. Wyvill, “The effect of the inclusionof self-assessment with peer assessment of contribu-tions to a group project: A quantitative study of se-cret and agreed assessments”, Assessment and Evalua-tion in Higher Education, Vol. 26, Issue 6, pp.551-561,2001.
[8] C. H. Chen, “The implementation and evaluation of amobile self- and peer-assessment system”, Computers& Education, Vol. 55, Issue 1, pp.229–236, 2010.
[9] C, Kulkarni, K. P Wei, H. Le, D. Chia, K. Papadopou-los, J. Cheng, D. Koller, and S. R. Klemmer, “Peerand Self Assessment in Massive Online Classes”, ACMTransaction on Computer-Human Interaction, Vo. 20,Issue 6, 2013.
[10] J. C. G. de Sande and J. I. Godino-Llorente, “PeerAssessment and Self-assessment: Effective LearningTools in Higher Education”, International Journal ofEngineering Education, Vol. 30 Issue 3, pp.711–721,2014.
[11] The Ministry of Economy, Trade and Industry (METI),Japan, “Fundamental Competencies for WorkingPersons”, http://www.meti.go.jp/policy/kisoryoku/ (in Japanese).
[12] T. Kohonen, “Self-Organizing Maps”, Springer-VerlagBerlin, 1995.
Visualizing Self- and Peer-assessment Data by a Self-organizing Map for Inducing Awareness in Learners 32
[13] C. C. Chang, K. H. Tseng, and S. J. Lou, “A compar-ative analysis of the consistency and difference amongteacher-assessment, student self-assessment and peer-assessment in a Web-based portfolio assessment envi-ronment for high school students”, Computer & Educa-tion, Vo. 58, Issue 1, pp. 303–320, 2012.
[14] H. Poldoja, T. Valjataga, M. Laanpere, and Tammets,K, “Web-based self- and peer-assessment of teachers’digital competencies”, World Wide Web-Internet andWeb Information Systems, Vol. 17 Issue 2 pp.255–269,2014.
[15] R. L. Hulsman and J. van der Vloodt, “Self-evaluationand peer-feedback of medical students communicationskills using a web-based video annotation system. Ex-ploring content and specificity”, Patient Education andCounseling, Vol. 98, Issue 3, pp.356–363, 2015.
[16] C. Guerrero and A. Jaume-I-Capo, “Use of Social Net-works to Motivate Computer-Engineering Students toParticipate in Self-assessment Activities”, Studies inInformatics and Control, Vol. 23, Issue 2, pp. 197-206,2014.
[17] Ben Shneiderman, “The Eyes Have It: A Task by DataType Taxonomy for Information Visualizations”, Pro-ceedings of IEEE Symposium on Visual Languages,pp.336–343, 1996.
[18] A. Ultsch and H. P. Siemon, “Kohonen’s Self Organiz-ing Feature Maps for Exploratory Data Analysis”, InProceedings of International Neural Networks Confer-ence (INNC), pp. 305-308, 1990.
[19] Yuta Ueki and Kei Ohnishi, “Inducing Awareness forLearners through Visualizing Mutual Evaluation Databy a Self-Organizing Map”, The 7th International Con-ference on Soft Computing and Pattern Recognition(SoCPaR 2015), pp.123–128, Fukuoka, Japan, Novem-ber 13-15, 2015.
Author Biographies
Yuta Ueki received the Bachelor ofInformation Engineering degree fromKyushu Institute of Technology, Japanin 2014. He is currently a master stu-dent with the Graduate School of Com-puter Science and System Engineering,Kyushu Institute of Technology, Japan.His research interests include informa-tion visualization techniques including
self-organizing maps.
Kei Ohnishi received the Doctor ofDesign degree from Kyushu Insti-tute of Design, Japan in 2003. Heworked as a postdoctoral researcherfor University of Illinois at Urbana-Champaign, Kyushu Institute of Tech-nology, and Human Media CreationCenter / Kyushu. Since October 2007,he has been an associate professor at
Kyushu Institute of Technology. His research interests in-clude soft computing techniques, especially evolutionarycomputation.