Onrust 2015 vergrijzing van het weiland speelt de kievit parten

1 23
Behavior Research Methods e-ISSN 1554-3528 Behav ResDOI 10.3758/s13428-012-0236-7
Visualizing multiple word similaritymeasures
Brent Kievit-Kylar & Michael N. Jones

1 23
Your article is protected by copyright and all
rights are held exclusively by Psychonomic
Society, Inc.. This e-offprint is for personal
use only and shall not be self-archived in
electronic repositories. If you wish to self-
archive your work, please use the accepted
author’s version for posting to your own
website or your institution’s repository. You
may further deposit the accepted author’s
version on a funder’s repository at a funder’s
request, provided it is not made publicly
available until 12 months after publication.

Visualizing multiple word similarity measures
Brent Kievit-Kylar & Michael N. Jones
# Psychonomic Society, Inc. 2012
Abstract Although many recent advances have taken placein corpus-based tools, the techniques used to guide explo-ration and evaluation of these systems have advanced little.Typically, the plausibility of a semantic space is explored bysampling the nearest neighbors to a target word and evalu-ating the neighborhood on the basis of the modeler’s intui-tion. Tools for visualization of these large-scale similarityspaces are nearly nonexistent. We present a new open-source tool to plot and visualize semantic spaces, therebyallowing researchers to rapidly explore patterns in visualdata that describe the statistical relations between words.Words are visualized as nodes, and word similarities areshown as directed edges of varying strengths. The “Word-2-Word” visualization environment allows for easy manip-ulation of graph data to test word similarity measures ontheir own or in comparisons between multiple similaritymetrics. The system contains a large library of statisticalrelationship models, along with an interface to teach themfrom various language sources. The modularity of the visu-alization environment allows for quick insertion of newsimilarity measures so as to compare new corpus-basedmetrics against the current state of the art. The software isavailable at www.indiana.edu/~semantic/word2word/.
Keywords Visualization . Semantic similarity space .
Corpus-based models . Latent semantic analysis
Information visualization is a burgeoning interdisciplinaryfield concerned with methods for the visual representation
of large-scale data, as a tool for efficient communication andfor the discovery of structure (Börner, Chen, & Boyack,2003; Friendly, 2008). While the field of psychology mostcommonly uses summary statistics to collapse largeamounts of data for communication of behavioral trends,visualization is concerned with schematic abstraction of thedata in a visual form to reveal trends. Information visuali-zation techniques capitalize on the capacity of the humanvisual system to “see, explore, and understand largeamounts of information at once” (Thomas & Cook, 2005,p. 30). This has the added benefit that insights may be madeby visual inspection of the full data structure that may nothave been obvious with aggregate statistical methods. Forthis reason, visualization is most commonly used for infor-mation discovery and exploration of large-scale data.
The field of information visualization has seen manyuseful applications, and it improves interaction with massivedata sets and allows users to discover structure in informa-tion data (e.g., Card, Mackinlay, & Shneiderman, 1999;Chen, 1999; Gershon, Eick, & Card, 1998; González &Kobsa, 2003; Spence, 2000). Many visualization techniquesleverage graphical representations of data by using nodesand relational connections to represent critical information(Steyvers & Tenenbaum, 2005). Modern examples includecurrently popular visual dictionaries and thesauri, but alsosocial networks (Wasserman & Faust, 1994) and graphicalrepresentations of human brain connectivity (Sporns, 2011;Sporns, Chialvo, Kaiser, & Hilgetag, 2004).
In this article, we present the Word-2-Word softwarepackage to visually explore and evaluate lexical semanticsimilarity in a text corpus. The package contains 22 meas-ures of word similarity (e.g., latent semantic analysis [LSA],WordNet, or Ngrams) and can be applied to any user-specified corpus. The visualization is rendered in real timeon the basis of a directed graph of the words as nodes and ofrelations as connections. In addition, the software allows for
B. Kievit-Kylar :M. N. Jones (*)Department of Psychological and Brain Sciences,Indiana University,1101 E. 10th Street,Bloomington 47405 IN, USAe-mail: [email protected]
Behav ResDOI 10.3758/s13428-012-0236-7
Author's personal copy

the overlaying of multiple metrics to allow easy visualexploration of how various types of similarity are structuredin the corpus simultaneously.
The system contains a graphical user interface (GUI) andwizard for application to text data by novice users. However, italso contains advanced tools for more sophisticated users.Each relational module is written as a Java class object, whichallows users to import new metrics into the system. Wedemonstrate uses of the system for comparing various seman-tic models in order to better understand different aspects of thesimilarity that they capitalize on, and we comment on uses ofthe tool for stimulus selection and for exploring similaritystructure in content-specific text corpora.
Measures of lexical semantic similarity
Measures of similarity can be loosely classified as being basedon (1) human ratings, (2) expert lexicographers, or (3) corpus-based semantic models. We briefly describe each of thesemethods in turn. Among the first measures of semantic sim-ilarity were human ratings of similarity, typicality, and featuregeneration (e.g., Battig & Montague, 1969; Rosch & Mervis,1975). These measures are still commonly collected and usedas gold standards for developing computational models. Forexample, the University of South Florida word associationdatabase (Nelson, McEvoy, & Schreiber, 2004) is the mostcommonly used data set for stimulus selection (McRae &Jones, 2012) and for evaluation of computational semanticmodels (Bullinaria & Levy, 2007). Feature generation data-bases are also commonly used for both evaluation and stim-ulus selection (e.g., McRae, Cree, Seidenberg, & McNorgan,2005; Vinson & Vigliocco, 2008). Human judgments of syn-onymy and performance on synonymy tests are often used toevaluate the performance of computational semantic models(see Recchia & Jones, 2009, for a review of the data sets). Amajor issue with human-generated databases is that they arerelatively small and are time-consuming to construct.
Considerable effort by expert lexicographers has been putinto constructing large thesauri and hierarchical databases oflexical relations. Among the best known is the WordNet proj-ect (Fellbaum, 1998; Miller, 1995). In WordNet, words arerepresented as localist nodes and are connected to one anothervia a labeled hierarchy (e.g., hypernymy or hyponomy). Sev-eral algorithms have been proposed to compute lexical seman-tic similarity from WordNet (Pedersen, Patwardhan, &Michelizzi, 2004), and some of these metrics show excellentcorrespondence to human judgments of semantic similarity(Maki, McKinley, & Thompson, 2004). Despite their impres-sive coverage, expert-constructed databases are still very time-consuming to develop and limited in their coverage, and it isquestionable whether they are a fair representation of similaritystructure in the mental lexicon.
The last 15 years has seen impressive advances incorpus-based models of lexical semantic similarity (e.g.,LSA, described by Landauer & Dumais, 1997; forreviews of the various methods, see Baroni & Lenci,2010; Riordan & Jones, 2011; Turney & Pantel, 2010;Widdows, 2004). In general, these models attempt toautomatically compute the similarity structure of wordmeaning by observing the statistical regularities of con-textual co-occurrences in a large corpus of text. The resultis usually a vector or probability distribution for eachword that estimates its pattern over latent semantic dimen-sions. Alternatively, some models rely on point estimatesup front (e.g., a conditional probability that two wordswill co-occur within a given context unit). In all models,the semantic similarity between two words may be com-puted as a scalar value—a vector cosine, correlation co-efficient, conditional probability, or frequency. The scalarvalue represents the similarity between two words, asestimated by their statistical relationship in the textcorpus.
Dozens of corpus-based models exist in the literature,and discussing the learning mechanisms and their differ-ences is beyond the scope of this article (but see Bullinaria& Levy, 2007, or Riordan & Jones, 2011, for detailedreviews of the mechanisms). Of particular importance isthe fact that there tends to be relatively little agreement inthe similarity predictions across various models, eventhough they are all based on the same distributional hypoth-esis taken from theoretical linguistics (Harris, 1970). Hence,attention has now shifted from trying to demonstrate whichis the “correct” model of human semantic similarity totrying to understand how the different learning mechanismsof the various models capitalize on different aspects ofhuman semantic organization (Maki & Buchanan, 2008;Riordan & Jones, 2011).
A major issue in the comparison of corpus-based modelshas to do with their sheer size. Even training based on themoderately sized TASA corpus (the standard corpus used totrain most models; Landauer & Dumais, 1997) requires apairwise similarity matrix that is approximately 90,000 by90,000. When comparing two different models, both trainedon the TASA corpus, the theorist is faced with the dauntingtask of determining how the structures in these two massivespaces differ from each other, and how each maps ontohuman similarity representations. Typical recent applica-tions of these models have used text corpora that are manytimes larger than TASA (Olney, 2011; Recchia & Jones,2009). Furthermore, each model has several free parametersthat are important for controlling performance; equallydaunting is trying to compare one run of a model withparameter set X to another run with parameter set Y. How-ever, this situation is precisely the type of problem at whichinformation visualization excels. A proper visualization tool
Behav Res
Author's personal copy
can allow the theorist to compare the overall structure of thefull spaces to one another and to rapidly extract qualitativetrends that are useful in model optimization.
Another common use of corpus-based models is forexploration of semantic structure in content-specific textcorpora (McCarthy & Boonthum-Denecke, 2011). Assum-ing that the semantic structure learned by these models istruly valid, they may be used to explore the semantic struc-ture of different text genres and specialized topics (Foltz,Britt, & Perfetti, 1996; Stone, Dennis, & Kwantes, 2011).When comparing two different text sources to understanddifferences in their semantic structures (presumably using asingle model), it would also be extremely useful to have theguidance of a visualization tool that allows for the overlay-ing of multiple measures and text sources.
Methods of evaluating corpus-based models
When evaluating a single corpus-based model, the theorist isfaced with the issue of determining how to optimally set theparameters of the model so that the massive output matrixbest approximates the “correct” semantic similarity struc-ture. When comparing between two different corpus-basedmodels, the problem is to determine which one best approx-imates the “correct” semantic structure or to qualitativelyunderstand the different aspects of semantic similarity thatare being represented by the different learning mechanisms.Because of their sheer size and computational complexity,standard methods of quantitative model comparison (e.g.,Busemeyer & Diedrich, 2010; Lewandowsky & Farrell,2011), such as maximum-likelihood estimation, are verydifficult to apply to corpus-based models.
In addition, the human data sets available for modelfitting are quite small, leading to validation problems andoverfitting. For example, in Landauer and Dumais’s (1997)original optimization of dimensions in LSA, the authorsestimated the similarity structure of all possible pairs ofwords on the basis of how well the model fit 80 retireditems from the TOEFL test. Essentially, the exercise deter-mined the best organization among all word pairs dependenton the model’s performance on the 80 pairs for which theauthors had data; this is less than one one-hundred millionthof the full similarity space. Perhaps most dangerous of all,these models are often designed and evaluated on the basisof the modeler’s intuition from sampling the nearest neigh-bors to a small handful of target words. The problem ofinvestigating semantic neighborhood structure is ideallysuited for guidance by a visualization tool.
Analytic methods for evaluating and contrasting semanticmodels are becoming a focus of communities in both com-putational linguistics and computational psychology. Forrecent advances, we refer the reader to several relevantworkshops with online materials. Geometric Models of
Natural Language Semantics (GEMS), a workshop at the2011 Conference on Empirical Methods in Natural Lan-guage Processing, focused on several new methods forevaluating distributional semantic models based on humandata. Similarly, the recent DiSCo (“Distributional and Se-mantic Compositionality”) 2011 workshop at the conferenceof the Association for Computational Linguistics (ACL)concentrated on novel techniques to evaluate semantic mod-els on the basis of the difficult task of lexical composition.In addition, the Society for Computers in Psychology (at thePsychonomic Society annual conference) annually has asymposium dedicated to methods for evaluating semanticmodels.
Method 1: Picking cherries The overall goal of constructinga corpus-based model is to approximate the similarity struc-ture among words in the human lexicon. This allows themodel’s similarity estimates to be used to infer the semanticsimilarity that would be assigned by human raters for wordsthat have no human ratings recorded. The most commonmethod of demonstrating similarity structure is based onintuition—a small set of high-frequency target words areselected, and the nearest neighbors in space (the most sim-ilar words to the target) are examined for how well they fitintuition. Virtually all corpus-based models use this tech-nique to illustrate how intuitive the model’s similarity spaceis (Andrews, Vigliocco, & Vinson, 2009; Griffiths, Steyvers,& Tenenbaum, 2007; Jones & Mewhort, 2007; Kintsch &Mangalath, 2011; Landauer & Dumais, 1997; Lund &Burgess, 1996). Commonly, this “cherry picking” is onlyused for illustrative purposes, with the model’s performancebeing subsequently evaluated in terms of fit with a larger setof human rating data.
However, examining the intuitive structure of near neigh-bors is also commonly used when deciding on parametersettings as the model is developed. The most commonlyused target terms are dog, doctor, hospital, and heart. Foreach setting of parameters, the theorist samples the 20–40nearest neighbors to the small set of high-frequency targetwords. If the nearest neighbors to doctor are words like tree,stapler, muffler, and so forth, the parameter set is incompat-ible with intuition and is probably discarded. If the nearestneighbors to doctor are more compatible with intuition, suchas nurse, hospital, and medicine, then the parameter settingsappear to produce a better qualitative fit to our intuition ofthe human lexicon. This practice is particularly worrisome,given that the full matrix of word-by-word similarities isapproximately 100,0002, and the goodness of fit of theentire matrix is estimated on the basis of “eyeballing” asmall set of neighbors to a small set of high-frequency targetwords. Cherry-picking target words that have intuitive nearneighbors may actually be deceiving; Jones and Recchia(2010) have demonstrated that the exemplars selected
Behav Res
Author's personal copy
usually demonstrate a biased exception rather than the ruleof similarity relations in a structural model.
Method 2: Comparing to a gold standard A second com-mon method of evaluating corpus-based models is by com-paring their similarity structure to a gold standard based onhuman judgments. Common data sets include word associ-ation databases (Nelson et al., 2004), semantic priming data(Hutchison, Balota, Cortese, & Watson, 2008; Jones,Kintsch, & Mewhort, 2006), word similarity judgments(see Recchia & Jones, 2009, for a review of data sets), andhuman performance on synonymy tests (Landauer &Dumais, 1997).
Typically, the similarity structure of the model’s repre-sentations is compared to the actual human behavior, withthe goal of maximizing fit. While this is a step more objec-tive than intuiting the quality of near neighbors to a targetset, gold standard comparison is far from perfect. First, thedata sets are usually still in the range of only about ahundred similarity judgments from humans, which is a tinyfraction of the entire similarity space. It is still very difficultto get an intuitive understanding of the full space by col-lapsing to an average over a small sample of the space.
Second, the various gold standard data sets tend to havevery little agreement with each other (Maki & Buchanan,2008). Jones, Gruenenfelder, and Recchia (2011) suggestedthat this disagreement is due to the fact that while all goldstandards aim to measure “semantic similarity,” they all usedifferent response tasks (e.g., free association, similarityjudgments, or multiple-alternative forced choice), and thisvariability pollutes the semantic representation in differentdecision processes. Hence, it is dangerous to accept or rejecta particular run of a representational model on the basis of fitto a gold standard; the representational model may be per-fectly correct, but should not be expected to fit the behav-ioral data without the appropriate decision model (see Johns& Jones, 2010).
Method 3: Comparing to each other A third method ofevaluating corpus-based models is to compare their similar-ity structures to each other, either with or without a goldstandard. This technique allows the theorist to understandthe differences between seemingly similar learning mecha-nisms by formalizing each model, training them on the sametext corpus, and comparing the resulting spaces to eachother (Perfetti, 1998). Rather than competition, the goal isto understand the different statistical aspects of semantics inthe text corpus that different learning mechanisms maycapitalize on (e.g., Andrews et al., 2009; Riordan & Jones,2007, 2011; Stone et al., 2011). Often, the methods rely onsimple correlation between the similarity matrices learnedby each model, but newer generalized methods (e.g., Hu,Cai, Graesser, & Ventura, 2005) allow for the comparison of
spaces that differ in metric (e.g., comparing an LSA space toa probabilistic topic space).
Existing tools for exploring corpora
The task of exploring semantic structure in different textcorpora is becoming much more common (see McCarthy &Boonthum-Denecke, 2011), but there are very few tools toaid this exploration. Exploration of content-specific corpora(e.g., the smallheart corpus demonstration of Landauer &Dumais, 1997; Landauer, McNamara, Dennis, & Kintsch,2007; Steyvers, Smyth, & Chemuduganta, 2011), genres(McCarthy, Graesser, & McNamara, 2006), political tran-scripts (Holtzman, Schott, Jones, Balota, & Yarkoni, 2011),legal transcripts (Hughes, Hughes, & Lazar, 2008), militarycommunications (Gorman, Foltz, Kieke, Martin, & Cooke,2003), and neuroimaging articles (Yarkoni, Poldrack,Nichols, Van Essen, & Wager, 2011) are some of the manyexamples. These applications are not concerned with usingcorpus-based models to understand the average human lex-icon but, rather, with using them to understand the semanticstructure of a specific domain.
While the sophisticated developer can apply a semanticmodel to any corpus, this usually requires considerable skill,and the developer still faces issues in understanding theresulting similarity matrix. General packages now exist toapply a variety of corpus-based models to text data (e.g.,Graesser, McNamara, Louwerse, & Cai, 2004; Jurgens &Stevens, 2010). More common is the use of very simplefrequency-counting systems such as word clouds or count-ing target words (Pennebaker & Chung, 2008). However, ageneral suite of semantic metric algorithms wrapped into anetwork visualization program is greatly needed.
Several general-purpose network visualization packagesexist (e.g., Pajek, Network ToolBench, Gelphi, and the RSocial Network Analysis package), as do multidimensonalscaling (MDS) display packages (e.g., Cluto). Similarly,several general-purpose packages exist for implementing avariety of semantic models (e.g., the S-Space package).However, the use of visualization to guide semantic modeldevelopment or to explore corpora has been quite limited inpractice.1 Our goal with the Word-2-Word package is toprovide a single tool to integrate semantic algorithms andvisualization techniques in a flexible Java platform thatallows for integration of new metrics. It should be noted atthe outset that while visualization is an efficient method forexploring structure in a semantic space, it is only one com-ponent in a larger research program, and should be followed
1 A notable exception is the TextGraphs group, which holds an annualworkshop at ACL focusing on the application of graphical techniquesto natural-language processing.
Behav Res
Author's personal copy

up with confirmatory techniques such as fitting to behavior-al data or using semantic contrast analyses (e.g., Holtzmanet al., 2011).
The Word-2-Word visualization package
Word-2-Word is a GUI-based Java tool for visualizing se-mantic similarity relations among words in a text corpus.The software contains 22 common similarity-based metrics(both corpus- and WordNet-based) and allows users to in-troduce their own metrics. The software can be used tocompute similarity relations among words in a user-specified text corpus or webpage, and it allows for overlay-ing multiple similarity relations. The software includes avariety of text-cleaning tools, so it can easily be applied tocustom text corpora without requiring additional code.
Word relations are stored as a graph network representa-tion of the data, in which words are represented by nodesand relations as connections between the nodes. When awordlist of interest is specified (the nodes), the networkrepresentation is visualized in real time, allowing the userto click-and-drag to change the visual layout, to modify theconnection thresholds and the frequency weightings ofnodes, and to compute network statistics. Multiple wordrelations may be visualized together to better understandthe structure of a text corpus or to understand the resultingsimilarity structure of a single model trained with a partic-ular parameter set. Standard parameter settings of the vari-ous corpus-based models may be easily modified and rerun.The network visualization may also be exported to commonimage file formats for import to presentation and word-processing software, and the network data may be exportedto a spreadsheet to be imported to more sophisticated anal-ysis programs.
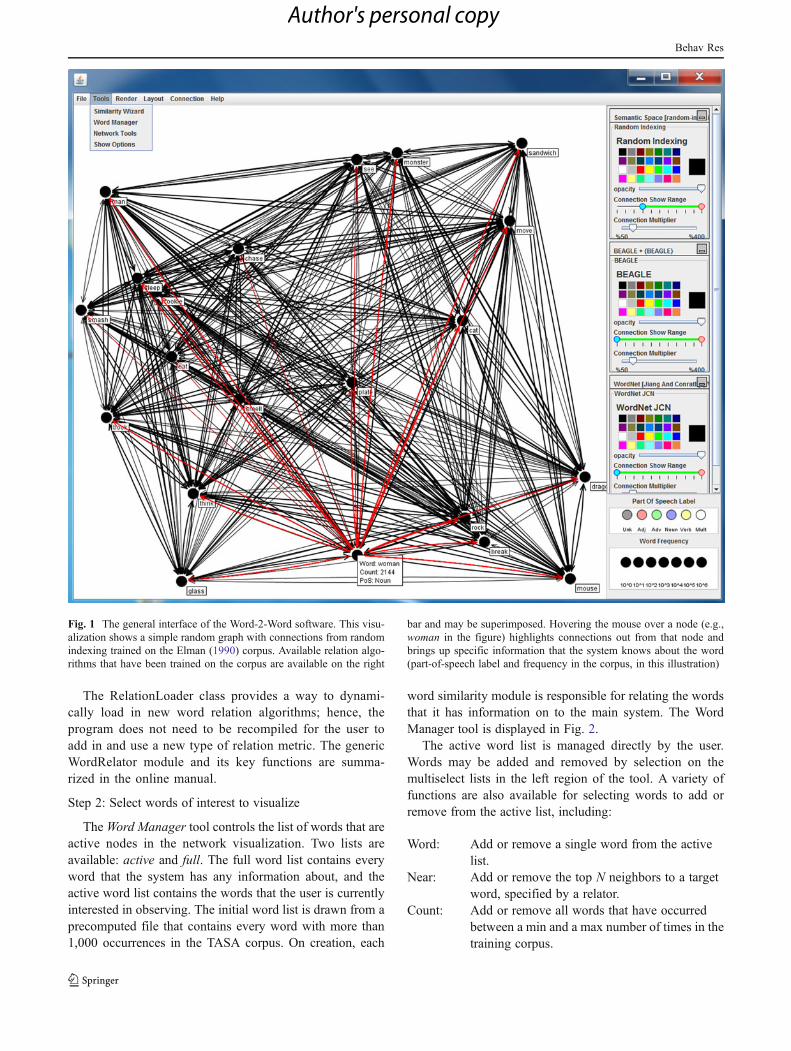
Figure 1 shows an overview of the Word-2-Word inter-face. In our initial demonstrations, we will use a corpus oftext created by using Elman’s (1990) classic artificial lan-guage. The language is generated by a probabilistic gram-mar so as to contain two- and three-word “sentences”intended for training language-learning models. The gener-ated sentences are of the form “Man eat sandwich. Cat chasemouse. Woman think.” and so on. A sample corpus contain-ing 1,000 sentences generated from the Elman languagemay be downloaded at www.indiana.edu/~clcl/Data/Elman_Corpus.txt. Figure 1 shows the main network visu-alization of the 21 words from the Elman corpus. Therightmost panel controls display of the various similaritymetrics that were trained on the corpus and controls thedisplay characteristics currently set for the word nodes(e.g., colored by parts of speech or node size relative tofrequency). The user must go through three basic steps: traina similarity metric, select words of interest, and lay out the
display. We will demonstrate each of the steps using theexample of visualizing structure in the Elman corpus. Atutorial for the Word-2-Word system is available at any timeunder the Help menu, and a video tutorial and visualizationexamples are also available on the website.
As the system starts, it attempts to load WordNet from thedefault directory. If unsuccessful, it prompts the user tospecify the path of the directory containing WordNet. Thesystem can still be run even if WordNet is not installed bysimply clicking on cancel, but only the corpus-based rela-tions will be available, with WordNet relations disabled. Aprebuilt list of high-frequency words from TASA come withpart-of-speech information included, but new words arelooked up in WordNet as needed (if it is available) todetermine parts of speech. The Word-2-Word installationinstructions contain directions on downloading and install-ing the latest version of WordNet.
Step 1: Select and train similarity relation(s)
The first step in creating a visualization is to specify andtrain one or more word relations from a text corpus. Select-ing the Similarity Wizard from the Tools menu brings up adialogue box containing the available relational modules. Arelational module is a software chunk with the primaryfunction of returning a rating between 0 and 1 for any givenpair of words. Each relation is composed of a basic algo-rithm with parameters that are specified by the user. Userscan select a relation algorithm, choose options for thatalgorithm, and then train it on data from multiple sources.
Relation modules are written as Java classes that extendthe WordRelator object. Each module specifies a name,color, and other information relevant for rendering connec-tions. Global word count information is updated when the“learn” function is called. The various relation algorithmsavailable are either explicitly coded into Word-2-Word oruse resources from the WordNet (Miller, 1995) or S-Space(Jurgens & Stevens, 2010) packages. There are currently 22word relation algorithms available in Word-2-Word.
Each of the corpus-based relations can be trained on user-specified text. Options are available to load a file, to load allfiles in a directory, to paste in text, or to simply specify theURL for a webpage on which to train the algorithm. Eachalgorithm also has functions for text cleaning. The selectedcleaning functions are applied before the text is learned, andin the order that they are specified. Available functionsinclude conversion to lowercase, removal of nonalphanu-meric characters, removal of Web tags, deletion of excesswhite space, and removal of the standard TASA stop-listfunction words. When a relation has been trained, its optionsthen appear in the relations bar on the right of the screen.Note that there will still be no visualization displayed untilthe words of interest (nodes) are specified for graphing inthe Word Manager (Step 2 below).
Behav Res
Author's personal copy
The RelationLoader class provides a way to dynami-cally load in new word relation algorithms; hence, theprogram does not need to be recompiled for the user toadd in and use a new type of relation metric. The genericWordRelator module and its key functions are summa-rized in the online manual.
Step 2: Select words of interest to visualize
TheWord Manager tool controls the list of words that areactive nodes in the network visualization. Two lists areavailable: active and full. The full word list contains everyword that the system has any information about, and theactive word list contains the words that the user is currentlyinterested in observing. The initial word list is drawn from aprecomputed file that contains every word with more than1,000 occurrences in the TASA corpus. On creation, each
word similarity module is responsible for relating the wordsthat it has information on to the main system. The WordManager tool is displayed in Fig. 2.
The active word list is managed directly by the user.Words may be added and removed by selection on themultiselect lists in the left region of the tool. A variety offunctions are also available for selecting words to add orremove from the active list, including:
Word: Add or remove a single word from the activelist.
Near: Add or remove the top N neighbors to a targetword, specified by a relator.
Count: Add or remove all words that have occurredbetween a min and a max number of times in thetraining corpus.
Fig. 1 The general interface of the Word-2-Word software. This visu-alization shows a simple random graph with connections from randomindexing trained on the Elman (1990) corpus. Available relation algo-rithms that have been trained on the corpus are available on the right
bar and may be superimposed. Hovering the mouse over a node (e.g.,woman in the figure) highlights connections out from that node andbrings up specific information that the system knows about the word(part-of-speech label and frequency in the corpus, in this illustration)
Behav Res
Author's personal copy
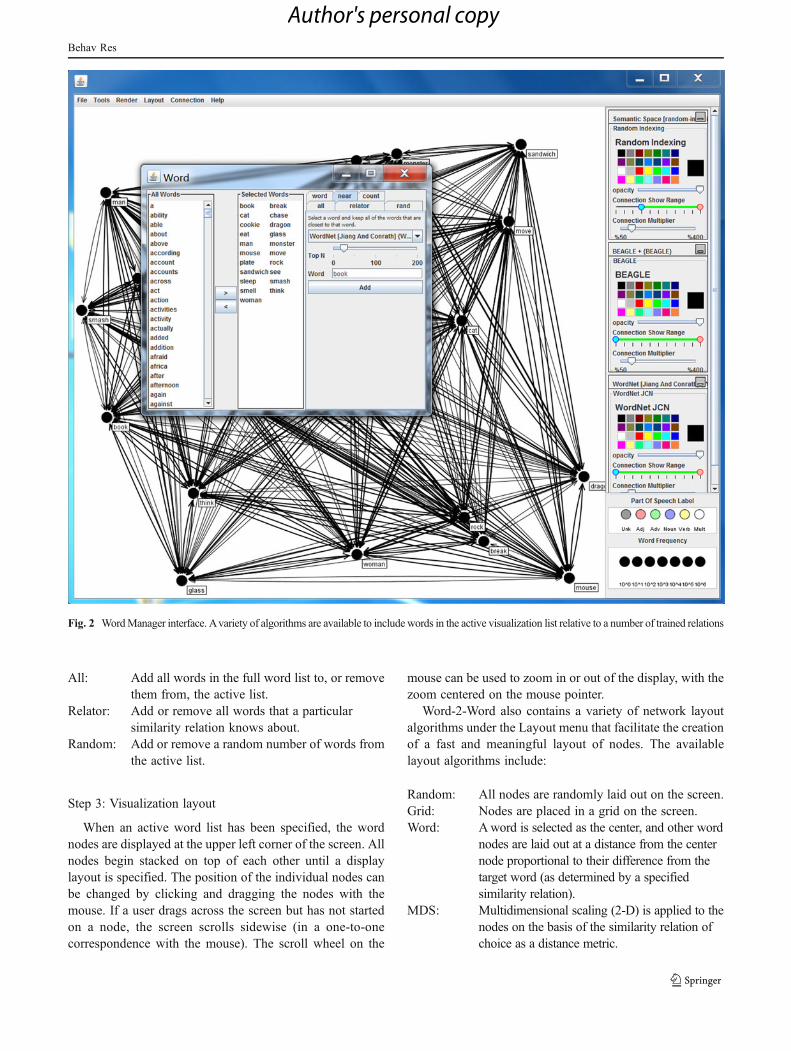
All: Add all words in the full word list to, or removethem from, the active list.
Relator: Add or remove all words that a particularsimilarity relation knows about.
Random: Add or remove a random number of words fromthe active list.
Step 3: Visualization layout
When an active word list has been specified, the wordnodes are displayed at the upper left corner of the screen. Allnodes begin stacked on top of each other until a displaylayout is specified. The position of the individual nodes canbe changed by clicking and dragging the nodes with themouse. If a user drags across the screen but has not startedon a node, the screen scrolls sidewise (in a one-to-onecorrespondence with the mouse). The scroll wheel on the
mouse can be used to zoom in or out of the display, with thezoom centered on the mouse pointer.
Word-2-Word also contains a variety of network layoutalgorithms under the Layout menu that facilitate the creationof a fast and meaningful layout of nodes. The availablelayout algorithms include:
Random: All nodes are randomly laid out on the screen.Grid: Nodes are placed in a grid on the screen.Word: Aword is selected as the center, and other word
nodes are laid out at a distance from the centernode proportional to their difference from thetarget word (as determined by a specifiedsimilarity relation).
MDS: Multidimensional scaling (2-D) is applied to thenodes on the basis of the similarity relation ofchoice as a distance metric.
Fig. 2 WordManager interface. Avariety of algorithms are available to include words in the active visualization list relative to a number of trained relations
Behav Res
Author's personal copy

Fit Screen: Nodes are translated and scaled to keep theirproportional distances but to maximize use ofthe available screen.
3D: Allows three-dimensional versions of the abovelayout options, with the z-dimension determinedby a selected similarity relator.
A variety of network statistics may be computed on thevisualization (with the current parameter set) using the Net-work Tools dialogue. Word-2-Word’s network tools allowthe user to efficiently compute the minimum or absolutepath length between any two words in the network. It alsoallows for minimum and maximum discrepancy computa-tions and for basic full-network statistics (e.g., average
distance or percent connectivity). These functions allowthe user to interpret difficult visualizations for small-worldstructure (Steyvers & Tenenbaum, 2005) and to identifyhubs and paths through the text data across relationalcomparisons.
Figure 3 shows a visualization of multiple measurestrained on the Elman (1990) corpus. The layout was se-lected with MDS based on the Random Indexing metric(Sahlgren, 2005; Sahlgren, Holst, & Kanerva, 2008);hence, nodes are positioned spatially relative to their sim-ilarity, as learned by the Random Indexing algorithm. Asthe figure shows, words that may appear in the same rolesare positioned proximal to one another. For example, in thealgorithm used to generate the Elman sentences, man and
Fig. 3 Visualizing multiple relations from the Elman (1990) corpus.Nodes are scaled relative to log frequency in the corpus and arespatially positioned with the MDS layout to reflect similarity learnedby random indexing. Blue connections are direct adjacencies, and red
connections are nonadjacent dependencies, both as learned by the n-gram function. The visualization has essentially recovered and com-municated the generating function used to create the corpus
Behav Res
Author's personal copy

Fig. 4 Overall layout of words from the CHILDES corpus
Fig. 5 MDS layout of words from the CHILDES corpus. Proximity is based on temporal similarity, as learned by the BEAGLE model
Behav Res
Author's personal copy
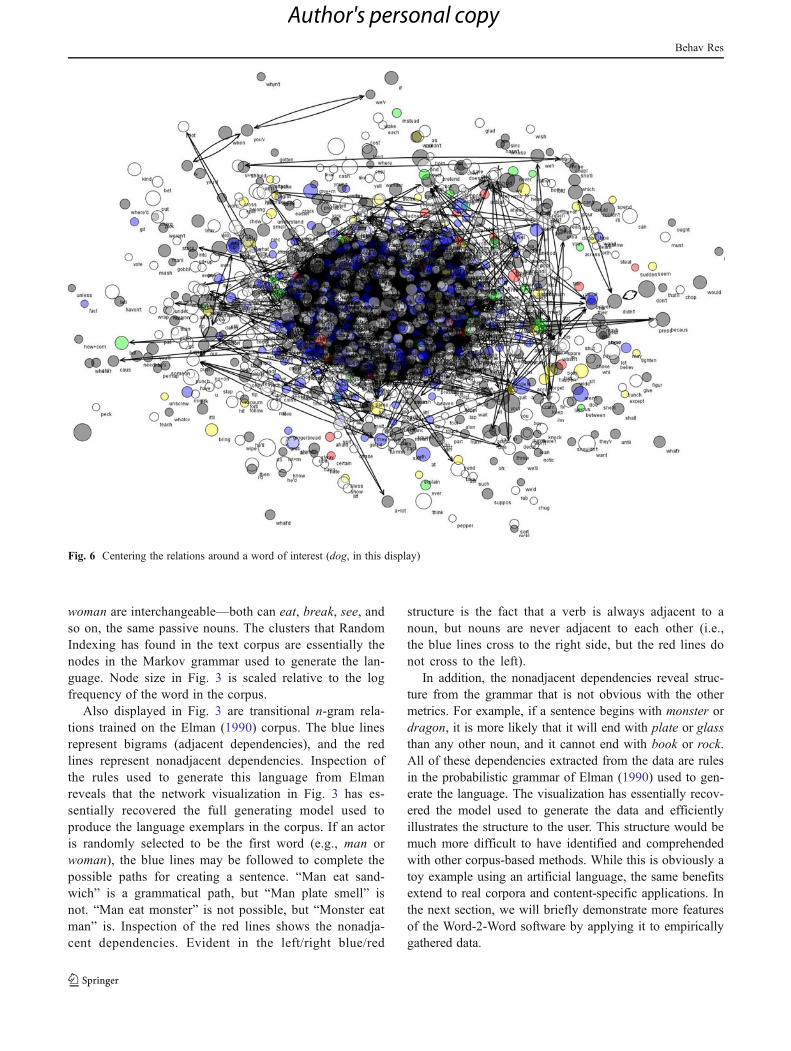
woman are interchangeable—both can eat, break, see, andso on, the same passive nouns. The clusters that RandomIndexing has found in the text corpus are essentially thenodes in the Markov grammar used to generate the lan-guage. Node size in Fig. 3 is scaled relative to the logfrequency of the word in the corpus.
Also displayed in Fig. 3 are transitional n-gram rela-tions trained on the Elman (1990) corpus. The blue linesrepresent bigrams (adjacent dependencies), and the redlines represent nonadjacent dependencies. Inspection ofthe rules used to generate this language from Elmanreveals that the network visualization in Fig. 3 has es-sentially recovered the full generating model used toproduce the language exemplars in the corpus. If an actoris randomly selected to be the first word (e.g., man orwoman), the blue lines may be followed to complete thepossible paths for creating a sentence. “Man eat sand-wich” is a grammatical path, but “Man plate smell” isnot. “Man eat monster” is not possible, but “Monster eatman” is. Inspection of the red lines shows the nonadja-cent dependencies. Evident in the left/right blue/red
structure is the fact that a verb is always adjacent to anoun, but nouns are never adjacent to each other (i.e.,the blue lines cross to the right side, but the red lines donot cross to the left).
In addition, the nonadjacent dependencies reveal struc-ture from the grammar that is not obvious with the othermetrics. For example, if a sentence begins with monster ordragon, it is more likely that it will end with plate or glassthan any other noun, and it cannot end with book or rock.All of these dependencies extracted from the data are rulesin the probabilistic grammar of Elman (1990) used to gen-erate the language. The visualization has essentially recov-ered the model used to generate the data and efficientlyillustrates the structure to the user. This structure would bemuch more difficult to have identified and comprehendedwith other corpus-based methods. While this is obviously atoy example using an artificial language, the same benefitsextend to real corpora and content-specific applications. Inthe next section, we will briefly demonstrate more featuresof the Word-2-Word software by applying it to empiricallygathered data.
Fig. 6 Centering the relations around a word of interest (dog, in this display)
Behav Res
Author's personal copy

Demonstrations of visual structure
CHILDES corpus
One of the most widely used corpora to explore lexicaldevelopment is the CHILDES corpus from the Child Lan-guage Data Exchange System (MacWhinney, 2000). Thecorpus was created by recording and transcribing child-directed speech. While there are tools for exploring frequentn-grams in the system, the rich body of knowledge about thelinguistic environment that children are exposed to is verydifficult to navigate. We used Word-2-Word to train thecontext- and order-learning mechanisms of the BEAGLEmodel (Jones & Mewhort, 2007), as research has suggestedthat two learning mechanisms are necessary for creating thesemantic structure of the human lexicon: a Hebbian-typecontextual co-occurrence mechanism and a temporal asso-ciation mechanism (Andrews et al. 2009; Jones et al., 2006).
Word-2-Word was trained on a version of the CHILDEScorpus containing child-directed speech between the ages ofbirth and four years of age (the corpus used in Riordan &Jones, 2007). The corpus was preprocessed to the rootlexical forms using the Snowball stemmer (Porter &
Boulton, 2006). Figure 4 plots all words occurring at least100 times in the corpus in a random layout, with nodescolored according to part-of-speech label from WordNetand node size relative to the word’s log frequency in thecorpus. Due to the large number of nodes, the system hassuppressed plotting the connections (the connections can beforced by clicking on “Render Once” from the Rendermenu, but this would simply color the entire display black,since no connection threshold has been set). The second stepin our exploration is to run an MDS rendering of the net-work with node locations relative to similarity, as learned bythe temporal-learning mechanism of BEAGLE. This render-ing is illustrated in Fig. 5. The remaining connections are theparticularly strong ones, as learned by the context-learningmechanism. The first pattern that becomes obvious is thatthe associative learning mechanism has course lexical clas-ses at a very broad level, roughly learning a distinctionbetween nouns, verbs, and adjectives.
In Fig. 6, we have selected a particular word of interest,dog, and organized the entire space in a word-centeredlayout around the dog node. Figure 6 is simply a replottingof the same information from Fig. 5 in a word-centeredlayout by specifying the center of interest. Next, we simply
Fig. 7 Zooming in to the center of the dog neighborhood
Behav Res
Author's personal copy

zoom in on the center of Fig. 5 using the mouse track wheel(alternatively, we could have changed the active word list tobe nearest neighbors to dog in order space using the WordManager tool). This “dog-centered” zoom view is shown inFig. 7. The model has learned local structure around dogconsisting of many similar animals that would share a lin-guistic role similar to that of dog in the language instancesof child-directed speech. At this level, the visualization issimilar to observing nearest neighbors in a corpus-basedmodel, which we have criticized earlier.
Note, however, that a second kind of similarity has beenlearned by the other mechanism and is contained in the con-nections. By hovering the mouse over the dog node, all of theoutgoing connections learned by the context-learning mecha-nism are highlighted and may be followed. One particularlystrong connection leads far off to another region of the space,ending at the node for bow+wow. Figure 8 follows thisconnection from dog to bow+wow and then shows the simi-larity space around bow+wow learned by the order mecha-nism. Bow+wow is closely clustered with other expressionsfrom the corpus, including several other onomatopoeias. Al-though thank+you is wildly different from dog by one of themetrics, it is quite related when both are considered. Thank+you is related to bow+wow in child-directed speech, which is
in turn related to dog. In addition to being close in the localregion learned by the temporal mechanism, dog and cat have alatent loop—their associative connections (ruff andmeow) arealso close to each other.
The path length network tool can be used in this fashionto select stimuli for experiments that are related under onemodel but not another, and the visualization can be “surfed”to understand different types of relationships (e.g., thedifficult-to-create mediated relations in semantic priming;Balota & Lorch, 1986; McNamara & Altarriba, 1988) thatare otherwise difficult to locate.
Comparing corpora: Obama versus Bush State of the Unionaddresses
A useful application of visualization techniques is exploringthe differences in semantic structure between different corporalearned under a single model. Network displays can helpresearchers to quickly identify how the same words in differ-ent corpora are composed to represent semantic componentsof authors or topics, focusing in on the important relations sothey may be evaluated with additional techniques. Exampleapplication domains include legal transcripts, patent white-papers, and biomedical articles, as well as issues in humanities
Fig. 8 Following the associative connection from dog to the bow+wow neighborhood
Behav Res
Author's personal copy

Fig. 10 Superimposing the BEAGLE relations learned from content in the Bush (red) and Obama (blue) State of the Union addresses
Fig. 9 Top content words from the Bush and Obama State of the Union addresses, with position plotted on the basis of multidimensional scaling ofBEAGLE, trained from Wikipedia
Behav Res
Author's personal copy
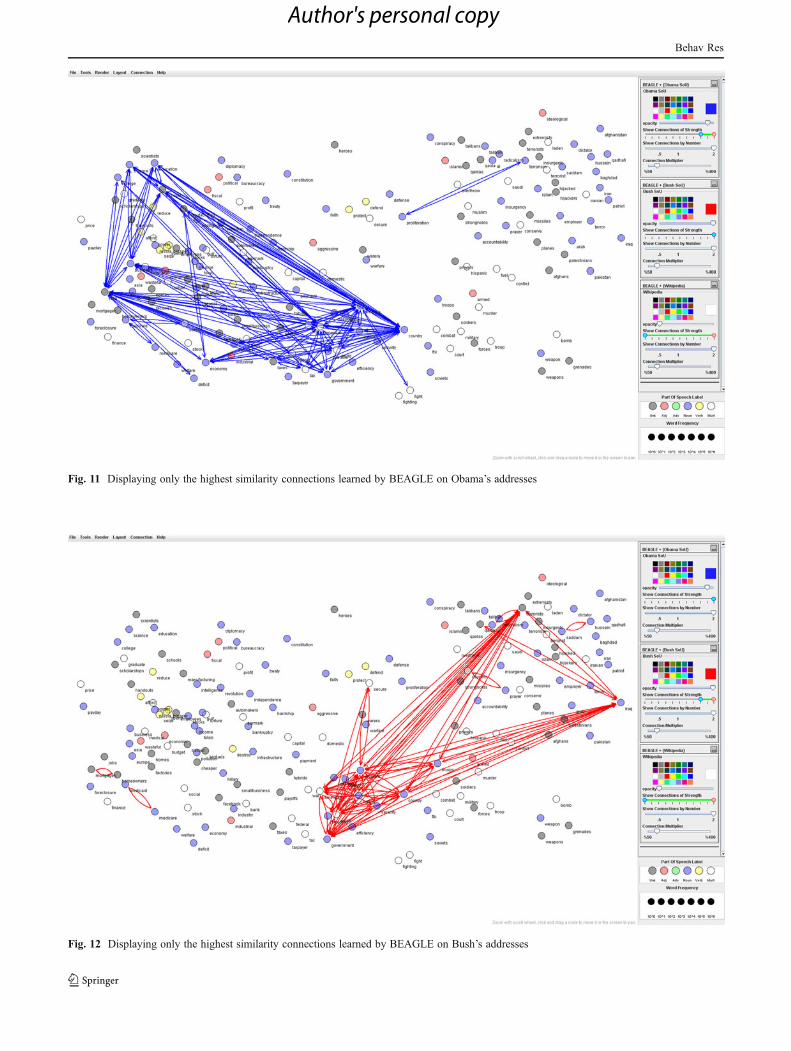
Fig. 11 Displaying only the highest similarity connections learned by BEAGLE on Obama’s addresses
Fig. 12 Displaying only the highest similarity connections learned by BEAGLE on Bush’s addresses
Behav Res
Author's personal copy

such as differences between genres. As a demonstration, weused Word-2-Word to visualize the differences in word rela-tions between the State of the Union addresses by PresidentsBush and Obama (all years together). These two data sets wereselected because certain semantic components would beexpected to differ between them due to different topics ofrelevance between the two time periods, and potentially asmaller difference due to the presidents themselves.
Using the Similarity Wizard, we trained BEAGLE sepa-rately on the full transcripts of both sets of State of the Unionaddresses. The 80 content words (after applying the stop list)most frequent across the two sets of addresses as a whole wereselected to compose our active list of words. Figure 9 showsthe target words arranged in an MDS based on their similarityin Wikipedia as learned by BEAGLE. This arrangement es-sentially shows the generic semantic similarity among theitems without any consideration of how they are used in eitherState of the Union address. Moving from left to right, thereseems to be a general transition in themes from education andthe economy, on the left, to general nation and security con-cepts, in the center, to terrorism and war concepts, on the right.It is important to note that the bulk of the words occurred inboth addresses.
Figure 10 shows the same layout, but with the similarityrelations learned byBEAGLE from the Bush (red) and Obama(blue) addresses, applying a threshold rule. Immediately ob-vious is the large-scale semantic differences between the two
presidents. The Bush-era addresses seem to be most heavilyweighted on the right side of the plot, while the Obama-eraaddresses have the greatest density on the left, with the twosharing conceptual connections in the center.
Figure 11 shows only the highest connections in theObama semantic space, and Fig. 12 show the highest con-nections in the Bush semantic space. Obama’s addressesfollow an overall semantic connectedness of economic andeducational themes, whereas Bush’s addresses show muchstronger connections between Iraq, war, and terrorism con-cepts. Hubs that connect the two presidential addresses arein generic government and security terms. However, forBush security is most tightly connected to ideas of militaryand national security, but for Obama the node is most tightlyconnected to jobs and the economy (Fig. 13). While thesepatterns could eventually emerge from studying lists ofnearest neighbors or similarity matrices, manipulating thenetwork visualization makes the overall structure readilyapparent. The researcher can then zoom in on particularneighborhoods or use the network distance tools (e.g., short-est path length) to better understand the fine-grained differ-ences between the two corpora.
Importing noncorpus similarity data
The WordRelator is a Java class object that allows usersflexibility to import their own similarity metrics for words or
Fig. 13 Displaying the out connections from the term security shared across both the Bush and Obama spaces
Behav Res
Author's personal copy
new corpus-based algorithms to the Word-2-Word system.This allows for visualizations to be made of external data(e.g., human ratings), WordNet metrics, and corpus-basedrelations all together in the system, to explore how thevarious measures overlap or to account for unique relations.
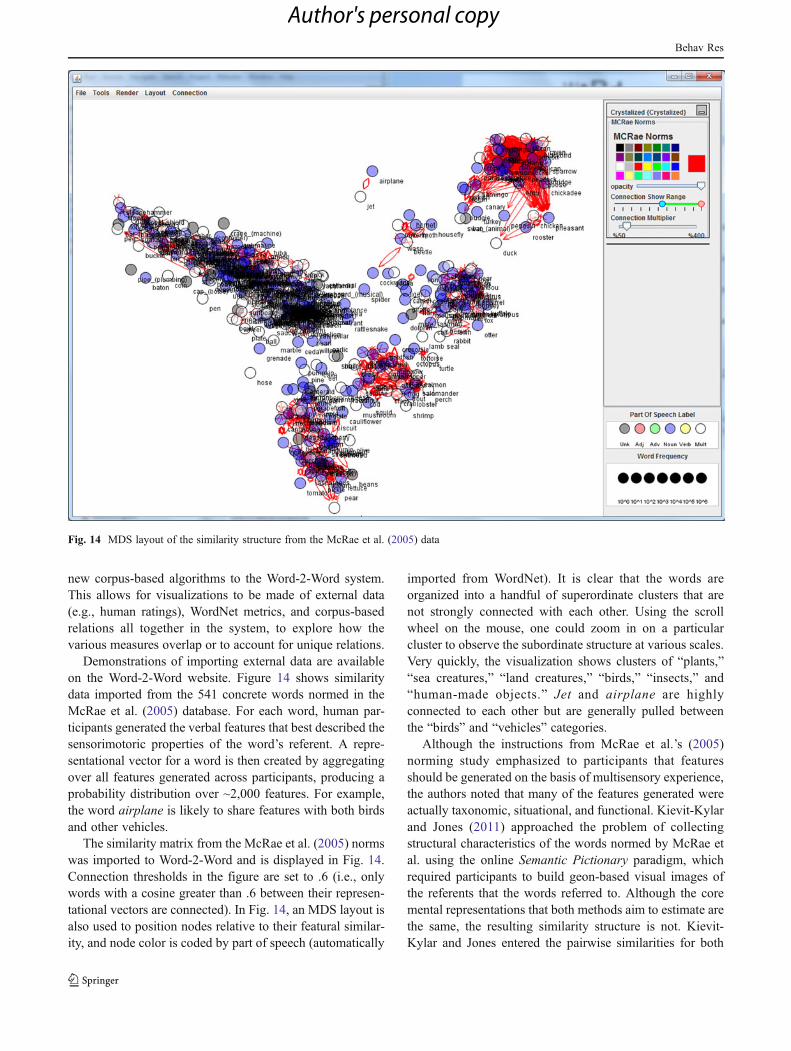
Demonstrations of importing external data are availableon the Word-2-Word website. Figure 14 shows similaritydata imported from the 541 concrete words normed in theMcRae et al. (2005) database. For each word, human par-ticipants generated the verbal features that best described thesensorimotoric properties of the word’s referent. A repre-sentational vector for a word is then created by aggregatingover all features generated across participants, producing aprobability distribution over ~2,000 features. For example,the word airplane is likely to share features with both birdsand other vehicles.
The similarity matrix from the McRae et al. (2005) normswas imported to Word-2-Word and is displayed in Fig. 14.Connection thresholds in the figure are set to .6 (i.e., onlywords with a cosine greater than .6 between their represen-tational vectors are connected). In Fig. 14, an MDS layout isalso used to position nodes relative to their featural similar-ity, and node color is coded by part of speech (automatically
imported from WordNet). It is clear that the words areorganized into a handful of superordinate clusters that arenot strongly connected with each other. Using the scrollwheel on the mouse, one could zoom in on a particularcluster to observe the subordinate structure at various scales.Very quickly, the visualization shows clusters of “plants,”“sea creatures,” “land creatures,” “birds,” “insects,” and“human-made objects.” Jet and airplane are highlyconnected to each other but are generally pulled betweenthe “birds” and “vehicles” categories.
Although the instructions from McRae et al.’s (2005)norming study emphasized to participants that featuresshould be generated on the basis of multisensory experience,the authors noted that many of the features generated wereactually taxonomic, situational, and functional. Kievit-Kylarand Jones (2011) approached the problem of collectingstructural characteristics of the words normed by McRae etal. using the online Semantic Pictionary paradigm, whichrequired participants to build geon-based visual images ofthe referents that the words referred to. Although the coremental representations that both methods aim to estimate arethe same, the resulting similarity structure is not. Kievit-Kylar and Jones entered the pairwise similarities for both
Fig. 14 MDS layout of the similarity structure from the McRae et al. (2005) data
Behav Res
Author's personal copy

methods and a corpus-based similarity metric—a hierarchi-cal regression predicting human similarity judgments. Theyfound that all three metrics predicted significant uniquevariance in the judgment data. However, it is very difficultto get an intuitive understanding of why—what aspects ofmental similarity structure are captured by one method thatare not captured by the other?
Figure 15 superimposes the similarity relations from thegeon-based images of the words (Kievit-Kylar & Jones,2011) onto the visualization of the McRae et al. (2005) datafrom Fig. 14. Immediately obvious in the visualization isthat many similarity relations seen by the new metric wereinvisible to the original metric based only on featural simi-larity. Some of this structure is responsible for the uniquevariance predicted in the human judgments.
Zooming around the visualization gives a good intuitivepicture of the new structure. Although both measures agreeon most of the similarity variance, the metric from geon-based structural images for the words picks up on similari-ties between shape structure, color, material, symmetry/asymmetry, and internal consistency that are not found inthe McRae et al. (2005) norms. That is not to say that
humans do not know that a pickle is similar to a grasshopperin that the are both primarily green horizontal ovals, butsimply that people do not generate this information whenlisting verbal features. However, this type of information iscertainly important in human representation (e.g., the wordpizza primes coin because of the shape similarity of theirreferents; Pecher, Zeelenberg, & Raaijmakers, 1998) and isbecoming core to embodied theories of lexical representa-tion (Barsalou, 2008). This nonoverlapping structure is easyto discover with a visualization tool but is very difficult todiscover with the original regression-based analysis. Theregression simply allows us to say that both similarity met-rics have unique predictive variance, but without an intuitiveunderstanding of the qualitative reason.
Obtaining the software
The Word-2-Word visualization package is proposed as anefficient method for exploring lexical similarity structure intext and other data sources, to be used in concert with otherconfirmatory techniques. The tool can be used to explorestructure in any user-defined text corpus and may also be
Fig. 15 Overlaying similarity from geon-based representations (Kievit-Kylar & Jones, 2011) onto the McRae et al. (2005) similarity data. Thestrong connections between nodes that are not spatially proximal shows the difference in structure between the two metrics
Behav Res
Author's personal copy

used to understand how manipulation of parameter settingsaffects output similarity structure when developing newcorpus-based models. The system allows users to importtheir own similarity metrics and rating data without requir-ing them to recompile.
The Word-2-Word software is open source. The execut-able and Java source code may be downloaded at www.in-diana.edu/~semantic/word2word. This website also containsinstallation instructions, tutorial videos, sample visualiza-tions, and additional similarity data summarized in thisarticle. The system runs best on a PC with Java version1.6 and WordNet 2.1 installed. A version is also availablefor older versions of Java and will run on a Mac, but withreduced functionality (and without WordNet). Hence, westrongly recommend that the Word-2-Word software berun in a Microsoft Windows environment.
Author note This research was supported by a grant from GoogleResearch and by NSF Grant No. BCS-1056744 to M.N.J. B.K. won theCastellan Award for Best Student Paper from the Society for Com-puters in Psychology for his contribution.
References
Andrews, M., Vigliocco, G., & Vinson, D. (2009). Integrating experi-ential and distributional data to learn semantic representations.Psychological Review, 116, 463–498. doi:10.1037/a0016261
Balota, D. A., & Lorch, R. F. (1986). Depth of automatic spreadingactivation: Mediated priming effects in pronunciation but not inlexical decision. Journal of Experimental Psychology: Learning,Memory, and Cognition, 12, 336–345. doi:10.1037/0278-7393.12.3.336
Baroni, M., & Lenci, A. (2010). Distributional memory: A generalframework for corpus-based semantics. Computational Linguis-tics, 36, 673–721. doi:10.1162/coli_a_00016
Barsalou, L. W. (2008). Grounding symbolic operations in the brain’smodal systems. In G. R. Sermin & E. R. Smith (Eds.), Embodiedgrounding: Social, cognitive, affective, and neuroscientificapproaches (pp. 9–42). New York: Cambridge University Press.
Battig, W. F., & Montague, W. E. (1969). Category norms of verbalitems in 56 categories: A replication and extension of the Con-necticut category norms. Journal of Experimental Psychology, 80(3, Pt. 2), 1–46. doi:10.1037/h0027577
Börner, K., Chen, C., & Boyack, K. W. (2003). Visualizing knowledgedomains. Annual Review of Information Science and Technology,37, 179–255.
Bullinaria, J. A., & Levy, J. P. (2007). Extracting semantic representa-tions from word co-occurrence statistics: A computational study.Behavior Research Methods, 39, 510–526. doi:10.3758/BF03193020
Busemeyer, J. R., & Diedrich, A. (2010). Cognitive modeling. Thou-sand Oaks: Sage.
Card, S. K., Mackinlay, J. D., & Shneiderman, B. (1999). Readings ininformation visualization: Using vision to think. San Francisco:Morgan Kaufmann.
Chen, C. (1999). Information visualisation and virtual environments.Berlin: Springer.
Elman, J. L. (1990). Finding structure in time. Cognitive Science, 14,179–211. doi:10.1207/s15516709cog1402_1
Fellbaum, C. (1998). WordNet: An electronic lexical database.Cambridge: MIT Press.
Foltz, P. W., Britt, M. A., & Perfetti, C. A. (1996). Reasoning frommultiple texts: An automatic analysis of readers’ situation models.In G. W. Cottrell (Ed.), Proceedings of the 18th Annual Conferenceof the Cognitive Science Society (pp. 110–115). Mahwah: Erlbaum.
Friendly, M. (2008). A brief history of data visualization. New York:Springer.
Gershon, N., Eick, S. G., & Card, S. (1998). Information visualization.Interactions, 5(2), 9–15.
González, V., & Kobsa, A. (2003). Benefits of information visualiza-tion systems for administrative data analysts. In Proceedings ofthe Seventh International Conference on Information Visualiza-tion (pp. 331–336). Los Alamitos, CA: IEEE Press.
Gorman, J. C., Foltz, P. W., Kieke, P. A., Martin, M. J., & Cooke, N. J.(2003). Evaluation of latent semantic analysis–based measures ofteam communications content. In Proceedings of the HumanFactors and Ergonomics Society Annual Meeting October 2003(Vol. 47, pp. 424–428). Santa Monica, CA: Human Factors andErgonomics Society.
Graesser, A. C., McNamara, D. S., Louwerse, M. M., & Cai, Z. (2004).Coh-Metrix: Analysis of text on cohesion and language. BehaviorResearch Methods, Instruments, & Computers, 36, 193–202.doi:10.3758/BF03195564
Griffiths, T. L., Steyvers, M., & Tenenbaum, J. B. (2007). Topics insemantic representation. Psychological Review, 114, 211–244.doi:10.1037/0033-295X.114.2.211
Harris, Z. S. (1970). Papers in structural and transformational linguistics(Formal Linguistics Series, Vol. 1). New York: Humanities Press.
Holtzman, N. S., Schott, J. P., Jones, M. N., Balota, D. A., & Yarkoni,T. (2011). Exploring media bias with semantic analysis tools:Validation of the Contrast Analysis of Semantic Similarity(CASS). Behavior Research Methods, 43, 193–200.doi:10.3758/s13428-010-0026-z
Hu, X., Cai, Z., Graesser, A. C., & Ventura, M. (2005). Similaritybetween semantic spaces. In B. G. Bara, L. Barsalou, &M. Bucciar-elli (Eds.), Proceedings of the 27th Annual Conference of the Cog-nitive Science Society (pp. 995–1000). Hillsdale: Erlbaum.
Hughes, T., Hughes, C., & Lazar, A. (2008). Epistemic structuredrepresentation for legal transcript analysis. Advances in Computerand Information Sciences and Engineering, 101–107.
Hutchison, K. A., Balota, D. A., Cortese, M. J., & Watson, J. M.(2008). Predicting semantic priming at the item level. QuarterlyJournal of Experimental Psychology, 61, 1036–1066.doi:10.1080/17470210701438111
Johns, B. T., & Jones, M. N. (2010). Evaluating the random representa-tion assumption of lexical semantics in cognitive models. Psycho-nomic Bulletin & Review, 17, 662–672. doi:10.3758/PBR.17.5.662
Jones, M. N., & Mewhort, D. J. K. (2007). Representing word meaningand order information in a composite holographic lexicon. Psy-chological Review, 114, 1–37. doi:10.1037/0033-295X.114.1.1
Jones, M. N., & Recchia, G. L. (2010). You can’t wear a coat rack: Abinding framework to avoid illusory feature migrations in perceptu-ally grounded semantic models. In S. Ohlsson & R. Catrambone(Eds.), Proceedings of the 32nd Annual Meeting of the CognitiveScience Society (pp. 877–882). Austin: Cognitive Science Society.
Jones, M. N., Kintsch, W., & Mewhort, D. J. K. (2006). High-dimensional semantic space accounts of priming. Journal ofMemory and Language, 55, 534–552.
Jones, M. N., Gruenenfelder, T. M., & Recchia, G. (2011). In defenseof spatial models of lexical semantics. In L. Carlson, C. Hölscher,& T. Shipley (Eds.), Proceedings of the 33rd Annual Conferenceof the Cognitive Science Society (pp. 3444–3449). Austin: Cog-nitive Science Society.
Jurgens, D., & Stevens, K. (2010). The S-Space package: An opensource package for word space models. In Proceedings of the ACL
Behav Res
Author's personal copy

2010 System Demonstrations (pp. 30–35). Washington, DC: As-sociation for Computational Linguistics.
Kievit-Kylar, B., & Jones, M. N. (2011). The semantic Pictionaryproject. In L. Carlson, C. Hölscher, & T. Shipley (Eds.), Proceed-ings of the 33rd Annual Conference of the Cognitive ScienceSociety (pp. 2229–2234). Austin: Cognitive Science Society.
Kintsch, W., & Mangalath, P. (2011). The construction of meaning.Topics in Cognitive Science, 3, 346–370. doi:10.1111/j.1756-8765.2010.01107.x
Landauer, T. K., & Dumais, S. T. (1997). A solution to Plato’s prob-lem: The latent semantic analysis theory of acquisition, induction,and representation of knowledge. Psychological Review, 104,211–240. doi:10.1037/0033-295X.104.2.211
Landauer, T. K., McNamara, D., Dennis, S., & Kintsch, W. (2007).Handbook of latent semantic analysis. Mahwah: Erlbaum.
Lewandowsky, S., & Farrell, S. (2011). Computational modeling incognition: Principles and practice. Thousand Oaks: Sage.
Lund, K., & Burgess, C. (1996). Producing high-dimensional semanticspaces from lexical co-occurrence. Behavior Research Methods,Instruments, & Computers, 28, 203–208. doi:10.3758/BF03204766
MacWhinney, B. (2000). The CHILDES project: Tools for analyzingtalk (3rd ed.). Mahwah: Erlbaum.
Maki, W. S., & Buchanan, E. (2008). Latent structure in measures ofassociative, semantic, and thematic knowledge. Psychonomic Bul-letin & Review, 15, 598–603. doi:10.3758/PBR.15.3.598
Maki, W. S., McKinley, L. N., & Thompson, A. G. (2004). Semanticdistance norms computed from an electronic dictionary(WordNet). Behavior Research Methods, Instruments, & Com-puters, 36, 421–431. doi:10.3758/BF03195590
McCarthy, P. M., & Boonthum-Denecke, C. (2011). Applied naturallanguage processing: Identification, investigation, and resolution.Hershey: IGI Global.
McCarthy, P. M., Graesser, A. C., & McNamara, D. S. (2006, July).Distinguishing genre using Coh-Metrix indices of cohesion. Paperpresented at the annual meeting of the Society for Text & Dis-course, Minneapolis, MN.
McNamara, T. P., & Altarriba, J. (1988). Depth of spreading activationrevisited: Semantic mediated priming occurs in lexical decisions.Journal of Memory and Language, 27, 545–559.
McRae, K., & Jones, M. N. (2012). Semantic memory. In D. Reisberg(Ed.), The Oxford handbook of cognitive psychology. New York,NY: Oxford University Press. (in press)
McRae, K., Cree, G. S., Seidenberg, M. S., & McNorgan, C. (2005).Semantic feature production norms for a large set of living andnonliving things. Behavior Research Methods, 37, 547–559.doi:10.3758/BF03192726
Miller, G. A. (1995). WordNet: An on-line lexical database. [Specialissue]. International Journal of Lexicography, 3.
Nelson, D. L., McEvoy, C. L., & Schreiber, T. A. (2004). The Univer-sity of South Florida free association, rhyme, and word fragmentnorms. Behavior Research Methods, Instruments, & Computers,36, 402–407. doi:10.3758/BF03195588
Olney, A. M. (2011). Large-scale latent semantic analysis. BehaviorResearch Methods, 43, 414–423. doi:10.3758/s13428-010-0050-z
Pecher, D., Zeelenberg, R., & Raaijmakers, J. G. W. (1998). Does pizzaprime coin? Perceptual priming in lexical decision and pronunci-ation. Journal of Memory and Language, 38, 401–418.doi:10.1006/jmla.1997.2557
Pedersen, T., Patwardhan, S., & Michelizzi, J. (2004). WordNet::sim-ilarity—Measuring the relatedness of concepts. In Proceedings ofthe 19th National Conference on Artificial Intelligence (pp. 144–152). Cambridge, MA: AAAI Press.
Pennebaker, J. W., & Chung, C. K. (2008). Computerized text analysisof Al-Qaeda transcripts. In K. Krippendorff & M. A. Bock (Eds.),A content analysis reader (pp. 453–465). Thousand Oaks: Sage.
Perfetti, C. A. (1998). The limits of co-occurrence: Tools and theoriesin language research. Discourse Processes, 25, 363–377.
Porter, M., & Boulton, R. (2006). Snowball stemmer [Computer soft-ware]. Authors.
Recchia, G., & Jones, M. N. (2009). More data trumps smarter algo-rithms: Comparing pointwise mutual information with latent se-mantic analysis. Behavior Research Methods, 41, 647–656.doi:10.3758/BRM.41.3.647
Riordan, B., & Jones, M. N. (2007). Comparing semantic space modelsusing child-directed speech. In D. S. McNamara & J. G. Trafton(Eds.), Proceedings of the 29th Conference of the CognitiveScience Society (pp. 599–604). Austin: Cognitive ScienceSociety.
Riordan, B., & Jones, M. N. (2011). Redundancy in perceptual andlinguistic experience: Comparing feature-based and distributionalmodels of semantic representation. Topics in Cognitive Science, 3,303–345. doi:10.1111/j.1756-8765.2010.01111.x
Rosch, E., & Mervis, C. B. (1975). Family resemblances: Studies in theinternal structure of categories. Cognitive Psychology, 7, 573–605. doi:10.1016/0010-0285(75)90024-9
Sahlgren, M. (2005, August). An introduction to random indexing.Paper presented at the Methods and Applications of SemanticIndexing Workshop at the 7th International Conference on Ter-minology and Knowledge Engineering, Copenhagen, Denmark.
Sahlgren, M., Holst, A., & Kanerva, P. (2008). Permutations as ameans to encode order in word space. In B. C. Love, K. McRae,& V. M. Sloutsky (Eds.), Proceedings of the 30th Annual Meetingof the Cognitive Science Society (pp. 1300–1305). Austin: Cog-nitive Science Society.
Spence, B. (2000). Information visualization. New York: Addison-Wesley.Sporns, O. (2011). The human connectome: A complex network. In
The year in cognitive neuroscience (Annals of the New YorkAcademy of Sciences, Vol. 1224, pp. 109–125). New York, NY:New York Academy of Sciences.
Sporns, O., Chialvo, D. R., Kaiser, M., & Hilgetag, C. C. (2004).Organization, development and function of complex brain net-works. Trends in Cognitive Sciences, 8, 418–425. doi:10.1016/j.tics.2004.07.008
Steyvers, M., & Tenenbaum, J. B. (2005). The large-scale structure ofsemantic networks: Statistical analyses and a model of semanticgrowth. Cognit ive Science, 29, 41–78. doi :10.1207/s15516709cog2901_3
Steyvers, M., Smyth, P., & Chemuduganta, C. (2011). Combiningbackground knowledge and learned topics. Topics in CognitiveScience, 3, 18–47. doi:10.1111/j.1756-8765.2010.01097.x
Stone, B., Dennis, S., & Kwantes, P. J. (2011). Comparing methods forsingle paragraph similarity analysis. Topics in Cognitive Science,3, 92–122. doi:10.1111/j.1756-8765.2010.01108.x
Thomas, J. J., & Cook, K. A. (2005). Illuminating the path: Theresearch and development agenda for visual analytics. Los Ala-mitos: IEEE Press.
Turney, P. D., & Pantel, P. (2010). From frequency to meaning: Vectorspace models of semantics. Journal of Artificial Intelligence Re-search, 37, 141–188.
Vinson, D. P., & Vigliocco, G. (2008). Semantic feature productionnorms for a large set of objects and events. Behavior ResearchMethods, 40, 183–190. doi:10.3758/BRM.40.1.183
Wasserman, S., & Faust, K. (1994). Social network analysis: Methodsand applications. New York: Cambridge University Press.
Widdows, D. (2004). Geometry and meaning. Stanford: Stanford Uni-versity, CSLI Publications.
Yarkoni, T., Poldrack, R. A., Nichols, T. E., Van Essen, D. C., &Wager, T. D. (2011). Large-scale automated synthesis of humanfunctional neuroimaging data. Nature Methods, 8, 665–670.doi:10.1038/nmeth.1635
Behav Res
Author's personal copy