Visualizing a Neo4j database with KeyLines - April 2015 is a robust, scalable native graph database,...
13
Visualizing a Neo4j Graph Database with KeyLines Introduction 2 What is a graph database? 2 What is Neo4j? 2 Why visualize Neo4j? 3 Visualization Architecture 4 Benefits of the KeyLines/Neo4j architecture 4 Getting started with KeyLines 5 Connecting your Neo4j database to KeyLines 5 Embed KeyLines in a web page 5 Querying your Neo4j database 7 Visualizing Dynamic Graphs 10 Example: A Neo4j / KeyLines demo 11 More information 13 Who should read this white paper? This white paper is aimed at: • Project managers and non-technical staff looking for a detailed introduction to visualizing data from a Titan graph database with KeyLines. • Developers and technical staff seeking a non- technical introduction to visualizing data from a Titan graph database with KeyLines. If you require more information we recommend contacting us to discuss your project.
Transcript of Visualizing a Neo4j database with KeyLines - April 2015 is a robust, scalable native graph database,...
Visualizing a Neo4j Graph Database with KeyLines
Introduction 2!What is a graph database? 2!What is Neo4j? 2!Why visualize Neo4j? 3!
Visualization Architecture 4!Benefits of the KeyLines/Neo4j architecture 4!
Getting started with KeyLines 5!Connecting your Neo4j database to KeyLines 5!Embed KeyLines in a web page 5!Querying your Neo4j database 7!Visualizing Dynamic Graphs 10!
Example: A Neo4j / KeyLines demo 11!More information 13!
Who should read this white paper?
This white paper is aimed at:
• Project managers and non-technical staff looking for a detailed introduction to
visualizing data from a Titan graph database with KeyLines.
• Developers and technical staff seeking a non- technical introduction to visualizing data
from a Titan graph database with KeyLines.
If you require more information we recommend contacting us to discuss your project.

Introduction
What is a graph database?
A graph database is a type of NoSQL data store that has been optimized for highly connected
data. They provide an efficient way to store graph data and are popular back-end options for
applications built using the KeyLines network visualization toolkit.
Storing connected data in a flat tabular format is time and resource intensive. A graph
database overcomes this limitation by storing and querying data in a graph format, i.e. as a
collection of objects and relationships – usually called nodes and edges – and properties.
When data is modeled in this way, we are able to traverse the graph, using a query, to obtain
answers to certain questions.
You can read more about different kinds of data stores on our website:
• Graph databases - http://keylines.com/graph-databases-data-visualization
• Relational databases - http://keylines.com/visualizing-relational-databases
• Other NoSQL data stores - http://keylines.com/visualizing-nosql-database
What is Neo4j?
Neo4j is a robust, scalable native graph database, developed by Neo Technologies. It is the
most widely used graph database in the world, with over a decade in production and more
than 1 million downloads. A variety of different licenses are available, ranging from a free
open source option to an enterprise subscription.
The Neo4j graph database includes its own graph query language (Cypher), a developer
workbench environment and a basic visualization tool known as the Neo4j browser:
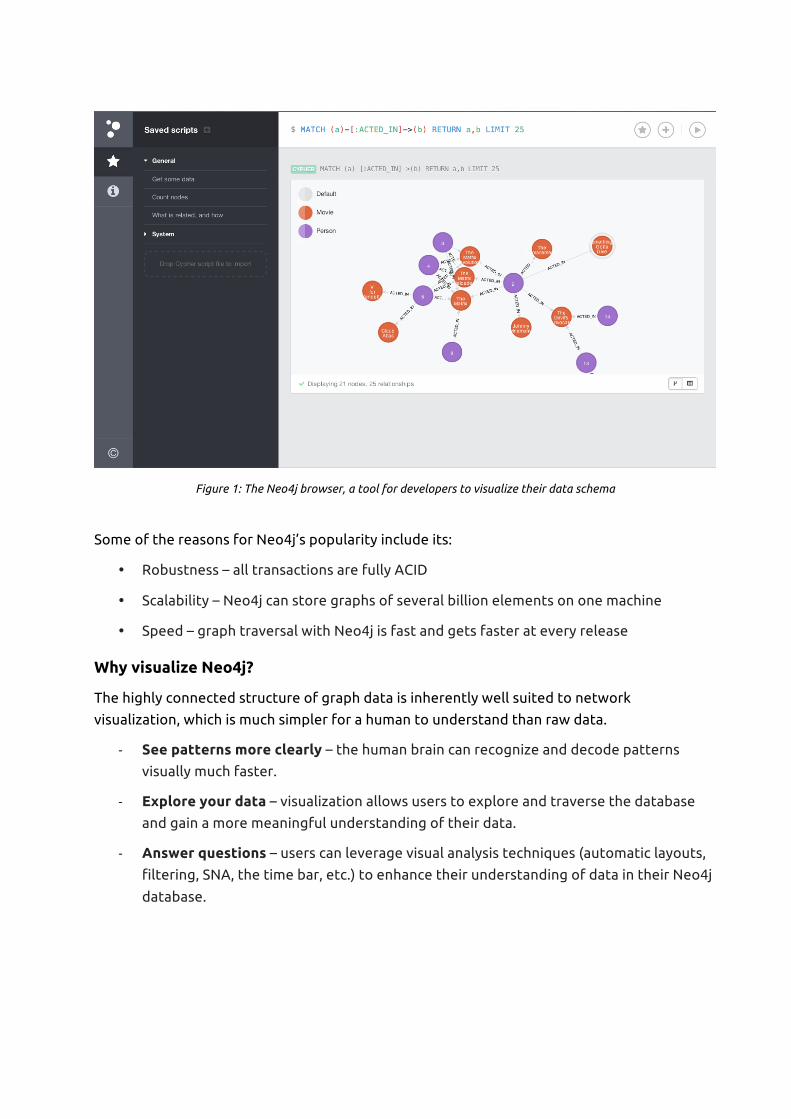
Figure 1: The Neo4j browser, a tool for developers to visualize their data schema
Some of the reasons for Neo4j’s popularity include its:
• Robustness – all transactions are fully ACID
• Scalability – Neo4j can store graphs of several billion elements on one machine
• Speed – graph traversal with Neo4j is fast and gets faster at every release
Why visualize Neo4j?
The highly connected structure of graph data is inherently well suited to network
visualization, which is much simpler for a human to understand than raw data.
" See patterns more clearly – the human brain can recognize and decode patterns
visually much faster.
" Explore your data – visualization allows users to explore and traverse the database
and gain a more meaningful understanding of their data.
" Answer questions – users can leverage visual analysis techniques (automatic layouts,
filtering, SNA, the time bar, etc.) to enhance their understanding of data in their Neo4j
database.
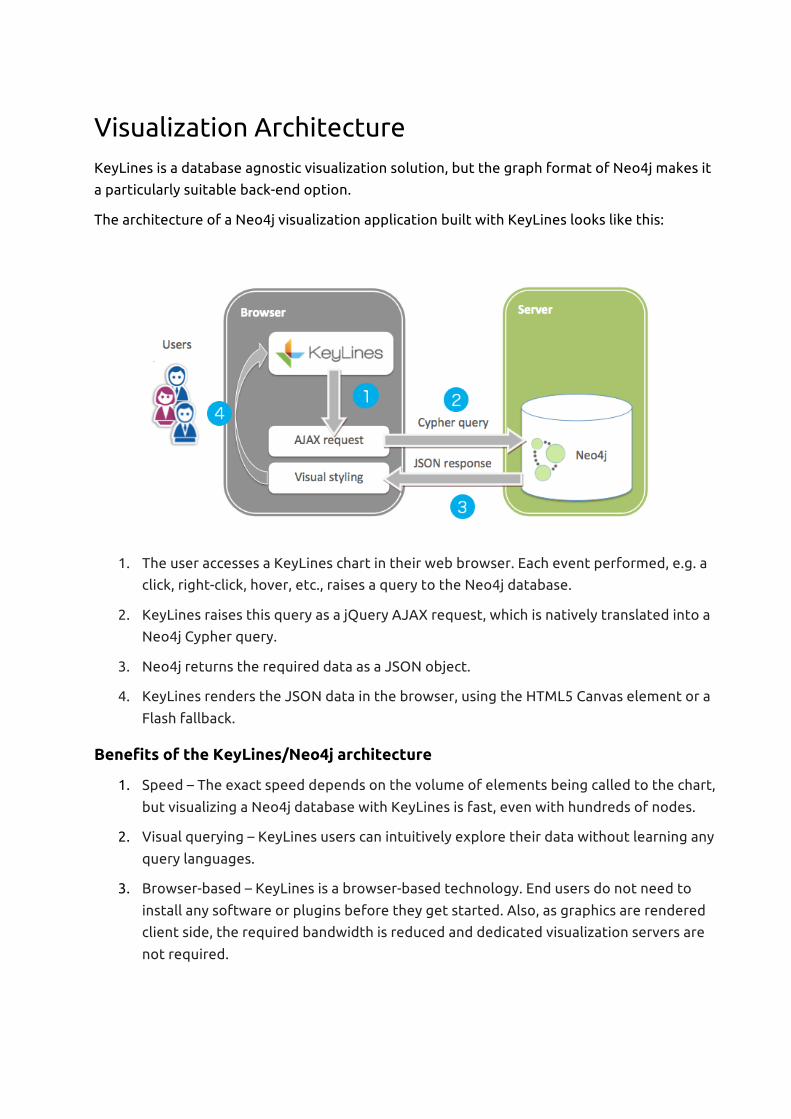
Visualization Architecture KeyLines is a database agnostic visualization solution, but the graph format of Neo4j makes it
a particularly suitable back-end option.
The architecture of a Neo4j visualization application built with KeyLines looks like this:
1. The user accesses a KeyLines chart in their web browser. Each event performed, e.g. a
click, right-click, hover, etc., raises a query to the Neo4j database.
2. KeyLines raises this query as a jQuery AJAX request, which is natively translated into a
Neo4j Cypher query.
3. Neo4j returns the required data as a JSON object.
4. KeyLines renders the JSON data in the browser, using the HTML5 Canvas element or a
Flash fallback.
Benefits of the KeyLines/Neo4j architecture
Speed – The exact speed depends on the volume of elements being called to the chart, 1.
but visualizing a Neo4j database with KeyLines is fast, even with hundreds of nodes.
Visual querying – KeyLines users can intuitively explore their data without learning any 2.
query languages.
Browser-based – KeyLines is a browser-based technology. End users do not need to 3.
install any software or plugins before they get started. Also, as graphics are rendered
client side, the required bandwidth is reduced and dedicated visualization servers are
not required.

Getting started with KeyLines
Before you can build your application, you will need to gain access to the KeyLines SDK site.
Email [email protected] to request login credentials.
Connecting your Neo4j database to KeyLines
Below we’ve summarized the generic steps that are involved to connect a Neo4j graph
database to KeyLines. It is almost trivially simple, but more information can be found in the
SDK site.
Download the Neo4j server files. These are all available from 1.
http://www.neo4j.org/download.
Install the Neo4j graph database as a server running on port 7474. 2.This should be automatic, but you can test the configuration is correct by navigating to
the following URL in Chrome or Firefox: http://localhost:7474/browser/.
This should give you a new empty database.
Configure your username and password, it will be required to interact with the REST 3.
interface later.
You should be able to call a REST interface running at 4.
http://localhost:7474/db/data/transaction/commit. This is how KeyLines submits
cypher queries, and how it receives the results as a JSON file. If you plan to send
multiple statements to the database we recommend omitting the final “/commit”.
Note: if you are running an older version of Neo4j – pre v2.2 – you will need to use the
legacy end-point at http://localhost:7474/db/data/cypher. Generally this document is
written for v2.2 and later.
Type :play movie graph in the console to get some sample cypher code. This can be 5.
pasted back in the console to generate some data based around actors in the Matrix
movies.
Embed KeyLines in a web page
Once you have access to the KeyLines SDK and have installed your instance of Neo4j, you can
embed a KeyLines chart into your webpage. The below assumes you are using an HTML5
Canvas compatible browser, and only need our JavaScript files.
The HTML code below is 1) loading a webpage, and 2) creating a KeyLines chart object.
<!DOCTYPE html> <html> <head> <!-- Load the KeyLines file -->

<script src="keylines.js" type="text/javascript"></script> <!-- Other libraries we want to use, e.g. jQuery --> <script src="jquery.js" type="text/javascript"></script> </head> <body> <!-- This is the HTML element that will be used to render the KeyLines component --> <div id="chartID" style="width: 400px; height: 300px;" ></div> <!-- This is the actual code to load KeyLines in the page --> <script> // This will store a reference to our KeyLines chart object var myChart; // wait until the fonts are loaded to start $(window).load(function () { // Set the path for the assets KeyLines.setCanvasPaths(‘assets/’); //load the component: specify where (id) and the callback KeyLines.create('chartID', chartReady); }); function chartReady (err, chart) { // Store a reference to the KeyLines chart object myChart = chart; // Prepare the Cypher query var query = getMovieQuery(“The Matrix”); // Send the query to the REST endpoint sendQuery(query, function(json){ var items = makeKeyLinesItems(json); chart.load({type: “LinkChart”, items: items }, layout); }); } function getMovieQuery(name){ var template = ‘MATCH (m:Movie{title: {name}})<-[r:ACTED_IN*]-(a:Person) RETURN *’; // Use the new transaction format return { statements: [{ statement: template, // Be safe and use params to avoid Cypher injections
parameters: {name: name}, // Ask the result in the new “graph format” resultDataContents: ['graph'] }] }; } … more here (see below) … </script> </body> </html>
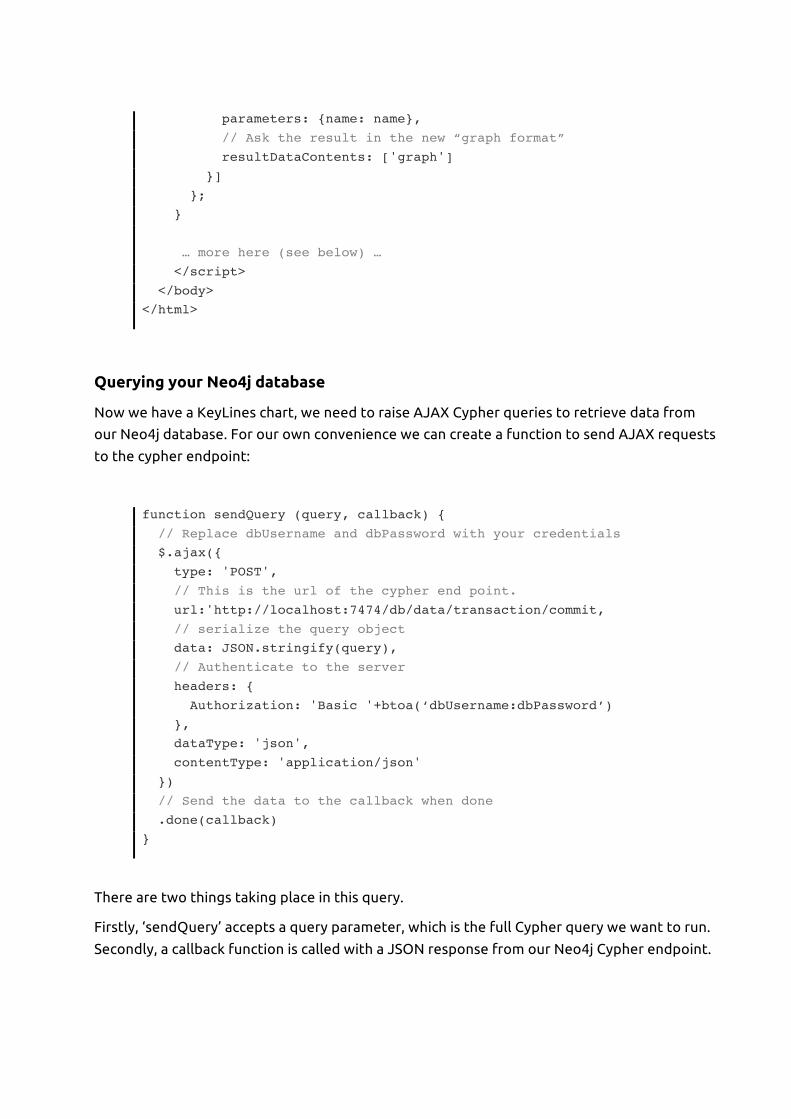
Querying your Neo4j database
Now we have a KeyLines chart, we need to raise AJAX Cypher queries to retrieve data from
our Neo4j database. For our own convenience we can create a function to send AJAX requests
to the cypher endpoint:
function sendQuery (query, callback) { // Replace dbUsername and dbPassword with your credentials $.ajax({ type: 'POST', // This is the url of the cypher end point. url:'http://localhost:7474/db/data/transaction/commit, // serialize the query object data: JSON.stringify(query), // Authenticate to the server headers: { Authorization: 'Basic '+btoa(‘dbUsername:dbPassword’) }, dataType: 'json', contentType: 'application/json' }) // Send the data to the callback when done .done(callback) }
There are two things taking place in this query.
Firstly, ‘sendQuery’ accepts a query parameter, which is the full Cypher query we want to run.
Secondly, a callback function is called with a JSON response from our Neo4j Cypher endpoint.
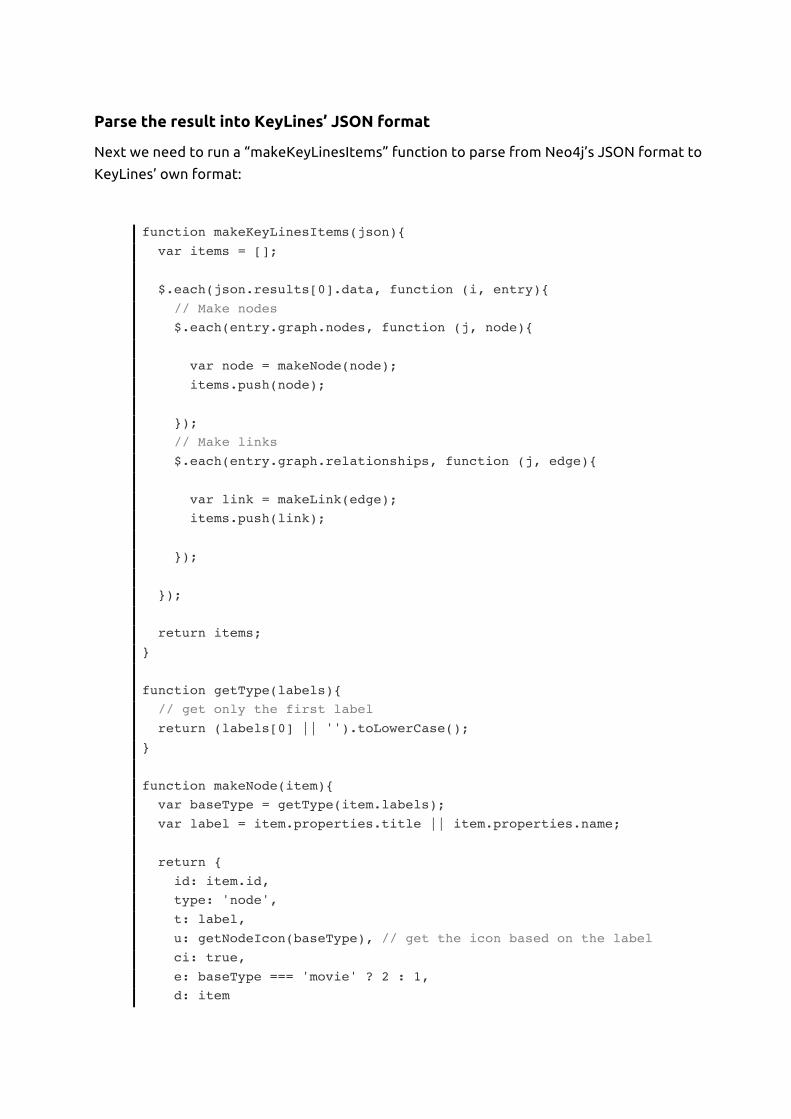
Parse the result into KeyLines’ JSON format
Next we need to run a “makeKeyLinesItems” function to parse from Neo4j’s JSON format to
KeyLines’ own format:
function makeKeyLinesItems(json){ var items = []; $.each(json.results[0].data, function (i, entry){ // Make nodes $.each(entry.graph.nodes, function (j, node){ var node = makeNode(node); items.push(node); }); // Make links $.each(entry.graph.relationships, function (j, edge){ var link = makeLink(edge); items.push(link); }); }); return items; } function getType(labels){ // get only the first label return (labels[0] || '').toLowerCase(); } function makeNode(item){ var baseType = getType(item.labels); var label = item.properties.title || item.properties.name; return { id: item.id, type: 'node', t: label, u: getNodeIcon(baseType), // get the icon based on the label ci: true, e: baseType === 'movie' ? 2 : 1, d: item
}; } function getNodeIcon (type) { // Be sure to have an ‘/images’ to serve the right assets here if (type === ‘movie’) { return ‘images/movie_icon.png’; } return ‘images/actor_icon.png’; } function makeLink(item) { // create a unique id var id = item.id + ‘:’ + item.startNode + ‘-‘ + item.endNode; var labels = item.properties.roles; return { type: 'link', id1: item.startNode, id2: item.endNode, id: id, t: labels ? labels.join(‘ ‘) : ‘’, // Use roles as label fc: 'rgba(52,52,52,0.9)', a2: true, // draw an arrow pointing to the movie c: 'rgb(0,153,255)', w: 2, d: item }; }
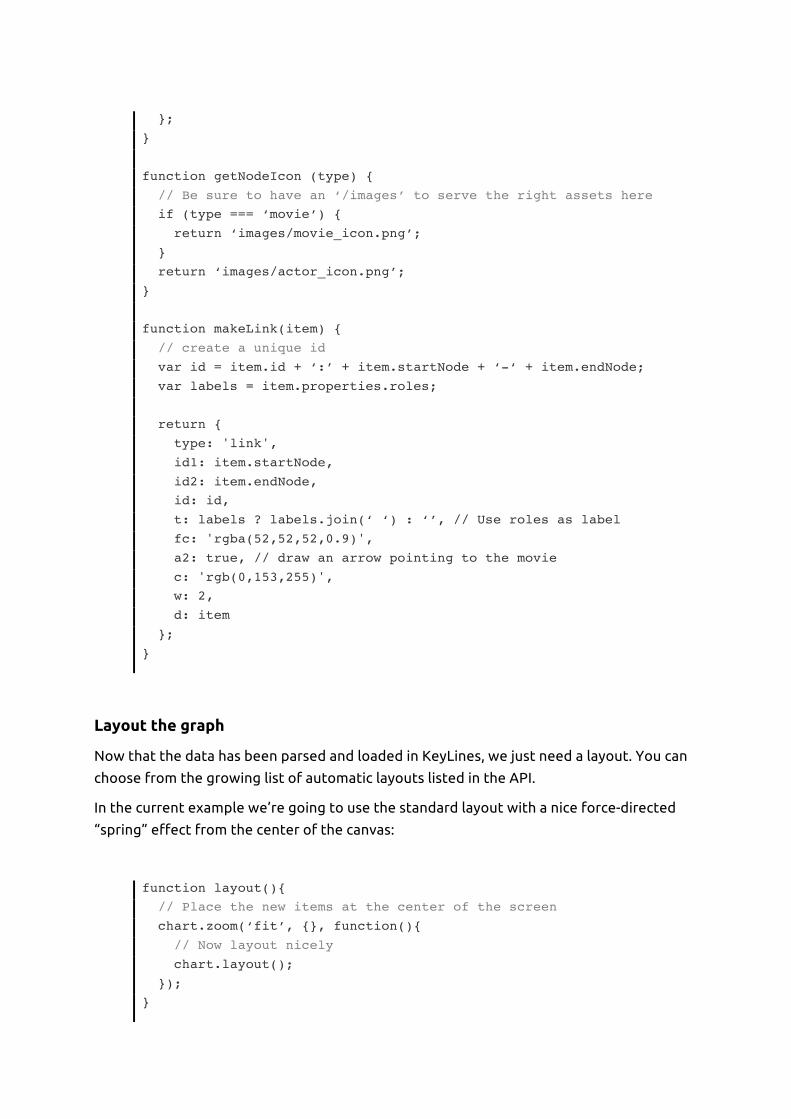
Layout the graph
Now that the data has been parsed and loaded in KeyLines, we just need a layout. You can
choose from the growing list of automatic layouts listed in the API.
In the current example we’re going to use the standard layout with a nice force-directed
“spring” effect from the center of the canvas:
function layout(){ // Place the new items at the center of the screen chart.zoom(‘fit’, {}, function(){ // Now layout nicely chart.layout(); }); }
Customize your chart
The final part of the process is to customize your chart’s appearance, workflow and
functionality.
KeyLines offers a huge range of different ways to customize your final application – far too
many to outline them here! Instead we recommend taking a detailed look through the
KeyLines SDK documentation, especially the API reference and sample demos.
Visualizing Dynamic Graphs
An important part of the richness and complexity of graph data is how it changes through
time. Graphs are almost always dynamic, and the KeyLines time bar component allows you to
understand the temporal element of your data.
More information about integrating the KeyLines time bar with your Neo4j visualization
application can be found in our blog post here: http://keylines.com/network-
visualization/visualize-neo4j-time-graph

Example: A Neo4j / KeyLines demo The KeyLines SDK includes a demo showing how KeyLines can be applied to a Neo4j database. Navigate to Demos > Neo4j.
This demo uses data from a Neo4j database about movies and actors, showing how users’ film reviews can be used as a recommendation
using a graph structure.
All aspects of your application can be altered. Any KeyLines functionality (http://keylines.com/features) can be integrated and all visual
styling can be customized to your requirements.
KeyLines
Chart
Navigation tools
Automatic
layout
options
KeyLines
generated
cypher
query

Our Neo4j demo uses the double-click event to expand any node. KeyLines caches vast
amounts of data in-memory, so these expands do not have to call back to the Neo4j database
each time.
Automated layouts can be easily applied. This example is the Structural layout, which groups
nodes that have similar properties:
The following screenshot shows the network with a radial layout, which shows collections of
nodes arranged in concentric circles:
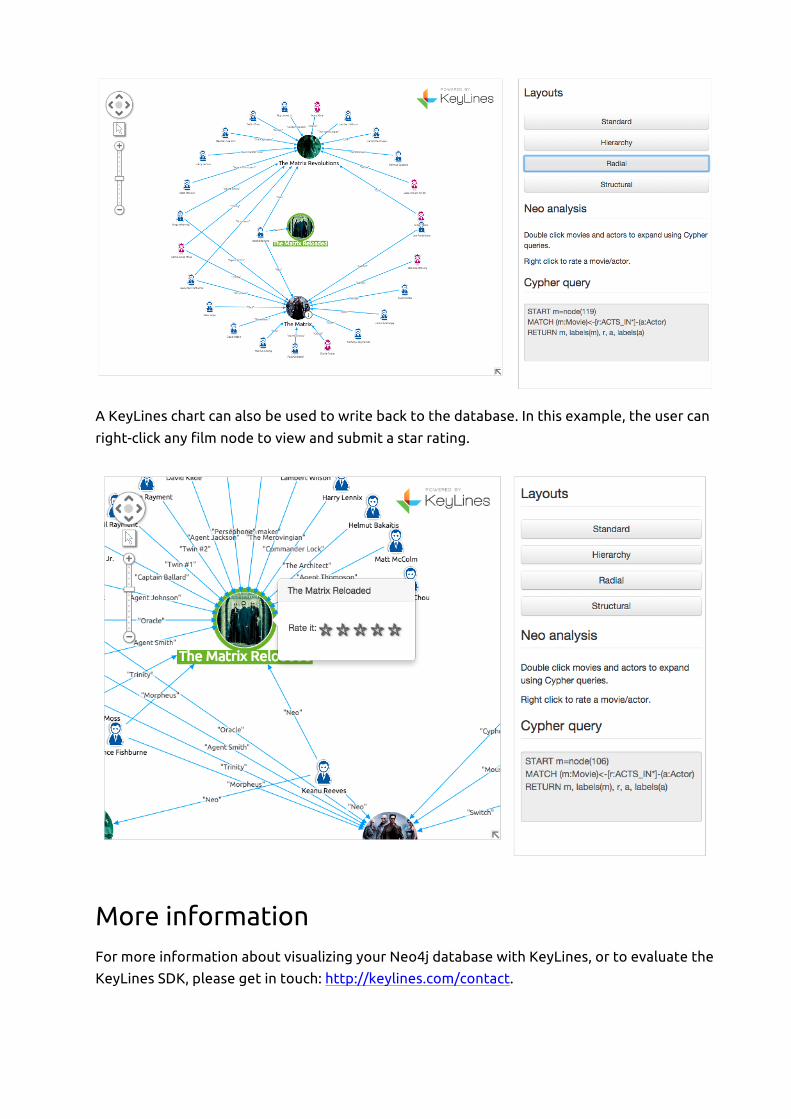
A KeyLines chart can also be used to write back to the database. In this example, the user can
right-click any film node to view and submit a star rating.
More information For more information about visualizing your Neo4j database with KeyLines, or to evaluate the
KeyLines SDK, please get in touch: http://keylines.com/contact.