Globes and Maps SOL WG.1c. Globes Globes are three dimensional representations of the earth.
Upload
jianming-liangCategory
view
81download
2
Visualizing 3D atmospheric data with spherical volume texture onvirtual globes
Jianming Liang a,b, Jianhua Gong a,c, Wenhang Li a,c,n, Abdoul Nasser Ibrahim a,c
a State Key Laboratory of Remote Sensing Science, Institute of Remote Sensing and Digital Earth, Chinese Academy of Sciences,P.O. Box 9718, Beijing 100101, Chinab University of Chinese Academy of Sciences, Beijing 100049, Chinac Zhejiang-CAS Application Center for Geoinformatics, Zhejiang 314100, China
a r t i c l e i n f o
Article history:Received 19 November 2013Received in revised form24 March 2014Accepted 26 March 2014Available online 3 April 2014
Keywords:Volumetric ray-castingVirtual globeAtmospheric volume dataSpherical volume texture
a b s t r a c t
Volumetric ray-casting is a widely used algorithm in volume visualization, but implementing thisalgorithm to render atmospheric volume data that cover a large area on virtual globes constitutes achallenging problem. Because atmospheric data are usually georeferenced to a spherical coordinatesystem described by longitude, latitude and altitude, adaptations to the conventional volumetric ray-casting method are needed to accommodate spherical volume texture sampling. In this paper, wepresent a volumetric ray-casting framework to visualize atmospheric data that cover a broad but thingeographic area (because of the thinness of Earth's atmosphere). Volume texture conforming to thespherical coordinate system of a virtual globe can be created directly from the spherical volume data toavoid oversampling, undersampling or a loss of accuracy due to reprojecting and resampling such datainto a Cartesian coordinate system. Considering the insignificant physical thickness of the atmosphere ofthe Earth, the ray-casting method presented in this paper also allows for real-time vertical scaling(exaggeration of the altitudinal range) without the need to re-process the volume texture, enablingconvenient visual observation of the altitudinal variations. The spherical volume ray-casting method isimplemented in a deferred rendering framework to integrate the volume effects into a virtual globecomposed of a variety of background geospatial data objects, such as terrain, imagery, vector shapes and3D geometric models.
& 2014 Elsevier Ltd. All rights reserved.
1. Introduction
Former US Vice President Al Gore put forth his visionary DigitalEarth (DE) concept in 1998, defined as a computer-networkedvirtual representation of the physical Earth based on georefer-enced heterogeneous data sources (Gore, 1999). Since the Gorespeech, many DE prototypes and commercial applications haveemerged and have continued to evolve over the last decade, evenwell beyond Gore's vision (Goodchild et al., 2012). Pioneering DEsystems such as Google Earth (GE) and NASA WorldWind (WW)have been developed to construct a realistic replica of the planet,complete with global satellite imagery, digital terrain models(DEM), vector data and three-dimensional (3D) cities. As weadvance toward the year 2020, DE systems should become adynamic framework for sharing information globally and improv-ing our collective understanding of the complex relationships
between society and the environment in which we live (Cragliaet al., 2012) because the first principle of DE is unrestrictedaccessibility to DE by all of humankind whether they are indivi-duals, government agencies, non-governmental organizations(NGOs), or for-profit and not-for-profit organizations (Ehlers et al.,2014).
Currently, DE is more focused on information about the Earth'ssurface, from the atmosphere down to the biosphere. In a classicalDE application, global terrain and imagery are the most funda-mental data layers, for which the conventional out-of-core datamanagement and level-of-detail (LOD) rendering schemes, e.g.,P-BDAM (Cignoni et al., 2003), have been sufficiently optimized tosupport real-time exploration of a theoretically unlimited amountof data. However, neither GE nor WW provides any volumerendering functionalities, not to mention a practical mechanismfor the interactive visualization of regional- or planetary-scalevolumetric data, e.g., atmospheric modeling results. Instead, manyGE users in academia rely heavily on Keyhole Markup Language(KML) to visualize, locate and navigate through their own geos-patial data as two-dimensional (2D) overlays or 2.5D polygons(Bailey and Chen, 2011). For example, the progressive dispersion of
Contents lists available at ScienceDirect
journal homepage: www.elsevier.com/locate/cageo
Computers & Geosciences
http://dx.doi.org/10.1016/j.cageo.2014.03.0150098-3004/& 2014 Elsevier Ltd. All rights reserved.
n Corresponding author at: State Key Laboratory of Remote Sensing Science,Institute of Remote Sensing and Digital Earth, Chinese Academy of Sciences,P.O. Box 9718, Beijing 100101, China. Tel./fax: þ86 10 64849299.
E-mail address: [email protected] (W. Li).
Computers & Geosciences 68 (2014) 81–91

volcanic gas was visualized in GE by animating an array of KMLpolygons on a timeline (Wright et al., 2009). Volumetric datascanned by space-borne meteorological radar were represented as2D vertical profiles using KML in GE. Such visualization techniquesonly present a partial view of the original volumetric data and maynot be able to provide a holistic representation that allows viewersto easily understand the data as a whole.
Volumetric visualization has been broadly applied in acade-mia and industry to facilitate visual analytics and simulateparticipating media in applications such as medical imagerendering (Zhang et al., 2011), cloud simulation (Elek et al.,2012), and geoscience data visualization (Patel et al., 2010).There are many open-source volume visualization toolkitsavailable online. For instance, the Visualization Toolkit (VTK)and Voreen are freely available volume rendering engines thatincorporate many sophisticated algorithms. One of the earliestsoftware systems to support fully interactive 3D visualization oftime-varying volumetric weather simulations was Vis5D, whichalso provides an open-source API to enable developers of othersystems to incorporate Vis5D's functionality (Hibbard et al.,1994). The 2004 IEEE Visualization Contest encouraged partici-pants to develop new tools to visualize the various types ofbehavior exhibited by a hurricane volume dataset. The followingapplications were among the three winning entries to thecontest: (1) SimVis (Doleisch et al., 2004) was an interactivevisual analysis software for multi-variate and time-dependent3D simulation data on unstructured grids; (2) AtmosV (Doleischet al., 2004) was an immersive prototype application derivedfrom the Immersive Drilling Planner to visualize large multi-variate atmospheric datasets; (3) the OpenGL application (Gregand Christopher, 2004) used multithreading to maximize theinteractivity of the visualization. Nevertheless, these visualiza-tion toolkits only provide a pure volumetric rendering environ-ment that lacks the ability to integrate various geospatial datasources. In contrast to these general-purpose rendering toolkits,DE offers as one of its major benefits convenient viewer accessto a variety of georeferenced data sources because DE plays therole of a knowledge engine (Krzysztof and Hitzler, 2012) ratherthan a pure rendering engine. Consequently, the implementa-tion of volume visualization in DE must be conducted bearing inmind that such functionalities can easily be integrated with aregular virtual globe, set in an enriched geographic backgroundthat allows users to comprehend the context.
Graphic processing units (GPUs) have largely been used toaccelerate volumetric rendering for interactive applications(Monte, 2013). Volumetric data in video memory are present in aGPU-compatible format, i.e., 3D texture or volume texture, whichis supported in either DirectX or OpenGL to facilitate directvolumetric rendering. In fact, a volume texture is a collection of2D textures in the form of slices. Volumetric ray-casting (Krugerand Westermann, 2003), shear-warp (Lacroute and Levoy, 1994)and splatting (Westover, 1991) are three classic direct volumerendering methods. Because volumes are determined on a pixel-by-pixel basis, ray-casting can generate high-quality imageswithout any blurring or loss of detail (Dye et al., 2007). Volumetricray-casting is perhaps the most researched method due to itssuperior rendering quality, easily understood fundamental princi-ples and convenient GPU-based implementation.
A few attempts have been made to implement GPU-basedvolumetric ray-casting in virtual globe applications (Yang andWu, 2010; Li et al., 2011, 2013). Yang and Wu (2010) createdvolume texture directly from electromagnetic data in a geographiccoordinate system (GCS) (Bugayevskiy and Snyder, 1995) andpresented a volume-ray casting method to visualize them on avirtual globe. Li et al. (2013) reprojected and resampled GCS-basedatmospheric volume data into a Cartesian volume space forvisualization in WW. However, this type of reprojection may leadto oversampling or undersampling of volumetric data whosevoxels were originally described by longitude, latitude and alti-tude. Moreover, volume data in geosciences, such as atmosphericmodeling results, may cover large geographic areas with a verysmall altitudinal range, calling for a ray-casting method thatsupports on-the-fly vertical exaggeration on virtual globes.
We herein present a GPU-based volumetric ray-casting frame-work to accomplish the following:
(1) Direct visualization of GCS-based volumetric data (particularlyatmospheric data in this study) on virtual globes, withoutresorting to data resampling and reprojection techniques, toprovide a more faithful representation of the original datacontents as they were recorded;
(2) Real-time vertical scaling in GCS for more convenient observa-tion of altitudinal variations;
(3) Seamless integration of atmospheric volume data with otherdata contents on virtual globes to provide enriched geographicbackgrounds for interactive volume analysis.
Fig. 1. Geographic setting of Hurricane Isabel.
J. Liang et al. / Computers & Geosciences 68 (2014) 81–9182

2. Data preparation
Hurricane Isabel (Fig. 1) was the strongest and most devastat-ing hurricane that occurred in 2003. Originating near the CapeVerde Islands in the tropical Atlantic Ocean on September 6, thehurricane moved northwestward and strengthened steadily,reaching peak winds of 165 mph (265 km/h) on September 11(PBS&J, 2005).
The Hurricane Isabel dataset (Table 1) used in this study wasprovided by the National Center for Atmospheric Research (NCAR)and the U.S. National Science Foundation (NSF), who generatedsimulation data for Hurricane Isabel using the Weather Researchand Forecasting (WRF) Model.
3. Typical characteristics of atmospheric volume data
Unlike most commonly observed volumetric data, such asmedical images, which are not georeferenced and can conveni-ently be visualized in an isolated environment without resortingto multi-source data integration, atmospheric volumetric datahave the following characteristics:
(1) Atmospheric volumetric data are composed of arrays ofspherical voxels located by longitude, latitude and altitude.Spherical voxels have variable spatial sizes along the paralleland meridian. Because longitude is not a uniform unit ofmeasure, one degree of longitude gradually shortens from111.321 km at the equator to 55.8 km at a latitude of 601 andfinally to zero at the poles.
(2) Atmospheric volume data cover broad geographic areas, in somecases even the entire Earth, but represent a very narrow verticalrange due to the thinness of Earth's atmosphere. For example,Hurricane Isabel had a horizontal extent of approximately2000 km, which was 100 times greater than its vertical extentof 19.8 km. However, there are 100 volume slices in the datasetalong the vertical dimension, so it is necessary to scale up thealtitudinal range to highlight the hurricane's vertical features.
4. The spherical and Cartesian coordinate systems
A typical virtual globe platform makes use of two types ofcoordinate systems to describe 3D objects in different contexts, i.e., Cartesian coordinate systems (CCS) and GCS.
A CCS describes a position in 3D space by a triple set (X, Y, Z)(Fig. 2). The Cartesian origin (0, 0, 0) of a virtual globe usuallycorresponds to the spherical or spheroidal center.
A spherical coordinate system describes a position in 3D spaceby a radius, a polar angle, and an azimuthal angle (Fig. 2). A GCS isa variant of the spherical coordinate system widely used in
geosciences to describe the spatial locations of georeferenced databy longitude, latitude and altitude (Snyder, 1987).
In real-time rendering, 3D geometric primitives, e.g., triangles,have to be represented in Cartesian coordinates because the GPUrendering pipeline does not directly take in spherical coordinates.Nevertheless, GCS is more convenient for describing sphericallocations and for helping human beings to imagine objects onthe Earth. Therefore, many georeferenced data are natively regis-tered to GCS and require on-the-fly transformation into Cartesiancoordinates for rendering in a virtual globe; For example, geor-eferenced satellite images are clamped onto Cartesian triangularmeshes as texture layers.
A recent study (Li et al., 2013) proposed a reprojection of GCS-based atmospheric volume data into a CCS so that each voxel has auniform spatial size, unlike spherical voxels (Fig. 3): first, a CCS-aligned bounding volume is calculated and an average voxel size isdetermined to create a volume texture; second, the original voxelsare transformed into a CCS and resampled into the volume texture,which can then be visualized by implementing the generic volumeray-casting algorithm in a virtual globe application.
However, such a direct implementation of the volume ray-casting algorithm on virtual globes may cause the following data-related problems:
(1) Oversampling or undersampling. Because the spherical voxelshave variable sizes due to the angular unit (Snyder, 1987), auniform voxel resolution needs to be determined to reprojectsuch volume data into a CCS.
(2) Inefficient storage. A larger Cartesian bounding volume (Fig. 4)is needed to fully contain the spherical volume data forreprojection, resulting in many void spaces in the newlycreated volume texture.
(3) Inconvenience in vertical scaling on virtual globes. After anatmospheric volume dataset is reprojected to a CCS, verticalscaling cannot be dynamically applied to zoom in on thealtitudinal variations because the Cartesian voxels no longerconform to the spherical shells of the virtual globe (Fig. 4).
5. Ray-casting method for spherical volume texture on virtualglobe
5.1. Spherical volume texture
In response to the above-mentioned problems related to theimplementation of volume-ray casting on virtual globes, weintroduce the notion of “spherical volume texture” (SVT), whichis a replica of the GCS-based volume data in video memory.
Table 1Summary of the Hurricane Isabel dataset.
Dimensions 500�500�100Latitudinal range 83 W–62 WLongitudinal range 23.7 N–41.7 NAltitudinal range 0.035 km–19.835 kmCartesian distance 2139 km (east–west),
2004 km (north–south),19.8 km (vertical)
Time step 1 hTime span 48 h (1 simulated hour
between time steps)Uncompressed data
size per time step95 MB
Fig. 2. Cartesian and spherical coordinate systems.
J. Liang et al. / Computers & Geosciences 68 (2014) 81–91 83

For example, suppose we want to create a volume texture for asingle time step of the Hurricane Isabel dataset: first, a volumetexture of 512�512�100 is allocated in video memory, with eachvoxel representing a floating-point value; second, the sphericalvolume data are copied to the volume texture on a voxel-by-voxelbasis. Like a generic volume texture, an SVT adheres to a normal-ized texture coordinate system, which means that in all threedimensions, the texture coordinates range from 0 to 1 (Fig. 5).
The spherical bounding volume of an SVT (Fig. 6) is composedof two spherical shells with four walls on the edges, with eachvoxel indexed by its longitude, latitude and altitude. The spatialsize of a voxel cube tends to decrease toward the polar regions.
Next, we introduce the conventional volume ray-casting algo-rithm and discuss how to adapt the algorithm so that an SVT canbe visualized directly on virtual globes.
5.2. The conventional volume ray-casting method
Volume ray-casting is an image-space rendering method thattransforms a volume texture into a 2D image for display. To obtaina screen-space image, a ray is shot from every screen pixel throughthe volume to fetch samples and produce the final color throughcertain transfer functions. Before the actual ray-casting algorithmis executed, the entry and exit positions of each ray have to beobtained. A simple technique for finding the ray-volume intersec-tions involves the following steps:
(1) Find a model-space bounding box for the volume data andtessellate it with triangle primitives for rendering.
(2) Prepare two 2D texture buffers to store the ray entry and exitpositions.
(3) Enable back-face culling and draw the bounding box to renderthe front-face positions to the texture buffer for storing rayentry positions.
(4) Enable front-face culling and draw the bounding box to renderthe back-face positions to the texture buffer for storing ray exitpositions.
Fig. 3. Reprojection of spherical volume data for ray-casting on a virtual globe (Li et al., 2013).
Fig. 4. Cartesian bounding box (green wireframe box) for spherical volume data (red wireframe shape). (For interpretation of the references to color in this figure legend, thereader is referred to the web version of this article.)
Fig. 5. Texture coordinate system of SVT.
J. Liang et al. / Computers & Geosciences 68 (2014) 81–9184

After the ray entry and exit positions have been obtained in theform of two texture buffers, the core ray-casting algorithm can beexecuted in the following steps:
(1) Ray construction. For each pixel of the final image, a ray isconstructed from the entry position toward the exit position.
(2) Texture sampling. From the entry to the exit position of a ray,equidistant texture samples are collected.
(3) Shading and compositing. A color transfer function and a lighttransport model are used to calculate the final color for eachray based on an accumulation of the texture samples. Thefollowing equation describes a classic light transport model:
I ¼Z tmax
0IðtÞe�
R t
0μðsÞdsdt ð1Þ
where tmaxis the path distance from ray entry to exit, I is the finalirradiance, s is the distance increment, t is the upper integrationlimit and μ is the attenuation coefficient.
The conventional ray-casting method does not take intoaccount the spherical curvature or the angular units of a sphericalcoordinate system and does not specify how to integrate with avirtual globe. Next, we will present an SVT-compatible ray-castingframework designed specifically for virtual globes.
5.3. Ray-casting for spherical volume texture
First, we have to find a spherical bounding box that fullycontains the volume space so that we can determine the ray entryand exit positions. Yang and Wu (2010) transformed the eightcorner points of the geographic bounding volume directly toconstruct a Cartesian bounding volume that ignores the curvatureof the Earth. Such a Cartesian bounding volume may result inexcessive void spaces over a large geographic domain, causingunnecessary samplings and calculations along the rays. We pro-pose the use of spherical tessellation to create a bounding volumecomprising two spherical shells and four vertical walls on the east,west, north and south edges (Fig. 7). Because a larger number oftriangle primitives will put more stress on the GPU, this boundingvolume has to be tessellated as simply as possible. We approx-imate a minimum bounding volume through spherical interpola-tion and tessellation (Fig. 7) in the following manner:
(1) We determine the approximate parallel and meridian spacingfor tessellation based on the spatial resolution of the data. Twospherical shells are tessellated with triangle strips based onthe specified parallel and meridian spacing. One spherical shellis set at the minimum altitude, and the other is set at themaximum altitude.
Fig. 6. Geographic coordinate system of SVT.
Fig. 7. Tessellation of the spherical bounding volume.
J. Liang et al. / Computers & Geosciences 68 (2014) 81–91 85

(2) We extrude the four walls from the respective edges of thegeographic extent by an amount equal to the altitudinal range.
We then allocate two separate floating-point texture buffers tostore the ray entry and exit positions. We create a GPU vertexshader and fragment shader to render the spherical boundingvolume. To write the face positions onto the textures, the positionsare passed to the fragment shader as texture coordinates forrasterization. Back-face culling is enabled to obtain the ray entrypositions (Fig. 8a), and front-face culling is enabled to obtain theray exit positions (Fig. 8b). Fig. 8 shows the ray entry and exitpositions in shaded colors:
Because each voxel of an SVT is spatially located by its long-itude, latitude and altitude, we need to convert the Cartesiancoordinates (X, Y, Z) of a sample point on the cast ray intogeographic coordinates using Eq. (2):
rho¼ sqrtðx2þy2þz2Þlongi¼ arctan y
x
� �lati¼ arcsin z
rho
� �alt ¼ rho�r
8>>><>>>:
ð2Þ
where r is Earth's radius, longi is longitude, lati is latitude and alt isaltitude. Because the altitude is obtained in real-time calculations,a vertical scale factor can be applied in transforming the sphericalcoordinates into texture coordinates using Eq. (3):
u¼ ðlongi� longiminÞ=ðlongimax� longiminÞv¼ ðlati� latiminÞ=ðlatimax� latiminÞs¼ ðalt�altminÞ=½ðaltmax�altminÞ � vscale�
8><>: ð3Þ
where u, v and s are the normalized 3D texture coordinates, vscaleis the vertical exaggeration factor, longimax is the maximum long-itude, longimin is the minimum longitude, latimax is the maximumlatitude, latimin is the minimum latitude, altmax is the maximumaltitude and altmin is the minimum altitude.
As vscale changes, the vertices of the spherical boundingvolume need to be re-calculated accordingly to provide correctray-entry and ray-exit positions. Because both the ray-casting andthe texture sampling are performed in real-time, a change in thevariable vscale would be immediately reflected in the verticalcomponent (s) of the 3D texture coordinates (u, v, s). Morespecifically, in the execution stage of the ray-casting algorithmas described in Section 5.2, the 3D texture coordinates required forthe texture sampling are calculated by Eq. (3). Assuming that the
longitudinal range, latitudinal range and altitudinal range areknown variables, what we need to do is transform the sampledray position (X, Y, Z) from the Cartesian space to the sphericalspace using Eq. (2). The resulting spherical position (longi, lati, alti)can then be transformed into the texture address (u, v, s) usingEq. (3) for actual texture sampling.
5.4. Seamless integration to virtual globes
The conventional volume ray-casting algorithm does not providea specific solution for how to merge the data with the virtual globebackground scene. Because multi-source spatial data integration isone of the fundamental functionalities of virtual globes, fittingvolume techniques into the virtual globe-rendering pipeline is vitalto the applicability of the presented volume ray-casting framework.
Deferred rendering (Geldreich et al., 2004; Hargreaves andHarris, 2004) gained considerable popularity in 3D engine devel-opment between 2008 and 2010. In comparison to traditionalforward rendering, which shades each 3D object individually,a typical deferred rendering pipeline renders all 3D objects froma scene into three separate texture buffers, i.e., the position buffer(or depth buffer), the normal buffer and the color buffer, and thenperforms shading at a later stage to yield the final visual (Fig. 9).
Most virtual globe engines, such as WW, still employ a forwardrendering pipeline to render terrain, vector shapes and 3D modelsfor immediate display, without considering possible blending withvolume effects at a later stage. Therefore, we propose to leveragedeferred rendering to seamlessly incorporate volume effects into avirtual globe in a compositing operation. Our deferred renderingpipeline is organized as shown below:
As indicated in the above illustration (Fig. 10), the mainrendering pipeline consists of three render passes:
(1) In the first render pass, all of the virtual globe data objects, suchas terrain, imagery, vector shapes and 3D geometric models, arerendered separately to a position buffer and a color buffer. Theposition buffer records the per-pixel positions, and the colorbuffer records the per-pixel colors. Unlike the regular virtualglobe-rendering pipeline, the rendering results are not presentedfor immediate display but are saved for later compositing.
(2) In the second render pass, the ray entry and exit positions ofthe spherical volume are rendered to two separate textures.
(3) In the final render pass, the spherical volume is rendered usingthe ray-casting method presented herein and fused with the
Fig. 8. Ray entry and exit positions of the volume data.
J. Liang et al. / Computers & Geosciences 68 (2014) 81–9186

virtual globe buffers to produce the final image. The positionand color buffers from the first render pass as well as the rayentry and exit buffers from the second render pass are allbound to a GLSL fragment shader. For each screen pixel, a ray isshot through the spherical volume to accumulate texturesamples. The actual ray entry and exit positions are obtainedby comparing the original ray entry and exit positions againstthe distance of the background pixel from the camera. Thecompositing process is illustrated below in the form of apseudocode snippet:
foreach (pixel on screen){vec3 ray_origin¼getRayOrigin(uv);vec3 ray_entry¼texture2D(tex_ray_entry, uv);
vec3 ray_exit¼texture2D(tex_ray_exit, uv);vec3 globe_pos¼texture2D(tex_globe_pos, uv);vec3 globe_color¼texture2D(tex_globe_color, uv);float origin2globe¼ length(ray_origin - globe_pos );float origin2entry¼ length(ray_origin - ray_entry );float origin2exit¼ length(ray_origin - ray_exit );// depth (distance to ray origin) comparison//case 1: volume is occluded, terminate ray-castingif(origin2globe oorigin2entry){return globe_color;}//case 2: volume is partially occluded, change ray-exit
positionif(origin2globe4origin2entry && origin2globe
oorigin2exit){ray_exit¼globe_pos;}//case 3: volume is not occluded, keep ray-exit position
else { }//volume ray-castingvec3 volume_color ¼cast_ray(SVT, origin2entry,
origin2exit);vec3 final_color¼composit(globe_color, volume_color);return final_color;
}
6. Analysis and discussion
The demonstrations were run on a machine with a 2.90-GHzquad-core Intel Core i52310 CPU and 4 GB of RAM. The graphicscard is an NVIDIA GeForce GTS 450 with 1.0 GB of RAM. Thevolume ray-casting framework presented in this paper was imple-mented using Cþþ , OpenSceneGraph and osgEarth. The core ray-casting algorithm was written in a GLSL fragment shader.
6.1. Rendering of spherical volume data that cover a large geographicarea
To demonstrate that the method presented can effectivelyvisualize a GCS-based atmospheric dataset, we ignored the physi-cal extent of the hurricane and overstretched the original volumetexture to cover a much larger geographic area (Fig. 11).
In the above figure, the images on the left side (Fig. 11a and c)show that the volume texture covers a geographic area from 23N,70E to 41.7N, 140E. The images on the right side (Fig. 11b and d)
Deferred Shading
Color buffer Normal buffer Depth buffer
Fig. 9. Illustration of the deferred rendering pipeline (Koonce, 2004).
Fig. 10. Deferred rendering framework for integrating volumetric ray-casting withvirtual globes.
J. Liang et al. / Computers & Geosciences 68 (2014) 81–91 87

represent an even larger geographic area, from 0N, 0E to 90N,180E. Satisfactory rendering results are obtained for either case,suggesting the applicability of the presented method to therendering of atmospheric volume data on a regional to globalscale (in terms of geographic extent rather than data volume).
Arbitrary vertical scaling is an important feature of the methodbecause most atmospheric datasets are relatively thin in thevertical dimension. The following figure (Fig. 12) illustrates howvertical scaling can magnify altitudinal features to help visualanalytics.
The thickness of the atmosphere is no more than 1% of theEarth's radius. Thus, when rendered on the globe without anyaltitudinal scaling, the Hurricane Isabel dataset appears similar toa sheer 2D image clamped on the Earth (Fig. 12a). Applying an
altitudinal scale factor of 20 (Fig. 12b), we can clearly observe thevertical variations in comparison to no scaling at all (Fig. 12a).
6.2. Performance analyses
Performance testing is necessary to determine the renderingefficiency of the visualization framework as well as to verify theray-casting method presented herein. Experiments should beconducted to evaluate the frames per second (FPS) for acomputation-intensive visualization system under various con-straint conditions (Yang et al., 2011).
Given a constant number of samplings for each ray, therendering performance for the ray-casting method depends onthe number of screen pixels being covered by the volume. A closer
Fig. 11. Rendering of spherical volume data that cover a large geographic area.
Fig. 12. Highlighting vertical variations through scaling.
J. Liang et al. / Computers & Geosciences 68 (2014) 81–9188
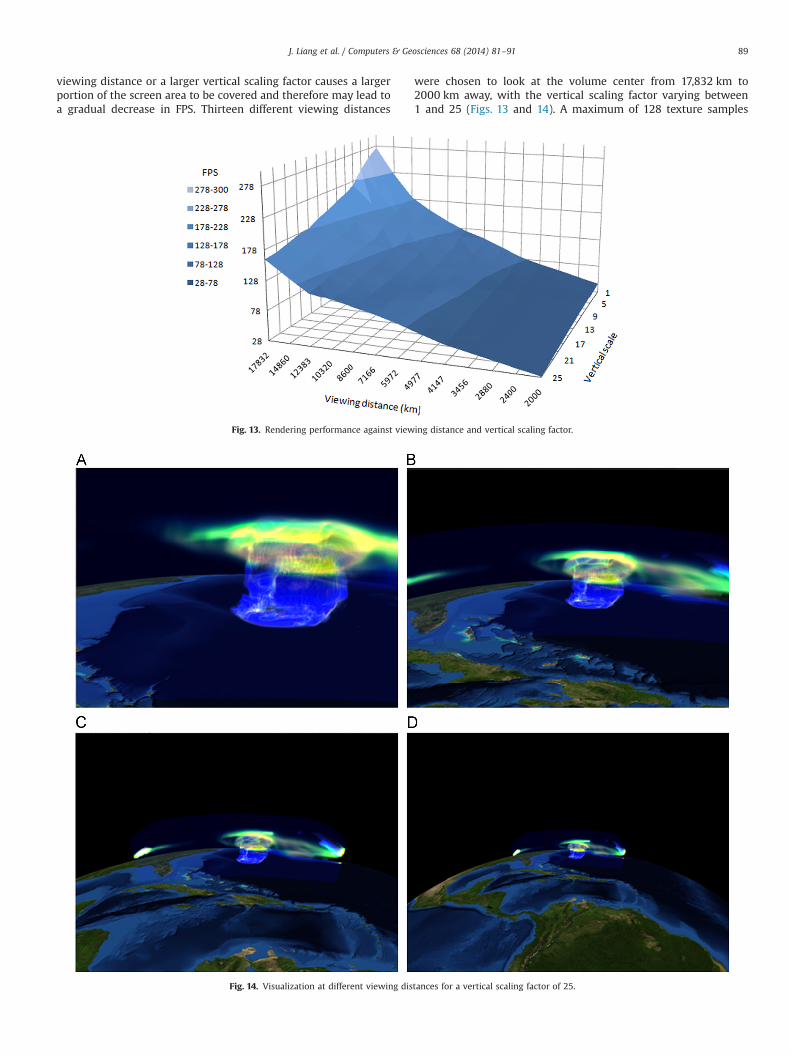
viewing distance or a larger vertical scaling factor causes a largerportion of the screen area to be covered and therefore may lead toa gradual decrease in FPS. Thirteen different viewing distances
were chosen to look at the volume center from 17,832 km to2000 km away, with the vertical scaling factor varying between1 and 25 (Figs. 13 and 14). A maximum of 128 texture samples
Fig. 13. Rendering performance against viewing distance and vertical scaling factor.
Fig. 14. Visualization at different viewing distances for a vertical scaling factor of 25.
J. Liang et al. / Computers & Geosciences 68 (2014) 81–91 89

were collected along each ray to be marched. An experimentunder the above-mentioned constraint conditions was performed,and the FPS was plotted against the viewing distance and thevertical scaling factor, as shown in Fig. 13 below.
The experiment results (Figs. 13 and 14) found that renderingperformance declines quickly with either decreasing viewingdistance or increasing vertical scaling when the viewing distanceis relatively large. As the viewing position draws closer, therendering performance is more sensitive to the viewing distancethan to the vertical scaling factor. Although the rendering perfor-mance was shown to be sufficient to support interactive explora-tion as suggested by the FPS (Fig. 13) under the given constraintconditions, it can be highly variable depending on the viewingdistance and the vertical scaling factor.
6.3. Integration with multi-source data on a virtual globe
Integration with a variety of spatial data sources on virtualglobes is a key feature of the presented volume ray-castingframework compared to the standard ray-casting method. Todemonstrate this feature, we created a virtual globe scene com-posed of various spatial objects, e.g., geographic graticules, 3Dmodels, 2D polygons and text labels.
Fig. 15 shows that the volume visualization of Hurricane Isabelis correctly fused with the geographic background on the virtualglobe. The depth comparison in our ray-casting algorithm (Section5.4) can help to achieve correct occlusion effects for the volumeand other 3D objects. The alpha compositing produces a translu-cent effect so that we can still see the 3D objects behind thehurricane volume.
7. Conclusions
The increasing availability of volumetric data in geoscienceshas created a demand for DE to provide integrated volumevisualization capabilities. However, mainstream DE systems suchas GE, WW and osgEarth lack the necessary functionalities tovisualize large-scale volume data. In response to such needs, wepresent a volume ray-casting framework that has been demon-strated to be suitable for integration into the open-source virtualglobe osgEarth system without requiring any modifications to therendering engine.
The applicability of the volume-ray casting framework pre-sented in this paper has been tested using the Hurricane Isabeldataset, and the following conclusions have been drawn:
(1) The volume ray-casting method can directly visualize atmo-spheric volume data on a large geographic area.
(2) The volume ray-casting method can provide on-the-fly altitu-dinal scaling.
(3) The deferred rendering pipeline can blend the volume effectswith a virtual globe.
However, the presented method is still subject to manydeficiencies that should be addressed in future work. Alphablending involving multiple translucent 3D objects is difficult toachieve with deferred shading because the position and colorbuffers rendered from a virtual globe only provide the final resultswithout recording the intermediate values. Furthermore, volumeray-casting is a costly rendering algorithm, the computationintensity of which increases with the projected screen area. Thus,a closer viewing distance or a larger vertical scaling factor maylead to a sharp drop in frame rates. In the future, other volumerendering methods should be tested and compared with volumeray-casting on virtual globes. Moreover, although the HurricaneIsabel data can easily fit into video memory in the case presented,a massive amount of volume data would still warrant furtherstudies of out-of-core rendering techniques (Yang et al., 2011).
Acknowledgments
This research was supported by the Key Knowledge InnovativeProject of the Chinese Academy of Sciences (KZCX2 EW 318), theNational Key Technology R&D Program of China (2014ZX10003002),the National Natural Science Foundation of China (41371387), theNational Natural Science Foundation of China (41201396), JiashanScience and Technology Projects (2011A44) and the DRAGON 3(Project ID 10668).
References
Bailey, J., Chen, A., 2011. The role of virtual globes in geosciences. Comput. Geosci.37 (1), 1–2.
Bugayevskiy, L., Snyder, J., 1995. Map Projections: A Reference Manual. Taylor & Francis,London p. 352.
Fig. 15. Fusion with multi-source data in the virtual globe.
J. Liang et al. / Computers & Geosciences 68 (2014) 81–9190

Cignoni, P., et al., 2003. Planet-Sized Batched Dynamic Adaptive Meshes (P-BDAM).In: Proceedings of the 14th IEEE Visualization 2003 (VIS'03), Washington, DC,USA, pp. 147–155.
Craglia, M., et al., 2012. Digital Earth 2020: towards the vision for the next decade.Int. J. Digit. Earth 5 (1), 4–21.
Doleisch, H., et al., 2004. Interactive visual analysis of hurricane isabel with SimVis.IEEE Vis. Contest, 2004.
Dye, M., et al., 2007. Volumetric Visualization Methods for Atmospheric Model Datein an Immersive Virtual Environment. In: Proceedings of High PerformanceComputing Systems (HPCS ’07), Prague, Czech.
Ehlers, M., et al., 2014. Advancing digital earth: beyond the next generation. Int. J.Digit. Earth 7 (1), 3–16.
Elek, O., et al., 2012. Interactive cloud rendering using temporally coherent photonmapping. Comput. Gr. 36 (8), 1109–1118.
Goodchild, M., et al., 2012. Next generation digital earth. Proc. Natl. Acad. Sci. 109(28), 11088–11094.
Gore, A., 1999. The digital earth: understanding our planet in the 21st century.Photogramm. Eng. Remote Sens. 65 (5), 528.
Greg, P., Christopher, A., 2004. OpenGL visualization of hurricane Isabel. IEEE Vis.Contest, 2004.
Hargreaves, S., Harris, M., 2004. Deferred rendering. NVIDIA Corporation. 44 pp.Hibbard, W., et al., 1994. Interactive visualization of earth and space science
computations. Computer 27 (7), 65–72.Koonce, R., 2004. Deferred Shading in Tabula Rasa. In: GPU Gems 3, pp. 429–457.Kruger, J., Westermann, R., 2003. Acceleration techniques for GPU-based volume
rendering. In: Proceedings of the 14th IEEE Visualization 2003 (VIS’03),Washington, DC, USA, pp. 287–292.
Krzysztof, J., Hitzler, P., 2012. The digital earth as knowledge engine. Semant. Web3 (3), 213–221.
Li, J., et al., 2011. Visualizing dynamic geosciences phenomena using an octree-based view-dependent LOD strategy within virtual globes. Comput. Geosci.37 (9), 1295–1302.
Li, J., et al., 2013. Visualizing 3D/4D environmental data using many-core graphicsprocessing units (GPUs) and multi-core central processing units (CPUs).Comput. Geosci. 59, 78–89.
Monte, C., 2013. Estimation of volume rendering efficiency with GPU. Proced.Comput. Sci. 18, 1402–1411.
Patel, D., et al., 2010. Seismic volume visualization for horizon extraction. In: IEEEPacific Visualization Symposium (PacificVis), 2010, Taipei, pp. 73–80.
Lacroute, P., Levoy, M., 1994. Fast Volume Rendering Using a Shear-Warp Factoriza-tion of the Viewing Transformation. In: Proceedings of SIGGRAPH ’94, Orlando,Florida, July, pp. 451–458.
Post, Buckley, Schuh and Jernigan, Inc. (PBS&J), 2005. Hurricane Isabel assessment,a Review of Hurricane Evacuation Study Products and Other Aspects of theNational Hurricane Mitigation and Preparedness Program (NHMPP) in theContext of the Hurricane Isabel Response. NOAA, 301 pp.
Geldreich, R., et al., 2004. Deferred lighting and shading. Presentation at GameDevelopers Conference 2004, 21 pp.
Snyder, J., 1987. Map projections: a working manual. Professional paper. UnitedStates Geological Survey, 383 pp.
Westover, L., 1991. Splatting: A Parallel, Feed-Forward Volume Rendering Algo-rithm (Ph.D. dissertation). University of North Carolina at Chapel Hill, NC, USAp. 103.
Wright, T., et al., 2009. Visualising volcanic gas plumes with virtual globes. Comput.Geosci. 35 (9), 1837–1842.
Yang, C., Wu, L., 2010. GPU-based volume rendering for 3D electromagneticenvironment on virtual globe. Int. J. Image, Gr. Signal Process. 2 (1), 53–60.
Yang, C., et al., 2011. Using spatial principles to optimize distributed computing forenabling the physical science discoveries. Proc. Natl. Acad. Sci. 108 (14),5498–5503.
Zhang, Q., et al., 2011. Volume visualization: a technical overview with a focus onmedical applications. J. Digit. Imaging 24 (4), 640–664.
J. Liang et al. / Computers & Geosciences 68 (2014) 81–91 91